Quality Assurance Project Plan Groundwater Monitoring Well Installation 2020-2021: Washington State Department of Ecology and the National ...
←
→
Page content transcription
If your browser does not render page correctly, please read the page content below
Quality Assurance Project Plan

Groundwater Monitoring Well Installation
2020-2021: Washington State Department
of Ecology and the National Groundwater
Monitoring Network

March 2021

Publication 21-03-104
Publication information
Each study conducted by the Washington State Department of Ecology must have an approved Quality
Assurance Project Plan (QAPP). The plan describes the objectives of the study and the procedures to be
followed to achieve those objectives. After completing the study, Ecology will post the final report of the
study to the Internet.
This Quality Assurance Project Plan is available on Ecology’s website at
https://apps.ecology.wa.gov/publications/SummaryPages/2103104.html
This plan was prepared by a licensed hydrogeologist. A signed and stamped copy of the report is available
upon request.
Data for this project are available in Ecology’s EIM Database. Study ID: NGWMN.
The Activity Tracker Code for this study is 17-026.
This QAPP was written using QAPP Template Version 1.0. Revision date: 8/27/2018.

Contact information
Publications Coordinator
Environmental Assessment Program
P.O. Box 47600, Olympia, WA 98504-7600
Phone: (360) 407-6764
Washington State Department of Ecology – https://ecology.wa.gov
• Headquarters, Olympia                       360-407-6000
• Northwest Regional Office, Bellevue         425-649-7000
• Southwest Regional Office, Olympia          360-407-6300
• Central Regional Office, Union Gap          509-575-2490
• Eastern Regional Office, Spokane            509-329-3400

Any use of product or firm names in this publication is for descriptive purposes only and
does not imply endorsement by the author or the Department of Ecology.
To request ADA accommodation for disabilities or printed materials in a format for the visually impaired,
call the Ecology ADA Coordinator at 360-407-6831 or visit https://ecology.wa.gov/accessibility. People
with impaired hearing may call Washington Relay Service at 711. People with speech disability may call
TTY at 877-833-6341.
Quality Assurance Project Plan

       Groundwater Monitoring Well Installation
  2020-2021: Washington Department of Ecology and
    the National Groundwater Monitoring Network
                                                   March 2021
                                              by Eugene Freeman

Approved by:
Signature:                                                                Date:
Eugene Freeman, Author/Project Manager, EAP

Signature:                                                                Date:
Pam Marti, Author/Project Managers Unit Supervisor, EAP

Signature:                                                                Date:
Jessica Archer, Project Managers Section Manager, EAP

Signature:                                                                Date:
Stacy Polkowske, Section Manager for Project Study Area, EAP

Signature:                                                                Date:
Alan Rue, Director, Manchester Environmental Laboratory

Signature:                                                                Date:
Arati Kaza, Ecology Quality Assurance Officer

Signatures are not available on the Internet version.
EAP: Environmental Assessment Program

                QAPP: GW Monitoring Well Installation 2020-2021: Ecology and NGMN
                                             Page 1
1.0 Table of Contents
Page
2.0 Abstract ...................................................................................................................5
3.0 Background ............................................................................................................5
3.1 Introduction and problem statement ............................................................5
3.2 Study area and surroundings ........................................................................6
3.2.1 History of study area .......................................................................9
3.2.2 Summary of previous studies and existing data ............................10
3.2.3 Parameters of interest and potential sources .................................11
3.2.4 Regulatory criteria or standards ....................................................12
4.0 Project Description ..............................................................................................12
4.1 Project goals ...............................................................................................12
4.2 Project objectives .......................................................................................12
4.3 Information needed and sources ................................................................13
4.4 Tasks required ............................................................................................13
4.5 Systematic planning process ......................................................................14
5.0 Organization and Schedule .................................................................................14
5.1 Key individuals and their responsibilities ..................................................14
5.2 Special training and certifications ..............................................................15
5.3 Organization chart ......................................................................................15
5.4 Proposed project schedule..........................................................................15
5.5 Budget and funding ....................................................................................16
6.0 Quality Objectives ................................................................................................17
6.1 Data quality objectives ..............................................................................17
6.2 Measurement quality objectives ................................................................17
6.2.1 Targets for precision, bias, and sensitivity ....................................17
6.2.2 Targets for comparability, representativeness, and completeness 19
6.3 Acceptance criteria for quality of existing data .........................................19
6.4 Model quality objectives ............................................................................20
7.0 Study Design .........................................................................................................20
7.1 Study boundaries ........................................................................................20
7.2 Field data collection ...................................................................................20
7.2.1 Sampling locations and frequency .................................................22
7.2.2 Field parameters and laboratory analytes to be measured..............22
7.3 Modeling and analysis design ....................................................................22
7.4 Assumptions underlying design .................................................................22
7.5 Possible challenges and contingencies.......................................................23
7.5.1 Logistical problems ........................................................................23
7.5.2 Practical constraints........................................................................23
7.5.3 Schedule limitations .......................................................................23
8.0 Field Procedures...................................................................................................24
8.1 Invasive species evaluation ........................................................................24
8.2 Measurement and sampling procedures .....................................................24
8.3 Containers, preservation methods, holding times ......................................25
QAPP: GW Monitoring Well Installation 2020-2021: Ecology and NGMN
Page 28.4 Equipment decontamination ......................................................................25
8.5 Sample ID ..................................................................................................25
8.6 Chain of custody ........................................................................................25
8.7 Field log requirements ...............................................................................26
8.8 Other activities ...........................................................................................26
9.0 Laboratory Procedures .......................................................................................27
9.1 Lab procedures table ..................................................................................27
9.2 Sample preparation method(s) ...................................................................27
9.3 Special method requirements .....................................................................27
9.4 Laboratories accredited for methods ..........................................................27
10.0 Quality Control Procedures ................................................................................27
10.1 Table of field and laboratory quality control .............................................28
10.2 Corrective action processes........................................................................28
11.0 Data Management Procedures............................................................................29
11.1 Data recording and reporting requirements ...............................................29
11.2 Laboratory data package requirements ......................................................29
11.3 Electronic transfer requirements ................................................................29
11.4 EIM/STORET data upload procedures ......................................................29
11.5 Model information management ................................................................29
12.0 Audits and Reports ..............................................................................................30
12.1 Field, laboratory, and other audits .............................................................30
12.2 Responsible personnel ...............................................................................30
12.3 Frequency and distribution of reports ........................................................30
12.4 Responsibility for reports ...........................................................................30
13.0 Data Verification ..................................................................................................31
13.1 Field data verification, requirements, and responsibilities ........................31
13.2 Laboratory data verification.......................................................................31
13.3 Validation requirements, if necessary ........................................................31
13.4 Model quality assessment ..........................................................................31
14.0 Data Quality (Usability) Assessment ..................................................................32
14.1 Process for determining project objectives were met ................................32
14.2 Treatment of non-detects ...........................................................................32
14.3 Data analysis and presentation methods ....................................................32
14.4 Sampling design evaluation .......................................................................32
14.5 Documentation of assessment ....................................................................32
15.0 References .............................................................................................................33
16.0 Appendix. Glossaries, Acronyms, and Abbreviations ......................................35
QAPP: GW Monitoring Well Installation 2020-2021: Ecology and NGMN
Page 3List of Figures and Tables
Page
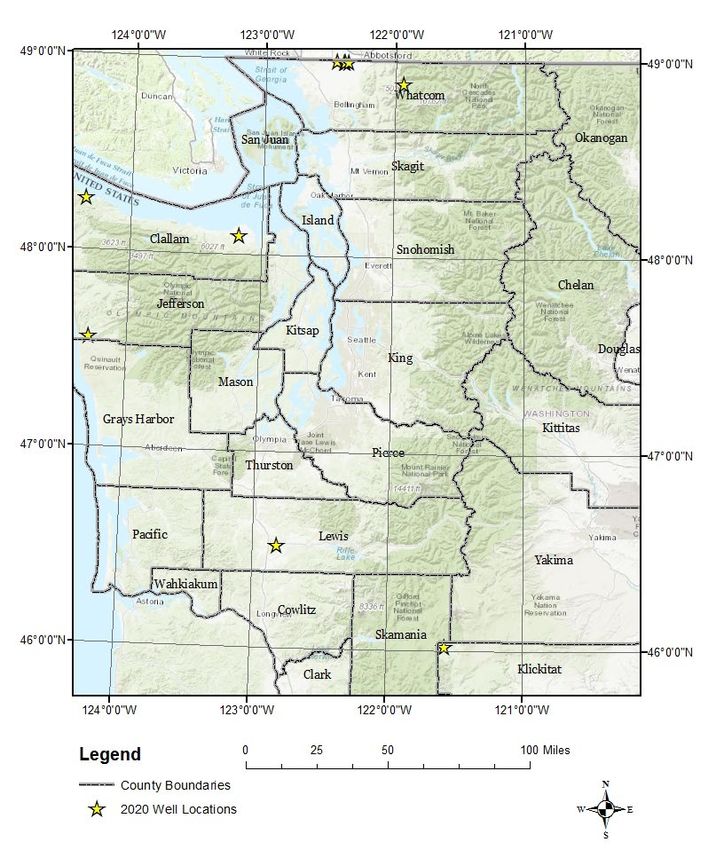
Figure 1. Map of larger study area. ......................................................................................8
Figure 2. The six North Whatcom wells from which nitrate will be sampled. ...................9
Figure 3. As-built for flush mount groundwater monitoring well design completion. ......21
Figure 4. As-built for above-ground groundwater monitoring well design completion. ...21
Table 1. Previous groundwater nitrate studies in the Sumas-Blaine aquifer (SBA). .........11
Table 2. Organization of project staff and responsibilities. ...............................................14
Table 3. Proposed schedule for completing well construction and progress report. .........15
Table 4. Proposed schedule for completing water-level monitoring. ................................15
Table 5. Proposed schedule for completing field and laboratory work, data entry into
EIM, and reports. ...............................................................................................16
Table 6. NGWMN project budget and funding. ................................................................16
Table 7. Laboratory budget for Whatcom County wells. ..................................................16
Table 8. Measurement quality objectives (MQOs). ...........................................................18
Table 9. MQOs for field parameters expressed as acceptance criteria for field
instrument post and intermediate checks (SOP EAP033). .................................18
Table 10. Field measurement methods ..............................................................................24
Table 11. Sample containers, preservation, and holding times..........................................25
Table 12. Laboratory measurement methods. ....................................................................27
Table 13. Laboratory quality control samples, types, and frequency. ...............................28
QAPP: GW Monitoring Well Installation 2020-2021: Ecology and NGMN
Page 42.0 Abstract
The Washington State Department of Ecology (Ecology) entered into a cooperative agreement
with the United States Geological Survey (USGS) to become a data provider to the National
Groundwater Monitoring Network (NGWMN). The NGWMN uses existing federal, state, and
local groundwater monitoring programs to establish a national groundwater quantity and quality
database. Data are accessible through the NGWMN Data Portal. The NGWMN public portal can
be accessed at https://cida.usgs.gov/ngwmn/ .
To address concerns about water supply and water quality, long-term groundwater level
monitoring and water quality monitoring can be used to assess developing trends in the water
resource. With regards to groundwater withdrawals, a downward trending water level indicates
depletion of the groundwater reservoir. Since shallow groundwater and surface water are
typically hydraulically coupled, a decline in groundwater levels would equate to a reduction in
available surface water. Degradation of water quality can also affect water supply such that the
water does not meet safe drink water standards for human consumption.
In 2018, Ecology was granted funding from the U.S. Geological Survey (USGS) to install 13
long-term groundwater monitoring wells in select areas of Western Washington that lack
groundwater monitoring coverage. This will enhance Ecology’s existing groundwater monitoring
and assessment capabilities. The wells will be used for measuring water levels and groundwater
quality.
The objective of this study is to install 13 dedicated, long-term groundwater monitoring wells.
All 13 wells will be used to monitor water levels; six of these wells will also be used to measure
water quality parameters. Data from these wells are intended to provide seasonal and long-term
trends that will be used to identify evolving water supply issues and assist water managers in
preserving available water resources.
3.0 Background
3.1 Introduction and problem statement
In 2016, the Washington State Department of Ecology (Ecology) entered into a cooperative
agreement with the United States Geological Survey (USGS) to become a data provider to the
National Groundwater Monitoring Network (NGWMN). The goal of the NGWMN is to establish
a national long-term groundwater quantity and quality monitoring network of principal aquifers
by using existing federal, state, and local groundwater monitoring programs. The NGWMN
provides access to the data over a network interface called the Data Portal. The charter, program
elements, and data requirements are described in “A National Framework for Ground-Water
Monitoring in the United States” (USGS, 2013).
Ecology became a data provider because it routinely collects groundwater level measurements
from a series of well networks across the state that are used to support water management
decisions and planning related to groundwater level status and trends. Ecology’s Water
Resources Program manages the water level monitoring networks. The well monitoring data that
Ecology collects are managed through its Environmental Information Management database (EIM).
QAPP: GW Monitoring Well Installation 2020-2021: Ecology and NGMN
Page 5Data from a small subset of the Water Resources monitoring wells are linked to the NGWMN Data
Portal.
In 2018, Ecology received funding from the USGS to install 13 long-term groundwater
monitoring wells in selected areas of Western Washington in order to measure water levels and
groundwater quality. The wells will be placed in areas that lack groundwater monitoring
coverage; this will enhance Ecology’s existing groundwater monitoring and assessment
capabilities.
Seven of the new wells will be used to monitor water levels under natural variability of aquifer
recharge and discharge. The wells will be measured at a frequency that will provide data on
seasonal and long-term trends. Four of the wells will be placed in USGS climate zones that do
not have a representative groundwater monitoring well.
The remaining six wells will be placed in Whatcom County, adjacent to the U.S.-Canadian
border, to supplement Ecology’s long-term nitrate monitoring effort in the Sumas-Blaine Aquifer
(SBA). Groundwater nitrate has been studied in the SBA by State and Federal agencies for more
than 20 years (Erickson, 1998; Cox and Kahle, 1999). However, the wells sampled in this area
are private domestic water supply wells and are not necessarily available for follow up sampling.
The six water quality wells proposed for this project are intended to serve as a dedicated
monitoring well network that would provide a continuous record for seasonal and long-term
trend assessment.
3.2 Study area and surroundings
Ecology plans to install 13 monitoring wells in three geographic areas of Western Washington:
• Seven in Northwest Washington (Whatcom County)
• Three on the Olympic Peninsula
• Three in Southwest Washington
Proposed well locations are shown in Figure 1.
Northwest Washington wells
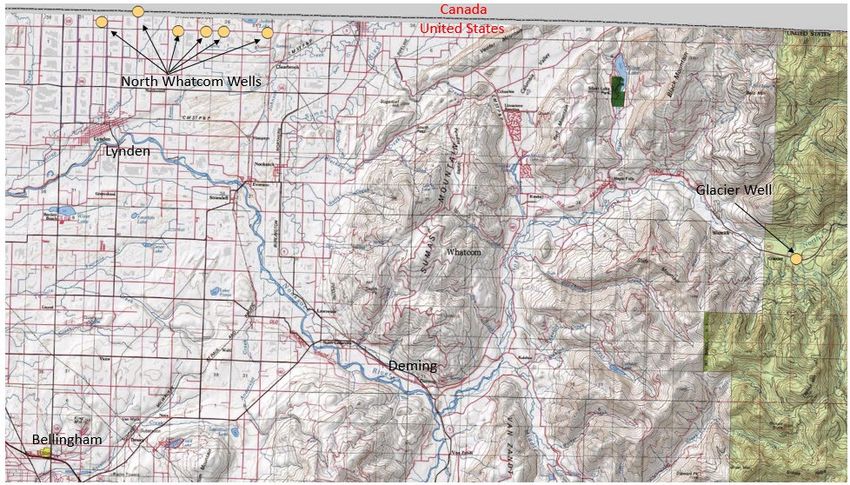
The seven Northwest Washington wells are located in Whatcom County (Figure 2).
Six of the wells are in north central Whatcom County in the Puget Lowlands physiographic
province, west of the Cascade Mountain Range. The land use near the wells is predominantly
irrigated agriculture consisting of raspberries, blue berries, hay, and corn. All six wells are a
distance of 3,000 feet or less from the Canadian border to the north. Precipitation for this area is
35 to 60 inches annually. Precipitation falls mainly during October through March.
These six Whatcom County wells are located in the regional SBA. The hydrogeology of this
aquifer is summarized in Cox and Kahle (1999). Wells are to be completed in the upper
unconfined aquifer called the Sumas Aquifer which consists of a glacial outwash deposit. Soil
texture of the upper unconfined aquifer is silt loam to gravelly loam. Based on driller’s logs, the
depth to water in the aquifer ranges from 8 feet to 40 feet below ground surface.
The seventh Whatcom County well is located east of the town of Glacier, along the west front of
the Cascade Mountain Range, within the North Cascade physiographic province. Land use in this
QAPP: GW Monitoring Well Installation 2020-2021: Ecology and NGMN
Page 6area is forest and some residential development. Average annual precipitation for this area is 60
inches. Precipitation falls mainly during October through March.
The geology in this area consists of Tertiary intrusive volcanic rocks, mass wasting deposits, and
alluvial deposits. The geologic material in the area near the town of Glacier is identified as mass
wasting deposits and some alluvial deposits from the nearby North Fork Nooksack River. Soil
texture in nearby wells is primarily clay and gravel with some sand. Groundwater flow direction
is expected to be to the southwest, toward Glacier Creek which is a distance of 600 feet from the
well site.
Olympic Peninsula wells
Three monitoring wells are located on the Olympic Peninsula near the towns of Sequim, Sekiu,
and Clearwater. The wells are in the Olympic Mountains physiographic province.
Land use near Sequim is scattered residential lots and agriculture. The Sekiu location is at the
Hoko River State Park, which is a former ranch that is leased for grazing, with surrounding forest
areas. The Clearwater location is also used for grazing and is surrounded by forest.
Average annual precipitation levels are: near Sequim 16 inches, near Sekiu 98 inches, and near
Clearwater about 116 inches. The significantly lower precipitation near Sequim is due to the rain
shadow effect on this area by the Olympic Mountains to the west. Most of the precipitation falls
during October through April.
For all three sites, the geologic material consists of quaternary alluvial deposits embedded within
tertiary sedimentary rocks, and soil texture is predominantly silt and clay with sand stringers.
Depth to groundwater is based on driller’s logs archived in Ecology’s well logs database. Well
logs report that water level is about 35 feet at the Sequim site, 12 feet at the Sekiu site, and 10
feet at the Clearwater site.
Groundwater flow directions are: at the Sequim site, to the southeast toward the Dungeness
River; at the Sekiu site, to the west in the direction of the Hoko River; and at the Clearwater site,
to the west toward the Clearwater River.
Southwest Washington wells
Three groundwater monitoring wells will be installed in southwestern Washington: one at the
South Lewis County Airport, one north of the town of Trout Lake in Klickitat County, and one in
Clark County. The wells are located in the South Cascade Mountains physiographic province.
The Lewis County site is in an area of scattered development and farmland, and the Trout Lake
site is in forest and marshes. A suitable location for a Clark County well is yet to be identified.
Average annual precipitation at the Lewis County location is about 58 inches and at the Trout
Lake location is about 38 inches. Most of the precipitation falls during October through April.
The geology of the Lewis County site is quaternary glacial drift deposits. At Trout Lake the
geology is quaternary alluvium overlying quaternary volcanic rocks. Based on Ecology’s
archived driller’s logs, the soil at the Lewis County site is clay and sandy clay over a sand and
gravel layer. At the Trout Lake site, the soil is slate, clay, sandstone over a washed gravel. At the
Lewis County site, groundwater level is at a depth of between 20 to 35 feet and groundwater
flow direction is to the south, toward the Cowlitz River. At the Trout Lake site, water-level is at
QAPP: GW Monitoring Well Installation 2020-2021: Ecology and NGMN
Page 7a depth of between 15 to 30 feet and groundwater flow direction is to the east, toward Trout Lake
Creek.
Figure 1. Map of larger study area.
QAPP: GW Monitoring Well Installation 2020-2021: Ecology and NGMN
Page 8Figure 2. The six North Whatcom wells from which nitrate will be sampled.
3.2.1 History of study area
Northwest Washington wells
The area around the North Whatcom County wells primarily consists of intensive agriculture.
Crop types in the area include raspberries, blueberries, hay, and corn. Concerns about nitrate
contamination to groundwater have been ongoing for the past 20 years (Erickson, 1998; Cox and
Kahle, 1999; Carey, 2017). Throughout these 20 years the groundwater monitoring activities
have been dependent on access to private domestic water supply wells. Access to these wells has
been intermittent and, therefore, the ability to maintain a continuous record of water quality
throughout the aquifer has been difficult. The purpose for these wells is to provide the
beginnings of a dedicated, long-term monitoring network for assessment of water quality and
water-level trends in the Sumas-Blaine Aquifer.
The area near the Glacier well is primarily forest and some residential development. The purpose
for this well is to provide a dedicated water-level monitoring station in an area that is not
currently covered by Ecology’s existing well network.
Olympic Peninsula wells
There are many wells in the Washington State groundwater monitoring network in the area near
the cities of Sequim and Port Angeles. Most of these wells provide domestic or municipal water
supply. This area is undergoing urban development; therefore, water withdrawals from domestic
wells are increasing. In recent years, the area has exhibited trending water-level declines. A
dedicated groundwater monitoring well was installed at the unincorporated community of
Carlsborg in 2007. This well is completed in a lower aquifer of a three-aquifer stratified
QAPP: GW Monitoring Well Installation 2020-2021: Ecology and NGMN
Page 9sequence. The objective of this current project is to complete the well in the upper of the three
aquifers. This will provide a comparison of water-level changes occurring within the upper and
lower aquifers.
The Sekiu and Clearwater wells are located in fields that are used to produce hay and are
occasionally used for cattle grazing. The area around these two sites is primarily forested. There
are no groundwater monitoring wells near either of these areas. Therefore, the purpose of these
wells is to provide dedicated, long-term monitoring at these two locations on the Olympic
Peninsula.
Southwest Washington wells
The Lewis County well is located at the South Lewis County Airport. Land use for the area
surrounding the airport primarily consists of hay fields with some limited development. There
have been no groundwater monitoring wells currently or in the past in this area. The purpose of
this well is to provide a dedicated, long-term monitoring well in Southwest Washington that is in
an area that is not subject to significant groundwater withdrawals.
The Trout Lake well is located in south-central Washington (Klickitat County) at a natural area
preserve. The topographic location is identified as marshes. The ground can be saturated in some
areas during the spring but dries out in the summer. The area surrounding the site is forest. There
are no current or past groundwater monitoring wells in this area. Therefore, the purpose of this
well is to establish a dedicated, long-term water-level monitoring well.
A suitable location for a Clark County well is yet to be identified.
3.2.2 Summary of previous studies and existing data
Northwest Washington wells
The six proposed wells in north-central Whatcom County will be sampled for water quality
parameters. Elevated groundwater nitrate concentrations have been observed for over 40 years in
the SBA (see Table 1). The percentage of wells not meeting the 10 mg/L nitrate-N drinking
water standard in these studies has ranged from 19 to 64%.
Environment and Climate Change Canada has a network of 60 monitoring wells near the
Canada-U.S. border with a 30-year nitrate record. Until 2018, about 30 wells were sampled
quarterly, including in March 2018 (Suchy, 2018). As of the end of 2018, the Canadian nitrate
monitoring program has been discontinued.
The Glacier well is in an area that has not hosted any groundwater monitoring wells in the past or
present; therefore, there are no data available.
QAPP: GW Monitoring Well Installation 2020-2021: Ecology and NGMN
Page 10Table 1. Previous groundwater nitrate studies in the Sumas-Blaine aquifer (SBA).
Wells exceeding
Number
Dates 10 mg/L nitrate-N Reference
of wells
(%)
1970-1973 100 19 Obert (1973)
1990 27 26 Erickson and Norton (1990)
Spring 1997 248 21 Erickson (1998)
1990-1991 230 21 Cox and Kahle (1999)
June 1999 53 50 Erickson (2000)
2002-2004 26 64 Mitchell (2005)
2003-2005 35 26 Redding (2008)
2009-2016 25 24 Carey (2017)
Olympic Peninsula wells
Groundwater levels in the Sequim area have been significantly affected by human activities
(PGG, 2009). Irrigation starting in the mid-19th century caused reduced baseflow to the
Dungeness River during the summer months and caused increased baseflow to small streams.
Recently, there has been a shift to increase baseflow to the Dungeness River. This has resulted in
less recharge to the aquifer, resulting in declining water levels. In addition, increased
urbanization in the area has resulted in increased withdrawals from domestic wells, causing
further declines in the groundwater.
The Sekiu and Clearwater wells are in areas that have not supported a groundwater monitoring
network; therefore, there are no data available.
Southwest Washington wells
Neither of the wells at Lewis County or Trout Lake are in areas that have an existing
groundwater monitoring network; therefore, there are no data available.
3.2.3 Parameters of interest and potential sources
Following are the principle parameters of interest for the six north-central Whatcom County
wells and their potential sources, although the sources are not identified:
• Nitrate-N – Animal and human waste, inorganic fertilizer. Nitrate will be analyzed as
nitrite+nitrate-N because nitrite-N is typically negligible in natural waters (Sawyer and
McCarty, 1978)
• Ammonia-N – Animal and human waste, inorganic fertilizer
• Chloride – Can be associated with animal or human waste
• Specific conductance – Conductance of higher ionic levels can be associated with many
wastes, including animal and human waste
• Dissolved oxygen (DO) – Important for interpreting water chemistry
• Oxidation/reduction potential (ORP) – Important for interpreting water chemistry
• pH – Important for interpreting water chemistry
Groundwater levels will also be monitored at these six wells.
QAPP: GW Monitoring Well Installation 2020-2021: Ecology and NGMN
Page 113.2.4 Regulatory criteria or standards
The Washington State Ground Water Quality Standards (GWQS) (Chapter 173-200 WAC)
apply to all groundwater of the state. The primary water quality parameter of interest for
this study at six North Whatcom County wells is nitrate, with an upper limit of 10 mg/L-N.
This limit corresponds with the federal maximum contaminant level for nitrate-N in
drinking water (40CFR Part 41).
4.0 Project Description
This 2020-2021 project will build on activities Ecology has performed in the past as a data
provider to the NGWMN.
For this project, Ecology received matching funds from the USGS to support NGWMN program
objectives. This includes installation of 13 monitoring wells at selected locations in Western
Washington that are not covered by Ecology’s current well network. The wells will be
instrumented with data loggers/pressure transducers to provide continuous water-level
measurements. A subset of six wells will also be incorporated into the long-term nitrate
monitoring effort in the Sumas-Blaine aquifer. The 13 new wells will provide water-level and
water quality data that will be submitted to the NGWMN database.
4.1 Project goals
The goal of this project is to establish a set of 13 purpose-built, groundwater monitoring wells in
Western Washington to be used for long-term water-level and water quality monitoring. Water-
level data will be used to monitor seasonal and climate variability in areas of the state that are
outside of the existing Ecology groundwater monitoring networks. Water quality data will
supplement an existing monitoring study in the Whatcom County portion of the Sumas-Blaine
aquifer.
4.2 Project objectives
The project objectives are to:
• Install 13 purpose-built groundwater monitoring wells and equip them with transducers to
conduct long-term, water-level measurements in order to evaluate seasonal and climate
variability over time.
• Collect water quality samples on an annual basis from a subset of six wells in Whatcom
County. Samples will be collected for nitrate-N and other parameters associated with the
Sumas-Blaine long-term ambient groundwater monitoring.
• Compare water quality analyte concentrations to the Washington State groundwater quality
standards (chapter 173-200 WAC).
• Conduct specific capacity and/or slug tests in monitoring wells to determine the hydraulic
conductivity of the aquifer.
QAPP: GW Monitoring Well Installation 2020-2021: Ecology and NGMN
Page 124.3 Information needed and sources
Information on the location and construction of existing wells near the proposed well
construction sites will be obtained from Ecology’s Water Resources Program Well Log system,
https://ecology.wa.gov/Water-Shorelines/Water-supply/Wells .
Groundwater quality SBA data are available from several studies listed in Section 3.2.2 of this
Quality Assurance Project Plan (QAPP). Existing data include groundwater quality (nitrate-N,
ammonia-N, and chloride), water levels, and aquifer characteristics. The current groundwater
monitoring network consists of private wells that are not necessarily available for long-term
monitoring. The six Whatcom County wells will serve as a dedicated, purpose-built groundwater
monitoring network in support of long-term monitoring.
Water-level measurements from an existing groundwater monitoring network in the Sequim area
provide water-level data. Most of the existing monitoring network consists of water supply wells.
The Sequim well will be installed in the upper regional aquifer next to an existing dedicated
monitoring well completed in the lower regional aquifer.
4.4 Tasks required
Project tasks fall into three categories: well construction, water-level monitoring, and water
quality sampling.
Well construction
• Identify potential well locations to install 13 groundwater monitoring wells in surficial
aquifers at select sites in Western Washington.
• Contact landowners and negotiate well installation agreement.
• Submit application to install well to public agencies.
• Prepare and submit well drilling contracting bid information to state-contracted well drillers.
• Contract and schedule a well drilling contractor.
• Oversee drilling and well installation operations.
• Wells will meet or exceed requirements of Minimum Standards for Construction and
Maintenance of Wells (Chapter 173-160 WAC).
• Survey well measuring points using GPS instrumentation. Use GIS elevation coverage to tie
into local elevation datum.
• Write a report documenting well drilling and sample collection results for submission to the
NGWMN (USGS).
Water level monitoring
• Calibrate and install pressure transducers in each monitoring well for continuous water level
measurements.
• Conduct quarterly manual water-level measurements and perform downloads of transducers
for a period of 25 years.
• Enter data into Ecology’s Environmental Information Management (EIM) system that will be
linked to the NGWMN database.
Water quality sampling
• Coordinate sample collection with SBA project manager.
QAPP: GW Monitoring Well Installation 2020-2021: Ecology and NGMN
Page 13• Schedule sample analysis with Ecology’s Manchester Environmental Laboratory.
• Collect annual water quality samples for nitrate-N and other parameters associated with the
SBA long-term monitoring from the six north-central Whatcom County wells.
• Evaluate results for quality assurance (QA) using EAP QA procedures.
• Compare analytical data to Washington State groundwater quality standards (chapter 173-
200 WAC).
• Enter data into Ecology’s EIM system that will be linked to the NGWMN database.
• Include water quality data in SBA project reports.
4.5 Systematic planning process
This QAPP serves as the planning document for the project.
5.0 Organization and Schedule
5.1 Key individuals and their responsibilities
Table 2. Organization of project staff and responsibilities.
Staff1 Title Responsibilities
Eugene Freeman
Groundwater/Forests & Writes the QAPP. Oversees well installation and field
Project Manager
Fish Unit (GFFU) activities. Conducts QA review of data, analyzes and
/Licensed
Statewide Coordination interprets data, and enters data into EIM. Writes draft
Hydrogeologist
Section (SCS) and final reports.
Phone: 360-407-6818
Jacob Carnes
GFFU/SCS Field Assistant Helps collect samples and records field information.
Phone: 360-407-6498
Eric Daiber
GFFU/SCS Field Assistant Helps collect samples and records field information.
Phone: 360-407-7169
Pam Marti Unit Supervisor
Provides internal review of the QAPP, approves the
GFFU/SCS for the Project
budget, and approves the final QAPP.
Phone: 360-407-6768 Manager
Jessica Archer Section Manager
Reviews the project scope and budget, tracks progress,
SCS for the Project
reviews the draft QAPP, and approves the final QAPP.
Phone: 360-407-6698 Manager
Stacy Polkowske
Section Manager
Western Operations Section Reviews and approves the final QAPP.
for the Study Area
Phone: 360-407-6730
Alan Rue
Manchester Environmental Manchester Lab
Reviews and approves the final QAPP.
Laboratory Director
Phone: 360-871-8801
Arati Kaza Ecology Quality Reviews and approves the draft QAPP and the final
Phone: 360-407-6964 Assurance Officer QAPP.
1
All staff are from EAP. EAP: Environmental Assessment Program
EIM: Environmental Information Management database. QAPP: Quality Assurance Project Plan
QAPP: GW Monitoring Well Installation 2020-2021: Ecology and NGMN
Page 145.2 Special training and certifications
A licensed driller will be used for all monitoring well installations (Chapter 18.104 RCW; WAC
173-160).
A hydrogeologist license is required for the person overseeing hydrogeologic studies (Chapter
18.220.020 RCW).
All field staff involved with this project have relevant experience following Ecology’s Standard
Operation Procedures (SOPs) or will be trained by senior staff who do. Field staff who lack the
necessary skills and experience to work independently will be paired with staff mentors who will
oversee and verify their work and also provide the necessary training to enable them to work
proficiently and independently.
See Section 8 for a list of SOPs and practices that will be following during this project.
5.3 Organization chart
See Table 2.
5.4 Proposed project schedule
Tables 3 – 5 list key activities, due dates, and lead staff for this project.
Table 3. Proposed schedule for completing well construction and progress report.
Well Construction Due date Lead staff
Field work completed August 2021 Eugene Freeman
EIM data loaded (well logs) September 2021 Eugene Freeman
Draft report due to supervisor September 2021 Eugene Freeman
Draft due to peer reviewer September 2021 Eugene Freeman
Final (all reviews done) due to
October 2021 Eugene Freeman
publications team
Final report due to client November 2021 Eugene Freeman
Table 4. Proposed schedule for completing water-level monitoring.
Water Level Field Work Due date Lead staff
Field work completed January/April/July/October (yearly) Eugene Freeman
EIM Study ID NGWMN
EIM data loaded (water level data) June (annually) Eric Daiber
EIM QA July (annually) Eugene Freeman
EIM complete August (annually) Eric Daiber
QAPP: GW Monitoring Well Installation 2020-2021: Ecology and NGMN
Page 15Table 5. Proposed schedule for completing field and laboratory work, data entry into EIM,
and reports.
Water Quality Sampling and
Due date Lead staff
Laboratory Work
Field work completed March (annually) Eric Daiber
Laboratory analyses completed May (annually) Eugene Freeman
Environmental Information
Management (EIM) database
EIM Study ID NGWMN
EIM data loaded June (annually) Eric Daiber
EIM data entry review July (annually) Eugene Freeman
EIM complete August (annually) Eric Daiber
Final Report
Author lead / Support staff Eric Daiber/ Pam Marti
Draft to supervisor October (annually) Eric Daiber
Draft to client/peer reviewer December (annually) Eric Daiber
Final draft to publications team February (annually) Eric Daiber
Final report due on web March (annually) Eric Daiber
5.5 Budget and funding
This project is jointly funded by the USGS under the NGWMN program. This QAPP addresses
one of five project tasks. Under the agreement between the USGS and Ecology, a total of 13
shallow, dedicated groundwater monitoring wells will be installed in Western Washington in
approximate locations as shown in Figure 1.
The funds from the USGS will be matched by funds from the State of Washington as identified
in Table 6. Funding for the water quality sampling will be provided by Ecology as part of its
SBA annual nitrate sampling (Table 7).
Table 6. NGWMN project budget and funding.
Federal Agency-in- Total
Item
($) Kind ($) ($)
Salary, benefits, and indirect/overhead 126,769 132,270 259,039
Equipment 0 15,600 15,600
Travel and other 3,702 5,553 9,255
Contracts 46,370 19,873 66,243
Project Totals 176,841 173,296 350,137
Table 7. Laboratory budget for Whatcom County wells.
Number of Number of Total Number Cost Per Lab
Parameter
Samples QA Samples of Samples Sample Subtotal
Nitrate-N 6 2 8 $15 $120
Ammonium-N 6 2 8 $15 $120
Chloride 6 2 8 $15 $120
Lab Total $360
QAPP: GW Monitoring Well Installation 2020-2021: Ecology and NGMN
Page 166.0 Quality Objectives
The quality objective for this project is to collect groundwater data of known, acceptable, and
documentable quality. This will be achieved by establishing measurement quality objectives
(MQOs) for precision and bias (accuracy), sensitivity, completeness, comparability, and
representativeness, and by testing data against these criteria.
6.1 Data quality objectives 1
Data quality objectives (DQOs) establish acceptable quantitative criteria for the quality and
quantity of the data to be collected, relative to the ultimate use of the data. DQOs serve as
performance or acceptance criteria and represent the overarching quality objectives of the study.
Primary DQOs for this project are:
• Install 13 purpose-built monitoring wells that meet or exceed requirements of Minimum
Standards for Construction and Maintenance of Wells (Chapter 173-160 WAC).
• Collect long-term, water-level measurements to allow the evaluation of seasonal and climate
variability over time.
• Collect water quality data to add to the long-term nitrate-N monitoring effort in the SBA.
6.2 Measurement quality objectives
MQOs are performance or acceptance criteria for individual data quality indicators, including
quantitative factors (precision, bias, sensitivity, and completeness) and qualitative factors
(comparability and representativeness).
6.2.1 Targets for precision, bias, and sensitivity
The MQOs for project results, expressed in terms of acceptable precision, bias, and sensitivity,
are described in this section and summarized in Tables 8 and 9.
6.2.1.1 Precision
Precision is a measure of the variability between results of replicate measurements that is due to
random error. It is usually assessed using duplicate field measurements or laboratory analysis of
duplicate samples. Random error is imparted by the variation in concentrations of samples from
the environment as well as other introduced sources of variation (e.g., field and laboratory
procedures).
Duplicate samples will be collected in the field by filling two sets of bottles at the same time
from a pre-selected well. Precision for field and laboratory duplicate samples will be expressed
as relative percent difference (RPD) as shown in Table 8. The smaller the RPD, the more precise
the measurement process. Good precision is indicative of relative consistency and comparability
between different samples.
1
DQO can also refer to Decision Quality Objectives. The need to identify Decision Quality Objectives
during the planning phase of a project is less common. For projects that do lead to important decisions,
DQOs are often expressed as tolerable limits on the probability or chance (risk) of the collected data
leading to an erroneous decision. And for projects that intend to estimate present or future conditions,
DQOs are often expressed in terms of acceptable uncertainty (e.g., width of an uncertainty band or
interval) associated with a point estimate at a desired level of statistical confidence
QAPP: GW Monitoring Well Installation 2020-2021: Ecology and NGMN
Page 17Table 8. Measurement quality objectives (MQOs).
Matrix Verification
Duplicate Matrix Surrogate MRL or
Spike- Standards
Samples Spikes Standards Lowest
Parameter Duplicates (LCS,CRM,
(Relative % (% (% Conc. of
(Relative % CCV)
Difference) Recovery) Recovery) Interest
Difference) (% Recovery)
Temperature n/a n/a n/a n/a n/a 2°C
pH n/a n/a See Table 9 n/a n/a 6 s.u.
Specific
n/a n/a See Table 9 n/a n/a 10 uS/cm
Conductivity
DO n/a n/a See Table 9 n/a n/a 0.1 mg/L
ORP n/a n/a See Table 9 n/a n/a n/a
Water Level 0.02 n/a n/a n/a n/a 0.01 ft
Ammonia-N 20 n/a 20 +/-25 n/a 0.010 mg/L
Nitrate+nitrite-N 20 n/a 20 +/-25 n/a 0.010 mg/L
Chloride 20 n/a 20 +/-25 n/a 0.1 mg/L
a
Analyte groups are listed here with the range of MQOs of each group. Appendix C lists individual analytes and MQOs.
DO: Dissolved Oxygen. ORP: Oxidation Reduction Potential.
Table 9. MQOs for field parameters expressed as acceptance criteria for field instrument
intermediate and post checks (SOP EAP033).
Parameter Units Accept Quality Reject
pH Std. Units < or = ± 0.3 > ± 0.3 and < or = ± 1.0 > ± 1.0
Conductivity uS/cm < or = ± 10 % > ± 10 % and < or = ± 20 % > ± 20 %
Temperature °C < or = ± 0.2 > ± 0.2 and < or = ± 1.0 > ± 1.0
Dissolved Oxygen mg/L < or = ± 0.3 > ± 0.3 and < or = ± 1.0 > ± 1.0
Dissolved Oxygen % saturation < or = ± 5 % > ± 5 % and < or = ± 15 % > ± 15 %
Oxidation Reduction Potential mv < or = ± 5 % > ± 5 % and < or = ± 15 % > ± 15 %
6.2.1.2 Bias
Bias is defined as the difference between the sample value and true value of the parameter being
measured. Bias is usually addressed by calibrating field and laboratory instruments, and by
analyzing lab control samples, matrix spikes, and standard reference materials (see Table 8). Bias
in field measurements and samples will be minimized by strictly following Ecology’s
measurement, sampling, and handling protocols.
6.2.1.3 Sensitivity
Sensitivity is a measure of the capability of a method to detect a substance. It is commonly
described as a detection limit. In a regulatory setting, the method detection limit (MDL) is often
used to describe sensitivity. Targets for lab measurement sensitivity required for the project are
listed in Table 8.
QAPP: GW Monitoring Well Installation 2020-2021: Ecology and NGMN
Page 186.2.2 Targets for comparability, representativeness, and completeness
6.2.2.1 Comparability
Comparability expresses the confidence with which one set of data can be compared to another.
Comparability will be ensured to the extent possible by implementing standardized procedures
for sampling and analysis. SOPs to be used during this project are listed in Section 8.2.
The Olympic Peninsula and Southwest Washington wells are being installed in areas with
limited data available on water-level conditions. Available data to compare to is limited to static
water levels recorded on area well logs,
Water-level and water quality data collected from the Whatcom County wells will be compared
to data collected in previous studies conducted in this area, specifically Erickson (2000, 1998),
Redding (2008), and Carey (2017).
6.2.2.2 Representativeness
Representativeness expresses the degree to which data accurately and precisely represent the
actual site conditions. Groundwater measurements and samples will be collected using industry
standard methods, which will help ensure that representative samples are collected.
Transducers that record measurements continually (every 6 hours) will allow Ecology to observe
changes in water levels that might occur over shorter timeframes than would be observed by
quarterly manual measurements.
Water quality samples from the Whatcom County wells will be collected in the spring
(March/April) to represent the same season and conditions as those used for samples collected in
comparable studies (Redding, 2009; Carey, 2018).
6.2.2.3 Completeness
Completeness establishes whether a sufficient amount of valid measurements were obtained to
meet project objectives. The number of samples and results expected establishes the comparative
basis for completeness.
The completeness goal for this project is to collect and analyze 100% of the measurements and
samples. However, problems occasionally arise during sample collection that cannot be
controlled; thus a completeness of 95% is acceptable. Examples of potential problems that may
be encountered are site access issues, equipment failure, or sample container shortages.
6.3 Acceptance criteria for quality of existing data
Existing data will be accepted if they were collected with standardized sampling, analytical, and
quality assurance (QA) methods that can be documented and that are comparable to those
outlined in this study.
Nitrate-N results collected from the six newly installed Whatcom County wells will be compared
with data previously collected by Ecology as part of numerous SBA studies. Existing data for the
study area are in the EIM database under study IDs: SUMAS, DERI001, and mred0001. These
project data have a high level of QA (Level 5).
QAPP: GW Monitoring Well Installation 2020-2021: Ecology and NGMN
Page 196.4 Model quality objectives
N/A
7.0 Study Design
This study is designed to install 13 purpose-built groundwater monitoring wells in select
locations in Western Washington. These wells will be used for long-term water-level and water
quality monitoring. Water-level data will be used to monitor seasonal and climate variability in
areas of the state that are outside of existing Ecology groundwater monitoring networks. Water
quality data will supplement an existing monitoring study in the Whatcom County portion of the
Sumas-Blaine aquifer.
7.1 Study boundaries
Study area boundaries are shown in Figures 1 and 2. The 13 wells will be installed at select
locations in Western Washington: seven in Northwest Washington (Whatcom County), three on
the Olympic Peninsula, and three in Southwestern Washington.
7.2 Field data collection
Data collection at the well sites will include logging the geologic profile during drilling,
documenting well construction, installing water-level monitoring equipment in each well, and
sampling nitrate, ammonium, and chloride in six of the Whatcom County wells.
All wells will be installed by licensed state-contracted well drillers. The wells will meet or
exceed requirements of Minimum Standards for Construction and Maintenance of Wells
(Chapter 173-160 WAC).
When drilling the borehole, a 6-inch diameter hole will be drilled by the method specified by the
drilling contractor. Soil samples from drill cutting will be taken at 5-foot intervals. Drill cuttings
will be used to log the geologic profile. The final well depth will be determined by the season
with expected low water table in the fall and winter or high water table in the spring and early
summer. The screen will be set such that it will remain submerged during low water level
conditions. The completed well will be a 2-inch diameter schedule 40 PVC pipe with the lower
5-10 feet consisting of 2-inch diameter, PVC slotted screen. Six of the Whatcom County wells
will be flush mount construction (Figure 3), and the remaining wells will consist of a 6-inch
diameter steel protective casing extending 3 feet above ground surface and protected by steel
bollards (Figure 4).
A water pressure transducer will be placed in each well such that the transducer is always below
the expected range of fluctuation in the water table. Where appropriate, a barometric pressure
transducer will also be placed in the well above the water table such that at no time is the
pressure transducer submerged below the water table. The recording frequency for both
instruments will be set to log at a common start time and interval (6 hours). Since pressure
transducers are not expected to be in areas where significant groundwater withdrawals are
happening, there should be no need for shorter time-steps. The longer time-step also conserves
battery life and data logger storage space.
QAPP: GW Monitoring Well Installation 2020-2021: Ecology and NGMN
Page 20Figure 3. As-built for flush mount groundwater monitoring well design completion.
Figure 4. As-built for above-ground groundwater monitoring well design completion.
QAPP: GW Monitoring Well Installation 2020-2021: Ecology and NGMN
Page 217.2.1 Sampling locations and frequency
Water-level measurements will be taken after the well is completed. Within a month after
completion, data logger/pressure transducers will be installed and programmed at a regular time
interval (6 hours). Each well will be visited quarterly to download data, maintain the transducers,
and collect static water-level measurements. Well access agreements have been established for a
period of 25 years.
Water quality samples will be collected annually in the spring for nitrate-N and other parameters
associated with the SBA long-term monitoring from the six north-central Whatcom County wells
7.2.2 Field parameters and laboratory analytes to be measured
Depth to water (water levels) will be measured at all 13 installed wells.
The parameters to be measured at the six water quality wells in Whatcom County are:
• Depth to water (Field)
• Temperature (Field)
• pH (Field)
• Specific conductivity (Field)
• Dissolved oxygen (DO) (Field)
• Oxidation/reduction potential (ORP)
• Nitrite+nitrate-N (Laboratory)
• Ammonia-N (Laboratory)
• Chloride (Laboratory)
7.3 Modeling and analysis design
N/A
7.4 Assumptions underlying design
• At least a 5-foot-thick aquifer unit will be encountered in the upper unconfined aquifer
during drilling.
• The lowest seasonal water level in the aquifer will not decline below the final well
completion depth.
• Monitoring wells will provide information representative of site conditions.
• Access to drilling locations will not be impaired.
• Water level is not measurably affected by anthropogenic causes (addition or withdrawal) at
the purpose-built, water-level monitoring wells.
• Sampling the six Whatcom County wells at the same time of year will minimize the
influence of seasonal variation when comparing annual results. This assumes that seasonal
climate factors (e.g., precipitation, temperature) that affect sample results are consistent each
year.
QAPP: GW Monitoring Well Installation 2020-2021: Ecology and NGMN
Page 227.5 Possible challenges and contingencies
The main challenges for this project are: (1) locating suitable sites for the new groundwater
wells, (2) obtaining permission to install the wells from property owners and securing accesses
agreements, and (3) contracting and coordinating with the well drillers.
7.5.1 Logistical problems
This project requires much logistical coordination between Ecology, property owners, and
contract well drillers. Clear communications between all parties will be necessary to successfully
complete the well installations. Final signatures on all access agreements will be obtained prior
to drilling. Ecology will coordinate drilling activities with the drillers and property owners to
ensure the well sites are clear for the drilling equipment and the areas are safe and secure.
7.5.2 Practical constraints
This project is a jointly funded venture with the USGS under the NGWMN program. Under the
agreement, Ecology will match funds provided by the USGS to install 13 groundwater
monitoring wells. When funding is secured, purchase requests to hire the contract drillers must
be submitted and approved to meet the project schedules. Contract drillers must accept and be
available to meet the project schedules.
Some practical constraints could prohibit the successful installation of the monitoring wells. The
location of some underground utilities may require a proposed well to be moved or may prohibit
a well from being installed.
7.5.3 Schedule limitations
Well installations have been grouped into 3 regions (Northwest Washington/Whatcom County,
Olympic Peninsula, and Southwest Washington) to streamline the drilling contract process and
scheduling. Well installation timelines will be coordinated with the property owners’ schedules.
• Whatcom County wells must be completed by November 2020.
• The well near Clearwater, Washington must be completed by October 2020, before livestock
return to the pasture where the well is located.
• Southwestern Washington wells must be completed by August 2021.
QAPP: GW Monitoring Well Installation 2020-2021: Ecology and NGMN
Page 23You can also read