HOPES: An Integrative Digital Phenotyping Platform for Data Collection, Monitoring, and Machine Learning
←
→
Page content transcription
If your browser does not render page correctly, please read the page content below
JOURNAL OF MEDICAL INTERNET RESEARCH                                                                                                        Wang et al

     Viewpoint

     HOPES: An Integrative Digital Phenotyping Platform for Data
     Collection, Monitoring, and Machine Learning

     Xuancong Wang1, PhD; Nikola Vouk1, MBA; Creighton Heaukulani1, PhD; Thisum Buddhika1, MComp; Wijaya
     Martanto1, MD, PhD; Jimmy Lee2,3, MBBS, MMed, MCI; Robert JT Morris1,4, PhD
     1
      Office for Healthcare Transformation, Ministry of Health, Singapore, Singapore
     2
      Institute of Mental Health, Singapore, Singapore
     3
      Lee Kong Chian School of Medicine, Nanyang Technological University, Singapore, Singapore
     4
      Yong Loo Lin School of Medicine, National University of Singapore, Singapore, Singapore

     Corresponding Author:
     Creighton Heaukulani, PhD
     Office for Healthcare Transformation
     Ministry of Health
     1 Maritime Square
     #12-10 Harbourfront Centre
     Singapore, 099253
     Singapore
     Phone: 65 66793209
     Email: creighton.heaukulani@moht.com.sg

     Abstract
     The collection of data from a personal digital device to characterize current health conditions and behaviors that determine how
     an individual’s health will evolve has been called digital phenotyping. In this paper, we describe the development of and early
     experiences with a comprehensive digital phenotyping platform: Health Outcomes through Positive Engagement and
     Self-Empowerment (HOPES). HOPES is based on the open-source Beiwe platform but adds a wider range of data collection,
     including the integration of wearable devices and further sensor collection from smartphones. Requirements were partly derived
     from a concurrent clinical trial for schizophrenia that required the development of significant capabilities in HOPES for security,
     privacy, ease of use, and scalability, based on a careful combination of public cloud and on-premises operation. We describe new
     data pipelines to clean, process, present, and analyze data. This includes a set of dashboards customized to the needs of research
     study operations and clinical care. A test use case for HOPES was described by analyzing the digital behavior of 22 participants
     during the SARS-CoV-2 pandemic.

     (J Med Internet Res 2021;23(3):e23984) doi: 10.2196/23984

     KEYWORDS
     digital phenotyping; eHealth; mHealth; mobile phone; phenotype; data collection; outpatient monitoring; machine learning

                                                                               It has been highlighted by Onnela [4] that the wide adoption of
     Introduction                                                              smartphones and the increasing use of wearable devices open
     We are at an age in health care where we have much data at our            up a new vista of characterizing both current health conditions
     disposal, including the high penetration of digital electronic            and the ongoing behaviors that will determine how an
     medical records and advanced techniques available for their               individual’s health will evolve. As examples of these new data
     analysis [1]. It is also well accepted that lifestyle characteristics,    sources, we can readily measure physical activity, heart rate,
     including activity, stress level, social interactions, and                heart rate variability, temperature, sleep, sociability (amount of
     environment, are significant determinants of health outcomes              human interaction), and smartphone usage (amount and duration
     [2,3]. Although estimates vary, it has been argued that lifestyle         of use, type of use, and the way a screen is tapped and scrolled).
     choices exceed the impact of health care received as a                    The approach of using personal digital devices to capture these
     determinant of premature death [3].                                       data sources, and hence characterize an individual in situ, has
                                                                               been called digital phenotyping [5]. The use of digital
                                                                               phenotyping both complements and extends the use of traditional

     https://www.jmir.org/2021/3/e23984                                                                 J Med Internet Res 2021 | vol. 23 | iss. 3 | e23984 | p. 1
                                                                                                                      (page number not for citation purposes)
XSL• FO
RenderX
JOURNAL OF MEDICAL INTERNET RESEARCH                                                                                                  Wang et al

     home monitoring (eg, blood pressure measurements) in                     the potential to monitor a wider variety of the subjects’
     telemedicine by offering continuous measurement during normal            parameters, such as location, sleep, motion, heart rate
     activities and everyday living. We have developed a                      variables, and instantaneous manual responses. These can
     general-purpose digital phenotyping platform called                      be measured simultaneously, efficiently, and reliably.
     Health Outcomes                  through Positive Engagement
                                                                         A much-discussed concern is how well such techniques will be
     and Self-Empowerment (HOPES), which integrates data from
                                                                         accepted and complied with by patients or consumer
     wearable devices and a broad set of smartphone sensors,
                                                                         participants. This involves ease-of-use considerations by both
     provides an array of methods to inspect that data, and binds
                                                                         the user and the provider. Another major concern revolves
     everything together into a platform with a comprehensive
                                                                         around data security and privacy preservation. These two aspects
     privacy and security model. The platform was developed in
                                                                         have been primary motivators in our design choices and
     conjunction with a clinical study for schizophrenia. In what
                                                                         investigations.
     follows, we provide an overview of the HOPES platform and
     demonstrate its first use.                                          Clinical Study on Digital Phenotyping in Schizophrenia
     Digital Phenotyping                                                 The HOPES platform was designed, developed, and refined
                                                                         concurrently to support clinical studies. The HOPE-S (Health
     The collection of data from a personal digital device can be
                                                                         Outcomes via Positive Engagement in Schizophrenia) study
     used to encourage healthy behaviors; an example is the
                                                                         [22] was launched in November 2019. HOPE-S is an
     Singapore Health Promotion Board National Steps Challenge
                                                                         observational study of individuals with schizophrenia who were
     [6]. Data collection is sometimes combined with coaching or
                                                                         recently discharged from a psychiatric hospital. The aim of this
     nudges for general wellness [7] or to monitor and improve an
                                                                         study is to determine whether digital phenotyping data are
     existing diagnosed condition [8,9]. We were originally inspired
                                                                         associated with clinical and health utilization outcomes. Key
     by the potential use of digital phenotyping to monitor and treat
                                                                         events recorded over the 6-month observation period include
     mental health conditions such as depression and schizophrenia.
                                                                         readmission, outpatient nonattendance (ie, defaults), and
     Several notable studies, including a study at Northwestern
                                                                         unscheduled service use, such as emergency department
     University, have shown the correlation of mobile phone sensors
                                                                         attendance and mobile crisis team activations. The primary
     with depressive symptom severity [10]; a recent study at King’s
                                                                         study outcomes are the ability to predict relapse and/or
     College London showed the feasibility and acceptability of the
                                                                         readmission within 6 months, with secondary outcomes being
     extended use of wearable devices and smartphones in patients
                                                                         the associations between digital phenotyping data and health
     with schizophrenia [11] and the use of digital phenotyping for
                                                                         care use, psychiatric symptom severity, and functional status
     relapse prediction in schizophrenia [12]. The commercial world
                                                                         assessed during research visits. Ethics approval was granted by
     has also taken notice, and a number of start-ups have formed
                                                                         Singapore’s National Healthcare Group Domain Specific
     based on these technologies [13-15].
                                                                         Review Board (reference no.: 2019/00720). To promote the use
     In addition, digital phenotyping is also being applied to address   of digital wearables among our population and to provide
     a diverse range of diseases, such as asthma, maternal health,       incentives to patients to join our study, we offered each
     cancer, and dermatology [9,16-18]. Recent experiments on the        participant a Fitbit Charge 3 free of charge.
     use of wearable devices such as the Oura ring [19] and the Fitbit
                                                                         The first phase of the HOPE-S study is observational. During
     wrist band [20] have been applied to measure participants’
                                                                         this phase, we examine the deployment, feasibility, and
     parameters during the SARS-CoV-2 pandemic. We illustrate
                                                                         acceptability of a wide range of digital sensors while performing
     our observations related to the pandemic (using Fitbit) in the
                                                                         the analyses required to assess the outcomes described above.
     Example Analysis Section.
                                                                         In this process, we have been collecting large amounts of data
     Digital phenotyping has the potential to supplement, and in         for our analyses. These data will subsequently be used to
     some cases replace, standard clinical processes in data gathering   develop machine learning algorithms to predict changes in
     and patient monitoring by virtue of the following attributes:       symptom severity and other important clinical outcomes, as
     1.
                                                                         opposed to merely analyzing associations. During the subsequent
          Productivity and cost: passive monitoring can be efficient
                                                                         phase of the study, we will deploy interventions such as early
          for both the provider and patient, compared with traditional
                                                                         warnings of relapses, which will allow pre-emptive steps to be
          clinical visits or scheduled telemedicine encounters.
     2.
                                                                         taken to prevent participant relapse or rehospitalization.
          Latency: passive monitoring may enable relatively quick
          responses from health providers, for example, allowing for     HOPES: A General-Purpose Platform for Digital
          actions from a case manager within a day versus a week or      Phenotyping
          longer for a visit.
                                                                         HOPES is based on, and extends, the existing Beiwe platform
     3.   Sensitivity: several variables such as resting heart rate or
                                                                         [23,24]. Our contributions include the following:
          sleep parameters are not easy to measure in the clinic, and
          device monitoring can be more effective than subjective        1.   The integration of wearable devices, where we have
          patient reporting or inconvenient manual processes. The             experimented with both wrist and ring devices;
          emergence of low-cost consumer devices has been shown          2.   The use of a wide range of sensors on the smartphone.
          to be sufficiently accurate for several purposes [21].         3.   An efficient onboarding method for participants.
     4.   More parameters: while in the past we have been limited        4.   A suite of user interfaces including data collection and
          to infrequent interview questions and scales, we now have           quality management tools, clinical summarization

     https://www.jmir.org/2021/3/e23984                                                           J Med Internet Res 2021 | vol. 23 | iss. 3 | e23984 | p. 2
                                                                                                                (page number not for citation purposes)
XSL• FO
RenderX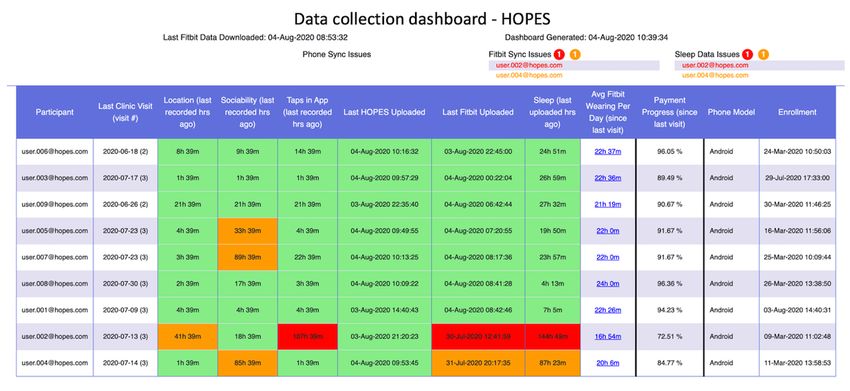
JOURNAL OF MEDICAL INTERNET RESEARCH                                                                                                   Wang et al

          dashboards, and general-purpose research dashboards for         app that performs passive sensor data collection in the
          use in exploratory data analysis and building anomaly           background and a server backend in charge of receiving the
          detection algorithms.                                           data. Note that digital phenotyping is not limited to smartphones;
     5.   Assurances for data security and the preservation of user       indeed, wearables also provide some significant differentiated
          privacy.                                                        capabilities, and there are other sources such as fixed detectors.
                                                                          Some platforms such as Beiwe and RADAR-base also support
     The platform is designed to be reliably deployed at scale and
                                                                          active data collection in the form of surveys and some capture
     makes use of both public clouds and controlled on-premise
                                                                          data from wearable devices, such as wrist- or arm-wearable
     computing infrastructure. We recognize the broad spectrum of
                                                                          devices, by providing a common data interface.
     potential applications beyond mental health and the growing
     set of digital sensors and their capabilities that may be            From our assessment, Purple Robot has the most complete
     appropriate for different applications. Therefore, we designed       coverage of Android sensors and features among the platforms
     HOPES to be flexible and extensible to accommodate new               we reviewed. The user can select which sensors to turn on and
     devices and sensor integration, and new data dashboards.             set the data sampling frequency, however, the platform does
                                                                          not support the iPhone Operating System (iOS). AWARE
     Although the data collected during the HOPE-S study are rich,
                                                                          supports both Android and iOS and has nearly full coverage of
     they are also noisy and incomplete as is expected when dealing
                                                                          Android sensors and features. Similar to Purple Robot, AWARE
     with real human behavior and varying data reliability among
                                                                          also allows the user to configure sensors and features.
     sensors. To address these challenges, we have developed a data
                                                                          RADAR-base has recently added iOS support and uses both
     collection dashboard and multiple data visualization and
                                                                          passive (phone use and sensors) and active (survey and
     exploration tools, which have proven invaluable for monitoring
                                                                          questionnaire) data collection. Although it covers fewer phone
     and ensuring participant compliance on a daily basis in the
                                                                          features and sensors than the Purple Robot and AWARE, it has
     research study. We have also developed a feature engineering
                                                                          a very attractive user interface and a very robust system for
     pipeline to construct useful insights for the HOPE-S study and
                                                                          surveys and questionnaires. Beiwe is a smartphone-based digital
     to compensate for various shortfalls in the raw data. These
                                                                          phenotyping research platform that supports both Android and
     dashboards have been found to be easy to use by research
                                                                          iOS and has a decent coverage of phone sensors and features.
     coordinators involved in the HOPE-S study, who have been
                                                                          Moreover, the platform supports active feature collection from
     able to easily recognize problems and contact the participant if
                                                                          simple surveys. Apart from the data collection backend that
     their data are not being received. We also illustrate the
                                                                          receives data from participants’ phones, Beiwe also has a
     dashboards that our data scientists have used to look for patterns
                                                                          backend for data analytics.
     and an anomaly detection dashboard that raises alerts on
     irregularities in the data. All the data are then fed into           We have based the framework for the HOPES platform on Beiwe
     downstream statistical analyses and our ongoing development          for several reasons. First, Beiwe supports both Android and iOS,
     of predictive machine learning algorithms. At this stage, our        a requirement for any generic digital phenotyping platform to
     anomaly detection dashboard implements common statistical            be widely adopted. Second, our platform analysis and
     routines for anomaly detection in time-series data. The              comparison tests conducted in March 2019 showed that at that
     development of an effective relapse prediction algorithm is an       time, Beiwe was most ready to deploy. Our decision was also
     ongoing subject of this study.                                       based on our review of a number of Git repositories and
                                                                          publications as well as previous practical applications of the
     The remainder of this paper is organized as follows: In the
                                                                          platforms in clinical studies and trials. We chose the Fitbit wrist
     section Existing platforms we review several existing open
                                                                          device to access data beyond the smartphone sensors after
     source digital phenotyping platforms, highlighting their
                                                                          conducting a technical and usability comparison of several
     respective strengths and weaknesses. In the section on The
                                                                          popular devices on the commercial market. Specifically, we
     HOPES Platform and Its First Use in the HOPE-S Study, we
                                                                          compared Fitbit Charge 3, Huawei Honor A2, Xiaomi Mi Band
     describe the overall architecture of the HOPES platform. In the
                                                                          3, Actxa Spur+, and HeyPlus. We found that Fitbit was
     section on Dashboards, User Iterfaces, and Data Analysis, we
                                                                          distinguished by ease-of-use, battery life, and reliability, and it
     describe the enhancements to Beiwe that the HOPES platform
                                                                          has been validated to be reasonably accurate against gold
     provides, guided by the requirements of the HOPE-S study and
                                                                          standard devices for the measurement of sleep [21]. We also
     other planned future uses (including for purposes beyond mental
                                                                          evaluated a number of external sleep measurement devices (such
     health). In the section Example Analysis we show an early and
                                                                          as mattress pads) but did not find them suitable for our purposes.
     simple example of the use of our collected data on 22
     participants in which we compare user data before and after
     Singapore’s SARS-CoV-2 lockdown went into effect. In the
                                                                          The HOPES Platform and Its First Use in
     section Conclusions, we provide some overall conclusions that        the HOPE-S Study
     can be drawn from our experiences with digital phenotyping.
                                                                          To support large-scale data aggregation of wearables, mobile
     Existing Platforms                                                   phones, and other data sources, we defined a set of requirements
     There are several existing open source digital phenotyping           and then built our platform to be secure and scalable. Building
     platforms, including Beiwe [23,24], Purple Robot [25-27],            on top of the existing Beiwe platform, we created the HOPES
     AWARE [28,29], and RADAR-base (Remote Assessment of                  platform by expanding the functional capabilities for easier
     Disease And Relapse) [30-32]. Each contains a core smartphone        participant onboarding, enhanced data collection monitoring,

     https://www.jmir.org/2021/3/e23984                                                            J Med Internet Res 2021 | vol. 23 | iss. 3 | e23984 | p. 3
                                                                                                                 (page number not for citation purposes)
XSL• FO
RenderX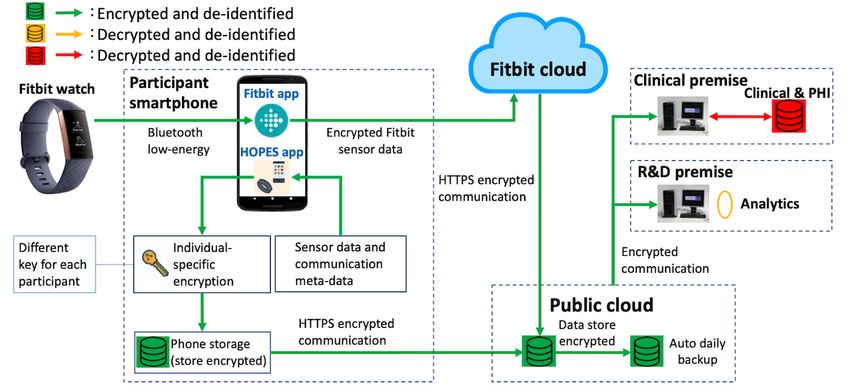
JOURNAL OF MEDICAL INTERNET RESEARCH                                                                                                  Wang et al

     optimized data uploading, extended security features, expanded      information about miscellaneous improvements to Multimedia
     data processing and analytics pipeline, and a scalable              Appendix 1.
     deployment architecture. The goal was to obtain easy and secure
     onboarding, almost unlimited scaling, high operational security,
                                                                         Platform Requirements
     and improved privacy assurance. Although we were immediately        The HOPES platform is designed to be a reliable,
     driven by meeting the strict requirements for the HOPE-S study,     low-maintenance digital phenotyping collection and aggregation
     along the way we became aware of expanded requirements for          platform. It is designed to support research protocols as well as
     a wider range of participant monitoring requirements. We took       scale to larger production platforms, including self-service
     these requirements into account in our architecture and design,     registration. The requirements and their corresponding
     so we would be ready for further deployments. In this section,      capabilities are listed in Textbox 1.
     we describe the platform requirements, our resulting HOPES          To successfully implement such a broad set of requirements,
     system architecture, the features collected for the HOPE-S study,   we carefully studied and focused on the user experience for
     the enhancements we made to the Android app, the platform           onboarding new participants and built a platform that leverages
     backend, and the security protocols. We provide our motivation      the best software engineering, design principles, and cloud
     and a high-level description, leaving further details and           architecture capabilities.

     https://www.jmir.org/2021/3/e23984                                                           J Med Internet Res 2021 | vol. 23 | iss. 3 | e23984 | p. 4
                                                                                                                (page number not for citation purposes)
XSL• FO
RenderX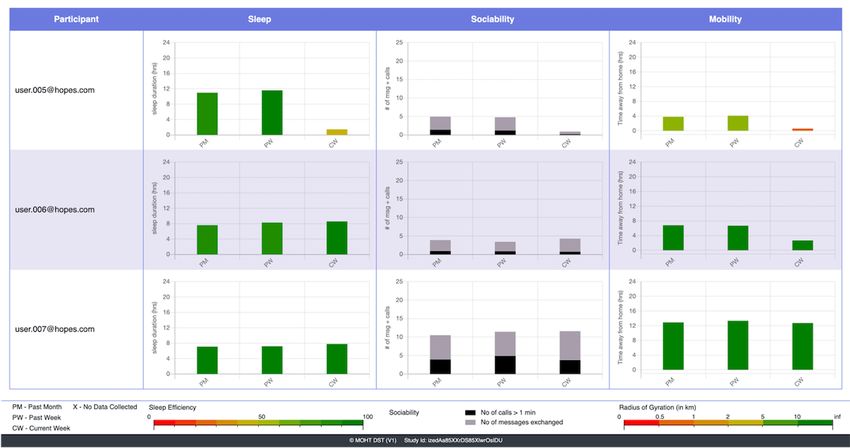
JOURNAL OF MEDICAL INTERNET RESEARCH                                                                                                                  Wang et al

     Textbox 1. Health Outcomes through Positive Engagement and Self-Empowerment (HOPES) platform requirements.
      Requirements and implementation capabilities:
      Simple user onboarding

      •    Precreation of user identities and anonymization factors

      •    Preprinted Quick Response code onboarding sheets

      •    Ability to migrate participants to new phones (if their current phones are not usable for a study) while maintaining study data integrity and privacy

      •    Simple onboarding literature and packaging in gift pack format

      •    Wide platform support, Android (with and without Google services), iPhone Operating System

      •    Ability to be totally passive with zero user interaction after setup

      •    Preparation for self-service onboarding in the future

      User data collection and privacy

      •    All data deidentified (no personally identifiable information)

      •    Per-participant encryption keys

      •    Per-participant random credentials

      •    Mapping between participant ID and deidentified study ID securely retained but only made available to authorized clinicians

      •    Secure data backup and archiving

      Data security end-to-end

      •    Data encrypted while in cloud storage environment

      •    Data decrypted, but still deidentified and obfuscated where appropriate, in data analytics pipeline on-premise

      Wearable support that is scalable and secure

      •    Precreation of wearable device accounts

      •    Wearable cloud accounts deidentified using study ID

      •    Wearable data automatically encrypted with user’s password

      •    Server-less functions to periodically collect and archive user data

      Infrastructure, scale, and operational security

      •    Two-factor authentication for all participants, including certificate and credential authentication

      •    Rotating credentials

      •    Data collection dashboard

      •    HOPES work/ticket queue for monitoring alerts/logs/events

      •    Distributed Denial-of-Service and web application firewall protection

      •    Elastic scale at all levels

      •    Isolation of functions across private virtual private local area network

      •    Separation of administrative and data upload interfaces

      •    Private virtual private network for administration

      •    Separation of data upload application programming interface and data management

      •    Restricted access controls

      •    Automated repeatable deployment

      Data analytics

      •    Data downloaded on-premise into secure workspace for analytics or clinical use

      •    Multistage analytics processing pipeline

      •    Anomaly detection dashboard

      •    Data exploration dashboard

     https://www.jmir.org/2021/3/e23984                                                                           J Med Internet Res 2021 | vol. 23 | iss. 3 | e23984 | p. 5
                                                                                                                                (page number not for citation purposes)
XSL• FO
RenderX
JOURNAL OF MEDICAL INTERNET RESEARCH Wang et al
Security standards
• Secure development process
• Automated patching
• Additional requirements from Singapore security and Information Technology standards
Expanded data collection support for social media metadata
• Support for deidentified metadata for WhatsApp text and audio/video messages on Android
• Phone text messages
Study clinical support for easy clinical management
• Daily deidentified data collection dashboard emailed to study researchers and clinicians to monitor study compliance
• Encrypted deidentified clinician dashboard accessible to clinicians
Certain variables, such as location, are also obfuscated at the
Overall System Architecture time of collection for privacy preservation. More details on the
The high-level solution architecture of HOPES, as used in the solution architecture are provided in the Multimedia Appendix
HOPE-S study, is shown in Figure 1. On each participant’s 1.
smartphone, we installed two apps: the Fitbit app and the
HOPES app. Every participant was required to wear a Fitbit For backend R&D analytics, we developed a set of data
watch for a certain portion of the day and night (enough to processing pipelines and various dashboards for monitoring,
collect the required data but also allowing removal for charging, visualizing, and analyzing data (Figure 2). The data processing
showering, etc). Fitbit raw data are collected by the Fitbit app pipelines clean (manage missing, duplicated, and erroneous
and sent to a Fitbit server (the Fitbit Cloud) for processing and data), convert, and reorganize data into more usable forms.
computation of high-level features (eg, the estimation of sleep These dashboards are used by research coordinators and
stages). Phone data are collected on the smartphone by the clinicians, researchers, data analysts, and technical team
HOPES app and sent to a data upload server hosted in a public members involved in the conduct of the study. A
cloud using Amazon Web Services (AWS). The data processing general-purpose research dashboard supports exploratory
backend server, located at either the Research and Development analytics. In each case, roles and responsibilities determine the
(R&D) or clinical premises, periodically pulls data from both access controls for various attributes of the data. Physical
the Fitbit cloud and the AWS data upload server for subsequent controls, supervision, and accountability measures were also
processing, as described in the following sections. The data are deployed to ensure that there was no unauthorized access to
always deidentified when in a publicly accessible cloud data. Further description is given in subsequent sections and
environment, and all transmissions and storage are encrypted. more details are provided in the Multimedia Appendix 1.
Figure 1. Overall system architecture and data flow diagram for the Health Outcomes via Positive Engagement in Schizophrenia (HOPE-S) study.
https://www.jmir.org/2021/3/e23984 J Med Internet Res 2021 | vol. 23 | iss. 3 | e23984 | p. 6
(page number not for citation purposes)
XSL• FO
RenderXJOURNAL OF MEDICAL INTERNET RESEARCH Wang et al
Figure 2. Backend data processing pipelines and dashboards.
hint of their neuropsychological function [33]; for example, a
Features Supported by the Platform fatigued person may tap more slowly or some diseases may
The following 6 categories of features are obtained from the cause small, uncontrollable movements. There is also some
HOPES smartphone app. In each case, we will indicate new if evidence that finger taps may be used to detect depression [34].
it is a new feature added by us or an enhancement, otherwise, The apps a person uses (determined from their taps) may also
it is an existing feature in the Beiwe distribution. give an indication of their status and behavior. For example, a
patient with a mental illness who is relapsing might be found
Location
to have significantly altered communications, reflected in the
GPS coordinates are used to detect deviations from typical travel number and speed of taps made in the various apps. We sought
patterns and to compute a measure of variance or entropy in the to capture typing error rates that could be affected by physical
locations visited by a participant. To protect user privacy, the or mental conditions. We can determine this from how often
raw GPS coordinates are obfuscated via a random displacement the delete or backspace key on the keyboard is tapped. To
(from the origin), which is unique for every participant. measure tapping speed, we also need to know whether the person
Sociability Indices (Some Are New) is typing on the keyboard or navigating in a social messaging
app. The characteristics and metadata of finger taps on the phone
In our study, changes in a participant’s sociability, that is, their
screen were recorded, such as the number and timestamps of
communication with others, is estimated from available data.
taps into apps, different key strokes (from the enter key, delete
Sociability may be reflected in their activities in various forms
key, backspace key, alphabet keys, number keys, and
of messaging and voice/video communications. The original
punctuation keys), and the group categorization of the tapped
Beiwe app can capture incoming and outgoing phone calls and
apps are also recorded. As a privacy-preservation measure,
SMS messages. However, in many countries, most people use
captured keystrokes are converted into a type token (such as
free social messaging apps as their primary method for text and
alphabetic, numerical, and punctuation). The app only stores
voice communication; for example, in Singapore WhatsApp
and downloads the type token, and the specific keys that are
use is dominant. We therefore made use of the Android
struck are not recorded.
Accessibility Service Application Programming Interface (API)
to acquire message metadata from social messaging apps. So Motion Information (Some Are New)
far, we have only implemented this for WhatsApp, but it can Accelerometer, gyroscope, magnetometer (new), and pedometer
be easily extended to other social messaging apps. The duration (new) data are recorded to check whether the phone is being
and timing of mobile service phone calls and WhatsApp calls moved or is motionless. This information can help determine
made and received were recorded. Similarly, the length and the amount of phone use and can be correlated with other data
timing of SMS and WhatsApp messages sent and received were collected by wearable devices (sleep, activity, etc).
also recorded. Importantly, for privacy protection, we never
record or transmit any content of any communication, and we Phone States
hash the identity or contact number of the counterparty. The app can record the Wi-Fi state, the Bluetooth state, and the
power state (screen on/off and power-down event) of the phone.
Finger Taps (New)
The Wi-Fi and Bluetooth scan results can, to some extent,
Taps provide two types of information that may be related to a provide information about the location of the device, especially
person’s health. The speed at which a person taps may give a when the GPS location is not available. However, these data
https://www.jmir.org/2021/3/e23984 J Med Internet Res 2021 | vol. 23 | iss. 3 | e23984 | p. 7
(page number not for citation purposes)
XSL• FO
RenderXJOURNAL OF MEDICAL INTERNET RESEARCH Wang et al
are sensitive and need to be deidentified and encrypted. The tools, games, and Android systems (other vendor-specific or
power state feature is usually combined with other features, system apps that cannot be found in the Play Store). This class
such as taps, to determine the usage behavior of the phone by information is used in the taps data features when classifying a
the participant. user’s phone activity (eg, in social media apps, in gaming apps,
etc). In summary, this step bridges the gap between data
Ambient Light (New) collection and common downstream machine learning modules.
The app can record the intensity of ambient light through the Details on the data processing pipeline, high-level feature
smartphone’s built-in light sensor (not the camera). This could extraction, and the seven classes of the app grouper are provided
detect, for example, whether a participant goes out or sleeps in in the Multimedia Appendix 1.
a comfortable sleeping environment; studies have suggested a
correlation between a patient’s mental health and their preferred We note that although we endeavor to correct ambiguities in
environmental lighting [35]. As sleep and heart rate are the data collected by the platform (such as in the example above
important indicators of mental health status, we recorded the clarifying truly sleepless nights), we do not make efforts to
following 3 categories of features from the Fitbit wearable impute missing data. Imputation is required for certain analyses,
(obtained directly from the Fitbit cloud). such as those involving GPS measurements [36]. However, it
should be noted that the best imputation method depends on the
Sleep goals of a particular study.
Sleep information during the day and night was recorded, We are also aware that features that are provided by device
including a breakdown of different sleep stages with time manufacturers, such as the pedometer, heart rate, and sleep, are
stamps. derived using proprietary algorithms that are likely to change
Steps over time and are not standardized, nor typically scientifically
The total number of steps in time intervals specified by Fitbit. validated. These features may contain biases or inaccuracies
that can affect subsequently trained statistical models. Therefore,
Heart Rate our existing data processing pipeline is designed to be flexible
The number of heartbeats in time intervals specified by Fitbit. enough for researchers to insert on-demand additional steps for
Approximations of other measures of interest, such as heart rate data normalization and regularization.
variability, can be computed from heart rate data.
For the HOPE-S study, we captured the following features:
Platform Improvements
location, sociability indices, finger taps, accelerometer, power We have made many improvements to the Android app and are
state, ambient light, sleep, steps, and heart rate. in the process of extending these improvements to the iOS app.
Backend Data Processing Pipeline In this section, we will only describe the most significant
improvements; other improvements are provided in the
We have rebuilt the BBS backend in Python 3 to systematically Multimedia Appendix 1. We also used two system variations:
process data files, reformat the raw data, and extract high-level the prototype or development system and the deployed system.
features. A considerable amount of feature engineering is being Some features may be applied to only one of the systems.
performed on the backend to clean the data, correct data
shortcomings, combine different data sources into joint features, Scanning Quick Response Codes for Simple User
and feed various downstream machine learning systems. For Registration
example, upon consultation with our clinical partners, we To facilitate the user registration process and to allow one-way
constructed high-level features that are likely to provide useful encryption for better data security, study participant kits were
signals regarding the mental health of the participants in the prepared and a single-page onboarding document was generated
HOPE-S study. Our current analyses in the study make use of with all the information necessary to onboard a participant. The
time series of daily or hourly samples of intuitively identified process was designed for a nontechnical self-service onboarding
measurements from sleep, steps, heart rate, location, and process. Multiple Quick Response (QR) codes were scanned in
sociability indices. Some examples include daily totals of the the deployed system. They include information on
number of hours of sleep, steps, and communications initiated certificate-based authentication to further strengthen security
and received. Constructing such features is often necessary in via host verification. The Additional App Enhancement Section
situations with small amounts of or noisy data. For example, of the Multimedia Appendix 1 provides details on QR
when no sleep data are recorded by the Fitbit for a whole day, registration.
it is not clear whether the participant did not sleep or whether
they just did not wear the Fitbit to bed. We can resolve this Data Compression
ambiguity by looking at the heart rate measurements, which are To scale the system up to a very large number of users, we need
recorded continually while the Fitbit is worn. If heart rate data to reduce the utilized communication bandwidth as much as
are missing for more than an allotted allowance, we can possible. We have therefore added an option when creating a
reasonably assume that the participant was not wearing the Fitbit study to compress the data before sending it to the server, which
during sleep. As another example, we have developed an may be selected on the backend console by checking the enable
Android app grouper that uses information from the Google compression checkbox. Note that data compression is applied
Play Store to classify all apps into 7 classes defined by us: social
messenger, social media, entertainment, map navigation, utility
https://www.jmir.org/2021/3/e23984 J Med Internet Res 2021 | vol. 23 | iss. 3 | e23984 | p. 8
(page number not for citation purposes)
XSL• FO
RenderXJOURNAL OF MEDICAL INTERNET RESEARCH Wang et al
before data encryption. This feature was only implemented in technical failures, participants not adhering to the guidelines
the prototype system. on device usage, or participants failing to wear their device.
Monitoring this process is particularly challenging at scale.
Security Enhancements Therefore, we created a data collection dashboard (Figure 3)
The HOPES platform is redesigned on top of Beiwe to ensure to facilitate the monitoring of the data collected.
data confidentiality, data integrity, and high availability, and to
enable system auditing and user authentication. The design also The data collection dashboard is populated using the metadata
supports large-scale deployments with a distributed pipeline. extracted during the downloading phase of the Fitbit and phone
Finally, the design emphasizes a separation of these duties data. The AWS Lambda function (which is set to trigger every
throughout the architecture to minimize the risk of data breaches 5 minutes) is set up to retrieve these data from their respective
and to preserve data privacy throughout the lifecycle of a study. S3 buckets and create an HTML file. To fill the dashboard to
In the original Beiwe platform, data are decrypted in the data ensure that the participants comply with the study requirements,
collection server and re-encrypted using the study key. This the following data types are observed and closely monitored:
poses a certain amount of risk because the data collection server location, sociability, taps in app, last HOPES upload, last Fitbit
directly faces the public internet. In our HOPES platform, data upload, and sleep. Color codes denote the data collection status:
are encrypted at all times while on the phone and in the data red meaning need to take an action, orange meaning need to
collection infrastructure and are only decrypted in clinical or closely monitor, and green meaning normal.
R&D premises. The decryption key is only accessible from The data collection dashboard does not require decrypted data
clinical or R&D premises; therefore, in principle, the data are and is thus constructed before decryption. As a result, it can be
not decryptable on the phone or in the data collection hosted on an upload server with little security risk. However,
infrastructure. Data are only reidentified when needed for it does not show the full historical data completion status, which
qualified clinical purposes and only by clinical staff. is sometimes needed. Hence, we developed the data completion
dashboard, which is described in detail in the Multimedia
Dashboards, User Interfaces, and Data Appendix 1.
Analysis
Ensuring complete data collection is important. A variety of
issues can result in not receiving data as expected, including
Figure 3. The data collection dashboard shows the data uploading status of all participants.
Clinician Dashboard
Data Visualization Toolkit
The clinician dashboard, illustrated in Figure 4, is designed for
We developed a data visualization toolkit to visualize and
clinicians to preview general trends in participants’ digital
explore the collected data. The toolkit can also perform some
phenotyping data and may be useful during clinical encounters.
basic statistical analyses, such as the comparison of features
On the basis of previous studies and the observations of our
between defined date ranges. For further details on the usage
clinical partners, we decided to report sleep, sociability, and
and capability of the data visualizer, see the Multimedia
mobility data for the current version of the clinician dashboard.
Appendix 1.
https://www.jmir.org/2021/3/e23984 J Med Internet Res 2021 | vol. 23 | iss. 3 | e23984 | p. 9
(page number not for citation purposes)
XSL• FO
RenderXJOURNAL OF MEDICAL INTERNET RESEARCH Wang et al
Figure 4. The clinician dashboard shows a preview of general trends in patient biomarker data.
Sleep is plotted based on total sleep duration and sleep We have experimented with several time-series models,
efficiency; the latter is depicted by color. Sociability is plotted including the broad class of autoregressive integrated moving
using the number of messages exchanged and the number of average models [37] and the class of Gaussian processes [38],
calls for a duration of more than 1 minute. Mobility is based on fitting them to a subset of digital phenotyping features that were
the time away from home (time spent away from sleeping initially selected as important for our HOPE-S study (see the
location) and the radius of gyration (maximum distance traveled Multimedia Appendix 1 for details of the features). We note
from home). These graphs are drawn based on averages over 3 that these two choices of models are able to capture periodic
timeframes: the current week is 7 days before 0:00 AM of the effects, which are important for our HOPE-S study, as
current day, the past week is 7 days before the current week, participants’ behaviors may change markedly on the weekends.
and the past month is 30 days before the past week. An example Selecting the most appropriate model depends on the data and
further explaining the clinician dashboard can be found in the the application at hand. We train the models every day on all
Multimedia Appendix 1. past data and compute the predictions of the digital phenotyping
features for the next day. At the end of the following day, the
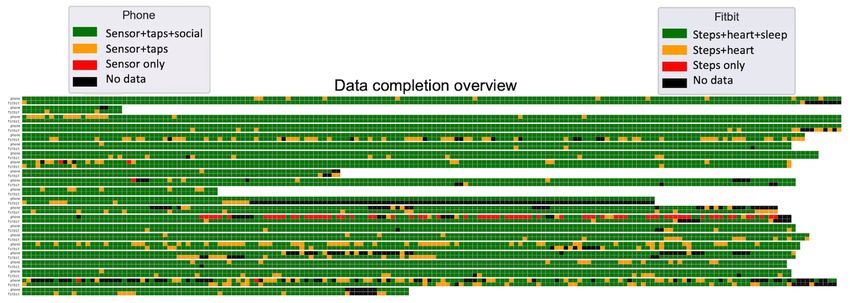
Anomaly Detection Dashboard realized digital phenotyping features were compared with the
To support a wide variety of applications attempting to analyze predictions and scored, and these scores were transformed to
and identify interesting changes among the many features being be interpreted as the probability that the observed data is an
collected by the platform, we implemented a generic purpose anomaly. Therefore, the final score is a number between zero
anomaly detection system and dashboard. The system comprises and one, where higher values constitute alerts.
several anomaly detection algorithms on the backend that report
their findings via a dashboard. The dashboard is designed to In Figure 5, we display an example of what the anomaly
create alerts about possible irregularities arising in the digital detection dashboard looks like on a given day. Each row
phenotyping data each day. corresponds to a participant, and each column corresponds to
a different anomaly detection score. The participant’s identifier
There are many machine learning approaches to anomaly and the last date their scores were successfully updated are
detection in time-series data. One approach is to train a displayed, along with the anomaly scores for each feature. The
time-series model on historical data and compare new data with score from a multivariate model is also displayed, which may
forecasts from this model, scoring the predictions based on how capture interdependencies between features that affect whether
good or bad they are. For example, a simple scoring mechanism a measurement is anomalous. For example, major disruptions
compares the empirical distribution of the residuals (ie, the in sleep naturally coincide with periods of long-distance travel
errors of the fitted model’s predictions on the training set) to (a large radius of gyration). Note that the cells are colored
the realized prediction error on new data. according to the severity of the scores.
https://www.jmir.org/2021/3/e23984 J Med Internet Res 2021 | vol. 23 | iss. 3 | e23984 | p. 10
(page number not for citation purposes)
XSL• FO
RenderXJOURNAL OF MEDICAL INTERNET RESEARCH Wang et al
Figure 5. The anomaly detection dashboard with a visualization of the scores from a collection of anomaly detection models.
Although this dashboard is mainly used for research at this had their Fitbit wrist bands broken in the middle of the study,
point, if reliable anomalies are detected, they can be promoted and while waiting for the replacement band to arrive, they were
to the clinician dashboard. In the context of our HOPE-S study, unable to wear the device).
it was shown that digital phenotyping signals from patients with
Table 1 shows the data completion rates for each low-level
schizophrenia exhibit a measurable increase in anomalies in the
feature. The rate is computed as the number of days with feature
period leading up to a relapse event [11]. However, as an
data divided by the number of days enrolled in the study. For
unsupervised learning problem, the performance of an anomaly
phone features such as call log and SMS log, which can have
detection routine is dependent on the context of its application,
no data if the participant really has no call/SMS during that day,
and users will likely have to adjust the underlying algorithm to
we checked the presence of empty, time stamped feature files
suit their needs. Therefore, we made the dashboard modular,
stored by the platform to determine whether that feature is being
where the anomaly detection routine can be replaced on the
successfully collected. Our researchers and clinical partners
backend with customized routines without affecting its exposure
generally felt that the overall completion rate was satisfactory.
to the user-facing dashboard.
Figure 6 provides a dynamic, graphical overview of the data
Example Analyses completeness for each participant. Each participant had 2 rows
in the display: the first for their phone features and the second
Data Completion Rate Analysis for their wrist device features. Each square represents the
The completeness of the data collected in the HOPE-S study completion status for a single day (refer to the legend for
depends on the technical stability of the platform and participant information on color coding). This dashboard has proven
compliance. There will always be situations that are difficult to valuable to our researchers and clinical partners when following
anticipate and can cause losses of data (eg, a few participants up with study participants to improve compliance and to quickly
resolve any technical issues that may arise.
https://www.jmir.org/2021/3/e23984 J Med Internet Res 2021 | vol. 23 | iss. 3 | e23984 | p. 11
(page number not for citation purposes)
XSL• FO
RenderXJOURNAL OF MEDICAL INTERNET RESEARCH Wang et al
Table 1. Data completion rate on 22 participants that have completed the study.
Raw feature name Data completion rate (%)
Accel 87.0
Call log 94.6
Power state 94.3
Sociability call log 94.6
Accessibility log 87.2
GPS 93.0
Sleep 87.1
Sociability msg log 94.6
Ambient light 91.3
Heart 93.5
SMS log 94.6
Steps 96.9
Taps log 89.7
Overall 92.2
Figure 6. Data completion overview for the first 22 participants who have already completed the study (odd rows refer to phone data; even rows refer
to Fitbit data).
Table 2 shows a subset of features that show statistically
Example of Use: Measuring the Effect of Singapore’s significant differences before and after the CB began on April
Circuit Breaker 7, 2020. Not surprisingly, as people were required to stay at
In response to the SARS-CoV-2 (COVID-19) pandemic, home, the time at home has increased, and the number of
Singapore imposed a stay-at-home order or cordon sanitaire, significant locations visited has decreased. Features related to
which is formally called the 2020 Singapore Circuit Breaker physical activity (heart rate, steps, and acceleration) also
measures or CB. This lockdown was in effect from April 7, decreased, as might be expected. Both sleep and sleep efficiency
2020 to June 1, 2020, after which gradual stages of reopening decreased among these participants. It is also noteworthy that
have occurred. During this period, people were required to stay participants appear to use a fewer number of apps, perhaps
at home as much as possible, avoid nonessential travel and because there is no need for some apps such as maps for
social visits, and maintain social distancing in public. We expect navigation or those checking bus arrival times; however, it
the lockdown to have an effect on some digital phenotyping appears that they spend more time in entertainment apps.
features. As a test for our digital phenotyping system, we Moreover, the ambient light indoors is generally dimmer than
performed and reported a data comparison using 22 participants’ it is outdoors, therefore, the observed decrease in maximum
data before and after the start of this CB. ambient light is also as expected.
https://www.jmir.org/2021/3/e23984 J Med Internet Res 2021 | vol. 23 | iss. 3 | e23984 | p. 12
(page number not for citation purposes)
XSL• FO
RenderXJOURNAL OF MEDICAL INTERNET RESEARCH Wang et al
Table 2. Comparison of 6 weeks of digital phenotyping data before (from 45 days before to 3 days before) and after (from 3 days after to 45 days after)
the start of Singapore’s Circuit Breaker on April 7, 2020.
Feature name 6-week before CBa starts, 6-week after CB P value (paired P value (Wilcoxon signed
mean (SD) starts, mean (SD) t test) rank test)
Smartphone features
accel_L_std (L: length of the accel. vector) 0.526 (0.325) 0.370 (0.345)JOURNAL OF MEDICAL INTERNET RESEARCH Wang et al
Conflicts of Interest
None declared.
Multimedia Appendix 1
Further technical documentation on the solution architecture, App enhancements, added digital phenotyping sensors and features,
the system’s Fitbit component, the back-end data processing pipeline, and the dashboards.
[DOCX File , 7556 KB-Multimedia Appendix 1]
References
1. Marsch LA. Digital health data-driven approaches to understand human behavior. Neuropsychopharmacology 2020 Jul
12;1(6) Published online ahead of print. [doi: 10.1038/s41386-020-0761-5]
2. McGinnis JM, Williams-Russo P, Knickman JR. The Case For More Active Policy Attention To Health Promotion. Health
Affairs 2002 Mar;21(2):78-93. [doi: 10.1377/hlthaff.21.2.78]
3. Schroeder SA. Shattuck Lecture. We can do better--improving the health of the American people. N Engl J Med 2007 Sep
20;357(12):1221-1228. [doi: 10.1056/NEJMsa073350]
4. Onnela J. Opportunities and challenges in the collection and analysis of digital phenotyping data. Neuropsychopharmacology
2020 Jul 17;46:45-54. [doi: 10.1038/s41386-020-0771-3]
5. Torous J, Kiang MV, Lorme J, Onnela J. New Tools for New Research in Psychiatry: A Scalable and Customizable Platform
to Empower Data Driven Smartphone Research. JMIR Ment Health 2016 May 05;3(2):e16 [FREE Full text] [doi:
10.2196/mental.5165] [Medline: 27150677]
6. National Steps Challenge. URL: https://www.healthhub.sg/programmes/37/nsc [accessed 2020-08-19]
7. Waddell KJ, Shah PD, Adusumalli S, Patel MS. Using Behavioral Economics and Technology to Improve Outcomes
in Cardio-Oncology. JACC: CardioOncology 2020;2(1):84-96. [doi: 10.1016/j.jaccao.2020.02.006]
8. Cote DJ, Barnett I, Onnela J, Smith TR. Digital Phenotyping in Patients with Spine Disease: A Novel Approach to Quantifying
Mobility and Quality of Life. World Neurosurgery 2019;126:e241-e249. [doi: 10.1016/j.wneu.2019.01.297]
9. Wright AA, Raman N, Staples P, Schonholz S, Cronin A, Carlson K, et al. The HOPE Pilot Study: Harnessing
Patient-Reported Outcomes and Biometric Data to Enhance Cancer Care. JCO Clin Cancer Inform 2018;2:1-12. [doi:
10.1200/CCI.17.00149]
10. Saeb S, Zhang M, Kwasny MM, Karr CJ, Kording K, Mohr DC. Mobile Phone Sensor Correlates of Depressive Symptom
Severity in Daily-Life Behavior: An Exploratory Study. Journal of Medical Internet Research 2015 Jul 15;17(7):e175. [doi:
10.2196/jmir.4273]
11. Meyer N, Kerz M, Folarin A, Joyce DW, Jackson R, Karr C, et al. Capturing Rest-Activity Profiles in Schizophrenia Using
Wearable and Mobile Technologies: Development, Implementation, Feasibility, and Acceptability of a Remote Monitoring
Platform. JMIR Mhealth Uhealth 2018 Oct 30;6(10):e188. [doi: 10.2196/mhealth.8292]
12. Barnett I, Torous J, Staples P, Sandoval L, Keshavan M, Onnela J. Relapse prediction in schizophrenia through digital
phenotyping: a pilot study. Neuropsychopharmacology 2018 Jul;43(8):1660-1666. [doi: 10.1038/s41386-018-0030-z]
13. Mindstrong Health. URL: https://mindstronghealth.com/ [accessed 2020-08-19]
14. Lief Therapeutics. URL: https://getlief.com/ [accessed 2020-08-19]
15. QuantActions. URL: https://quantactions.com/ [accessed 2020-08-19]
16. Jaimini U, Thirunarayan K, Kalra M, Venkataraman R, Kadariya D, Sheth A. “How Is My Child’s Asthma?” Digital
Phenotype and Actionable Insights for Pediatric Asthma. JMIR Pediatr Parent 2018;1(2):e11988. [doi: 10.2196/11988]
17. Faherty LJ, Hantsoo L, Appleby D, Sammel MD, Bennett IM, Wiebe DJ. Movement patterns in women at risk for perinatal
depression: use of a mood-monitoring mobile application in pregnancy. J Am Med Inform Assoc 2017;24(4):746-753. [doi:
10.1093/jamia/ocx005]
18. Spinazze P, Bottle A, Car J. Digital Health Sensing for Personalized Dermatology. Sensors 2019 Aug 05;19(15):3426. [doi:
10.3390/s19153426]
19. Oura Ring. URL: https://ouraring.com/ucsf-tempredict-study [accessed 2020-08-19]
20. Hemphill NM, Kuan MT, Harris KC. Reduced Physical Activity During COVID-19 Pandemic in Children With Congenital
Heart Disease. Canadian Journal of Cardiology 2020 Jul;36(7):1130-1134. [doi: 10.1016/j.cjca.2020.04.038]
21. Lee XK, Chee NI, Ong JL, Teo TB, van Rijn E, Lo JC, et al. Validation of a Consumer Sleep Wearable Device With
Actigraphy and Polysomnography in Adolescents Across Sleep Opportunity Manipulations. Journal of Clinical Sleep
Medicine 2019 Sep 15;15(09):1337-1346. [doi: 10.5664/jcsm.7932]
22. Clinicaltrials.gov. URL: https://clinicaltrials.gov/ct2/show/NCT04230590 [accessed 2020-08-19]
23. Beiwe Research Platform. URL: https://www.beiwe.org/ [accessed 2020-08-19]
24. Onnela-lab. URL: https://github.com/onnela-lab [accessed 2020-08-19]
25. Schueller SM, Begale M, Penedo FJ, Mohr DC. Purple: a modular system for developing and deploying behavioral
intervention technologies. J Med Internet Res 2014 Jul 30;16(7):e181 [FREE Full text] [doi: 10.2196/jmir.3376] [Medline:
25079298]
https://www.jmir.org/2021/3/e23984 J Med Internet Res 2021 | vol. 23 | iss. 3 | e23984 | p. 14
(page number not for citation purposes)
XSL• FO
RenderXJOURNAL OF MEDICAL INTERNET RESEARCH Wang et al
26. Purple Robot - CBITs TECH Web Site. URL: https://tech.cbits.northwestern.edu/purple-robot/ [accessed 2020-08-19]
27. cbitstech/Purple-Robot. URL: https://github.com/cbitstech/Purple-Robot [accessed 2020-08-19]
28. AWARE: Open-source Context Instrumentation Framework For Everyone. URL: https://awareframework.com [accessed
2020-08-19]
29. Aware Framework. URL: https://github.com/awareframework [accessed 2020-08-19]
30. Matcham F, Barattieri di San Pietro C, Bulgari V, de Girolamo G, Dobson R, Eriksson H, et al. Remote assessment of
disease and relapse in major depressive disorder (RADAR-MDD): a multi-centre prospective cohort study protocol. BMC
Psychiatry 2019 Feb 18;19(1):72. [doi: 10.1186/s12888-019-2049-z]
31. RADAR-base. URL: https://github.com/RADAR-base [accessed 2020-08-19]
32. RADAR-CNS. URL: https://www.radar-cns.org [accessed 2020-08-19]
33. Dagum P. Digital biomarkers of cognitive function. npj Digital Med 2018 Mar 28;1(1):00-00. [doi:
10.1038/s41746-018-0018-4]
34. Insel TR. Digital Phenotyping: Technology for a New Science of Behavior. JAMA 2017 Oct 03;318(13):1215-1216. [doi:
10.1001/jama.2017.11295] [Medline: 28973224]
35. LeGates TA, Fernandez DC, Hattar S. Light as a central modulator of circadian rhythms, sleep and affect. Nat Rev Neurosci
2014 Jul;15(7):443-454 [FREE Full text] [doi: 10.1038/nrn3743] [Medline: 24917305]
36. Barnett I, Jukka-Pekka O. Inferring mobility measures from GPS traces with missing data. Biostatistics 2020
Apr;21(2):e98-e112. [doi: 10.1093/biostatistics/kxy059]
37. Box GEP, Jenkins GM, Reinsel GC, Ljung GM. Time Series Analysis: Forecasting and Control. 5th ed. Hoboken, New
Jersey: John Wiley & Sons; 2015.
38. Rasmussen C, Williams C. Gaussian Processes For Machine Learning. Cambridge, Mass: MIT Press; 2008.
39. Ong J, Lau T, Massar S. COVID-19 Related Mobility Reduction: Heterogenous Effects on Sleep and Physical Activity
Rhythms. ArXiv Preprint 2006:00-00 (forthcoming).
Abbreviations
API: Application Programming Interface
AWS: Amazon Web Services
CB: circuit breaker
HOPES: Health Outcomes through Positive Engagement and Self-Empowerment
HOPE-S: Health Outcomes via Positive Engagement in Schizophrenia
iOS: iPhone Operating System
QR: Quick Response
R&D: Research and Development
Edited by G Eysenbach; submitted 31.08.20; peer-reviewed by JP Onnela, S Mukherjee; comments to author 10.10.20; revised version
received 04.12.20; accepted 18.01.21; published 15.03.21
Please cite as:
Wang X, Vouk N, Heaukulani C, Buddhika T, Martanto W, Lee J, Morris RJT
HOPES: An Integrative Digital Phenotyping Platform for Data Collection, Monitoring, and Machine Learning
J Med Internet Res 2021;23(3):e23984
URL: https://www.jmir.org/2021/3/e23984
doi: 10.2196/23984
PMID: 33720028
©Xuancong Wang, Nikola Vouk, Creighton Heaukulani, Thisum Buddhika, Wijaya Martanto, Jimmy Lee, Robert JT Morris.
Originally published in the Journal of Medical Internet Research (http://www.jmir.org), 15.03.2021. This is an open-access article
distributed under the terms of the Creative Commons Attribution License (https://creativecommons.org/licenses/by/4.0/), which
permits unrestricted use, distribution, and reproduction in any medium, provided the original work, first published in the Journal
of Medical Internet Research, is properly cited. The complete bibliographic information, a link to the original publication on
http://www.jmir.org/, as well as this copyright and license information must be included.
https://www.jmir.org/2021/3/e23984 J Med Internet Res 2021 | vol. 23 | iss. 3 | e23984 | p. 15
(page number not for citation purposes)
XSL• FO
RenderXYou can also read