Global CO2 emissions from cement production
←
→
Page content transcription
If your browser does not render page correctly, please read the page content below
Earth Syst. Sci. Data, 10, 195–217, 2018
https://doi.org/10.5194/essd-10-195-2018
© Author(s) 2018. This work is distributed under
the Creative Commons Attribution 4.0 License.

                 Global CO2 emissions from cement production
                                                      Robbie M. Andrew
                           CICERO Center for International Climate Research, Oslo 0349, Norway
                           Correspondence: Robbie M. Andrew (robbie.andrew@cicero.oslo.no)

                                    Received: 19 July 2017 – Discussion started: 23 August 2017
                      Revised: 22 November 2017 – Accepted: 22 November 2017 – Published: 26 January 2018

       Abstract. The global production of cement has grown very rapidly in recent years, and after fossil fuels and
       land-use change, it is the third-largest source of anthropogenic emissions of carbon dioxide. The required data
       for estimating emissions from global cement production are poor, and it has been recognised that some global
       estimates are significantly inflated. Here we assemble a large variety of available datasets and prioritise official
       data and emission factors, including estimates submitted to the UNFCCC plus new estimates for China and India,
       to present a new analysis of global process emissions from cement production. We show that global process
       emissions in 2016 were 1.45 ± 0.20 Gt CO2 , equivalent to about 4 % of emissions from fossil fuels. Cumulative
       emissions from 1928 to 2016 were 39.3 ± 2.4 Gt CO2 , 66 % of which have occurred since 1990. Emissions in
       2015 were 30 % lower than those recently reported by the Global Carbon Project. The data associated with this
       article can be found at https://doi.org/10.5281/zenodo.831455.

1   Introduction                                                   heat. Stoichiometry directly indicates how much CO2 is re-
                                                                   leased for a given amount of CaO produced. Recent estimates
                                                                   are that these so-called “process” emissions contribute about
Anthropogenic emissions of carbon dioxide to the atmo-             5 % of total anthropogenic CO2 emissions excluding land-
sphere come from three main sources: (i) oxidation of fos-         use change (Boden et al., 2017). The second source of emis-
sil fuels, (ii) deforestation and other land-use changes, and      sions is the combustion of fossil fuels to generate the sig-
(iii) carbonate decomposition. Cement – the largest source of      nificant energy required to heat the raw ingredients to well
emissions from the decomposition of carbonates – is a bind-        over 1000 ◦ C, and these “energy” emissions, including those
ing material that has been used since ancient times. But it was    from purchased electricity, could add a further 60 % on top of
following World War II that the production of cement accel-        the process emissions (IEA, 2016). Total emissions from the
erated rapidly worldwide, with current levels of global pro-       cement industry could therefore contribute as much as 8 %
duction equivalent to more than half a tonne per person per        of global CO2 emissions. These process (sometimes called
year (Fig. 1). Global cement production has increased more         “industry” or “industrial process”) and energy emissions are
than 30-fold since 1950 and almost 4-fold since 1990, with         most often reported separately in global emissions invento-
much more rapid growth than global fossil energy production        ries (Le Quéré et al., 2016, 2017; IPCC, 2006).
in the last 2 decades. Since 1990 this growth has largely been        The Global Carbon Project annually publishes estimates of
because of rapid development in China where cement pro-            global emissions of CO2 from the use of fossil fuels and ce-
duction has grown by a factor of almost 12 such that 73 % of       ment production, and these estimates are used by the global
global growth in cement production since 1990 occurred in          carbon modelling community as part of the development of
China (van Oss, 2017).                                             the global carbon budget (Le Quéré et al., 2016, 2017). It is
   There are two aspects of cement production that result in       therefore important that the emissions estimates are as accu-
emissions of CO2 . The first is the chemical reaction involved     rate as possible. This emissions database covers all emissions
in the production of the main component of cement, clinker,        of CO2 resulting from the oxidation (not only energy use)
as carbonates (largely limestone, CaCO3 ) are decomposed           of fossil fuels, including those that occur in the IPCC sec-
into oxides (largely lime, CaO) and CO2 by the addition of

Published by Copernicus Publications.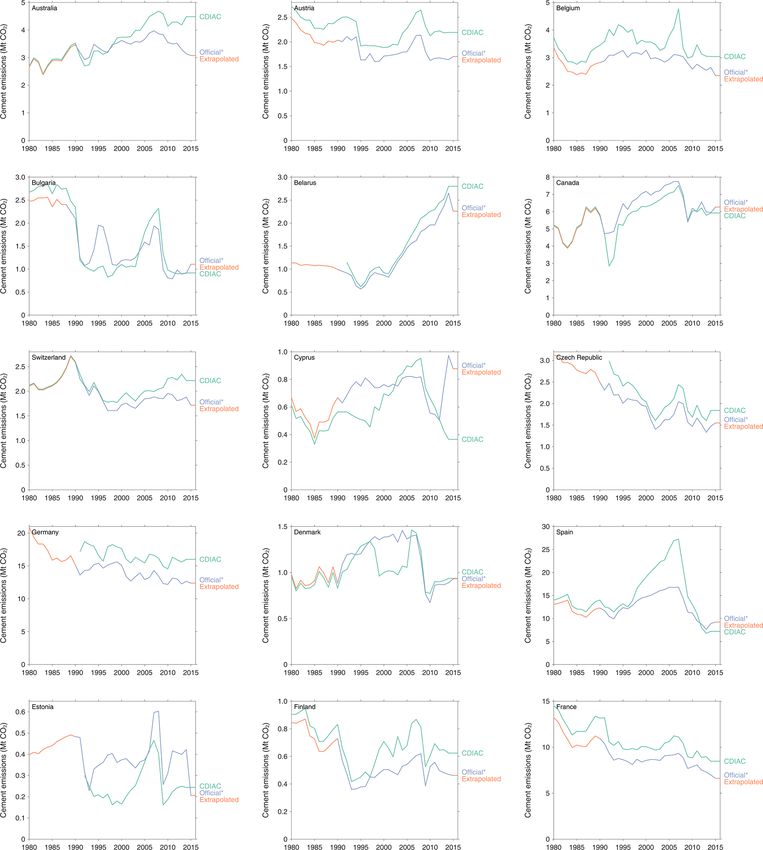
196                                                                R. M. Andrew: Global CO2 emissions from cement production

                                                                      1969 (Keeling, 1973). Using an average CaO content of
                                                                      cement of 64.1 %, Keeling’s emission factor was 0.50 t of
                                                                      CO2 (t cement)−1 , giving an estimate for emissions from ce-
                                                                      ment production in 1969 of 272 Mt. While both Keeling
                                                                      (1973) and Baxter and Walton (1970) cited Lea and Desch
                                                                      (1940) as the source for their estimates of the CaO content
                                                                      of cement, they nevertheless used different fractions. Impor-
                                                                      tantly, these fractions were assumed to be time invariant.
                                                                         Marland and Rotty (1984) presented further estimates
                                                                      for 1950–1982 using a global average CaO content of ce-
                                                                      ment of 63.8 % taken directly from US data for 1975.
                                                                      From this they derived a time-invariant emission factor of
                                                                      0.50 t CO2 (t cement)−1 .
Figure 1. Global cement and fossil energy production to 2016
(USGS, 2014; Mohr et al., 2015).
                                                                         The estimates made by Marland and Rotty (1984) com-
                                                                      bined with the earlier estimates of Keeling (1973) were
                                                                      included in the archive of the Carbon Dioxide Informa-
tor Industrial Processes and Product Use, such that including         tion Analysis Center (CDIAC) in 1984 (Rotty and Marland,
cement emissions means that the vast majority of CO2 emis-            1984). Later, CDIAC modified the cement emission factor
sions are covered.                                                    very slightly based on a study by Griffin (1987), who (in turn
   In this work we investigate the process emissions from ce-         based on Orchard, 1973) said that “the range of lime (CaO)
ment production, develop a new time series for potential use          content in cement is 60–67 %” and based on discussion with
by the Global Carbon Project, and present plans for future            experts recommended the use of 63.5 %, which was calcu-
continued updates, revisions, and development. The focus              lated as the midpoint of the range (Boden et al., 1995). This
on process emissions here is because both direct fossil fuel          time-invariant, global emission factor of about 0.50 was still
emissions and electricity emissions are already accounted for         in use in CDIAC’s 2016 data release.
in other parts of the global carbon budget.                              CDIAC’s method was directly adopted by the Intergov-
                                                                      ernmental Panel on Climate Change (IPCC) in their 1996
                                                                      guidelines (Haukås et al., 1997) for cases in which clinker
2   Previous estimates of global cement emissions                     production data were not available. The IPCC subsequently
                                                                      revised its methods for cases in which clinker production are
Early estimates of emissions from global cement production            not available in the 2006 guidelines (p. 2.8):
effectively assumed that almost all cement was of the ordi-              “(I)n the absence of data on carbonate inputs or national
nary Portland cement (OPC) type, which uses a very high               clinker production data, cement production data may be used
proportion of clinker and very small amounts of other ingre-          to estimate clinker production by taking into account the
dients, such as gypsum to control setting time. For at least the      amounts and types of cement produced and their clinker con-
first half of the 20th century this assumption was quite rea-         tents and including a correction for clinker imports and ex-
sonable, with the vast majority of cement being produced in           ports. Accounting for imports and exports of clinker is an
industrialised countries, which followed carefully developed          important factor in the estimation of emissions from this
and tested standards regarding strength and other important           source.”
qualities.                                                               In addition, the IPCC guidelines now recommend the use
   In 1970, Baxter and Walton presented estimates of global           of a default clinker ratio of 0.75 when it is known that signif-
CO2 emissions from fossil fuels and cement production for             icant amounts of blended cements are produced.
1860–1969 in which the “mean calcium oxide content of ce-                The Emissions Database for Global Atmospheric Re-
ments was taken to be 60 % . . . and the carbon content of            search (EDGAR) presents estimates of CO2 and other
limestone assumed to be 12 % with 100 % kilning efficiency.           climate-important gases by country. For cement they initially
Thus the . . . manufacture of 1 t of cement yields . . . 4.71 ×       used the emission factor from Marland and Rotty (1984) of
105 g of carbon dioxide . . . ” (i.e. 0.471 t CO2 (t cement)−1        0.50 t CO2 (t cement)−1 (Olivier et al., 1999). With the re-
(Baxter and Walton, 1970). Assuming that their estimate of            lease of version 4.1 of the database in 2010, they modified
global cement production in 1969 was the same as that re-             their emission factor to account for changing rates of blend-
ported by the USGS (USGS, DS140, etc.), their estimate of             ing (i.e. lower clinker ratios) in cement production in re-
emissions from cement production in 1969 would have been              sponse to work by the World Business Council for Sustain-
256 Mt CO2 .                                                          able Development (WBCSD), who released sample-based
   In a landmark paper of 1973, Charles Keeling presented             estimates of the clinker ratio in a range of countries (Anony-
a systematic analysis of emissions from fossil fuel com-              mous, 2010). In version 4.3.2, EDGAR used official esti-
bustion for 1860–1969 and cement production for 1949–                 mates from Annex I parties to the UNFCCC, specific clinker

Earth Syst. Sci. Data, 10, 195–217, 2018                                               www.earth-syst-sci-data.net/10/195/2018/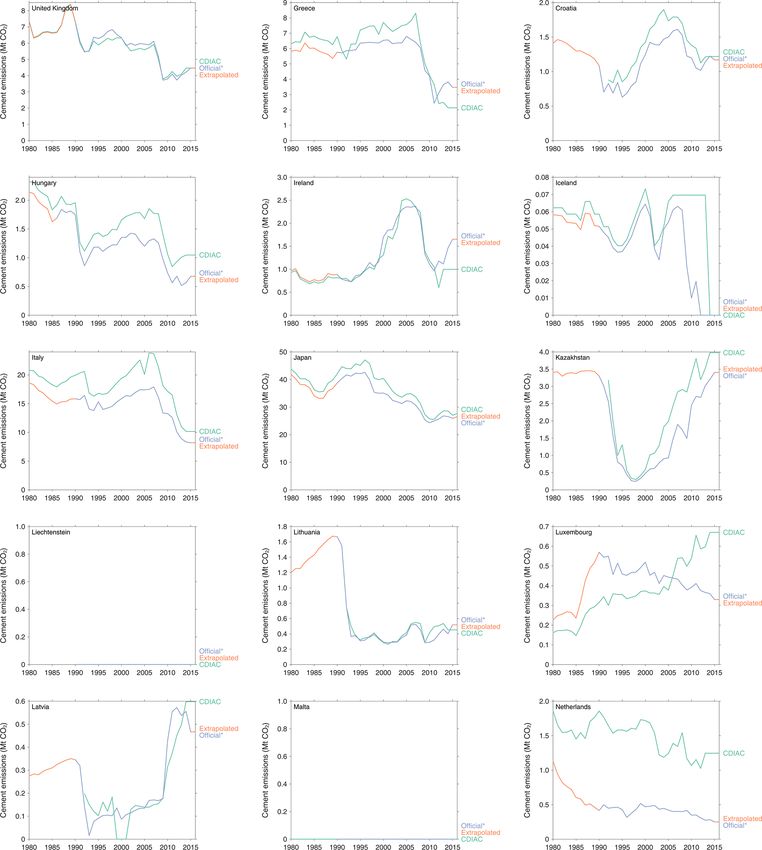
R. M. Andrew: Global CO2 emissions from cement production                                                                    197

production data for China, and the WBCSD database for all         donesia, Jamaica, Mexico, Moldova, Namibia, South Africa,
remaining countries (Olivier et al., 2016; Janssens-Maenhout      and Uzbekistan. In addition, Mauritania reports that all of its
et al., 2017). Since 2003, countries that are listed in Annex 1   clinker is imported.
of the UN Framework Convention on Climate Change (UN-                For China, which currently produces almost 60 % of
FCCC) have been required to submit annual inventories of          global cement, clinker production data are available from
greenhouse gas emissions in considerable detail, including        1990. China’s emission factor is reported by NDRC (2014) as
estimates of emissions from cement production (UNFCCC,            0.5383 t CO2 (t clinker)−1 , and this is used both in the second
2017). Other parties to the convention are requested to sub-      national communication (NDRC, 2012) and the first biennial
mit less detailed and less frequent national communications       update report (NDRC, 2016). Some studies have estimated
and, more recently, biennial update reports (BURs).               other emission factors based on factory-level sampling (Liu
                                                                  et al., 2015; Shen et al., 2014), but here we use the officially
                                                                  sanctioned factor until or unless that is changed.
3   Methods                                                          India, the world’s second-largest cement producer with
                                                                  about 7 % of global production in recent years, does not offi-
While cement production data are available by country (van        cially report clinker production statistics. Data from the Ce-
Oss, 2017), it is the production of clinker that leads to pro-    ment Manufacturers’ Association (CMA) are useful only un-
cess CO2 emissions, and the amount of clinker in cement           til the 2009–2010 financial year when two large producers
varies widely. With no available source of clinker produc-        discontinued membership in the organisation (CMA, 2010).
tion data for all countries, other options must be considered.    Clinker production data are also reported by business con-
The direct use of cement production data without adjust-          sultancies in their annual overviews of the industry in India.
ment for clinker trade or clinker ratios that vary by coun-       Data on the types of cement produced, combined with their
try and over time leads to poor emissions estimates (see Ap-      likely clinker contents, can also be used to support this evi-
pendix A) and should therefore be used only as a last resort.     dence base.
The World Business Council for Sustainable Development               While Jamaica reported cement emissions for 2006–2012,
(WBCSD), through its Getting the Numbers Right initiative,        the data source was clearly identified and additional clinker
has collected cement data, including clinker production data,     production data have been obtained to cover 1995–2015.
directly from firms, but their survey-based approach leaves       Meanwhile, clinker production data for the Republic of Ko-
many parts of the world poorly sampled (WBCSD, 2014).             rea were readily available from its cement association for
   The main rationale of our approach, therefore, is to pri-      1991–2015. Emissions estimates from these data matched
oritise officially reported emissions, recognising that these     those reported in official communications to the UNFCCC
generally make use of data and knowledge unavailable              during overlapping periods.
elsewhere. Then we use officially reported clinker produc-           Finally, for all remaining countries we have used survey-
tion data and emission factors, IPCC default emission fac-        based clinker-ratio data from the WBCSD’s Getting the
tors, industry-reported clinker production, and finally survey-   Numbers Right initiative (WBCSD, 2014) combined with
based clinker ratios. These are applied to cement production      historical cement production data from the USGS. In many
data where no better data are available. Full details are pro-    cases these clinker ratios are presented only for groups of
vided in Appendix D and in the associated data files. For         countries but indicate the best available information about
the 42 Annex I countries that report their greenhouse gas in-     clinker ratios in those countries.
ventories annually to the UNFCCC, we extract official esti-          Most of these methods provide estimates only back to
mates of cement production emissions from 1990 onwards.           1990 at best, and we therefore extrapolate for earlier years
Some eastern European countries submit data for years be-         using cement production data combined with assumptions
fore 1990: Poland and Bulgaria from 1988, Hungary from            about how clinker ratios have changed over time. We make
1986, and Slovenia from 1987. These are all based on clinker      the basic assumption that most countries began their cement
production data and largely use Tier II methods. This dataset     industries by producing ordinary Portland cement, a strong
covers about 10 % of current global cement production and is      and very common cement type with a clinker ratio of 0.95,
available as consistently structured spreadsheet files for each   and over time introduced other types of cements with lower
year. In addition, clinker production data were available for     clinker ratios. This assumption reflects available observa-
the US from 1925 (Hendrik van Oss, USGS, personal com-            tions. Specifically, the clinker ratio was set to 0.95 in 1970
munication 2015).                                                 with the IPCC default emission factor and linearly interpo-
   Some non-Annex I parties have begun to include time se-        lated to the implied ratio and emission factor in the earliest
ries of cement emissions in their national communications,        year for which data are available for each country. For large
national inventory reports, and biennial update reports to the    cement producers covering more than 80 % of global pro-
UNFCCC, and these estimates have been used directly. At           duction, USGS provides an estimate of cement production
the time of writing, the following countries reported use-        for 2016 (USGS, 2017), and this is used to estimate 2016
able time-series data: Armenia, Azerbaijan, Brazil, Chile, In-    emissions for those countries. For other countries, emissions

www.earth-syst-sci-data.net/10/195/2018/                                            Earth Syst. Sci. Data, 10, 195–217, 2018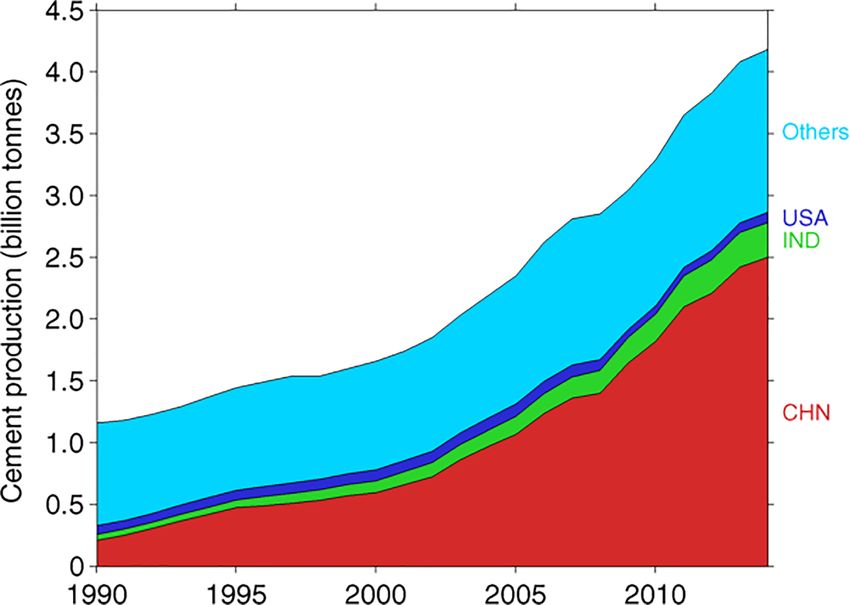
198                                                                  R. M. Andrew: Global CO2 emissions from cement production

                                                                        Figure 3. Process emissions from Chinese cement production,
                                                                        1980–2016. 1NC refers to China’s first national communication,
Figure 2. Global process emissions from cement production, with         2NC the second, and BUR1 the first biennial update report.
95 % confidence interval. A step change in uncertainty occurs in        Also shown are estimates from CDIAC (Boden et al., 2017), Liu
1990, reflecting a significant change in data availability.             et al. (2015), and EDGAR v4.3.2 FT2015.

are assumed to be the same as in 2015. While this extrapola-
tion is clearly not ideal, not extrapolating would result in very
large discontinuities and frustrate any attempt at trend analy-
sis, particularly any assessment of cumulative emissions. Ex-
trapolating necessarily affects derived growth rates, but these
growth rates are dominated by the changes in cement pro-
duction much more than the extrapolation method.
   It is clear from this that data quality is significantly higher
from 1990 onwards, and estimates before then will have
higher uncertainty. However, emissions prior to 1990 are
also less important in the global policy debate, and because
only about 30 % of historical cement production occurred
before 1990, emissions from that period are also of lower
importance for global carbon modelling and budget calcula-
tions. In addition, the rate of change of technology was much           Figure 4. Comparing new cement emissions estimates (dashed
slower before 1990, with most adjustments to, for example,              lines) for the top four cement producers after China with those from
the clinker content of cement occurring in more recent times            CDIAC (solid lines) and official estimates (crosses, India and Viet-
                                                                        nam) as reported to the UNFCCC (see text). The new estimates for
so that estimates for earlier years are less sensitive to assump-
                                                                        the USA and Turkey come directly from national official estimates.
tions. We estimate uncertainty in global cement emissions
                                                                        Estimates from EDGAR v4.3.2_FT2015 are shown for India and
using a Monte Carlo approach, as described in Appendix C.               Vietnam with round markers.

4   Results
                                                                           For China, emissions reached just under 800 Mt CO2 in
Process emissions from cement production reached a peak in              2014 (Fig. 3). The emissions estimated here show high agree-
2014 of 1.51 ± 0.12 Gt CO2 , subsequently declining slightly            ment with the few official estimates reported, a direct conse-
to 1.46 ± 0.19 Gt CO2 in 2016 (Fig. 2). In comparison,                  quence of our use of official data and emission factors. While
CDIAC’s estimate for 2014 is 2.08 Gt CO2 (Boden et al.,                 China produced 57 % of the world’s cement in 2016, its emis-
2017). The most recent estimate currently available from                sions were 52 % of the total, a consequence of its clinker ratio
EDGAR is for 2015 at 1.44 Gt CO2 (Olivier et al., 2016),                being less than 0.60 in recent years, which is below the world
which is in very good agreement with our estimate for                   average. The results for a number of other countries are pre-
the same year of 1.47 ± 0.11 Gt CO2 . Cumulative emissions              sented in the appendices.
over 1928–2016 were 39.3 ± 2.4 Gt CO2 . The global average                 Indian emissions are quite uncertain, but the methods used
clinker ratio has declined from approximately 0.83 in 1990 to           here produce results reasonably close to the few officially re-
0.66 in 2016 (Fig. E1), which is consistent with an estimate            ported estimates (Fig. 4). In 2010 there is some divergence
of 0.65 made by the IEA (IEA, 2017).                                    from the estimate in India’s first biennial update report. In

Earth Syst. Sci. Data, 10, 195–217, 2018                                                  www.earth-syst-sci-data.net/10/195/2018/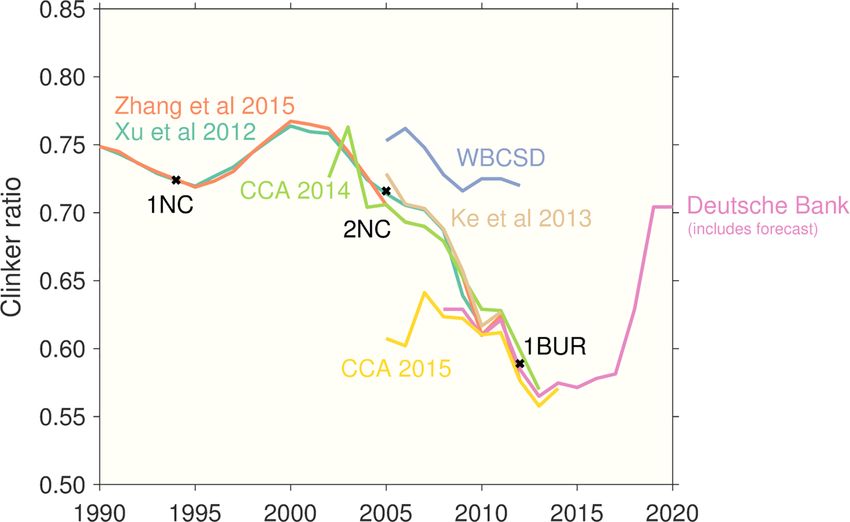
R. M. Andrew: Global CO2 emissions from cement production                                                                     199

that year the data provided by the Indian Cement Manufac-          6   Conclusions
turers’ Association are known to be incomplete, while other
data sources indicate substantially higher clinker production      Estimating global process emissions from cement produc-
in that year; this discrepancy is yet to be resolved (see Ap-      tion is fraught with problems of data availability and has al-
pendix D).                                                         ways required strong assumptions. Over the last 3 decades,
   Aggregate uncertainty is relatively low through most of the     countries around the world have increasingly been produc-
historical period (Fig. 2, top panel), partly as a direct conse-   ing blended cements with lower clinker ratios, and the use of
quence of the choice of the Monte Carlo method with sym-           cement production data with constant emission factors has
metric distributions and no correlation: errors tend to can-       become untenable.
cel. In 1990, with the beginning of most Annex I countries’           The new global cement emissions database presented here
detailed reporting to the UNFCCC, global uncertainty de-           increases the reliance on official and reliable data sources and
clines slightly but then gradually increases as more cement        reduces the reliance on assumptions compared with previous
production occurs in developing countries where uncertainty        efforts. It is intended that the database will be used in the
is higher.                                                         global carbon budget and updated annually with both data
                                                                   updates and methodological improvements. As more coun-
                                                                   tries estimate their emissions and report them to the UN-
5   Data availability
                                                                   FCCC in detail, more data will replace assumptions in pro-
All data used in producing this dataset and the resulting          ducing this dataset. Work is still required in improving es-
dataset itself are available on Zenodo at the following DOI:       timates of cement emissions from both China and India, in
https://doi.org/10.5281/zenodo.831455.                             particular, as these are the world’s two largest cement pro-
   The exception is the Getting the Numbers Right dataset          ducers and official time-series estimates are lacking.
from WBCSD, which is available from their website at http:
//www.wbcsdcement.org/GNR-2014/index.html.

www.earth-syst-sci-data.net/10/195/2018/                                             Earth Syst. Sci. Data, 10, 195–217, 2018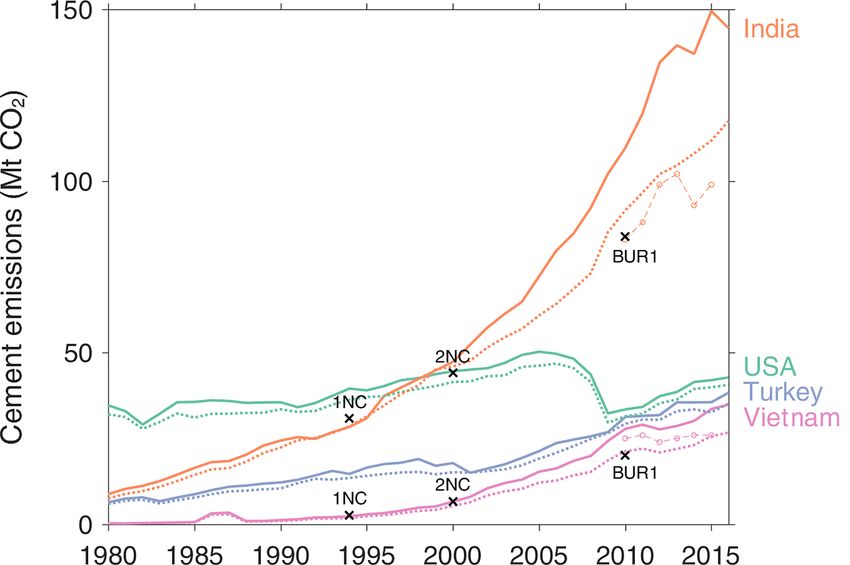
200                                                                 R. M. Andrew: Global CO2 emissions from cement production

Appendix A: Reasons for different estimates

Released annually, CDIAC’s emissions estimates are widely
reported, including in the IPCC Fifth Assessment Report
(Ciais et al., 2013). However, recently there have been some
questions raised about the accuracy of these cement emis-
sions estimates, particularly for China (e.g. Lei, 2012; Ke
et al., 2013; Liu et al., 2015). According to Ke et al. (2013),
CDIAC’s estimates of cement emissions for China were 36 %
higher than those obtained from an IPCC Tier II method for
2007, amounting to an “error” of 181 Mt CO2 , noting that
“CDIAC’s relatively higher emission factor is equivalent to
the assumption of a high clinker-to-cement ratio” (p. 175).

A1    Clinker ratios
The most obvious reason that CDIAC’s estimates are higher
than those produced elsewhere is that the formula they have
used obscures an assumption about the ratio of clinker to ce-
ment in production.
   CDIAC’s method for estimating process emissions from
cement production by country is taken from a report by                 Figure A1. Comparison of CO2 emissions in 43 countries as esti-
Griffin (1987) and requires that cement production data                mated by CDIAC (Boden et al., 2017) and those officially reported
in tonnes are multiplied by a fixed factor 0.136 to obtain             to the UNFCCC, 1990–2015 (UNFCCC, 2017).
tonnes of carbon emitted as CO2 , i.e. 1 t of cement produced
0.136 × 3.667 = 0.50 t of CO2 (Boden et al., 1995).
   According to Griffin (1987), the emissions factor for the           . . . The differences between the lime content and production
production of cement, Ecem , from the calcination of lime-             of clinker and cement, in most countries, are not significant
stone is given as                                                      enough to affect the emission estimates” (Houghton et al.,
                                                                       1996, p. 2.5; emphasis in original). Indeed, Orchard (1973)
         CaO   MrCO2                                                   made his statement about lime content in reference to Port-
Ecem = fcem          ,
               MrCaO                                                   land cements, which are the type that is composed of at least
                                                                       95 % clinker, rather than cement in general.
         CaO is the fraction of CaO in cement, M CO2 is the
where fcem                                          r                       In the USA, the average clinker ratio was most likely about
molecular weight of CO2 (44.01), and MrCaO is the molecular            0.95 for much of the 20th century, possibly dropping to about
weight of CaO (56.08). Based on discussion with experts,               0.90 or slightly lower after about 1970 (Hendrik van Oss,
Griffin (1987) recommended fcem  CaO = 0.635, calculated as the
                                                                       personal communication, 7 May 2015). However, the Inter-
midpoint of the range 0.60–0.67 given by Orchard (1973).               national Energy Agency (IEA) recently estimated the global
   According to the IPCC’s more recent 2006 guidelines                 average clinker ratio to be 0.65 (IEA, 2017), and the dataset
(Hanle et al., 2006), when using cement production data ad-            presented in this work agrees with that assessment. In China
justed for clinker trade, the formula should read                      where almost 60 % of cement is produced, the clinker ratio is
                                                                       currently below 0.60.
         clink CaO     MrCO2                                                WBCSD demonstrates that the clinker ratio has been de-
Ecem = fcem   fclink         ,
                       MrCaO                                           clining in every region, and based on the data they have
                                                                       available, the world average for 2012 was about 0.75. Fur-
         clink is the clinker ratio, and f CaO is the fraction of
where fcem                                                             thermore, between 2000 and 2006 the clinker ratio decreased
                                          clink
CaO in clinker. In the earlier 1996 IPCC guidelines, the in-           more quickly in developing countries than developed coun-
formation sourced from CDIAC stated that the average CaO               tries. WBCSD puts the primary reason for a lack of decline
content of cement is 0.635, while the CaO content of clinker           in developed countries as the acceptance of common prac-
is 0.646, yielding an implicit average clinker ratio of cement         tice and fixed product standards, which act as a barrier to
of 0.98.                                                               reduction in clinker content. This is in contrast to India and
   This high implicit clinker ratio appears to be based on the         China particularly where fly ash from coal-fired power sta-
assumption that the majority of cement produced in the world           tions and slag from the iron and steel industry are widely
is (was) ordinary Portland cement: “Other speciality cements           used as clinker substitutes (WBCSD, 2009). Interestingly, it
are lower in lime, but are typically used in small quantities.         may simply be more common practice in developed countries

Earth Syst. Sci. Data, 10, 195–217, 2018                                                www.earth-syst-sci-data.net/10/195/2018/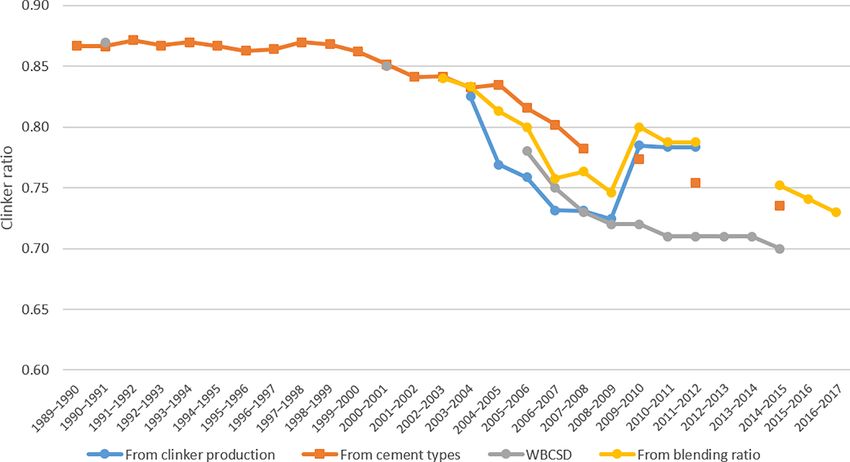
R. M. Andrew: Global CO2 emissions from cement production                                                                        201

Figure A2. The Netherlands. (a) CDIAC vs. UNFCCC. (b) Clinker, cement. Note that “clinker consumption” is production plus imports less
exports, but excludes stock changes. Sources: UNSD, 2015; UNFCCC, 2014; van Oss, 1994–2012; Boden et al., 2013.

for the construction industry to blend in other ingredients be-      cement production data become for the purpose of estimating
fore use (AT Kearney, 2014).                                         cement emissions.
                                                                        The Netherlands provides a clear example of how poor the
                                                                     use of cement production data and a global average clinker
                                                                     ratio can be. CDIAC’s emissions estimates are at least dou-
A2   Use of cement production data
                                                                     ble those reported to the UNFCCC and as much as 4 times as
The best available data on CO2 emissions from cement pro-            high (Fig. A2a). The reason for this is significant net imports
duction at a national level come from official submissions to        of clinker and a particularly low clinker ratio (Fig. A2b). The
the UNFCCC, with about 40 countries submitting annually              low clinker ratio is because most of the country’s produc-
(UNFCCC, 2017). Figure A1 compares CO2 emissions from                tion is of cement type CEMIII, which is specifically suitable
CDIAC with those from UNFCCC specifically for the pro-               for use in marine conditions (CEMBUREAU, 2013), and this
cess of calcination. Over the 26-year period covered by the          type of cement uses a much lower clinker ratio (European
UNFCCC submissions (1990–2015), CDIAC’s estimates are                standard 197-1).
on average 11 % higher than those estimated by these coun-
tries. All countries reporting to the UNFCCC use clinker pro-        A3    System boundaries
duction data to estimate CO2 emissions.
   CDIAC’s estimates are produced using cement production            As has been identified by others, one of the reasons for di-
data obtained from the USGS. However, according to the               vergences between estimates of cement emissions is that dif-
IPCC guidelines (Hanle et al., 2006, p. 2.8),                        ferent system boundaries have been used (e.g. Shen et al.,
   “(C)alculating CO2 emissions directly from cement pro-            2014; Ke et al., 2013). Studies vary on whether they in-
duction (i.e. using a fixed cement-based emission factor) is         clude process emissions from clinker production, other pro-
not consistent with good practice. Instead, in the absence of        cess emissions, direct fuel combustion emissions, and emis-
data on carbonate inputs or national clinker production data,        sions from the generation of purchased electricity. The IPCC
cement production data may be used to estimate clinker pro-          guidelines clearly delineate types of emissions, and process
duction by taking into account the amounts and types of ce-          emissions from electricity generation or direct fuel combus-
ment produced and their clinker contents and including a cor-        tion by clinker-producing firms are allocated to the energy
rection for clinker imports and exports. Accounting for im-          sector (Eggleston et al., 2006). Sometimes lime is produced
ports and exports of clinker is an important factor in the esti-     and mixed with clinker, and emissions from this process are
mation of emissions from this source.”                               also allocated to the IPPU sector but listed separately from
   There is clearly some noise around the line of best fit com-      cement emissions.
paring CDIAC’s estimates to emissions reported to the UN-               It is not widely understood that CDIAC’s emissions es-
FCCC, as shown in Fig. A1, such that simply adjusting es-            timates do not follow the IPCC delineations, and instead
timates down by 11 % (implying an average clinker ratio of           CDIAC estimates emissions result from all oxidation of fos-
about 0.87 for these countries) would still leave considerable       sil fuels plus those from cement production (Boden et al.,
differences from official estimates for some countries. These        1995; Marland and Rotty, 1984; Andres et al., 2012). There-
deviations could be explained as the effects of varying clinker      fore, CDIAC’s estimates of emissions from coal oxidation
ratios and the international trade of clinker. The more clinker      include the non-energy use of coal, such as when used for
is imported for cement production (or exported), the poorer          anodes in aluminium production, in contrast to the IPCC

www.earth-syst-sci-data.net/10/195/2018/                                                Earth Syst. Sci. Data, 10, 195–217, 2018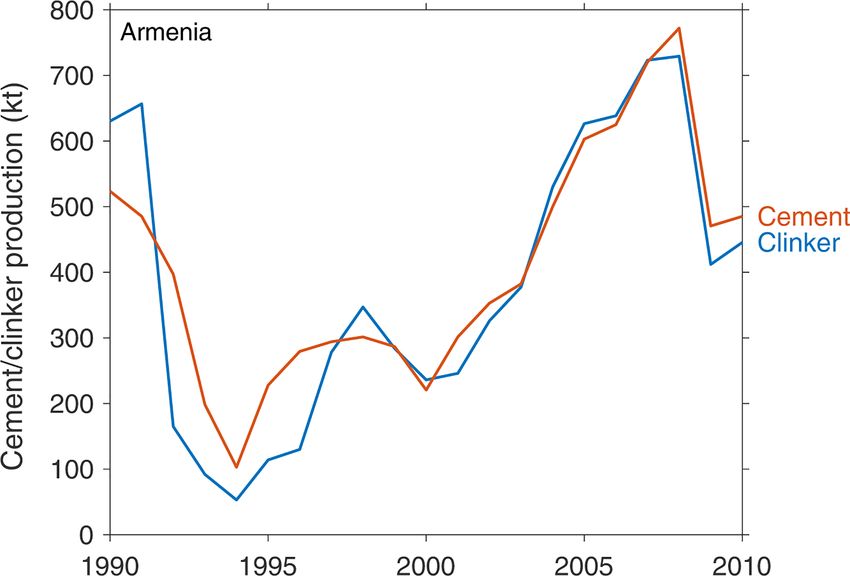
202 R. M. Andrew: Global CO2 emissions from cement production
methodology. CDIAC’s system boundary is therefore much Appendix D: Country-specific analyses
broader than generally understood, including as it does not
only all energy emissions but also most industrial process D1 Annex I parties to the UNFCCC
emissions.
The following countries report annual emissions inventories
to the UNFCCC using the common reporting format (CRF),
and these were downloaded on 7 June 2017. UNFCCC par-
ties sometimes submit revisions through the year, and the
Appendix B: Cement production data specific date of each country’s submission as used in this
study is shown here.
In this work, historical cement production data in tonnes Australia: 27 May 2017, Austria: 11 April 2017, Bel-
are sourced from CDIAC’s cement emissions data. Because gium: 11 April 2017, Bulgaria: 11 April 2017, Be-
CDIAC uses a constant emission factor based on cement larus: 14 April 2017, Canada: 3 April 2017, Switzer-
production, the reverse calculation of cement production land: 22 March 2017, Cyprus: 8 May 2017, Czech Repub-
data is straightforward. Those production data came origi- lic: 13 April 2017, Germany: 11 January 2017, Denmark:
nally from USGS (formerly Bureau of Mines; Marland and 25 May 2017, Spain: 12 April 2017, Estonia: 12 April 2017,
Rotty, 1984). This is significantly less time-consuming than Finland: 11 April 2017, France: 13 April 2017, UK:
replicating CDIAC’s work of assembling USGS’s various 13 April 2017, Greece: 10 April 2017, Croatia: 22 May 2017,
datasets. Hungary: 8 May 2017, Ireland: 12 April 2017, Iceland:
13 April 2017, Italy: 11 April 2017, Japan: 12 April 2017,
Kazakhstan: 14 April 2017, Liechtenstein: 23 March 2017,
Lithuania: 13 April 2017, Luxembourg: 6 April 2017, Latvia:
Appendix C: Uncertainty analysis 13 April 2017, Monaco: 20 April 2017, Malta: 8 May 2017,
the Netherlands: 12 April 2017, Norway: 6 April 2017,
Our uncertainty analysis leans heavily on the officially es- New Zealand: 25 May 2017, Poland: 8 May 2017, Por-
timated uncertainty of cement emissions provided in sub- tugal: 5 May 2017, Romania: 13 March 2017, Rus-
missions to the UNFCCC, whether in national inventory re- sia: 14 April 2017, Slovakia: 7 April 2017, Slove-
ports, national communications, or biennial update reports. nia: 11 April 2017, Sweden: 28 March 2017, Turkey:
These uncertainties, which follow the methods outlined in 13 April 2017, Ukraine: 24 May 2017, United States of
the IPCC’s guidelines (Eggleston et al., 2006), represent America: 14 April 2017.
2 SD of a normal distribution (95 %). For countries without These inventories explicitly state process emissions from
official estimates of uncertainty, estimates have been made cement production from 1990 onwards (IPCC sector 2A1).
based on the approaches used and other information. The The 2017 submissions include emissions data up to 2015.
greatest uncertainty is when only cement production data and Monaco’s emissions have been combined with those of
average clinker ratios have been used, and for these cases the France, following CDIAC.
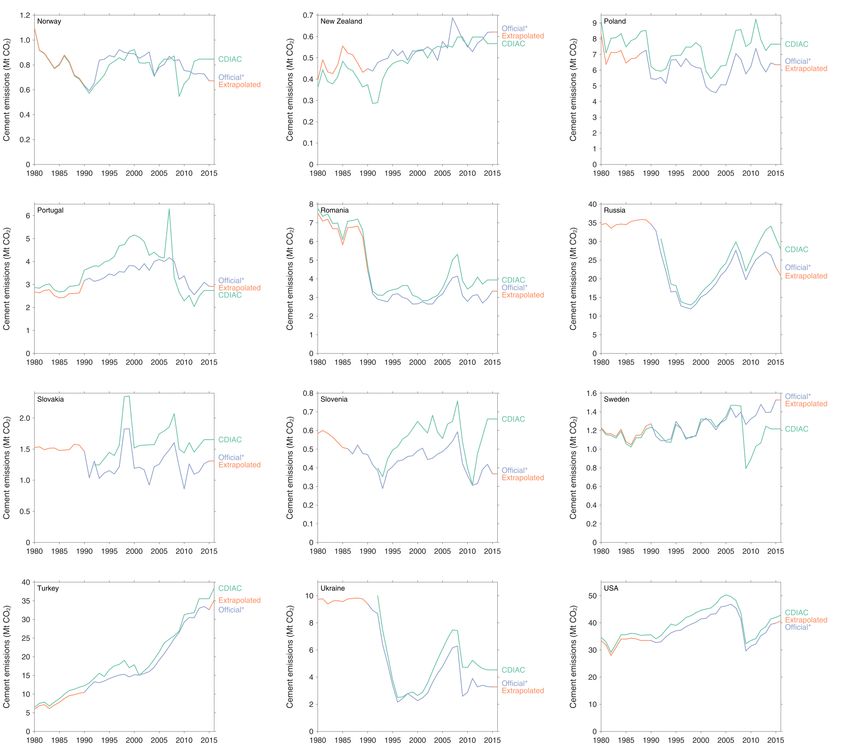
uncertainty (2 SD) has been set at 25 %. See the accompany- The following figures compare cement emissions for An-
ing uncertainty dataset for details. nex I parties as reported by CDIAC (Boden et al., 2017) with
We have also allowed uncertainty to vary by time, with those reported here.
much higher uncertainties outside of the time covered by of-
ficial estimates. For example, Annex I countries report emis- D1.1 China
sions for 1990–2015, while outside of that period clinker ra-
tios and cement production data have been used with higher As by far the largest producer of cement worldwide, esti-
uncertainty. mating China’s emissions from cement production is criti-
The uncertainty estimates by country and by time are used cal to having a robust global estimate. In 1982 China over-
in a Monte Carlo analysis with 10 000 runs to give estimates took Japan to become the world’s largest producer of cement
of uncertainty for global cement emissions. This method ef- and in 2016 accounted for about 57 % of global production
fectively uses the combined uncertainty of all underlying fac- (Fig. D4; USGS, 2017).
tors, such as method, clinker ratios, emission factors, cement China has released several official estimates of process
kiln dust factors, and so on. emissions from cement production in reporting to the UN-
Uncertainties are assumed to be uncorrelated between FCCC. In its first national communication to the UNFCCC,
countries and across time. The latter assumption means that China reported1 process emissions from cement produc-
the uncertainty of any derived growth rates would be overes- tion of 157.8 Mt CO2 in 1994 from about 300 Mt of clinker
timated. (SDPC, 2004). In its second national communication, China
The results of the uncertainty analysis at the global level
are shown in the main text in Fig. 2. 1 P. 32.
Earth Syst. Sci. Data, 10, 195–217, 2018 www.earth-syst-sci-data.net/10/195/2018/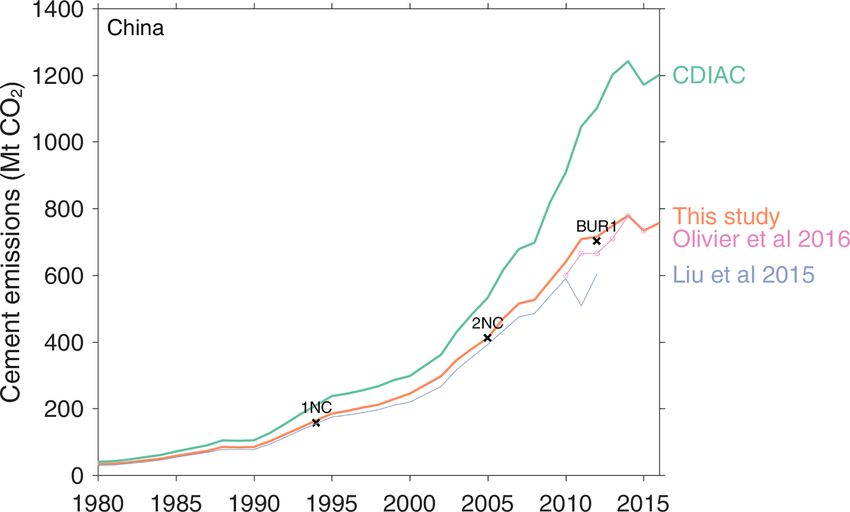
R. M. Andrew: Global CO2 emissions from cement production                                                                    203

Figure D1. Revised cement emissions for Annex I parties to the UNFCCC.

reported2 411.7 Mt CO2 in 2005 from about 765 Mt3 of               clinker (NDRC, 2012, 2014). In its first biennial update
                                                                   report, China does not report emissions from cement pro-
   2 P. 59.
                                                                   duction separately, but does report4 clinker production of
   3 P. 39 of the second national communication actually reports
                                                                   1303.9 Mt in 2012 (NDRC, 2016), which with China’s emis-
674, but this is a typographic error. The NDRC’s 2005 GHG inven-
tory research book gives 764.71 Mt of clinker production in 2005   Beijing, 2014, which agrees with both the figure given by CCA –
NDRC: the People’s Republic of China National Greenhouse Gas       764.72 Mt – and with the reported emissions.
Inventory 2005, National Development and Reform Commission,           4 Tables 2–3 on p. 20 in the English section (p. 152).

www.earth-syst-sci-data.net/10/195/2018/                                             Earth Syst. Sci. Data, 10, 195–217, 2018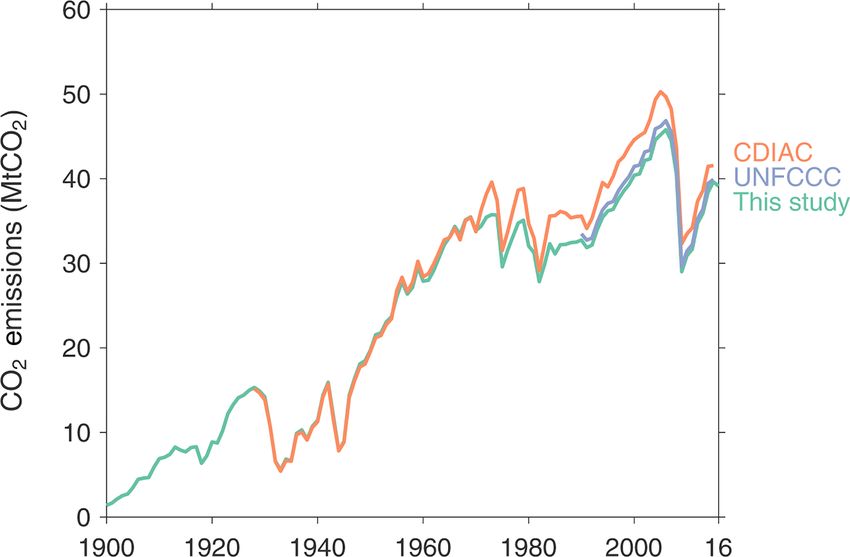
204                                                               R. M. Andrew: Global CO2 emissions from cement production

Figure D2. Revised cement emissions for Annex I parties to the UNFCCC.

sion factor of 0.5383, would have led to about 702 Mt CO2 .          of the data presented: previous almanacs presented national
In all three cases, China has used firm-level surveys to deter-      totals, while the 2015 edition presents production enterprises
mine the emission factor.                                            with revenues over a specified threshold (so-called “above-
   In 2016 the China Cement Association (CCA) annual Ce-             sized” enterprises (a correspondent at CCA, personal com-
ment Almanac 2015 presented much lower historical clinker            munication, 2017). The differences between these two fig-
production for some years than previous editions (CCA,               ures has diminished considerably over time, such that clinker
2016). These are not revisions, but a change in the coverage         production from above-sized enterprises in 2013 was 98 % of

Earth Syst. Sci. Data, 10, 195–217, 2018                                              www.earth-syst-sci-data.net/10/195/2018/
R. M. Andrew: Global CO2 emissions from cement production                                                                    205

Figure D3. Revised cement emissions for Annex I parties to the UNFCCC.

all clinker production reported by CCA in the previous edi-        CCA by Zhang are used in this study and supplemented by
tion.                                                              later data from CCA’s almanac.
   National clinker production data for 1990–2004 were pro-           The clinker ratio in China has been below 0.8 since at least
vided by Shaohui Zhang, who received them directly from            1990 and has declined rapidly in the last decade to about
CCA (Zhang et al., 2015); 2005–2013 data are from the 2015         0.62 in recent years (Fig. D5). Along with the use of clinker
edition of CCA’s almanac; 2014–2016 data are from NBS via          substitutes mentioned above, the use of modern kiln types
the China Cement Research Institute (CCRI), and these have         also contributes. The new suspension preheater (NSP) type,
been scaled up very slightly so that the 2013 figure matches       which allows lower clinker ratios to be used in cement pro-
the national total provided by CCA.                                duction given the same strength requirements, was used for
   Figure D5 shows clinker ratios (the ratio of clinker produc-    about one-seventh of production in 2000, a share which had
tion to cement production) from this and a number of other         grown to about four-fifths in 2010 (Xu et al., 2012).
sources. Some authors do not adjust for clinker trade before          The default factor for the average lime (CaO) content
calculating the ratio. The numbers from WBCSD are unre-            of clinker given by the IPCC 2006 guidelines is 65 %. Liu
liable because of a very small sample size in China (∼ 4 %         et al. (2015) used 62 %, being the weighted average derived
of all clinker production) and likely to be biased toward pro-
ducers of higher-quality cement. The data sourced from the

www.earth-syst-sci-data.net/10/195/2018/                                             Earth Syst. Sci. Data, 10, 195–217, 2018
206                                                                 R. M. Andrew: Global CO2 emissions from cement production

                                                                          The cement emissions derived in this study are shown in
                                                                       Fig. 3, which also compares with several other available es-
                                                                       timates. The 2011 dip in cement emissions presented by Liu
                                                                       et al. (2015) appears to be spurious based on an unlikely low
                                                                       clinker ratio of 0.49 in that year. Recent data from CCA in-
                                                                       dicate a ratio of 0.63 in that year with no particular disconti-
                                                                       nuity.

                                                                       D1.2   India

                                                                       India is the second-largest producer of cement in the world,
                                                                       with about 300 000 t in 2016 (USGS, 2017). The 47 % of
                                                                       India’s cement production covered by WBCSD’s data used
                                                                       a clinker ratio of 0.70 in 2014 (WBCSD, 2012).
Figure D4. Production of cement by country, 1990–2014 (van Oss,
                                                                          In India’s first national communication to the UNFCCC
1994–2012; USGS, 2015).
                                                                       with data for 1994, process emissions from cement produc-
                                                                       tion are reported as 30 767 kt CO2 using an emission factor
                                                                       of 0.537 t CO2 t−1 clinker (p. 41), implying clinker produc-
                                                                       tion of 57 294 kt in that year (Ministry of Environment and
                                                                       Forests, 2004). USGS reports Indian cement production in
                                                                       that year as 57 000 kt. Allowing for rounding, the implied
                                                                       clinker ratio was therefore surprisingly high at approximately
                                                                       1.0 in 1994. WBCSD data indicate that the clinker ratio in
                                                                       1990 was 87 % for the cement manufacturers from which
                                                                       there were data (WBCSD, 2014). These data are inconsis-
                                                                       tent, but it is unclear where the error lies.
                                                                          Similarly, in India’s second national communication
                                                                       with data for 2000, process emissions are reported as
                                                                       44 056 kt CO2 using the same emissions factor (p. 53), im-
                                                                       plying clinker production of 82 041 kt (Ministry of Environ-
Figure D5. China’s clinker ratio since 1990 from a number of dif-      ment and Forests, 2012). USGS reports cement production
ferent sources. The three official estimates are marked in black:      in 2000 of 95 000 kt. The clinker ratio was therefore most
1NC is the first national communication, 2NC the second national       likely about 0.86 in 2000, agreeing closely with that reported
communication, and 1BUR is the first biennial update report.           by WBCSD (0.85).
                                                                          India’s first biennial update report give cement process
                                                                       emissions of 83 851.74 kt CO2 in 2010 (Ministry of Environ-
from the factory-level study made by Shen et al. (2014)5 .             ment, Forest and Climate Change, 2015). Energy emissions
However, clinker production also involves the decomposition            were about the same as in 2000, implying vastly improved
of MgCO3 to MgO, and emission factors derived only from                efficiency. The BUR does not indicate what emission fac-
the CaO content (including Liu et al., 2015) omit this source          tor was used, but assuming 0.537 as before would suggest
of CO2 emissions, which Annex I parties include in their in-           156 Mt of clinker production in 2010.
ventories.                                                                With no complete official time series of either clinker
   China’s second national communication used emission                 production or clinker ratio, a multi-source approach has
factors “derived from in situ surveys” (p. 60), while the first        been used here. We make use of data from the Indian Ce-
biennial update report used factors “obtained through typi-            ment Manufacturers’ Association (CMA), consultancy re-
cal enterprise survey” (p. 19). The factor used for the second         ports from CRISIL and IBEF, WBCSD, and other sources.
national communication is provided in the NDRC’s report:               Data include clinker production, blending ratio (the inverse
0.5383 (NDRC, 2014). This factor excludes clinker kiln dust,           of clinker ratio), and cement types. When calculating clinker
stated to be negligible, but does include emissions from the           ratios from clinker and cement production data, clinker trade
decomposition of MgCO3 .                                               has been taken into account.
   For years before 1990, the assumption is made here that                The cement-type data (OPC, PPC, etc.) indicate a dramatic
the clinker ratio was 0.8 until 1970 and then linearly declined        shift to OPC between 1986 and 1990, suggesting an improve-
to the estimated value in 1990.                                        ment in quality. This appears to have been a result of decon-
                                                                       trol in 1989, which removed many regulations from the in-
   5 Confirmed by Z. Liu, personal communication, 2017.                dustry. Since 2000 the cement types have begun to change

Earth Syst. Sci. Data, 10, 195–217, 2018                                                www.earth-syst-sci-data.net/10/195/2018/
R. M. Andrew: Global CO2 emissions from cement production 207
Figure D6. Proportions of cement production by type. B07: Bapat et al. (2007), CR: CRISIL (various years). OPC: ordinary Portland cement,
PPC: Portland pozzolana cement, PSC: Portland slag cement.
Figure D7. Estimates of clinker ratio in India from various sources.
again, a result of growing acceptance of other types of ce- Various reports on the Indian cement industry by the con-
ment as being of sufficient quality (CRISIL, 2016, p. 21). sultancy CRISIL give data on both clinker production and
Using the cement types combined with the proportion of blending ratios for various years.
clinker in each cement type, one can derive the overall clinker The CMA also provides clinker production data, but in the
ratio from a weighted average. The proportions of clinker in 2009–2010 financial year two members discontinued their
each cement type change over time, and only two sets of esti- membership in the association, so production data from that
mates were available: one from the WBCSD and IEA (2013), year onwards are incomplete (CMA, 2010).
assumed to represent 2012 and later, and another from IBEF There unfortunately remains some disagreement between
(2005), assumed to represent 2005 and earlier. The clinker ra- the clinker ratios derived from different sources (Fig. D7).
tios by cement type were interpolated linearly between these The data from the WBCSD represent just under half4of ce-
two years. ment production in India, most likely the larger produc-
The WBCSD survey data for India cover close to half ers. There is a significant divergence in 2009–2010 between
of Indian cement manufacturing. These data show that the WBCSD and the other data sources. CRISIL reports that “the
clinker ratio declined from 0.86 in 1990 to 0.70 in 2014. blending ratio dipped significantly to around 1.25 from 1.34
in 2008–2009. Cement players had lowered the blending ra-
tio during the year on account of decline in cement demand
www.earth-syst-sci-data.net/10/195/2018/ Earth Syst. Sci. Data, 10, 195–217, 2018208 R. M. Andrew: Global CO2 emissions from cement production
Figure D8. Comparison of Indian cement production data (in kilo-
tonnes) from USGS and OEA, the latter from 2005. Figure D9. Revised cement emissions for India. 1NC: first national
communication; 2NC: second national communication; BUR1: first
biennial update report.
and increased clinker production” (CRISIL, 2013, pA-19).
The cement-type data also show a sharp increase against the
trend in the amount of OPC produced at that time, from
25 % in 2007–2008 to 30 % in 2009–2010. It may be that
the survey-based approach of WBCSD did not capture this
adjustment in the industry.
The use of clinker production data is clearly preferred.
When clinker production data were not available in earlier
years, we have used the analysis based on cement types. In
later years we use the reported blending ratios (reciprocal of
the clinker ratio). Data were adjusted from financial to calen-
dar years by using a simple weighting of 0.75 : 0.25 for the
two overlapping financial years. In a later revision monthly
cement production statistics may be used to improve this
weighting.
The clinker ratio must be applied to cement production Figure D10. Revised cement emissions for the USA.
data, but there is some divergence between USGS data and
those from the Office of the Economic Advisor (OEA),
which are reported by the CMA (Fig. D8). This divergence 1925, the clinker ratio was very close to 1 between 1925 and
has not yet been explained. In this work we rely on the offi- 1970. By assuming that it was also 1 between 1900 and 1924,
cial data from the OEA, although this only affects the emis- the data series can be extended back to 1900 when cement
sions estimate for 2016 because clinker production estimates production data begin (Fig. D10).
are used for 2004–2015. Until about 1970, CDIAC’s estimates of US cement emis-
Indian analyses have shown emission factors sions show good correspondence with estimates calculated
(t CO2 (t clinker)−1 ) similar to the default IPCC factor directly from clinker production data. However, after about
of 0.52 (Arceivala, 2014), so we use that factor here. 1970 significant deviations appear as the clinker ratio of US
The final emissions time series lies very close to the three cement began to drop below unity (Fig. D10). The same
available official estimates (Fig. D9). method is used here to calculate emissions from clinker pro-
duction data as is used in the US national inventory report.
The reason for the divergence seen in Fig. D10 is that the
D1.3 USA
UNFCCC submission includes cement production in Puerto
The USA reports annual emissions from cement production Rico, while the estimates in this study do not.
to the UNFCCC, along with all other Annex I parties. How-
ever, in addition to this series, which starts in 1990, the US D1.4 Armenia
Geological Survey (USGS) has an unpublished time series
of clinker production in the US starting in 1925 (Hendrik Armenia’s 2010 national inventory report provides emissions
van Oss, personal communication, 2015). This allows for from cement production for 1990–2010 (Ministry of Nature
very good estimates of CO2 emissions from historical clinker Protection, 2014). The implied emission factor is nearly con-
production. Furthermore, while USGS clinker data begin in stant, at around 0.507 every year. The second national in-
Earth Syst. Sci. Data, 10, 195–217, 2018 www.earth-syst-sci-data.net/10/195/2018/R. M. Andrew: Global CO2 emissions from cement production 209
Figure D11. Revised cement emissions for Armenia. Figure D13. Revised cement emissions for Azerbaijan.
Figure D12. Clinker and cement production in Armenia, 1990–
2010 (Ministry of Nature Protection, 2014; van Oss, 2017).
Figure D14. Revised cement emissions for Brazil.
ventory report for 2012 provides emissions for 2000–2012 D1.5 Azerbaijan
using Tier III methodology (Ministry of Nature Protection,
2015). These have been combined with the earlier estimates Azerbaijan’s third national communication provides esti-
to give a longer data series from 1990–2012. The introduc- mates of emissions from cement production for 1990, 2000,
tion of Tier III methodology raised emissions in the over- and 2005–2012.
lapping period by an average of 14 %, and this was used to
adjust the emissions from the first NIR. D1.6 Brazil
Armenia’s clinker production was significantly higher than
USGS-reported cement production in 1990 and 1991, indi- Brazil’s third national communication to the UNFCCC in-
cating significant exports of clinker in those years (Fig. D12). cludes estimates of emissions from cement production from
While clinker production dropped significantly below ce- 1990 to 2010 (MSTI, 2016). The emission factor ranges be-
ment production in the following few years, there have been tween 0.544 and 0.549 t CO2 (t clinker)−1 for the years in
a number of years since when clinker appears to have been which clinker production data are provided. The clinker ratio
exported. (assuming zero clinker trade) has declined from 0.78 in 1990
While it is quite possible that Armenia was a net exporter to 0.66 in 2010 (Fig. D15).
of clinker in years prior to 1990, no data have been found The report states that Brazil has been substituting clinker
to substantiate this. After 2012 we assume that the ratio of in cement manufacturing “for over 50 years” (p. 100). For
clinker production and cement production in 2012 continues years before 1990, the clinker ratio was interpolated linearly
with the emission factor of 2012. from 0.95 in 1965 to the estimated ratio in 1990 from the
www.earth-syst-sci-data.net/10/195/2018/ Earth Syst. Sci. Data, 10, 195–217, 2018210 R. M. Andrew: Global CO2 emissions from cement production
Figure D15. Brazil’s approximate clinker ratio with no account for
clinker trade. Figure D17. Revised cement emissions for Indonesia.
Figure D18. Net clinker exports from Indonesia, 1999–2016
(source: Statistics Indonesia).
Figure D16. Revised cement emissions for Chile.
D1.8 Indonesia
data. After 2010, the clinker ratio was assumed constant at
the 2010 level. Indonesia’s first biennial update report provides estimates of
process emissions from cement production for 2000–2012
using the IPCC default emission factor. Clinker production
is higher than cement production in many years.
D1.7 Chile The clinker ratio, even after adjustment for clinker trade, is
still above 1 in some years, which is impossible (Fig. D20).
The Chilean national inventory report (MdMA, 2017)
This uses cement production data from USGS. Clearly there
presents clinker production data for 1990–2013, with 1990–
are some inconsistencies in the datasets used, and without
1994 and 2013 estimated based on extrapolated clinker ra-
clinker production data it appears impossible to generate
tios. The country uses IPCC default emission factors in
a reasonable time series of cement emissions for Indonesia.
the absence of country-specific data. Significant imports of
clinker mean that the resulting emissions are significantly
lower than those estimated by CDIAC (Fig. D16). D1.9 Jamaica
Imports were negligible in 1990, so an assumption has
been made of no imports prior to 1990. For years after 2013, Jamaica’s first biennial update report presents clinker pro-
the ratio of clinker production to cement production has been duction and emissions estimates for 2006–2012 (Mahlung
assumed to continue, implicitly assuming the same clinker and Dore, 2016). The implied emission factor used is
ratio and clinker trade ratios. 0.520 kg CO2 (kg clinker)−1 .
Earth Syst. Sci. Data, 10, 195–217, 2018 www.earth-syst-sci-data.net/10/195/2018/R. M. Andrew: Global CO2 emissions from cement production 211
Figure D19. Indonesian clinker production and derived consump-
Figure D22. Revised cement emissions for South Korea.
tion, 2000–2012.
Figure D20. Indonesian clinker ratio calculated from both clinker
Figure D23. South Korea’s approximate clinker ratio with no ac-
production and consumption data.
count for clinker trade.
Figure D21. Revised cement emissions for Jamaica. Figure D24. Revised cement emissions for Mexico.
www.earth-syst-sci-data.net/10/195/2018/ Earth Syst. Sci. Data, 10, 195–217, 2018212 R. M. Andrew: Global CO2 emissions from cement production The BUR states that clinker production data were obtained from the Caribbean Cement Company. Accordingly, further clinker production data have been sourced from annual re- ports of the Caribbean Cement Company (Caribbean Cement Company, various years) to extend this series to 1995–2015 (Fig. D21). The clinker ratio was 0.96 in 1995. For years before 1995, a clinker ratio of 0.95 has been assumed with the same emis- sion factor of 0.520. D1.10 Korea The Korea Cement Association (KCA) has published annual national clinker and cement production from 1991, and at the time of writing data were available to 2015 (KCA, 2017). The third national communication (Korean Ministry of En- Figure D25. Revised cement emissions for Moldova. vironment, 2012) states that cement production was 40.9 % of total industrial process emissions of 56.7 Mt CO2 in 2009, which comes to 23.19 Mt CO2 . Using an emission factor of 0.52 and the KCA clinker production figure of 44.774 Mt gives a very close 23.28 Mt CO2 (Fig. D22). The clinker ratio over 1991–2015 from the KCA data shows no clear trend, varying from year to year probably only in response to clinker trade (Fig. E23). D1.11 Mexico Mexico’s first biennial update report (INECC and Semarnat, 2015) provides CO2 emissions from cement manufacturing during 1990–2012 (Fig. D24). Mexico has had significant clinker exports over this period such that emissions are in many years higher than the estimates made by CDIAC. After 2012, the emissions rate was assumed constant at the Figure D26. Clinker and cement production in Moldova (Ministry 2012 level, implicitly assuming a constant clinker ratio and of Environment, 2013). constant international clinker trade. D1.12 Moldova Moldova’s national inventory report provides cement emis- sions for 1990–2012 (Ministry of Environment, 2013). Clinker production tracked cement production relatively closely over the entire period, although cement production was rather higher than clinker production in 1990, suggest- ing either exports of clinker or a lower clinker ratio in that year (Fig. D26). After 2010 we assume that the ratio of clinker production and cement production in 2010 continues with the emission factor of 2010 (Fig. D25). The main reason GCB2016 estimates were so low is that the method used to disaggregate emissions from countries of the former Soviet Union assumed that the shares in 1992 Figure D27. Revised cement emissions for Namibia. represented the shares before 1992. Earth Syst. Sci. Data, 10, 195–217, 2018 www.earth-syst-sci-data.net/10/195/2018/
R. M. Andrew: Global CO2 emissions from cement production                                                                    213

                                                                Figure E1. Implied global clinker ratio derived from emissions es-
                                                                timates and cement production data.
Figure D28. Revised cement emissions for South Africa.

                                                                Appendix E: Global clinker ratio

                                                                The approximate implied global clinker ratio can be derived
                                                                from emissions and cement production data using default
                                                                emission factors (Fig. E1). The trend until 1990 is largely ar-
                                                                tificial, resulting from the assumptions used in extrapolation,
                                                                although in earlier years the data for the US dominate.

Figure D29. Revised cement emissions in Uzbekistan.

D1.13    Namibia

Namibia’s second national inventory report provides esti-
mates for emissions from cement production for 2000–2012
and clearly states that there was no cement production in the
country before 2011.

D1.14    South Africa

South Africa’s first national inventory report (DEA, 2014)
provides estimates of emissions from cement production for
2000–2010.

D1.15    Uzbekistan

Uzbekistan’s national inventory report includes a time series
of cement emissions for 1990–2012 (Uzhydromet, 2016).
   After 2012, the emission factor and clinker ratio of 2012
were assumed constant (Fig. D29).

www.earth-syst-sci-data.net/10/195/2018/                                          Earth Syst. Sci. Data, 10, 195–217, 2018
You can also read