Modelling and analysis of Australia's abatement opportunities - Report to the Department of the Environment Meeting Australia's 2030 emissions ...
←
→
Page content transcription
If your browser does not render page correctly, please read the page content below

Modelling and analysis of Australia’s
abatement opportunities
Report to the Department of the Environment

Meeting Australia’s 2030 emissions reduction target
May 2016

Modelling and analysis of Australia’s abatement opportunities

Copyright
© 2016 Energetics. All rights reserved.

"Energetics" refers to Energetics Pty Ltd and any related entities.

This report is protected under the copyright laws of Australia and other countries as an unpublished work. This report contains
information that is proprietary and confidential to Energetics and subject to applicable Federal or State Freedom of Information
legislation, shall not be disclosed outside the recipient's company or duplicated, used or disclosed in whole or in part by the
recipient for any purpose other than for which the report was commissioned. Any other use or disclosure in whole or in part of
this information without the express written permission of Energetics is prohibited.

Disclaimer
The information contained in this document is of a general nature only and does not constitute personal financial product
advice. In preparing the advice no account was taken of the objectives, financial situation or needs of any particular person.
Energetics is authorised to provide financial product advice on derivatives to wholesale clients under the Corporations Act 2001
AFSL No: 329935. In providing information and advice to you, we rely on the accuracy of information provided by you and your
company. Therefore, before making any decision, readers should seek professional advice from a professional adviser to help
you consider the appropriateness of the advice with regard to your particular objectives, financial situation and needs.
Australian Financial Services License (AFSL # 329935).

Acknowledgements
Energetics would like to acknowledge the contribution of the following people and businesses to this report Telstra, GPT, Low
Carbon Living CRC.

ii                                                                                                       © Energetics Pty Ltd 2016
Modelling and analysis of Australia’s abatement opportunities
Executive summary
st
At the UNFCCC 21 Conference of Parties (COP21) in Paris, December 2015, Australia formalised
our Intended Nationally Determined Contribution (INDC) for inclusion in the Paris Agreement. This
contribution is a target to reduce Australia’s domestic emissions by 26 to 28 per cent below 2005
levels by 2030.
To help illustrate a pathway for the Government to achieve the 2030 target, the Department of the
Environment (the Department) engaged Energetics to analyse and model the emissions reduction
opportunity.
Energetics’ analysis shows there is potentially significant low-cost abatement available to meet the
2030 target.
Australia can reach its 2030 abatement target under the current policy
framework. Large emitters must be effectively engaged and programs pursued
without delay. Energetics’ modelling of over 70 emissions reduction measures has
found that approximately 960 Mt CO2-e of abatement can be achieved by 2030.
Modelling over the period 1993 – 2015 shows the emissions intensity of the Australian
economy fell on average by 2.3 percent each year, suggesting that national emissions
are decoupling from economic growth.
Australia will achieve its 2020 cumulative abatement target under the Kyoto protocol,
equivalent to 5 per cent below 2000 levels by 2020. Energetics has identified further
abatement opportunities that can be pursued, to reach an absolute 2020 target.
Australia’s emissions reduction potential
To assess the potential for Australia to meet this abatement target, Energetics considered over 70
abatement opportunities that could be implemented by policies existing or under consideration by the
Government. Abatement opportunities were identified across all major sectors and categorised into a
range of project types including land use change, fuel switching, energy productivity, renewable
energy and waste management.
Energetics’ model identified an abatement potential of 154 Mt CO2-e in 2030 relative to emissions in
2020. The total cumulative abatement opportunity in the period from 2021 to 2030 was estimated to
be around 960 Mt CO2-e. The scale of the potential identified abatement is consistent with Australia
meeting its 2030 target.
iii © Energetics Pty Ltd 2016
Modelling and analysis of Australia’s abatement opportunities

                   Figure 1: Cumulative abatement potential categorised by abatement type

Energetics’ analysis of the total abatement potential by opportunity type indicates that energy
productivity and land-use change can deliver a significant portion of Australia’s cumulative abatement
requirement from 2021 to 2030 (as shown in Figure 1). Abatement opportunities identified for energy
productivity accounts for 44 per cent of total abatement potential, while identified abatement from
land-use change opportunities can contribute a further 38 per cent in total.
Renewable energy and management of industrial processes can each contribute a further five per
cent of the identified abatement potential. The remaining abatement potential has been identified in
abatement opportunities related to fuel switching, agriculture, fugitive emissions and waste.
The abatement opportunities identified were allocated to one of 12 groups as shown in Figure 2.
These groups were considered to provide an exhaustive coverage of all major areas of both
established and emerging abatement opportunities in 2030.
Energetics’ analysis found that improved land management and low emissions farming practices
(group 9) and low carbon transport (group 8) are capable of contributing the most to Australia’s total
low-cost abatement by 2030. In total the two groups account for just over 50 per cent of Australia’s
total identified abatement potential.

iv                                                                                    © Energetics Pty Ltd 2016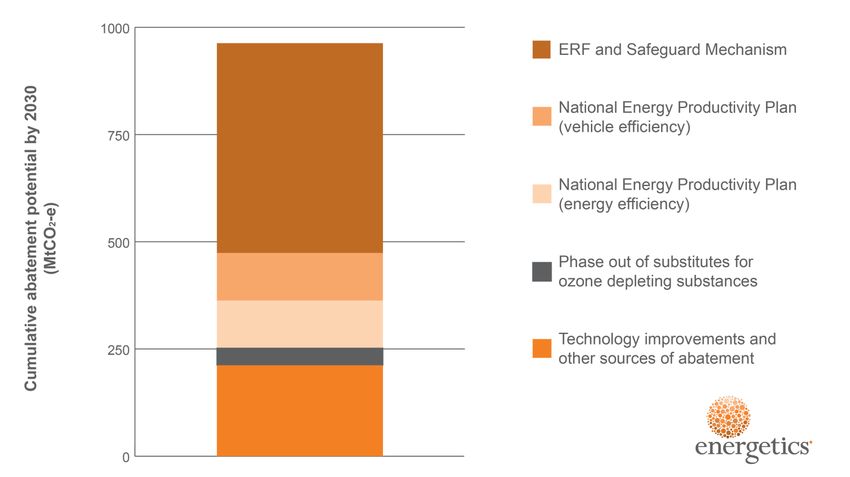
Modelling and analysis of Australia’s abatement opportunities

                                     Figure 2: Cumulative abatement potential by grouping

Low carbon precincts (group 2) and digital infrastructure displacing transport fuel use (group 3) are
likely to require additional support beyond that considered. These groups are forecast to deliver the
lowest quantity of abatement on a per annum basis in 2030, but are likely to contribute a significant
portion to the total abatement potential in the period from 2030 to 2050.

Emissions trajectory through to 2030
Energetics’ analysis of the period 1993 to 2015 revealed a consistent reduction in the intensity of
                                                             1
emissions per unit of GDP (excluding those from the LULUCF sector). The finding is robust despite
the wide range of economic conditions, external shocks and climate change polices experienced over
this period. The average year by year reduction in greenhouse gases per unit of GDP was 2.17 per
     2
cent .
The abatement potential identified by Energetics assumes a continuation of this trend in emissions
intensity improvements.
Based on Australia’s emissions in 2020 being five per cent lower than in the year 2000 and a
continuation of the emissions intensity reductions, Energetics estimates Australia’s domestic
emissions will be 568 Mt CO2-e in 2030. This compares to the minus 28 per cent emissions reduction
target of 440 Mt CO2-e in 2030. Energetics considers the difference between the emissions pathway

1
    Land use, land use change and forestry
2
    This figure excluded the years 2013 and 2014 when the carbon tax was in operation.

v                                                                                           © Energetics Pty Ltd 2016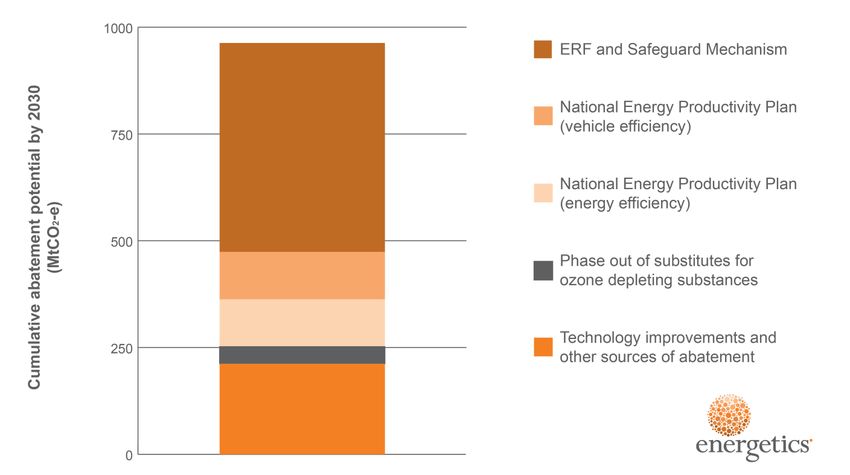
Modelling and analysis of Australia’s abatement opportunities
and trajectory to the 2030 target can be achieved from the total 960 Mt CO 2-e cumulative abatement
potential identified.
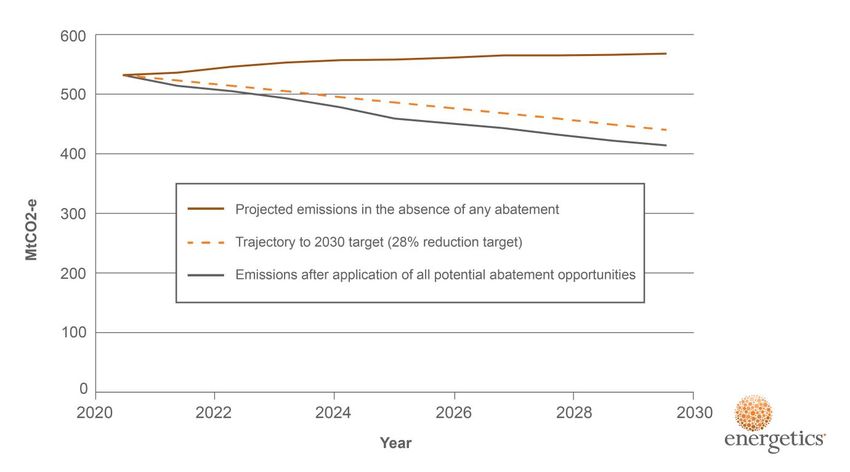
Starting from an emissions level of 532 Mt CO2-e in 2020, the figure below demonstrates how the
abatement potential identified compares to Australia’s 2030 emissions reduction target as well as
against Australia’s projected emissions in the absence of any abatement.
Figure 3: Australian emissions trajectory and impact of abatement
Leveraging Australian policies and programs
to achieve the 2030 target
This analysis considered the potential for delivering Australia’s abatement under the following
programs:
The Emissions Reduction Fund and Safeguard Mechanism
The National Energy Productivity Plan (energy efficiency)
The National Energy Productivity Plan (vehicle efficiency)
The abatement opportunities were allocated to the most appropriate policy or program. Abatement
opportunities that were considered to be business as usual were part of the baseline, with many
attributed to technological advances.
The analysis also included emissions reduction activities that will continue to be delivered under other
programs, such as ozone and HFC measures. For this assessment Energetics drew from abatement
analysis undertaken by the Government.
Energetics also considered the impact of non-government movements that are capable of driving
emissions reductions. For example, we see the impact of growing market and consumer pressure that
influences business to reduce their carbon intensity.
vi © Energetics Pty Ltd 2016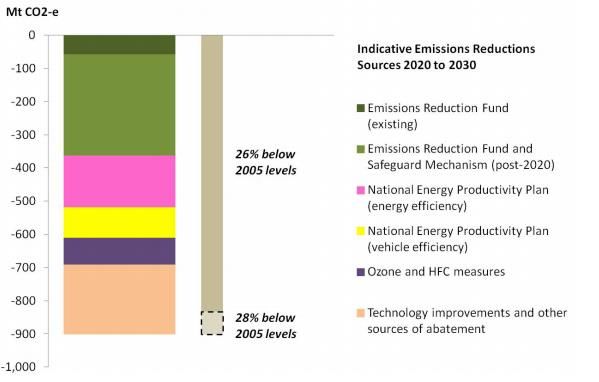
Modelling and analysis of Australia’s abatement opportunities

Finally, where abatement opportunities achieved emissions abatement though improvements in
energy productivity, they were generally allocated to the National Energy Productivity Plan (NEPP).
The contribution of potential abatement to meet the cumulative abatement potential is shown in Figure
4. Technology improvements play a key role as does the Emissions Reduction Fund (ERF) and
Safeguard Mechanism.

                                 Figure 4: Cumulative abatement potential by 2030

Figure 4 above highlights the total domestic abatement opportunity identified by Energetics as can be
delivered under existing policies or programs. This provides flexibility in the measures adopted, as
well as room for future growth in Australia’s INDC.
Australia has world class policies and frameworks in place for calculating abatement from individual
measures and for creating and managing Australian Carbon Credit Units (ACCUs). Supported by
these robust frameworks, Energetics assumes that the ERF and Safeguard Mechanism are capable
of generating the necessary cumulative abatement over the 2021 to 2030 period.
In addition, the NEPP is in the process of being formalised, and is expected to further drive a share of
emissions reductions. Continued advances in technology and other, emerging market
transformations to reduce greenhouse gases will deliver the remainder of Australia’s abatement.

Australia’s abatement cost curve
To assist with the ranking and prioritisation of more than 70 abatement opportunities identified and
analysed, Energetics developed an Australian economy wide abatement cost curve. Abatement cost
curves provide a useful tool, and visual guide, to demonstrate the total potential abatement for each
sector, as well as the cost of the abatement in reducing Australia’s emissions.
The Australian domestic abatement cost curve for 2030 is shown in Figure 5 below – including each
of the sectors considered capable of potentially contributing to Australia’s 2021 to 2030 abatement
task. For each sector, Energetics considered the cost in projected 2030 AUD to the whole of Australia.

vii                                                                                  © Energetics Pty Ltd 2016
Modelling and analysis of Australia’s abatement opportunities

Based on this approach and due to the high net cost to Australia of imported transport fuels, the
sectors that encourage improvements in the efficient use of those fuels have a high net benefit.
Electricity savings have a lower net benefit to the Australian society, however many can still be
achieved at a negative societal cost.

                                   Figure 5: Australian 2030 abatement cost curve

Two examples of abatement opportunities considered in Energetics analysis are included below
Section 5. The two case studies provide examples of the best practice energy management and
emissions reduction currently being undertaken by leading Australian industry.

viii                                                                                © Energetics Pty Ltd 2016
Modelling and analysis of Australia’s abatement opportunities
Table of contents
Executive summary .......................................................................................................................... iii
1. Background – Paris meeting of the Conference of Parties (COP21) .................................... 1
o
1.1. Working towards a new global agreement to limit warming to within 2 C .......................... 1
1.2. Australia’s domestic emissions trajectory ........................................................................... 1
1.2. Meeting the 2020 emissions reduction commitment ........................................................... 3
2. Australia’s 2030 emissions reduction task ............................................................................. 5
2.1. Australia’s abatement requirements to meet the 2030 emissions reduction target ............ 5
2.2. Enabling Government policies and programs ..................................................................... 6
3. Modelling Australia’s abatement potential .............................................................................. 8
3.1. Overview ............................................................................................................................. 8
3.2. The key assumptions .......................................................................................................... 9
3.3. Constraints and limitations ................................................................................................ 10
3.4. Describing the abatement opportunities ........................................................................... 11
3.5. Categorisation of each abatement opportunity ................................................................. 12
3.6. Allocating measures to enabling policies and programs ................................................... 14
4. Results – Australia’s abatement potential ............................................................................. 17
4.1. Output 1: Abatement opportunities ................................................................................... 17
4.2. Output 2: The abatement cost curve ................................................................................. 20
4.3. Output 3: Stacked bar chart .............................................................................................. 21
5. Opportunity case studies ........................................................................................................ 23
6. Key insights .............................................................................................................................. 27
6.1. Meeting Australia’s abatement requirement ..................................................................... 27
7. Recommendations ................................................................................................................... 29
Appendix A. Abatement and levelised cost ............................................................................... 30
Appendix B. Assumptions ............................................................................................................ 45
Appendix C. Australian 2030 abatement cost curve ................................................................. 49
About Energetics ............................................................................................................................. 50
Contact details ................................................................................................................................. 51
ix © Energetics Pty Ltd 2016Modelling and analysis of Australia’s abatement opportunities
1. Background – Paris meeting of the
Conference of Parties (COP21)
1.1. Working towards a new global
agreement to limit warming to within 2oC
st
The Paris Conference of Parties (COP) was the 21 meeting of the United Nations Framework
Convention on Climate Change (UNFCCC) member nations to discuss global action on climate
change. The UNFCCC is a universal convention acknowledging the existence of human-induced
climate change and providing pathways for limiting warming.
Australia is a signatory to the Kyoto Protocol, the current binding international agreement for
emissions reduction. The Kyoto Protocol is in its second commitment period (CP2), which ends in
2020. Australia’s emissions reduction commitment during this period is 5 per cent below 2000 levels.
COP21 aimed to create a binding international consensus for post Kyoto emissions reduction.
International consensus achieved during the COP21 was the culmination of a near-20 year review
process following the original introduction of the Kyoto Protocol in 1997. Over 195 national participants
signed the Paris Agreement – committing to a pathway limiting global warming to 2°C with an
aspirational target of limiting warming to 1.5°C above pre-industrial levels.
Australia’s Intended Nationally Determined Contribution
Prior to COP21, individual member nations of the UNFCCC submitted Intended Nationally Determined
Contributions (INDCs) that established national emissions reduction targets for the post 2020 period.
In August 2015, Australia announced an INDC of 26-28 per cent below 2005 levels by 2030. These
were formalised into INDCs within the Paris Agreement during the Paris COP.
1.2. Australia’s domestic emissions trajectory
The development of the abatement task for the 2021-2030 period began with the estimation of the
emissions baseline, which shows the greenhouse gas emissions that can be expected in the period to
2030 in the event that there were no abatement measures in place over that period.
Energetics based the forecast on a consistent year by year reduction in the intensity of emissions per
3
unit of GDP (excluding those from the LULUCF sector). This consistent trend spans the period from
1993 to 2015, which saw a wide range of economic conditions, external shocks and climate change
policies. Figure 6 shows the trend in emissions intensity per unit of GDP generally falling from year to
year.
The outliers are 1990 and 1991, which were the years of the last recession in Australia. Ignoring those
first two years as being unrepresentative of normal economic conditions (and more importantly,
3
Land use, land use change and forestry
1 © Energetics Pty Ltd 2016Modelling and analysis of Australia’s abatement opportunities
unrepresentative of anticipated conditions in the period to 2030), the emissions intensity falls on
4
average by 2.32 per cent each year.
Figure 6: Historical trends in emissions intensity per unit GDP excluding LULUCF
Energetics used a constant 2.17 per cent reduction in emissions intensity (excluding emissions from
the LULUCF sector) to define the business as usual case for national emissions. This figure is the
average year by year reduction in emissions intensity for the period from (financial year) 1993 to 2015
5
excluding 2013 and 2014 . Business as usual captures innovation in the economy as well as
abatement from government policies such as Minimum Energy Performance Standard (MEPS), the
state based white certificate schemes and measures to address non-market barriers such as the
Energy Efficiency Opportunities (EEO) program and the energy rating programs.
Figure 7 shows domestic emissions projected from 2021 starting at 532 Mt CO2-e in 2020. Energetics
have used the Department’s forecast of emissions from LULUCF and applied a constant 2.17 per cent
reduction in the intensity of emissions excluding those from the LULUCF sector. The growth in the
GDP for the period to 2030 was provided by the Department.
4
The emissions intensity also shows a linear trend with time, however our preference is to use a percentage fall from year to year as this better
captures the physical reality – as the intensity falls, it becomes harder to achieve the same absolute reduction in emissions.
5
These latter two years (2013 and 2014) span the period when the carbon tax was in operation and so cannot be considered representative of the
rest of the period.
2 © Energetics Pty Ltd 2016Modelling and analysis of Australia’s abatement opportunities
Figure 7: Projected emissions to 2030
Figure 7 also shows the target trajectory to achieve a 28 per cent reduction in emissions relative to
2005 by 2030. Together with Energetics’ projection of domestic emissions, this implies a cumulative
abatement task of 759 Mt CO2-e to meet the 2030 reduction target.
1.3. Meeting the 2020 emissions reduction
commitment
As noted, Australia is currently a signatory to the second Kyoto commitment period, with an emissions
reduction target of 5 per cent from 2000 levels. Based on the interim update to emissions projections
from the Department (November 2015), the total CP2 cumulative emissions reduction target will be
6
met using a combination of domestic abatement and international units, including carry over .
Energetics modelled a scenario where the minus 5 per cent reduction target in 2020 is met
domestically. Energetics has based this assumption on reasonable additional abatement that could be
delivered by 2020, as outlined in Table 1 below. This creates an emissions starting point of 532.2 Mt
CO2-e in 2020.
6
Available at https://www.environment.gov.au/system/files/resources/d46b4104-0a04-4efb-9e83-df97e58eb2ff/files/tracking-2020-interim-update-
emissions-projections.pdf
3 © Energetics Pty Ltd 2016Modelling and analysis of Australia’s abatement opportunities
Table 1: Opportunities to deliver abatement to 2020
Abatement Annual Comments
opportunities abatement in
2020 (Mt CO2-e)
Utilisation of biomass 9.0 The CEFC recently reported on the opportunities for investment in
for power generation generation using biomass, and identified a potential investment
opportunity of between $3.5 billion and $5 billion between now and
2020 in energy from urban waste, agricultural waste and forest
7
residues .
More aggressive 4.9 Energetics have assumed that 50% of the savings due to the
phasing out of phasing out of emissions intensive substitutes for ozone depleting
emissions intensive gases can be brought forward through Commonwealth
substitutes for ozone regulations.
depleting gases.
Distributed solar PV 3.4 This abatement opportunity would involve the more aggressive
application of CEFC and ARENA funds to accelerate the
deployment of distributed solar PV, especially in the commercial
sector and in remote areas.
Accelerated 10 The abatement cost curve to 2030 identified savings in the
deployment of low transport sector of the order of 33 Mt CO2-e by 2030. The
emissions vehicles Department’s 2015 interim projections update forecasts a 10 Mt
CO2-e increase in transport sector emissions in the period from
2015 to 2020. This abatement opportunity sees the bringing
forward of measures in the transport sector so that emissions in
the sector remain constant. Measures could include mandatory
fleet fuel emissions limits for vehicles as well as measures to
encourage the take-up of low emissions vehicles. For instance,
the Commonwealth could work with the states to promote the
introduction of lower fees, tolls and taxes on low emission
vehicles.
Improving residential 4.8 This abatement opportunity would involve the raising of the MEPS
and commercial levels for key residential and commercial equipment and possibly
equipment efficiency the banning of certain classes of inefficient lights such a halogen
downlights.
The Emissions 21.1 Energetics has assumed, conservatively, that abatement
Reduction Fund purchased by the ERF in the first two auctions fits within the
forecast based on data to 2015. The ERF was assumed to
purchase seven years’ of abatement at the average price of the
first two auctions. Energetics anticipates that the majority of the
abatement delivered through the ERF will be from the land sector.
Other opportunities 13.7 These could include the more rapid introduction of the National
Energy Productivity Plan, additional funding for the ERF;
restrictions on land clearing; the introduction of additional state
based white certificate schemes; marginal increase in the
renewable energy; gas offsetting brown coal fired power
generation. These measures will need to be driven by either the
Commonwealth Government or state governments.
7
“The Australian bioenergy and energy from waste market”, A market report by the Clean Energy Finance Corporation, November 2015
4 © Energetics Pty Ltd 2016Modelling and analysis of Australia’s abatement opportunities
2. Australia’s 2030 emissions
reduction task
2.1. Australia’s abatement requirements to
meet the 2030 emissions reduction
target
Based on Australia meeting the 2020 emissions reduction target, Energetics have focused on what is
needed for Australia to meet the 26-28 per cent 2030 emissions reduction target (referred to in this
document as the 2030 target).
All analysis conducted within the scope of this report focuses on how abatement could be delivered
within current and proposed Federal Government policies, as well as considering abatement that will
be delivered through technological advances and through other programs.
Table 2 outlines the unadjusted 2021-2030 emissions abatement trajectory, total cumulative and 2030
per annum emissions reduction requirements under both the 26 and 28 per cent emissions reduction
targets.
8
Table 2: Australia's 2030 emissions abatement requirement
Cumulative emissions – 2030 p.a emissions
2021-2030 (Mt CO2-e) (Mt CO2-e)
Unadjusted 2030 emissions trajectory 5,575 568
26 per cent emissions reduction requirement 691 115
28 per cent emissions reduction requirement 759 127
Following the initial release of Australia’s INDC, the Department developed indicative estimates of
abatement from possible policy options, referred to as the ‘abatement stacked chart’. The Department
required modelling and analysis of abatement opportunities to augment its understanding of the types
and scale of abatement opportunities included in Figure 8.
8
Based on the Department of the Environment, "Tracking to 2020 - an interim update of Australia's greenhouse gas projections", December 2015
projections.
5 © Energetics Pty Ltd 2016Modelling and analysis of Australia’s abatement opportunities
9
Figure 8: Department of the Environment indicative stacked bar chart
As shown in Figure 8, Australia’s cumulative emissions reduction requirement between 2021 and 2030
was previously estimated at around 900 Mt CO2-e. Energetics’ modelling projects that – from a starting
point of 532 Mt CO2-e in 2020, and an assumption that emissions intensity will continue to decline in
relation to GDP growth – the actual cumulative abatement required for this period will be lower.
2.2. Enabling Government policies and
programs
There are a number of Federal Government policies and programs that will operate to enable Australia
to meet a 26-28 per cent reduction target. Energetics’ analysis has predominantly focused on key
Government programs and policies that are in existence or that have been foreshadowed. Specifically
included within the analysis are:
The Emissions Reduction Fund (ERF) and the Safeguard Mechanism
The National Energy Productivity Plan (energy efficiency)
The National Energy Productivity Plan (vehicle efficiency).
Abatement opportunities that are not covered by one of the above Government programs were
allocated to one of the following categories:
9
https://www.environment.gov.au/system/files/resources/f52d7587-8103-49a3-aeb6-651885fa6095/files/summary-australias-2030-emissions-
reduction-target.pdf accessed November 2015.
6 © Energetics Pty Ltd 2016Modelling and analysis of Australia’s abatement opportunities
Technological advances – which effectively incorporates projected adoption of low emission
technologies and innovation as well as shifting market forces out to 2030, and alternative
10
regulatory and non-government drivers which also result in the creation of abatement.
Other programs – which includes the Ozone Protection and Synthetic Greenhouse Gas
Management Programme
Further information on how abatement opportunities were allocated to each of the above categories is
included in Section 3.6.
Expansion of the Renewable Energy Target (RET) was not considered in the analysis, however the
RET has influenced both the anticipated emissions baseline, as well as the anticipated grid emissions
factor out to 2030.
10
An example of this additional abatement would be abatement arising from reductions in energy use in the built environment that was driven by
changes to state government planning laws.
7 © Energetics Pty Ltd 2016Modelling and analysis of Australia’s abatement opportunities
3. Modelling Australia’s abatement
potential
3.1. Overview
Following the announcement of Australia’s INDC, Energetics was engaged by the Department to
review the types of measures that are likely to deliver the abatement necessary for Australia to
achieve the 28 per cent emissions reduction target. This work involved the delivery of three key
outputs:
1. An assessment of abatement that could be delivered by technology breakthroughs
2. Updated abatement cost curves for Australia for 2030
3. An updated stacked bar chart assigning effective abatement opportunities over the period
2021 to 2030 to achieve the emissions reduction target.
In assessing potential abatement opportunities for Output 1, Energetics considered the following types
of measures:
Cumulative 2021-2030 abatement from commercially viable and commonly deployed
measures that are currently not included in the Department’s emissions projections
Abatement and potential abatement opportunities from low emission technologies and
measures that are currently available but not widely deployed
Low emissions technologies that are not yet commercial but on the horizon.
Energetics did not consider unforeseen technological advances that could occur over the 15 year
period between 2015 and 2030. An historical example of unforeseen technological advances is the
speed at which lighting technologies were upgraded in recent times. In the early 2000s halogen
downlights were seen as the only option for replacing incandescent lamps. As a result, a 15 year
abatement projection from the early 2000s would have failed to consider the impact of LEDs in total
lighting upgrade abatement.
The abatement opportunities identified in Output 1 formed the basis of both Outputs 2 and 3. Full
results for each of the outputs are available in section 4.
Energetics’ approach focuses on the total abatement potential and the associated levelised costs to
society.
It is important to note that the work did not involve modelling an ‘abatement scheme’. Neither the
abatement cost curve in Output 2, nor the stacked bar of Output 3, considered different Australian
Carbon Credit Unit (ACCU) pricing scenarios or the potential market response to the uptake of
different measures.
8 © Energetics Pty Ltd 2016Modelling and analysis of Australia’s abatement opportunities
3.2. The key assumptions
Calculation of total abatement potential
The following assumptions were made when calculating both the cumulative abatement potential and
the 2030 per annum abatement potential:
All abatement potential was calculated based on projected 2030 annual abatement figures
with deemed uptake rates to develop the cumulative abatement over the 2021 – 2030
period. Energetics focused on abatement opportunities most likely to generate meaningful
abatement within this period.
Uptake rates were assumed for each abatement opportunity based on the varying
technology maturity and applied using a linear or sigmoidal approach, based on Energetics’
expert judgement. The different uptake rate types are as included in Appendix B.
Unless otherwise specified, abatement driven by Federal Government policies as outlined in
section 2.2 is considered to commence from 2021.
Abatement was estimated using a bottom-up approach for all sources. The exceptions were
emissions from Land Use, Land Use Change and Forestry (LULUCF), waste management
and fugitive emissions.
Abatement from direct combustion, electricity and transport were based on potential
fuel savings, and assumed total uptake across the relevant sectors based on
Energetics sectoral knowledge and estimates. All assumptions made were
conservative.
Sectoral and end-use energy data was sourced from the Office of the Chief
Economist, and projected out to 2030 using the sectoral annual increases in energy
consumption estimates (total percentage increase).
The estimates for abatement associated with LULUCF were derived from work
11
reported by ClimateWorks in 2010 , which in turn was built on work undertaken by
CSIRO. Energetics reviewed the ClimateWorks estimates against the most recent
Queensland “Estimates of Queensland’s greenhouse gas emissions from land use,
12
land use change and forestry 2015-2030” report.
Abatement opportunities in the waste and fugitives sectors were estimated using a top
down approach based on potential emissions reduction opportunities in 2030 for the
relevant Australian Greenhouse Emissions Information System (AGEIS) emissions
sub-sectors.
Calculation of levelised cost of abatement
The following assumptions were made in calculating levelised costs:
11
Estimates of Queensland’s greenhouse gas emissions from land use, land use change and forestry 2015-2030 – produced for the Inter-
departmental Committee on Climate Change - As provided to Energetics by the Department of Environment on 2 November 2015
12
Ibid
9 © Energetics Pty Ltd 2016Modelling and analysis of Australia’s abatement opportunities
Energetics calculated the total levelised cost of abatement using a total societal resource
cost approach. The levelised cost from the perspective of investors was not considered.
Where information was readily available, Energetics undertook a bottom up analysis of total
implementation costs (capital, installation and operational costs) for each abatement
opportunity.
Where bottom up modelling was not possible, Energetics undertook a literature review to
identify likely levelised costs of abatement from the best available information. These figures
were peer reviewed internally and externally.
Fuel savings associated with an abatement opportunity were calculated based on Energetics
estimate of the fuel costs to society in 2030.
The implementation cost for abatement opportunities was taken to be the net cost to
Australia of the capital and labour required to implement the abatement. This was modelled
through the use of a factor that captured the fraction of the implementation cost to investors
that is circulated back into the Australian economy. Energetics did not use a general
equilibrium model to assess the economic impact of abatement opportunities.
Appendix A contains:
The outcomes of the assessment, including total cumulative abatement 2021-2030 and 2030
per annum for each abatement opportunity
The levelised cost of abatement in 2030 for each abatement opportunity.
The full set of assumptions for each measure can be found in Appendix B.
3.3. Constraints and limitations
There were a number of constraints and limitations associated with the scope of work. These
constraints are outlined below:
Broad consultation was not possible within the timeframe. Instead, where further information
was required on abatement opportunities, Energetics consulted directly with a number of
individual stakeholders including Telstra, GPT and the Low Carbon Living CRC.
For completeness, the levelised costs of potential abatement associated with power
generation decarbonisation have been included in the abatement cost curve. However these
have not been included in the stacked bar analysis as there is no post-2020 supporting
government policy.
As highlighted above, in some instances commercial information was not available to
develop bottom up implementation costs. Levelised costs of potential abatement were
obtained from reputable sources and subject to both internal and external peer review
processes.
10 © Energetics Pty Ltd 2016Modelling and analysis of Australia’s abatement opportunities
13
The analysis did not make any assumptions regarding unforeseen technological advances
that could occur over the 15 year period between 2015 and 2030. However, such advances
will contribute additional abatement opportunities during this time.
The analysis did not undertake detailed policy modelling. Energetics considered only
abatement opportunities that were feasibly able to be delivered within the 2021-2030
timeframe, and allocated each opportunity to the most appropriate policy or program. No
modelling was undertaken of the appropriate policy mechanisms the Government could
introduce to ensure these abatement opportunities are delivered under the relevant policy or
program.
3.4. Describing the abatement opportunities
Energetics’ approach to developing a comprehensive list of abatement opportunities was to focus on
those that met the following criteria:
They could feasibly generate meaningful abatement by 2030.
Delivery is possible under one of the above mentioned Federal Government programs, an
alternative program, or in extrapolated business as usual circumstances.
The identified abatement opportunities were unlikely to face any economic or technological
barriers to uptake prior to 2030.
Abatement opportunities explored fell under three categories:
Extrapolated abatement from commercially viable and commonly deployed opportunities.
Abatement and potential abatement from low emission technologies and activities that are
currently available but not widely deployed.
Low emissions technologies that are not yet commercial but on the horizon (for example,
electric vehicles).
As previously noted, Energetics did not make any assumptions as to the impact of unforeseen
technological advances. This fourth category has the potential to deliver significant additional
abatement to Australia’s cumulative target.
In total over 90 abatement opportunities were identified and refined to a final list of 76 abatement
14
opportunities .
Each of the abatement opportunities were allocated to one of 12 groups. Classifying potential
abatement into groups enabled alignment with existing government programs, and served to highlight
where additional policy support is needed over the 2021-2030 period.
1. Built environment and integrated low carbon buildings
2. Low carbon precincts and smart urban design
13
By “unforeseen” we are referring to technology advances that are beyond greenfield; with no peer reviewed supporting material indicating that
they will deliver abatement by 2030.
14
Additional electricity decarbonisation measures were included within the abatement cost curve for completeness but did not factor into the total
stacked bar abatement potential as they would require an expansion of the RET to be realised.
11 © Energetics Pty Ltd 2016Modelling and analysis of Australia’s abatement opportunities
3. Digital infrastructure displacing transport fuel use
4. Intelligent industrial and building management systems
5. High performance, low carbon energy generation and distribution
6. Advanced industrial energy efficient equipment and process improvement (including
agriculture)
7. Advanced commercial energy efficient equipment
8. Low carbon transport
9. Improved land management and low emissions farming practices
10. Fugitive emissions management
11. Waste management
12. Management of substitutes for ozone destroying substances (HFCs)
These groups were considered to provide an exhaustive coverage of all major areas of both
established and emerging abatement opportunities in 2030.
Low carbon precincts (group 2) and digital infrastructure displacing transport fuel use (group 3) are
likely to require additional support beyond that considered. These groups are forecast to deliver the
lowest quantity of abatement on a per annum basis in 2030, but are likely to contribute a significant
portion to the total abatement potential in the period from 2030 to 2050. An e xample of a measure that
is likely to generate significant abatement in the period after 2030 is the roll out of personal
autonomous vehicles. While Energetics’ analysis did not forecast any significant role for personal
autonomous vehicles in the period to 2030, the analysis shows that the widespread deployment of
plugin electric vehicles is likely to provide some abatement by 2030.
3.5. Categorisation of each abatement
opportunity
Each abatement opportunity was subjected to a further categorisation. Specifically for each potential
abatement opportunity, Energetics considered:
Sources of emissions that were abated
The type of abatement as detailed below
The enabling policy or program (based on the policies and programs outlined in section 2.2).
Sources of emissions abated
15
Each measure was allocated to a source of abatement, aligning with the Department’s definition .
15
https://www.environment.gov.au/system/files/resources/51b72a94-7c7a-48c4-887a-02c7b7d2bd4c/files/abatement-task-summary-report_1.pdf
accessed November 2015
12 © Energetics Pty Ltd 2016Modelling and analysis of Australia’s abatement opportunities
Table 3: Breakdown by sources abated
Sources abated Source description
Electricity Emissions from the electricity sector are largely driven by changes in demand and
emissions intensity. Electricity abatement measures considered were related to
reducing electricity consumption or offsetting electricity to the grid through
increased renewable distribution.
Direct combustion Direct combustion emissions occur when fuels are combusted for stationary
energy purposes to generate heat, steam or pressure (excluding electricity
generation). Direct combustion of fuels occurs across most sectors in the economy
including mining, manufacturing, and construction, as well as domestically through
heating and cooking. Energetics assessment of direct combustion measures
related predominantly to mining and industrial measures, considering process
changes within operations and the supply chain, and technological advances.
Measures related to residential consumption of gas for heating and cooking were
considered to be largely immaterial. The Department’s projections include
emissions from mine and agricultural vehicles as direct combustion.
Transport The transport sector covers emissions from the direct combustion (or end-use
emissions) of fuels by road, rail, domestic aviation and domestic shipping. Within
this sector, Energetics focused on abatement opportunities based on both
technological advances and operational change.
Fugitives The fugitives sector covers emissions associated with the production, processing,
transport, storage, transmission and distribution of fossil fuels such as coal, oil and
natural gas. Fugitive emissions assumptions were focused on technological
advances in fugitive emissions management.
Industrial processes and The industrial processes sector encompasses emissions generated from a range
product use of production processes. This sector covers non-energy emissions arising from
metal production, the chemical industry, mineral products, consumption of halo-
fluoro-carbons and sulphur hexafluoride, and food and drink production.
Examples include nitrous oxide emissions during the manufacture of ammonium
nitrate, carbon dioxide emissions from the decomposition of calcium carbonate
during clinker production and carbon dioxide emissions from the reduction of metal
oxides such as alumina and iron oxide.
Agriculture The agriculture sector includes emissions from enteric fermentation, manure
management, rice cultivation, agricultural soils, prescribed burning of savanna and
field burning of agricultural residues.
Waste The waste sector covers emissions from the disposal of organic materials to
landfill and wastewater emissions from domestic, commercial and industrial
sources. Emissions are predominantly methane, generated from the anaerobic
decomposition of organic matter.
Energetics assessment of waste measures considers both improved treatments of
13 © Energetics Pty Ltd 2016Modelling and analysis of Australia’s abatement opportunities
Sources abated Source description
methane, as well as potential waste to energy options, offsetting grid electricity.
LULUCF The LULUCF sector includes emissions and removals from deforestation,
afforestation and reforestation activities. From 2013, emissions and removals from
forest management, cropland management, grazing land management and
revegetation are also reflected in the LULUCF sector.
Abatement types considered
Energetics classified each abatement opportunity into one of the following:
Energy productivity – encompassing all traditional energy efficiency measures as well as
emerging energy productivity measures such as smart grids and system optimisation
Renewable energy – with a focus on commercial, residential and remote distributed
generation, as opposed to the decarbonisation of Australia’s stationary energy sector
Fuel switching – within the mining, industrial and transport sectors
Waste management – in solid waste and wastewater treatment
Land use change
Management of industrial processes
Management of agricultural processes
Fugitives emissions management
This provides an overview of the areas that are likely to deliver the greatest quantum of abatement
with appropriate policy intervention through existing and proposed Federal Government initiatives as
outlined in section 2.2. While there is some alignment between the categorisation to sources abated
and to abatement type, the abatement types provide additional granularity on the sorts of measures
that can deliver abatement within the electricity, direct combustion and transport source categories.
3.6. Allocating measures to enabling policies
and programs
Finally, each abatement opportunity considered was allocated to an enabling policy or program based
on the following approach.
Technological advances and other sources of abatement
Commercial uptake of low emission technologies and abatement opportunities were incorporated into
the projections based on Energetics’ experience and insights to business behaviour. Commercial
adoption of these abatements are classified as “technological advances” within the final stacked bar.
14 © Energetics Pty Ltd 2016Modelling and analysis of Australia’s abatement opportunities
Examples of technological advances, operational changes and process changes that are considered
business as usual are provided below:
Technological advances – the upgrading of lighting to LEDs in the commercial building
sector. Driven by significant energy cost savings, LED affordability and phase out of existing
T8 fittings.
Operational changes – best practice energy data management with automated response
systems in commercial buildings. This practice effectively results in avoiding excess
electricity use through real-time alerts. Operationally, it delivers significant energy savings for
a very low return on investment. Real time energy data management is currently undertaken
by best practice property portfolios, such as GPT. Energetics expects that increased market
competition together with the energy savings potential, will drive this practice across all
premium, Class A and Class B property managers by 2030.
Process changes – autonomous mining results in significant emissions abatement through
the controlled and optimised operation of mining equipment and plant. Energetics expects
mines of the future to be autonomous, yet the business decision to develop autonomous
mines will be underpinned by enhanced productivity, lower labour costs and continuous
mining operations. Emissions reductions will be a co-benefit of process changes, not the
primary driver.
The other sources of potential abatement considered within this categorisation include measures that
are driven by regulatory standards, or initiatives not currently falling under the remit of the Federal
Government policies and programs outlined in section 2.2. Included under this categorisation are
state-based regulatory requirements; other Federal regulatory requirements and government
programs; and the impact of changing market forces which may lead to emissions reduction measures
that go beyond business as usual. These are outlined in further detail below:
State planning and regulatory requirements – abatement opportunities related to the built
environment are likely to be driven by state planning laws such as enhanced BASIX SEPP
and through the State Environmental Planning Policy No 65 – Design Quality of Residential
Apartment Development (SEPP 65) requirements in NSW. Also included are state based
regulatory requirements resulting in incidental abatement. An example would be the
harmonisation of the current Queensland coal mining operational health and safety (OHS)
16
requirements to treat coal mine waste gas , with existing NSW legislation.
Changing market forces – Energetics also considered the impact of shifting market forces
applying pressure on organisations to achieve abatement beyond business as usual. Based
on Energetics’ expertise and experience working across the Australian resources sector –
particularly within the coal mining and oil and gas production sectors – the continued access
to finance is one of the biggest operational and strategic risks in these sectors.
It is difficult to anticipate the impact of such movements. However, it is likely that any further
contraction of the finance pool for Australian fossil fuel projects, will influence the oil and gas,
and coal mining sectors to adopt best practice fugitive emissions management practices by
2030.
16
Note that Energetics believes that management of coal mining fugitive emissions through degasification and enhanced degasification will be
driven by a combination of expanded regulatory requirements, and increasing pressure from domestic and international investors pushing for
improved social licence to operate.
15 © Energetics Pty Ltd 2016Modelling and analysis of Australia’s abatement opportunities
Phase out of substitutes of ozone depleting substances
This categorisation is in line with the Department’s previously released stacked bar chart and captures
abatement to be delivered under the Ozone Protection and Synthetic Greenhouse Gas Management
Programme. This Programme seeks to reduce emissions arising from Ozone Depleting Substances
(ODS) and Synthetic Greenhouse Gases (SGGs).
National Energy Productivity Plan
Energy and vehicle efficiency improvements that are likely to have a negative cost to society (and in
many cases, a negative cost to participants) were placed in the National Energy Productivity Plan.
Energetics assumed that programs will be required to address non-financial barriers through non-
financial means.
Negative cost abatement opportunities relating to vehicle efficiency, better management of data in
passenger transport and fuel efficiency standards were allocated to National Energy Productivity Plan
as vehicle efficiency measures. Remaining abatement opportunities were captured under the broader
National Energy Productivity Plan.
The ERF and the Safeguard Mechanism
The remaining abatement opportunities were allocated to the ERF and Safeguard Mechanism. The
total abatement delivered under the ERF will vary depending on the future ACCU price. ACCU prices
will be influenced by a number of factors, including:
The total implementation costs to the end-user for positive cost abatement on a $/tCO2e
basis (noting that the ACCU will only need to cover the marginal cost to make the project
return on investment attractive).
The existence and prominence of a secondary ACCU market resulting from the Safeguard
Mechanism.
Energetics assumed that the Safeguard Mechanism will deliver the remainder of the abatement not
purchased under the ERF. Energetics expects that there will be a significant intersection between the
two programs in the post-2020 period. ERF projects could help to reduce emissions at safeguard
facilities; and safeguard facilities can purchase ACCUs to offset their emissions and help them to meet
their safeguard obligations.
16 © Energetics Pty Ltd 2016Modelling and analysis of Australia’s abatement opportunities
4. Results – Australia’s abatement
potential
The following section provides an overview of Energetics’ findings in respect of Australia’s total
abatement potential for each of the three outputs.
4.1. Output 1: Abatement opportunities
Energetics identified the order of 962 Mt CO2-e of potential abatement in the period from 2021 to
17
2030 that could be applied to the task of meeting the 2030 reduction target. This is beyond the total
18
abatement required to meet the 28 per cent emissions reduction target in 2030 . Achieving the
appropriate levels of abatement from within this pool of abatement options will be dependent on
implementing the appropriate policy responses.
Figure 9 below demonstrates how the identified potential abatement compares with Energetics’
emissions projections, and the trajectory required to meet the 28 per cent reduction target.
Figure 9: Impact of the potential abatement opportunities
Additional abatement opportunities not currently modelled could come from areas such as
decarbonisation of Australia’s electricity generation sector. All figures included below demonstrate
17
A further 1125 Mt CO2-e of emissions reduction spanning the period from 2015 to 2030 was identified during the work. This abatement was
considered to be part of the baseline, and so was not included in the analysis of measures to meet the 2030 abatement task. We also excluded
the abatement potential from coal to gas shift (new build) and onshore wind which were included in the abatement cost curve but were considered
to be infeasible to meeting the abatement challenge within the scope of current government policies.
18
From the assumed 532.2 Mt CO2-e in 2020 start point
17 © Energetics Pty Ltd 2016Modelling and analysis of Australia’s abatement opportunities
total possible abatement to illustrate the total abatement potential of sectors, as opposed to
contribution required to achieve Australia’s emissions reduction targets.
Abatement by grouping
Energetics’ analysis has found that ‘improved land management and low emissions farming practices’
and ‘low carbon transport’ are capable of contributing the most to Australia’s total low-cost abatement
by 2030. In total the two groups account for just over 50 per cent of Australia’s total identified
abatement potential. A full list of the abatement opportunities included within each group is included in
Appendix A.
Figure 10 below shows the breakdown of Australia’s abatement by group.
Figure 10: Cumulative abatement potential by grouping
Abatement by source
When considering abatement by source abated, the LULUCF sector is anticipated to deliver the most
significant level of abatement. As demonstrated in Figure 11, the electricity sector will also potentially
deliver significant abatement, followed by Transport, Fugitives and Direct Combustion.
18 © Energetics Pty Ltd 2016Modelling and analysis of Australia’s abatement opportunities
Figure 11: Cumulative abatement potential by source
Abatement opportunities by abatement type
When considering total abatement potential by abatement type, energy productivity has the potential
to deliver a significant portion of Australia’s annual emissions abatement in 2030 and cumulative 2021
to 2030 abatement needs. Of the identified abatement opportunities, energy productivity accounts for
44 per cent. As with the above, land use change follow closely behind with 37 per cent of the total
identified abatement. Figure 12 below demonstrates the total abatement by abatement type.
Figure 12: Abatement opportunities by abatement type
19 © Energetics Pty Ltd 2016You can also read