Virginia Beach Housing Needs Assessment and Market Analysis 2000-2020
←
→
Page content transcription
If your browser does not render page correctly, please read the page content below
Virginia Beach Housing Needs
Assessment and Market Analysis
           2000-2020

                Prepared for

         The City of Virginia Beach

                Prepared by

       Center for Housing Research
              Virginia Tech
             Blacksburg, Virginia

          C. Theodore Koebel, PhD
             Ragaei Abdelfattah
              Marilyn S. Cavell
               Amy E. Crum
             Joanna M. Paulson

                April 2005
Virginia Beach Housing Needs Assessment and Market Analysis 2000-2020
Table of Contents
Summary ........................................................................................................................ 1
Housing Market Characteristics ....................................................................... 4
Vacancy Rates ............................................................................................................... 4
Housing Prices............................................................................................................... 5
Rental Housing ............................................................................................................ 10
First-time Homebuyers............................................................................................... 11
The Affordable Housing Gap in 2000 ....................................................................... 15
Military Housing ....................................................................................................... 17
Workforce Housing ................................................................................................. 19
Commuting Patterns.............................................................................................. 29
Household Demographics................................................................................... 31
Household Composition.............................................................................................. 31
Incomes and Poverty................................................................................................... 32
Housing Tenure........................................................................................................... 40
Housing Needs.......................................................................................................... 45
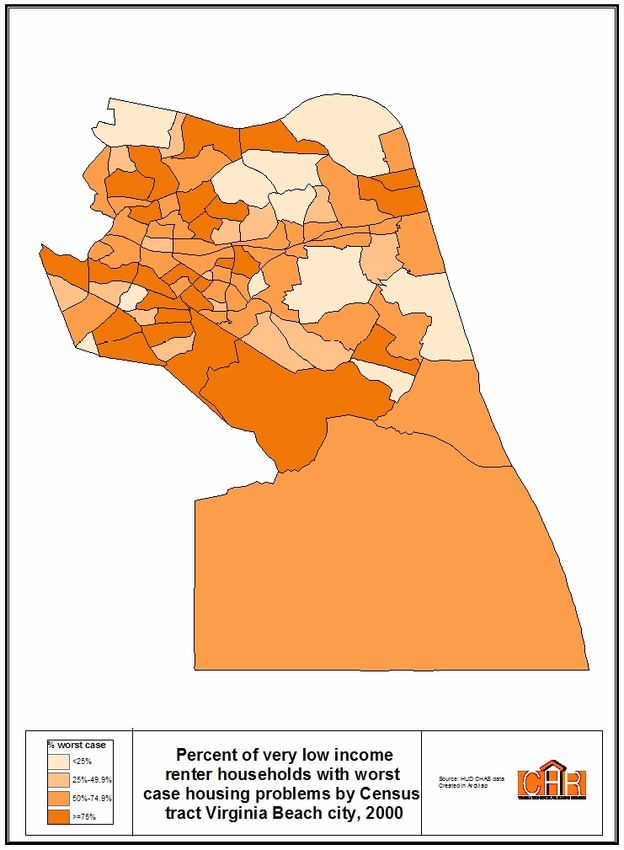
Worst Case Housing Needs ........................................................................................ 45
Housing Cost Burden.................................................................................................. 49
Homelessness ............................................................................................................... 53
Housing Problems by Household Type ..................................................................... 53
Persons with Disabilities............................................................................................. 56
Population Growth.................................................................................................. 61
Change within the City............................................................................................... 62
Migration ..................................................................................................................... 64
Appendix I: Glossary of Terms and Acronyms ........................................ 75
APPENDIX II: City Comparisons ...................................................................... 78
Center for Housing Research, Virginia Tech iVirginia Beach Housing Needs Assessment and Market Analysis 2000-2020
Summary
At the request of the City of Virginia Beach, the Virginia Tech Center for Housing
Research conducted a comprehensive assessment of affordable housing demand and
housing needs for the City.1 This assessment reviewed the most recent demographic and
housing data available, evaluated past trends and projected housing demand through to
2020. The study’s major findings include:
• Vacancy rates for owner and renter housing have dropped well below the level
needed to accommodate demand and indicate that housing available on the market
is increasingly scarce. Whereas a vacancy rate of at least 5% is considered
necessary to provide an adequate supply of housing for home seekers, the
ownership vacancy rate in 2000 was only 1.5% and fell below 1% in 2003 (the
most recent date available), reflecting an extremely tight market. Rental vacancy
rates also point to a shortage of housing in Virginia Beach. In 2000, the rental
vacancy rate was 4.0% in the City, well below the national rate of 6.8%. By 2003
the rental vacancy rate fell to only 2.5%, whereas rental vacancy rates were
increasing in both the nation and in Virginia as a whole. More recent evidence
suggests vacant rental units have become even scarcer in Virginia Beach, despite
a surge in ownership demand fueled by low interest rates.
• Housing prices have escalated rapidly and the supply of affordable housing is
decreasing. The range of prices below the median ($154,000 in 2003) has
clustered closer to the median as the supply of houses below $125,000 has
declined significantly. Houses with values below $50,000 are virtually non-
existent and the number of houses between $50,000 and $100,000 has declined
substantially.
• First-time homebuyers are in danger of being squeezed out of the Virginia Beach
housing market. Between 2000 and 2004, first-time homebuyers with incomes
below $50,000 faced a dwindling supply of houses that they could afford and
must compete for the available supply with homebuyers with higher incomes,
including repeat buyers. Home seekers priced out of ownership will turn to the
rental market (already very tight) or move out of Virginia Beach to find
affordable housing.
• The City had a deficit of 8,500 affordable rental units in the year 2000.
Consequently, low-income renters were forced to spend large portions of their
incomes (often in excess of half) in order to obtain housing. Low-income
homeowners also face a shortage of affordable units, with a deficit of about 6,000
affordable owner units in 2000. As with low-income renters, this gap forces low-
income owners to pay excessively high portions of their income for their housing.
1
For further information contact the Virginia Tech Center for Housing Research, Mail Code 0451,
Blacksburg, Virginia 24061. Phone 540.231.3993, FAX 540.231.7331; email mcavell@vt.edu; website:
http://www.caus.vt.edu/vchr
Center for Housing Research, Virginia Tech 1Virginia Beach Housing Needs Assessment and Market Analysis 2000-2020
• Housing demand from military personnel is part of the City’s affordable housing
challenge. Among the naval bases in Virginia Beach, nearly 10,000 housing units
are needed in the private housing market.
• The housing market is not keeping up with housing demand related to the
expansion of civilian jobs and housing affordable to low and modest income
workers is increasingly hard to find. Between 1990 and 2000, the number of
wage and salary jobs in Virginia Beach (excluding non-civilian military
employment) increased by 53,300 jobs. Given the average number of workers per
household in Virginia Beach, 53,300 jobs equates to housing demand for 37,450
units. However, the supply of housing units only increased (net) by 15,240 units,
leaving a deficit of 22,210 units in 2000. Between 2000 and 2002, housing
production was sufficient to keep up with job growth but inadequate to offset the
earlier deficit. Two jobs are often necessary for low and modest wage workers to
afford housing in Virginia Beach.
• Commuting out of Virginia Beach is decreasing and commuting in is increasing.
There was a 45% increase in the total number of commuters into Virginia Beach
between 1990 and 2000, with the largest percent increases from Suffolk, Newport
News and Hampton. While there was a 2% decrease in the number of workers
commuting out of Virginia Beach and a 9% increase in workers who both live and
work in Virginia Beach, Virginia Beach was still a net exporter of commuters in
2000, as more people commuted out of the City to work (94,687) than commuted
in (45,655).
• Although household incomes in Virginia Beach kept up with inflation between
1990 and 2000 at the median (with a 2% gain in real income), higher income
households had significant gains above inflation while lower-income households
had significant losses in real income. Households below the median income are
losing ground to housing costs.
• The Black-White income gap is large but becoming narrower and while
homeownership is increasing overall, however a significant gap remains between
ownership rates for blacks compared to whites. Among racial and ethnic groups,
Virginia Beach’s Asian households had the highest homeownership rate at 72.8%
in 2000 compared to whites at 69.7% and blacks at 48.7%.
• Female-headed families and elderly females living alone are heavily impacted by
poverty. The majority of households that fall below the poverty level are female-
headed households (62%). Females are particularly vulnerable to reductions in
income due to family dissolution, which can significantly reduce housing
consumption and increase cost burdens.
• There were nearly 12,000 households with worst case housing needs in 2000,
including the elderly and persons with disabilities.
Center for Housing Research, Virginia Tech 2Virginia Beach Housing Needs Assessment and Market Analysis 2000-2020
• Population growth has slowed considerably for the City and the region. Between
1980 and 1990, the City’s population increased by nearly 50%. However, during
the 1990s, Virginia Beach’s growth rate dropped to 8%. More people are now
moving out of Virginia Beach than moving in. The Virginia Employment
Commission (VEC) projects growth for the City of 5% from 2000-2010 and
between 3-4% per decade thereafter.
• Even with slowing population growth, more than 10,000 additional housing units
will be needed to meet projected demand during this decade, including 2,600
additional units affordable to households with incomes below $35,000.
Center for Housing Research, Virginia Tech 3Virginia Beach Housing Needs Assessment and Market Analysis 2000-2020
Housing Market Characteristics
Vacancy Rates
The vacancy rate is a key indicator of the adequacy of the supply of housing relative to
demand and a five percent vacancy rate is largely accepted as a minimum benchmark for
a sufficient number of housing units available for occupancy by people searching for
housing. Vacancy rates below five percent often reflect “tight” housing markets where
prices can escalate rapidly; rates significantly above five percent can reflect “weak”
markets where prices (and maintenance) can be depressed by an excess supply of
housing.
The most recent evidence shows that the Virginia Beach housing market has become
increasingly tighter during the current decade compared to the State of Virginia and the
nation as a whole. According to the American Community Surveys data for 2003 and
Census 2000 (Figure 1), the vacancy rate2 for Virginia Beach was already very low in
2000 and then declined even further by 2003 from 2.4% (3,729 vacant units in 2000) to
0.9% (1,416 vacant units in 2003). During the same period, the national vacancy rate
increased from 3.5% to 3.9 %, and the vacancy rate for Virginia went from 2.7% to 3.6%.
Figure 1. Vacancy Rates, 2000 and 2003
5.0%
3.9% 3.6%
4.0% 3.5%
3.0% 2.7%
2.4%
2.0%
0.9%
1.0%
0.0%
2000 2003
United States Virginia Virginia Beach
Owner vacancy rates point to a housing market in the City of Virginia Beach that was
already extremely tight in 2000 and that has since become progressively tighter. The
ownership vacancy rate in 2000 was only 1.5% and fell below 1% in 2003 (the most
recent date available). (See Table 1.)
2
The vacancy rate includes only those units for sale or rent and available for occupancy. Total vacant units
include these units as well as units rented or sold but not occupied; vacant units used for seasonal,
recreational or occasional use; vacant units used for migrant workers; and “other” vacant units not available
for occupancy.
Center for Housing Research, Virginia Tech 4Virginia Beach Housing Needs Assessment and Market Analysis 2000-2020
Table 1: Vacancy Rates by Tenure, 2000-2003
United States Virginia Virginia Beach
2000 2003 2000 2003 2000 2003
Renter Vacancy 6.8% 8.0% 5.2% 8.2% 4.0% 2.5%
Owner Vacancy 1.7% 1.7% 1.5% 1.4% 1.5% 0.2%
Source: US Census 2000 and ACS 2003
Rental vacancy rates, as shown in Table 1, also point to a shortage of housing in Virginia
Beach. In 2000, the rental vacancy rate was 4.0% in the City, well below the national
rate of 6.8%. Although rental vacancy rates increased in the nation and the state between
2000 and 2003, in Virginia Beach the rental vacancy rate fell to only 2.5% in 2003 and
more recent evidence suggests vacant rental units have become even scarcer. A vacancy
survey administered by the Tidewater Multifamily Housing Council in August 2004
indicated that the rental vacancy rate throughout the metro area continues to decline and
estimated a 1% rental vacancy rate in Virginia Beach. Although the Council’s vacancy
survey does not include all rental units in the area and cannot be used as an estimate of
total vacancies, it nonetheless indicates a tightening rental market despite a surge in
ownership demand fueled by low interest rates.
In contrast to the nation and the state as a whole, where strong owner markets resulted in
weaker rental markets, the rental market in Virginia Beach has become nearly as tight as
the owner market. This could possibly reflect a conversion of rental housing to owner
occupancy, reducing units available in the rental market. Although renter demand has
not increased as rapidly as owner demand, the number of renters continues to increase.
The overall tightness of the housing market in Virginia Beach will continue to push
housing prices and rents higher unless the supply of housing increases sufficiently to
produce vacancy rates around 5% (which would have required an additional 5,665 vacant
units for sale and 1,358 vacant units for rent). The impact of scarce housing probably
will be the most severe for those seeking lower cost housing. It is virtually impossible to
expand the supply of lower cost housing through new construction due to land and
construction costs. With a dwindling supply of developable land, this situation will only
become more severe and the cost of newly built housing will continue to escalate. And
with a severe housing shortage, older and lower quality units become more and more
attractive to people with higher incomes. Extremely low vacancy rates lead to “bidding
wars” when home seekers compete for units that come on the market, with sellers often
receiving bids well above their asking price. This shrinks the supply of housing
affordable to households with modest incomes by displacing them with households with
higher incomes and by increasing the market price for these units. Those displaced either
have to find housing outside of Virginia Beach or be willing to pay a high proportion of
their income for housing within the City.
Housing Prices
Housing prices and rents in the metropolitan area and in Virginia Beach City have
increased dramatically in the last few years. According to the National Association of
Center for Housing Research, Virginia Tech 5Virginia Beach Housing Needs Assessment and Market Analysis 2000-2020 Realtors®, the Virginia Beach metropolitan area was 7th in the nation in the rate of increase in the median sales prices for existing homes during 2004, with an increase of 27.3%.3 Based on sales data for local Realtors associations covering 2000 through 2003, the Center for Housing Research estimated a 28.8% increase in the median sales prices of all homes in the metropolitan area.4 These data indicate that the price of houses being sold in the metropolitan area has increased 64% between 2000 and 2004. This is well beyond the rate of increase in incomes, which have been increasing by less than 3% a year, or approximately 11% between 2000 and 2004. Figure 2 provides the median sales price for existing homes sold in the US and in the Virginia Beach MSA5 as reported by the National Association of Realtors®. The figure also provides the Median Family Income for the US (estimated by the Census Bureau) and for the Virginia Beach MSA (estimated by the US Department of Housing and Urban Development). The median sales price in the MSA is lower than the national median and ranked 40th among metropolitan areas in 2004. However, housing prices are increasing more rapidly in the MSA than the nation, particularly after 2002. The Median Family Income in the MSA is nearly equal to that for the US and, as with the national Median Family Income, the median family income in the MSA has been increasing at a much slower pace than median prices. Fortunately, mortgage interest rates declined significantly after 2000, which helped increase homeownership demand despite rapid increases in prices and also allowed existing homeowners to reduce their debt payments through refinancing. Interest rates on 30-year loans went from an average of 8.2% in 2000 to an average of 5.8% in 2003 and even somewhat lower in 2004. In addition, lenders have a variety of mortgage loan products, such as interest-only loans, that can increase affordability for many homebuyers. Rapid escalation in prices even could have prompted home seekers to buy in anticipation of higher prices in the future, which would increase their own wealth if they have equity in a home but would make buying in the future less affordable. But mortgage interest rates started to increase in 2005 and higher interest rates combined with current housing prices could decrease ownership affordability significantly and have contributed to speculation about a “housing price bubble” which would be unsustainable if demand suddenly decreased. 3 Between the 3rd quarter 2003 and 3rd quarter 2004, the most recent periods available. 4 “Homeownership Affordability in Virginia,” 2004 available at www.caus.vt.edu/CAUS/RESEARCH/vchr/VCHR.html 5 Virginia Beach-Norfolk-Newport News, VA-NC Metropolitan Statistical Area including the following jurisdictions: Currituck County–NC, Gloucester County–VA, Isle of Wight County–VA, James City County–VA, Mathews County–VA, Surry County-VA, York County-VA, Chesapeake city-VA, Hampton city-VA, Newport News city-VA, Norfolk city-VA, Poquoson city-VA, Portsmouth city-VA, Suffolk city- VA, Virginia Beach city-VA, Williamsburg city-VA. For more information about the definition of the Virginia Beach-Norfolk-Newport News MSA please check http://www.census.gov/population/estimates/metro-city/0312msa.txt Center for Housing Research, Virginia Tech 6
Virginia Beach Housing Needs Assessment and Market Analysis 2000-2020

                  Figure 2: Median Housing Prices and Median Family Incomes (MFI)

      $200,000

      $180,000

      $160,000

      $140,000

      $120,000                                                                                                  US
                                                                                                                VB MSA
      $100,000
                                                                                                                VB MSA MFI
       $80,000                                                                                                  US MFI

       $60,000

       $40,000

       $20,000

           $-
                      2000            2001             2002            2003             2004

    Source: National Association of Realtors and HUDUSER.ORG

Although the data on median sales prices presented in Figure 2 are not available for the
City of Virginia Beach, tax assessment data reflect similar if not even more rapid
increases in housing prices. The assessment data6 also provide greater detail about the
type of house. As shown in Figure 3, the average assessed values for single-family and
low-rise condominium units have increased sharply, particularly since 2000. Average
assessed values for townhouse units have increased less dramatically and are the most
affordable units in Virginia Beach.

6
 Assessment data are for all units, not just those sold in a given year. Assessments lag changes in sales
prices by a year or more.

Center for Housing Research, Virginia Tech                                                                  7
Virginia Beach Housing Needs Assessment and Market Analysis 2000-2020
Figure 3: Average Assessment by Housing Type
Single Family Townhouse Low Rise Condo
$250,000
$200,000
Assessment Value
$150,000
$100,000
$50,000
$0
1996 1997 1998 1999 2000 2001 2002 2003 2004 2005
Source: Virginia Beach Assessor's Office Report, 2004
The rapid increase in housing values since 2000 is quickly eliminating the supply of more
affordable housing in Virginia Beach. As shown in Figure 4, the supply of houses below
$125,000 has declined significantly, causing the range of values below the median
($154,000 in 2003—the most recent available data on the distribution of house values) to
cluster closer to the median than in 2000. Houses with values below $50,000 were
virtually non-existent by 2003 and the number of houses between $50,000 and $100,000
had declined dramatically. As a result of rapid price inflation and the higher prices of new
houses, the Virginia Beach housing supply only increased for houses with prices of
$150,000 and higher.
Center for Housing Research, Virginia Tech 8Virginia Beach Housing Needs Assessment and Market Analysis 2000-2020
Figure 4: Value of Owner-Occupied Units, 2000-2003
2000 2003 (estimate)
25000
20000
Number of Units
15000
10000
5000
0
Less than $10,000
$15,000 to $19,999
$25,000 to $29,999
$35,000 to $39,999
$50,000 to $59,999
$70,000 to $79,999
$90,000 to $99,999
$125,000 to $149,999
$175,000 to $199,999
$250,000 to $299,999
$400,000 to $499,999
$750,000 to $999,999
Source: Us Census 2000 and ACS 2003
Recent sales data covering 2003 and 2004 for Virginia Beach highlights the scarcity of
single-family houses with prices below $100,000 (see Figure 5). Townhouses were the
most affordable houses sold, with over 1,600 units sold between $50,000 and $100,000,
and with townhouse sales heavily clustered in the $50,000-$125,000 range.
Condominium sales were spread fairly evenly across the price range and were more
numerous than single-family houses priced below the $100,000 level.
Center for Housing Research, Virginia Tech 9Virginia Beach Housing Needs Assessment and Market Analysis 2000-2020
Figure 5: Housing Units Sold 2003-2004
Single Family Townhouse Condo Duplex
1800
1600
1400
Number of Units
1200
1000
800
600
400
200
0
10k- 75000- 125000- 175000- 250000-
49999 99999 149999 199999 299999
Source: Virginia Beach City Real Estate Assessment Database
Rental Housing
The cost of rental units has escalated along the lines of the owner units. In 2003, the
median gross rent in Virginia Beach was estimated at $804, an almost 10% increase from
2000. Renter occupied units as a percent of total occupied units declined to 30.8% in
2003 from 34.4% in 2000. The increase in median gross rent reflects an overall increase
in higher priced rental units (costing more than $900) and a decline in the number of
more affordable rental units (Figure 6). This clearly indicates a growing affordability
problem in the rental market throughout Virginia Beach.
Center for Housing Research, Virginia Tech 10Virginia Beach Housing Needs Assessment and Market Analysis 2000-2020
Figure 6: Gross Rent, 2000-2003
2000 2003 (estimate)
9000
8000
7000
Number of Units
6000
5000
4000
3000
2000
1000
0
$2,000 or more
Less than $100
$150 to $199
$250 to $299
$350 to $399
$450 to $499
$550 to $599
$650 to $699
$750 to $799
$900 to $999
$1,250 to $1,499
Source: US Census 2000 and ACS 2003
Figure 6 also shows that the majority of renter occupied housing units within the City fall
within the $600 to $899 range. Of all housing units, the largest portion (14%) fall within
the $800-899 range. Furthermore, housing units with rents below $450 only made up 6%
of the total renter occupied units compared to 18% of units in the MSA. When taking
into consideration rents by the number of bedrooms in a unit, the majority of one
bedroom units (61%) and two bedroom units (55%) fall within the $500-$749 range
(same pattern for the MSA). However, for units with three bedrooms or more, the
majority fell into the range of $750-$999 (42%).
First-time Homebuyers
First-time homebuyers are at greatest risk of being squeezed by higher prices since they
do not benefit from increased equity as a prior homeowner. We project about 19,000
first-time buyers between 2001-2010 with incomes below $50,000 (in year 2000 dollars)
and another 20,000 with incomes above this level. About 6,500 projected first-time
buyers have incomes below $30,000 (see Table 3) 7.
Homeownership rates increase with the age of the householder. A minority of young
people become homeowners in the early years of establishing independent households.
7
For detailed projections of first-time homebuyer demand in Virginia Beach and elsewhere in the MSA,
see “Homebuyer Market Analysis for the Virginia Beach Metropolitan Area,” prepared for Community
Housing Partners Corporation. Center for Housing Research, Virginia Tech, 2005 (forthcoming).
Center for Housing Research, Virginia Tech 11Virginia Beach Housing Needs Assessment and Market Analysis 2000-2020
Homeownership becomes progressively more popular and feasible as people mature, earn
more income, save money for a down payment, settle into a job and community, marry
and have children. As shown in Table 3 the largest demographic segments of first-time
homebuyers are among married-couple families with householders between the ages of
35 and 54 and with incomes above $40,000.
Table 3: First-time Homebuyers, Virginia Beach, 2001-2010
Income
$20,000- $30,000- $40,000- $50,000- $75,000-
$100,000
Total 2197 4359 5385 6950 10641 5547 4547
Married-couple 792 1741 3211 4683 8745 4371 3313
15 to 24 79 57 29 104 203 84 81
25 to 34 20 535 1085 1589 3688 1686 1055
35 to 44 379 989 1424 1912 2963 1911 1563
45 to 54 314 160 674 1077 1890 690 613
Other Family 1134 1307 1430 1472 1010 267 254
15 to 24 30 84 72 27 27 12 15
25 to 34 96 530 486 314 210 86 83
35 to 44 716 162 292 343 220 60 21
45 to 54 292 531 579 788 553 109 135
Non-family,
15-54 271 1311 744 796 886 909 981
Source: Center for Housing Research
Family householders without a spouse present (the “other family” category in Table 3)
are projected to account for 11,500 first-time buyers over the decade. Most of these
householders are single parents (including the formerly married) and the majority are 35
years and older. These households are probably the most vulnerable to not finding
affordable housing.
Non-family, first-time homebuyers are projected to be a slightly larger market than
single-parent families. Non-families include individuals living alone or with unrelated
housemates, including unmarried “DINKS”—couples with “dual incomes, no kids”. Non-
families have increased more rapidly over the past decades than families and have
recently entered the homeownership market in greater number.
Table 4 provides the maximum mortgage amount affordable to first-time homebuyers (if
no more than 30% of income goes to housing costs), assuming a thirty-year, fixed-rate
mortgage, property insurance at $40/month for houses under $150,000 and at $50/month
for houses above $150,000, mortgage insurance at $40/month, and a Virginia Beach tax
rate of $1.22/$100 assessed valuation. The maximum affordable mortgage for each
income category was estimated for the mid-point of the category ($15,000 was used for
the bottom category and $100,000 for the top category). Estimates are provided for
interest rates at 5.75% and at 7.00% in order to show the impact of increased interest
rates on affordability.
Center for Housing Research, Virginia Tech 12Virginia Beach Housing Needs Assessment and Market Analysis 2000-2020
Table 4: Housing Prices Affordable to First-time Homebuyers by Income, Virginia Beach
2000-2010
Income
$20,000- $30,000- $40,000- $50,000- $75,000-
Number of First-
$100,000
time buyers,
2001-2010 2,197 4,359 5,385 6,950 10,641 5,547 4,547
Interest Rate Affordable Price at Income Midpoint
@5.75% $42,325 $78,805 $115,286 $150,315 $195,920 $305,362 $350,967
@7.00% $37,813 $70,408 $103,003 $134,294 $175,046 $272,831 $313,568
Source: Center for Housing Research
Obviously the projected 2,200 first-time buyers with incomes below $20,0008 will have
an extremely difficult time finding affordable units and will likely have to look for
housing in the rental market or pay considerably more than 30% of their income to
purchase a house. Fewer than 100 single-family and townhouse units sold during 2003-04
had prices below $50,000.
First-time buyers with incomes between $20,000 and $30,000 can afford houses priced at
around $75,000 or less. There are nearly 4,400 projected first-time buyers in this income
category during the decade (about 440 buyers per year). Over the two-year period of
2003-04, about 1,300 single-family houses and townhouse units sold for $75,000 or less.
Although there were enough units to meet demand from first-time buyers in this income
category, the supply would be insufficient if demand also comes from first-time buyers
with higher incomes or from repeat buyers, which is very likely in a tight housing market.
Demand among first-time buyers increases significantly in the next two income ranges
($30,000 to $40,000 and $40,000 to $50,000). For the first of these income categories,
5,400 buyers would need houses priced below $115,000 (or $103,000 if interest rates
increase to 7%). This is an average of 540 per year, while there were 2,400 units sold
during 2003-04 with prices between $75,000 and $100,000. The affordable supply at this
price level and above becomes more abundant and could accommodate demand among
first-time buyers and from many repeat buyers.
Up to 2004, first-time buyers with incomes below $30,000 faced the most severe
affordability problems. However, if prices continue to escalate more rapidly than incomes
and if interest rates increase significantly, the income threshold for effective demand will
obviously increase. With prices increasing more rapidly than incomes, lower-income
home seekers face a dwindling supply of affordable units. They also face increased
competition from higher income households for those units. Even if recent increases in
8
Although the incomes shown in the table are in year 2000 dollars, incomes have only been increasing by
about 3% per year. Over three years, this would only increase the nominal price of affordable housing by
10%. For example, the maximum affordable price of $150,315 for a household with a $45,000 income
would only increase to $165,000 by 2003.
Center for Housing Research, Virginia Tech 13Virginia Beach Housing Needs Assessment and Market Analysis 2000-2020 housing prices are attenuated, competition for a limited supply of modest-priced houses is likely to increase as more of the affordable stock is occupied by households with higher incomes. Homebuyers with incomes below $30,000 (in year 2000 dollars) face serious shortages in the number of affordable units they can buy. Continued price increases will place buyers with incomes between $30,000 and $50,000 at greater risk of not finding affordable housing in Virginia Beach. Families with children are probably the most seriously endangered for several reasons. First, their space needs are less flexible. Second, their budgets are probably more constrained by other necessary expenditures, including childcare and educational expenses, and families cannot increase the proportion of income going to housing as readily as households without children. Third, they probably prefer single-family detached houses to townhouses and condominium units whenever possible. Home seekers priced out of ownership will turn to the rental market or move out of Virginia Beach to find affordable housing. As noted earlier, the rental market in Virginia Beach has a very low vacancy rate, despite a period when housing demand clearly shifted to ownership due to low interest rates. In addition, the number of units with gross rent below $750 declined sharply between 2000 and 2003 (the most recent data available). Center for Housing Research, Virginia Tech 14
Virginia Beach Housing Needs Assessment and Market Analysis 2000-2020

The Affordable Housing Gap in 2000

The following housing gap analysis estimates the surplus or deficit of housing units that
were affordable to certain household income groups, both for renter and owner-occupied
household as of 2000. This housing gap is calculated from special tabulations of the
2000 Census prepared for HUD for use in preparing Consolidated Plans. Three numbers
are used in calculating the affordable housing gap: 1) the number of households in the
income category, 2) the total number of housing units affordable to these households (at
30% of their income), and 3) the number of these affordable units that were occupied by
households with higher incomes.

The gap analysis shows that low-income renters face the most severe shortage of
affordable housing, which is not surprising. We estimate a gross deficit of nearly 8,500
affordable rental units for renters with incomes below 50% of the Area Median Family
Income (AMFI9) (approximately $25,000 in 2000). (See Table 5.) Consequently, low-
income renters were forced to spend large portions of their incomes (often in excess of
half) in order to obtain housing.

     T able 5: Affo rdab le R en tal H o u sin g G ap,        2000
                          T otal                              S urplus      O ccupied    G ross
                       R enters      T otal U nits            (D eficit)    >% A M F I   D eficit
Virginia Beach Housing Needs Assessment and Market Analysis 2000-2020
deficit (-5,770 units), and the relatively large surplus (+32,887) for the low-income owner
households into a deficit of 421 units.
Table 6: Affordable Owner-Occupied Housing Gap, 2000
Surplus Occupied Gross
Total Owners Total Units (Deficit) >%AMFI DeficitVirginia Beach Housing Needs Assessment and Market Analysis 2000-2020
Military Housing
Virginia Beach is the home to four main military installations: three Navy, NAB Little
Creek, NAS Oceana, FCTC Dam Neck and one Army, Ft. Story. Although some military
housing is offered to military personnel, the majority of military families find housing
through the open market. The naval installations have a combined total of 11,800
families (a family constitutes a military personnel with dependent) but only provide a
total of 1,816 military housing units (see Table 7). This leads to a deficit of 9,984
military housing units or units needed in the private market. Since families are allowed
to choose housing within a one hour commute of the base, a portion of the deficit may be
handled by military housing located outside of Virginia Beach. Ft. Story also
experiences similar deficits as the naval installations. There are 1,130 Army “permanent
party” stationed at Ft. Story but only 163 quarters10.
Table 7: Naval Base Housing Units and Families for Virginia Beach
Base Number of Number of surplus
Families Housing Units (deficit)
NAB Little Creek 5068 862 -4206
NAS Oceana 5100 935 -4165
FCTC Dam Neck 1632 19 -1613
Total 11800 1816 -9984
Source: John J. Morello, Director, Mid Atlantic Regional Family Housing
Currently, the Navy has a two year wait for military housing for Little Creek and Oceana
facilities totaling 571 families (see Table 8). Eighty two percent of those on the wait list
are enlisted personnel. Of those enlisted personnel on the wait list, fifty two percent are
waiting for three bedroom units.
Table 8: Wait List for Naval Housing, Virginia Beach
Enlisted Officer
Little Creek
2 bedroom 98 --
3 bedroom 105 42
4 bedroom 33 32
5 bedroom -- --
Oceana
2 bedroom -- --
3 bedroom 139 20
4 bedroom 77 10
5 bedroom 15 --
Source: John J. Morello, Director, Mid Atlantic Regional Family Housing
Military personnel who are seeking housing within the open market are limited by the
housing allowance that is provided to them based on their pay grade and the dependent
status (see Table 9). Those with dependents (spouse or children) have a slightly higher
housing allowance than those without dependents. For most pay grades the basic housing
allowance permits military personnel to compete for housing costing $900-$1,100 per
10
Source: Ann Heiss Schulte, Family Advocacy Program Manager
Center for Housing Research, Virginia Tech 17Virginia Beach Housing Needs Assessment and Market Analysis 2000-2020
month. Although this makes the middle of the rental market affordable to military
personnel, it increases competition for these units. Given the shortage of housing in the
City, the large military demand undoubtedly adds to the market pressures that have
compressed the bottom half of the rental supply toward the median and reduced the
supply of units affordable to low-income renters.
Table 9: Basic Housing Allowance (BAH) for Norfolk, Virginia
Beach, Portsmouth and Chesapeake
Allowance Range
Pay Grade Range With Dependents Without
Dependents
E1 - E4 $1,031 $874
E5 - E9 $1103 - $1397 $931 - $1159
W1 - W5 $1214 - $1522 $1004 - $1267
O1E - O3E $1266 - $1437 $1103 - $1213
O1 - O3 $1115 - $1332 $959 - $1173
O4+ $1564 - $1763 $1261 - $1361
Source: Department of Defense, Basic Allowance for Housing (BAH), 2005
Comparing these gross rents to the housing allowance given to military personnel, those
personnel within the higher pay grades should be able to easily afford renter housing
units within the City. However, lower ranked enlisted personnel may have difficulty
finding affordable renter housing. This is particular true when comparing enlisted
personnel with dependents and rents for units with three or more bedrooms (enlisted
personnel wanting three or more bedrooms is the largest group on the military housing
waiting list). Lower ranked personnel may either have to spend more than their
allowance on housing costs (using portions of the income) or look outside of the City for
housing.
Future Military Housing
As for now, there are no known increases or decreases in the military personnel within
the City. Furthermore, the Navy has no known facility projects scheduled within
Virginia Beach. However, Ft. Story has plans to build 200 new housing units on post in
2005.
While military housing is currently run through a military housing agency, both the Navy
and Army have plans to transition their housing stock to contracted housing. With the
transition to contracted housing, military personnel will still get their same housing
allowance but their rent will not automatically be taken out of their pay as under the
current system. They will have to actually write a check for their rent removing the
perception that rent is “free”. There is speculation that this may change the housing
preference of those individuals living in military housing and more military individuals
may move into the open market.
Center for Housing Research, Virginia Tech 18Virginia Beach Housing Needs Assessment and Market Analysis 2000-2020
Workforce Housing
The link between the workforce in the city and its housing needs is central because it is
the demographics and characteristics of the population that dominate the demand side of
the housing market and hence directly impacts the supply of housing in the City. Ideally,
the City needs to provide an equal number of housing units to the jobs it creates and to
ensure that these units be affordable to the household income level of the workers taking
these jobs. In an area such as Virginia Beach that is surrounded by other urban centers
within commuting distance, the workforce housing market should be examined from a
regional perspective rather than a local one. However, for the purposes of this study, we
try to establish only if the City is achieving a comfortable level of balance between the
type of jobs available and the stock of affordable housing available to service the
workers.
Between 1990 and 2000, the number of wage and salary jobs in Virginia Beach
(excluding non-civilian military employment) increased by 53,300 jobs (see Table 10).
Given the average number of workers per household in Virginia Beach, 53,300 jobs
equates to housing demand for 37,450 units. However, the supply of housing units only
increased (net) by 15,240 units, leaving a deficit. For every 1.42 jobs created in the city,
a household was created and needed a housing unit. Considering this ratio, and
comparing the increase of jobs during this time period and the number of housing units
actually produced, we can conclude that between 1990 and 2000, Virginia Beach
produced 22,000 fewer units than demand associated with job creation. With jobs and
housing units out of balance, Virginia Beach workers were living elsewhere while
commuting to their jobs. Along with scarcity of housing, the dislocation between the job
and residence place can also be attributed to personal or family preference or the
availability of better and more housing choices nearby within a commuting distance.
Table 10: Jobs-Housing Balance in Virginia Beach
1990-2000 2000-2002
Increase in jobs 53,281 5,885
Households @ 1.42 jobs/household 37,448 4,144
Increase in housing units 15,240 4,175
Housing Surplus (deficit) -22,208 31
Source: Center for Housing Research
Between 2000 and 2002, housing production was sufficient to keep up with job growth
but inadequate to offset the earlier deficit. Even if gross housing production keeps up
with workforce-related housing demand, the houses produced are usually at the high-end
of the housing market, whereas the jobs being created typically have incomes that require
much less expensive housing. For example, according to the Virginia Employment
Commission (VEC) the top employers in 2004 in Virginia Beach are:
1. City of Virginia Beach Schools
2. City of Virginia Beach
3. U.S. Department of Defense
4. Sentara Bayside Hospital
Center for Housing Research, Virginia Tech 19Virginia Beach Housing Needs Assessment and Market Analysis 2000-2020
5. Little Creek Navy Exchange
6. Farm Fresh
7. Wal-Mart
8. Lillian Vernon Fulfillment
9. Americaid Community Care
10. Stihl
Most of the jobs generated by the employment base in Virginia Beach require less
expensive housing than new construction can produce. As seen in Table 11, of the top
twenty occupations between 2001 and 2003 in the Virginia Beach MSA, only one had
average earnings above $50,000 (a bench mark chosen by the research team based on the
latest housing prices and the incomes needed to afford them). The top five earn less than
$22,000 per year. As a result, much of the workforce in the Virginia Beach job market,
whether in terms of existing or newly created jobs, faces housing affordability challenges
especially in the homeownership market.
Table 11: Top 20 Occupations, 2001-2003 (for the whole MSA)
Occupation Title 2001 2003 Change Average
1.Retail Salespersons 24350 25,570 5% $20,320
2.Office Clerks, General 15500 19,070 23% $21,570
3.Cashiers 18320 18,990 4% $15,100
4.Combined Food Preparation and Serving
W orkers, Including Fast Food 12370 15,330 24% $14,610
5.Laborers and Freight, Stock, and Material
Movers, Hand 10500 11,850 13% $20,670
6.Registered Nurses 9120 10,410 14% $47,460
7.Bookkeeping, Accounting, and Auditing Clerks 8300 8,380 1% $26,390
8.Elementary School Teachers, Except Special
Education 7520 7,930 5% $44,350
9.Supervisors/Managers of Office and
Administrative Support W orkers 7440 7,620 2% $39,890
10.Nursing Aides, Orderlies, and Attendants 6590 7,460 13% $18,390
11.Receptionists and Information Clerks 6100 6,740 10% $18,500
12.Maids and Housekeeping Cleaners 5540 6,450 16% $15,930
13.Sales Representatives, Wholesale and
Manufacturing 5900 6,320 7% $50,560
14.Maintenance and Repair W orkers, General 6250 6,320 1% $27,330
15.Teacher Assistants 5610 5,970 6% $16,860
16.Truck Drivers, Heavy and Tractor-Trailer 4850 5,800 20% $29,440
17.First-Line Supervisors/Managers of Food
Preparation and Serving W orkers 4850 5,520 14% $24,750
18.Telemarketers 2510 5,240 109% $19,600
19.Carpenters 4830 5,200 8% $30,620
20.Secondary School Teachers, Except Special
and Vocational Education 3960 4,830 22% $47,560
*Bold for jobs paying more than 50k/year
Source: Virginia Employment Commission 2004
Center for Housing Research, Virginia Tech 20Virginia Beach Housing Needs Assessment and Market Analysis 2000-2020 Table 12 shows the top twenty growing occupations throughout the metro area during the same period with only three of them earning more than $50,000. As a result, the majority of the workforce in the Virginia Beach job market, whether in terms of existing or growing jobs, faces housing affordability challenges especially in the homeownership market. These challenges continue to exist and apparently grow with fewer affordable units produced in 2003-04 and increasing real estate assessments and vacancy rates. Table 12: Top 20 Growing Occupations, 2001-2003 (for the whole MSA) Occupation Title 2001 2003 Change Average 1.Meat, Poultry, and Fish Cutters and Trimmers 530 2,230 321% $15,930 2.Photographic Process W orkers 40 130 225% $22,110 3.Extruding, Forming, Pressing, and Compacting Machine Setters, Operators, and Tenders 110 350 218% $27,540 4.First-Line Supervisors/Managers of Correctional Officers 120 370 208% $42,450 5.Radio Mechanics 110 310 182% $37,860 6.Real Estate Brokers 80 190 138% $104,240 7.Personal Financial Advisors 200 470 135% $61,950 8.Fitness Trainers and Aerobics Instructors 450 1,050 133% $30,140 9.Paving, Surfacing, and Tamping Equipment Operators 160 360 125% $26,790 10.Locksmiths and Safe Repairers 60 130 117% $28,200 11.Coin, Vending, and Amusement Machine Services and Repairers 70 150 114% $28,330 12.Security and Fire Alarm Systems Installers 80 170 113% $29,580 13.Helpers-Pipelayers, Plumbers, Pipe fitters, and Steamfitters 590 1,250 112% $26,660 14.Ushers, Lobby Attendants, and Ticket Takers 600 1,260 110% $14,010 15.Telemarketers 2510 5,240 109% $19,600 16.Training and Development Specialists 980 1,990 103% $46,520 17.Lawyers 1340 2,570 92% $138,440 18.Cooks, Short Order 610 1,110 82% $15,470 19.W eighers, Measurers, Checkers, and Samplers, Recordkeeping 200 360 80% $24,410 20.Real Estate Sales Agents 1340 2,410 80% $39,990 *Bold for jobs paying more than 50k/year Source: Virginia Employment Commission 2004 Housing Affordable to Low and Modest Income Workers is Hard to Find Housing affordability for the workforce reflects wage levels, household characteristics and housing prices or rents. To examine housing affordability for people with low-wage Center for Housing Research, Virginia Tech 21
Virginia Beach Housing Needs Assessment and Market Analysis 2000-2020
to modest-wage jobs, we estimated the number of units affordable for people in seven
occupations representing a mixture of growing metro jobs and critical city jobs.
- Cashiers
- Retail/Sales
- Office Clerks
- Elementary Teacher
- Firefighter & Police
- Registered Nurse
- Lawyers
For each of these occupations, we have created an individual table to summarizing
housing affordability for each of these occupations in the rental and ownership market
including two main scenarios of income profiles (individual wage and Median HHI/W –
see description below).
The following provides a description for the terms and methodology used in these tables:
Individual wage (either the published MSA average or the City entry level wage)
The median household income per wage (Median HHI/W) indicating the median
household income for the households with at least one member of the household
working in this occupation. This is calculated using the 2000 US Census micro
data set to estimate the ratio between households with a single earner in this
occupation (found to be an average of 10 percent across the board), and the total
household income with at least one person working in this occupation. For each
income level, the affordable maximum price (max. price) is calculated as well as
the affordable maximum gross rent (max. rent).
We checked the total number of single family (SF) units sold in 2003/2004 (based
on the latest update of the assessor’s office database that was available to the
study team) as well as the total townhouses sold in the same period using the
latest sales data in the city assessor’s database. These represent the total number
of units these occupations can afford and are actually offered for sale. However,
these units are also in the competitive market with higher income levels, so the
number of units are most likely an overstatement especially considering low
vacancy rates..
For the rental market, we checked the number of units listed on the City’s Real
Estate Information Network (REIN) data base to find out the total number of units
actually available for rent within the affordable rent range for each occupation.
The numbers of workers in the various occupations are based on metro level data
provided by the VEC. Data were not available at the city level.
Cashiers
Cashiers account for about 18,990 workers on the metro level earning an average
individual salary of $15,100. On the city level, less than 10 percent of households with
persons in this occupational category had only one income. The majority of these
Center for Housing Research, Virginia Tech 22Virginia Beach Housing Needs Assessment and Market Analysis 2000-2020
households had a 2.53 ratio of HHI/W (that is about 90 percent of the households with a
person in this occupation had an income 2.53 times his/her individual wage). Table 13
shows what households in this occupation can afford along with the number of affordable
units for sale or rent. For a cashier without additional income, there were only 58
affordable units sold during 2003-04 and there were no affordable rental units available.
Obviously, cashiers are in need of affordable housing due to their limited income and
compete among themselves and with those in better paying occupations for a limited
number of affordable units.
Table 13: Affordable Housing for Cashiers
Individual wage Median HHI/W
Income $ 15,100 $ 38,188
Home Ownership
Max. price $40,285 $111,273
SF units sold 2003/04 26 913
Townhouse units sold 2003/04 32 461
Rental
Max. rent $ 378 $ 955
Available for rent on 02/16/2005
(REIN Database) 0 198
Source: Center for Housing Research
Retail Sales
Retail sales jobs account for the largest number of workers on the metro level with about
25,570 workers earning an average individual salary of $20,320. On the city level, less
than 10 percent of households with persons in this occupational category had only one
income. The majority of these households had a 2.2 ratio of HHI/W (that is about 90
percent of the households with a person in this occupation had an income 2.2 times
his/her individual wage). Table 14 shows what households in this occupation can afford
along with the number of affordable units for sale or rent. Although the individual
income in this group faces a shortage of affordable housing throughout the City, that
most households have additional sources of income makes it a little easier, although still
tight, in terms of how much they can afford.
Center for Housing Research, Virginia Tech 23Virginia Beach Housing Needs Assessment and Market Analysis 2000-2020
Table 14: Affordable Housing for Retail Sales
Individual wage Median HHI/W
Income $ 20,320 $ 44,704
Home Ownership
Max. price $58,897 $143,989
SF units sold 2003/04 104 2,844
Townhouse units sold 2003/04 606 2,319
Rental
Max. rent $ 508 $ 1,118
Available for rent on 02/16/2005
(REIN Database) 4 303
Source: Center for Housing Research
Office Clerks
Office Clerks account for about 8,380 workers at the metro level earning an average
individual salary of $26,390. On the city level, about 13 percent of households with
persons in this occupational category had only one income. The majority of these
households had a 2.45 ratio of HHI/W (that is about 86 percent of the households with a
person in this occupation had an income 2.45 times his/her individual wage). Table 15
shows what households in this occupation can afford along with the number of affordable
units for sale or rent. Almost similar to the previous categories, this group largely faces a
very tight affordable housing market in the City if they depend on a single earner, and a
little easier condition around the median.
Table 15: Affordable Housing for Office Clerks
Individual wage Median HHI/W
Income $ 26,390 $ 64,756
Home Ownership
Max. price $80,545 $219,139
SF units sold 2003/04 395 4,932
Townhouse units sold 2003/04 1,669 2,456
Rental
Max. rent $ 660 $ 1,619
Available for rent on 02/16/2005
(REIN Database) 136 654
Source: Center for Housing Research
Center for Housing Research, Virginia Tech 24Virginia Beach Housing Needs Assessment and Market Analysis 2000-2020
Teachers
Teachers are a critical part of any community and on the MSA level account for about
7,930 workers earning an average individual salary of $44,350 (however, for this exercise
we selected the entry level salary of $34,227 to reflect the status of the newly hired
teachers in the city). On the city level, about 10 percent of households with persons in
this occupational category had only one income. The majority of these households had a
2.06 ratio of HHI/W (that is about 90 percent of the households with a person in this
occupation had an income 2.06 times his/her individual wage). Table 16 shows what
households in this occupation can afford along with the number of affordable units for
sale or rent. Particularly with married teachers, the median household income allows for
relatively decent housing market opportunities. However, the available and affordable
units are also in the competitive market for higher income households who can out bid
this group.
Table 16: Affordable Housing for Teachers
Individual wage Median HHI/W
Income $ 34,227 $ 70,508
Home Ownership
Max. price $102,354 $226,828
SF units sold 2003/04 395 6,208
Townhouse units sold 2003/04 1,669 2,456
Rental
Max. rent $ 856 $ 1,763
Available for rent on 02/16/2005
(REIN Database) 122 581
Source: Center for Housing Research
Registered Nurses
Registered Nurses on the MSA level account for about 10,410 workers earning an
average individual salary of $47,460 (however, for this exercise we selected the entry
level salary of $34,858 to reflect the status of the newly hired nurses in the city). On the
city level, about 8.4 percent of households with persons in this occupational category had
only one income. The majority of these households had a 1.87 ratio of HHI/W (that is
about 91 percent of the households with a person in this occupation had an income 1.87
times his/her individual wage). Table 17 shows what households in this occupation can
afford along with the number of affordable units for sale or rent. Although nurses have a
slightly higher individual income than teachers, their housing options are more limited
based on household income.
Center for Housing Research, Virginia Tech 25Virginia Beach Housing Needs Assessment and Market Analysis 2000-2020
Table 17: Affordable Housing for Registered Nurses
Individual wage Median HHI/W
Income $ 34,858 $ 65,184
Home Ownership
Max. price $110,734 $218,858
SF units sold 2003/04 1,308 6,208
Townhouse units sold 2003/04 2,130 2,456
Rental
Max. rent $ 871 $ 1,630
Available for rent on 02/16/2005
(REIN Database) 123 547
Source: Center for Housing Research
Firefighters and Police Officers
Firefighters and police officers are another critical asset of any community. For this
exercise we selected the entry level salary of $36,622 to reflect the status of the newly
hired officers in the city). On the city level, about 17 percent of households with persons
in this occupational category had only one income. The remaining 93 percent had a 1.81
ratio of HHI/W (which is relatively low but consistent with the single earner ratio of 17
percent). Table 18 shows what households in this occupation can afford along with the
number of affordable units for sale or rent. Even with relatively higher entry level wages,
the demographics of these households makes it challenging for them to compete in a
housing market with already few units available for sale or rent affordable to their income
level.
Table 18: Affordable Housing for Fire Fighters & Police
Officers
Individual wage Median HHI/W
Income $ 36,622 $ 66,143
Home Ownership
Max. price $117,021 $229,707
SF units sold 2003/04 1,308 6,208
Townhouse units sold 2003/04 2,130 2,456
Rental
Max. rent $ 916 $ 1,654
Available for rent on 02/16/2005
(REIN Database) 163 556
Source: Center for Housing Research
Center for Housing Research, Virginia Tech 26Virginia Beach Housing Needs Assessment and Market Analysis 2000-2020
Lawyers
Lawyers as an occupational category were included to reflect a higher income
occupation. The average individual salary of lawyers on the MSA level was $138,440.
On the city level, about 22.2 percent of households with persons in this occupational
category had only one income. The remaining had a 1.32 ratio of HHI/W (which is not
surprising considering the high average individual salary). Table 19 shows what
households in this occupation can afford along with the number of affordable units for
sale or rent. Obviously this group has little to worry about when it comes to affordable
housing in terms of absolute numbers of units needed or actual available numbers offered
for sale or rent.
Table 19: Affordable Housing for Lawyers
Individual wage Median HHI/W
Income $ 138,440 $ 182,741
Home Ownership
Max. price $480,026 $637,959
SF units sold 2003/04 8,374 8,374
Townhouse units sold 2003/04 2,478 2,478
Rental
Max. rent $ 3,461 $ 4,569
Available for rent on 02/16/2005
(REIN Database) 671 671
Source: Center for Housing Research
Anyone reliant on employment as a cashier (or similar jobs averaging $15,000 per year)
or in retail sales (averaging $20,000 per year) would have an extremely hard time finding
affordable housing in Virginia Beach, even though these are among fastest growing
positions in the region. Office clerks (averaging $26,400 per year) have greater
opportunities to find an affordable townhouse or apartment, but have few opportunities to
buy a single-family house. Entry level teachers, public safety officers, and registered
nurses could also find affordable townhouses and apartments, but would struggle to find
an affordable single-family house. With the City’s extremely low vacancy rates, only a
few affordable housing units would be on the market at any given time.
Two Jobs Often Necessary to Afford Housing in Virginia Beach
Total purchasing power (and thus affordability) depends on total household income rather
than an individual’s income from a particular job. Only 10% of households with low to
modest wage jobs rely exclusively on the income from that one job. Some households,
Center for Housing Research, Virginia Tech 27You can also read