Bridal Veil Mountain Resort Ltd - All-Season Market Assessment
←
→
Page content transcription
If your browser does not render page correctly, please read the page content below
Bridal Veil Mountain Resort Ltd.
    All-Season Market Assessment

Prepared by:                               Prepared for:
RRC Associates          Bridal Veil Mountain Resort Ltd.
Boulder, CO                              Chilliwack, BC
www.rrcassociates.com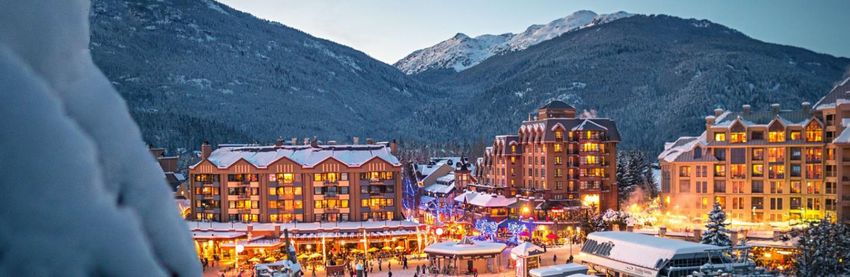
BVMR – All-Season Market Assessment                                                                                   June 2021

Table of Contents
Territorial Acknowledgement ........................................................................................... 2
Introduction ..................................................................................................................... 2
Executive Summary ........................................................................................................ 4
Trends in Mountain Resort Destinations ......................................................................... 7
Skiing/Snowboarding Participation Rates...................................................................... 25
Trends in Tourism and Outdoor Recreation .................................................................. 28
Local Demographics...................................................................................................... 59
British Columbia Tourism .............................................................................................. 64
Tourism Chilliwack Strategic Plan 2022 – 2027 ............................................................ 76
Competitive Analysis ..................................................................................................... 81
Opportunities for Bridal Veil Mountain Resort ............................................................... 86
Conclusion .................................................................................................................... 89
About RRC Associates .................................................................................................. 90

                                                                                                                              1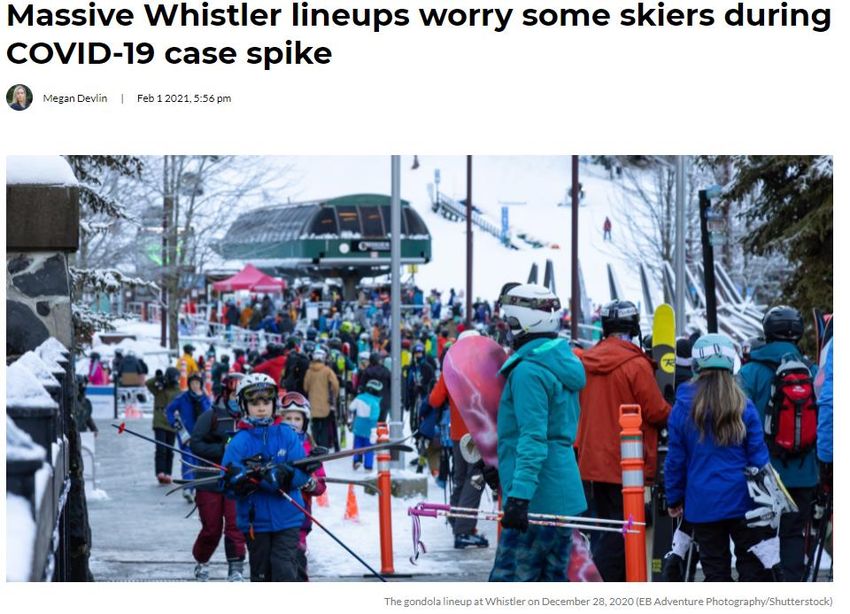
BVMR – All-Season Market Assessment                                                June 2021

Territorial Acknowledgement

RRC Associates acknowledges that the proposed Bridal Veil Mountain Resort project is
        located in S’ólh Téméxw, the traditional and unceded lands of the
                       Stó:lō people since time immemorial.

Introduction
This report summarizes research conducted by RRC Associates, a market research and
consulting firm that works extensively in the North American ski industry, with
assistance from Brent Harley and Associates Inc. (BHA), on behalf of Bridal Veil
Mountain Resort Ltd (BVMR).

BVMR, located in S’ólh Téméxw near Chilliwack, BC, would be an all-season
destination mountain resort focused on downhill skiing and snowboarding in the winter
and a wide variety of activities in the summer, likely including sightseeing, downhill and
cross-country mountain biking, hiking, zip lines and challenge course, bird watching,
star gazing, and other activities. The base area of the resort will have lodging and other
services for visitors. The resort is also anticipated to include a small alpine village on a
ridgetop bench.

RRC Associates understands that Bridal Veil Mountain Resort Ltd., the proponent of
Bridal Veil Mountain Resort, has enshrined a series of core principles to guide their
planning efforts on the proposed project. These include:
   •   Meaningful engagement, joint management, and equity ownership with the
       participating Stó:lō Communities.
   •   Develop the BVMR Project to the highest environmental and sustainability
       standards, applying Stó:lō cultural, traditional, and land stewardship principles.
   •   Build mutually respectful relationships and complete extensive Stó:lō consultation
       and engagement.

RRC Associates stresses that this Market Assessment Report does not and could not
account for the benefits and influence of meaningful Stó:lō participation and joint equity
partnership in the final, approved concept for the Bridal Veil Mountain Resort project. If
the project is given the opportunity to proceed, the Market Assessment Report will be
updated with meaningful Stó:lō participation and joint equity ownership in the ongoing
process of jointly developing the final, approved concept for Bridal Veil Mountain Resort.

                                                                                         2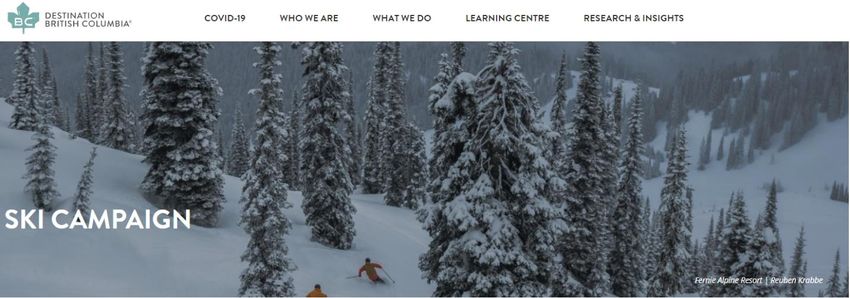
BVMR – All-Season Market Assessment June 2021
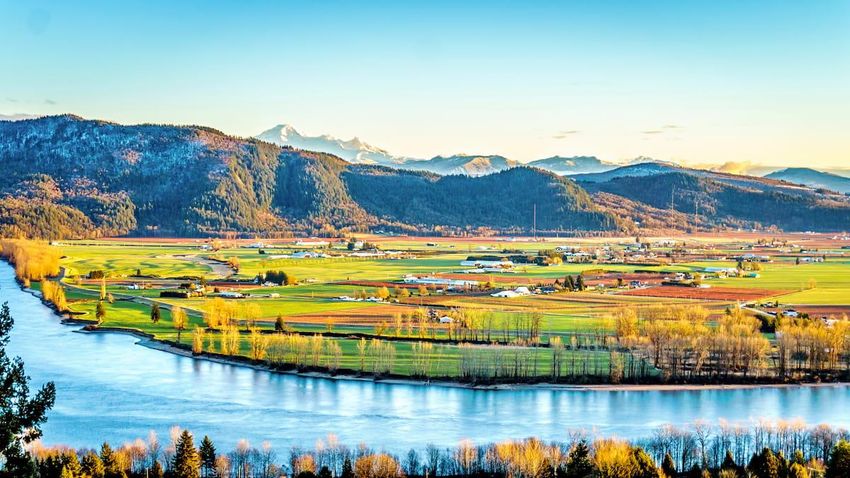
This market assessment presents visitor trends, local and regional market demographic
profiles, and a broad analysis of existing regional amenities, market trends, and
attractions in the greater Fraser Valley area. This report is intended to serve as a
framework for discussions to assist BVMR in making strategic decisions around the
opportunities for future planning and development scenarios. Results can be used to
inform what types of competition, market opportunities, and gaps exist in the British
Columbia ski and summer resort industry.
Research and findings rely on a combination of professional experience and secondary
research. Secondary research sources include reports and data gathered by The
Outdoor Foundation, Visit BC, Canadian Ski Council, Tourism Chilliwack, Statistics
Canada, the U.S. National Ski Areas Association, RRC in-house data, and other
sources.
3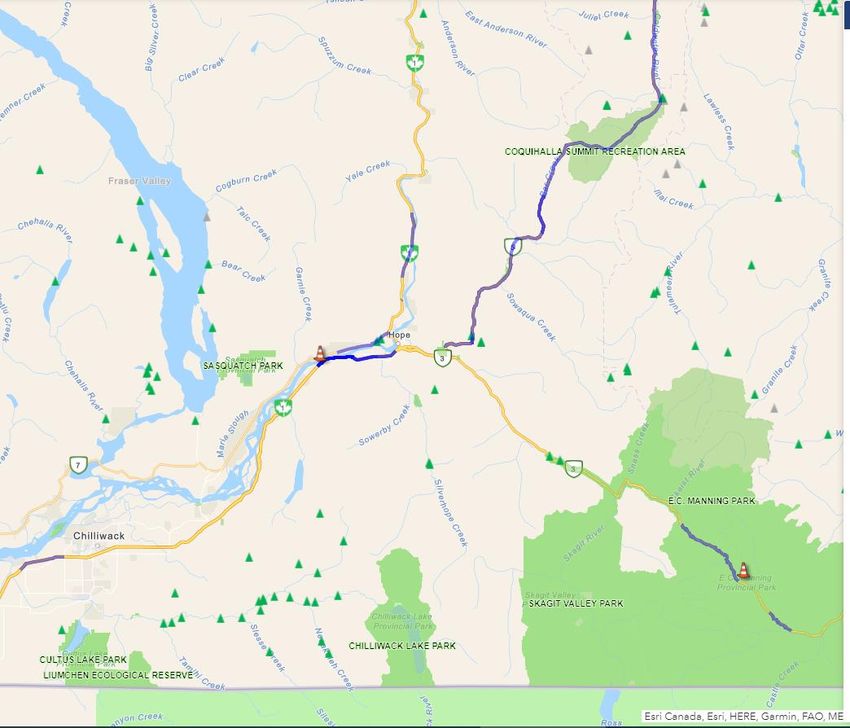
BVMR – All-Season Market Assessment                                             June 2021

Executive Summary
This section provides overall highlights from the Market Assessment Report for BVMR.
Please see the main body of the report for more detail on these and other topics.

   •   Trends in the North American Ski Resort Industry. Participation in downhill skiing
       and snowboarding, as measured by both the number of individual participants
       and the number of skier visits, shows a general flattening of the ski industry in
       both Canada and the U.S. The number of skiers/snowboarders in Canada is
       generally about 2 to 2.5 million, while in the U.S. the number of participants is
       about 9.5 to 10 million annually. The lack of growth in the skiing/snowboarding
       population certainly presents challenges for a new mountain resort like BVMR,
       though regional population growth is anticipated to increase the number of skiers
       and snowboarders in the local FVRD market (see below). Additionally, the resort
       is likely to provide an alternative to other ski mountains and evolve a strong
       competitive position within the BC and North American ski market. At buildout,
       the resort is anticipated to host approximately 630,000 winter skier visits.

   •   Summer Tourism. BVMR would be built with summer activities and operations in
       mind from the start, allowing summer activities to be optimized for guest
       experiences, rather than as an afterthought as is the case at many ski resorts
       (which were built with skiing in mind first, and then summer activities were added
       later). The opportunity for summer customers is quite high, especially coming out
       of the COVID-19 pandemic when interest in outdoor recreation is at an all-time
       high. It is anticipated that the demand for summer activities (downhill and cross-
       country mountain biking, zip lines, challenge courses, mountain coasters, disc
       golf, sightseeing, hiking, bird watching, star gazing, and a variety of other
       activities), weddings, group business, meetings, family reunions, and other
       mountain recreation will be high at BVMR. Summer tourism in BC is already
       growing strongly, and BVMR would be well-positioned to leverage its location
       and access to draw in a high volume of summer business.

   •   Fraser Valley Population Growth. BVMR is well-positioned to take advantage of
       the growing population of the Fraser Valley Regional District (FVRD). BC Stats
       offers insights into the changes in the FVRD and across the Vancouver Metro. As
       of 2020, the population of the FVRD was 334,664, up from 282,590 in 2010, an
       increase of 18.4%. Metro Vancouver, which has grown at nearly the same rate
       as the FVRD, is home to over 2.5 million residents. The FVRD is expected to see
       a more dramatic increase by 2030 and 2040. Population for the District is
       expected to increase to 376,670 in 2030 (up 12.6% from 2020). Further,
       continued growth is expected by 2040 with an estimated population of 417,143
       (up 10.7% from 2030).

                                                                                     4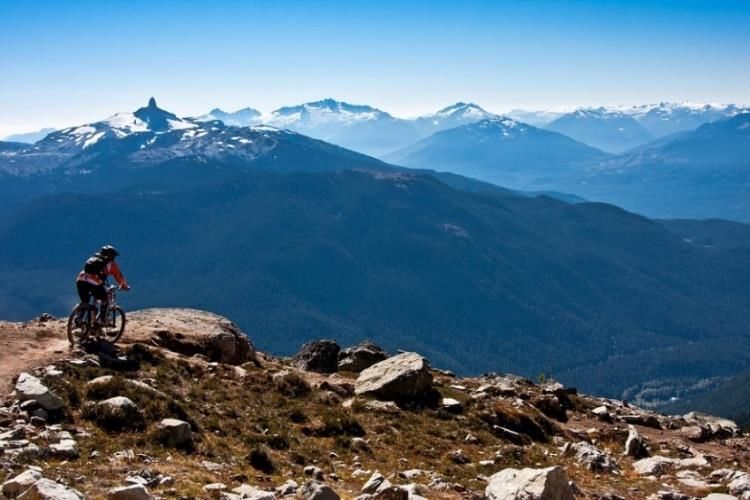
BVMR – All-Season Market Assessment                                                June 2021

   •   Skier Participation Rates. Over the 2014-2020 period, BC residents generated an
       annual average of 0.622 skier days per capita in Canada. Over the same period,
       residents in the Mainland / Southwest Development Region took an annual
       average of 1.94 million skier days, or 0.643 skier days per capita, similar to the
       overall BC average. Looking elsewhere in BC, the Thompson/ Okanagan area,
       with multiple quality destination ski areas, exhibits 75% higher skier visits per
       capita (1.123 visits/capita) than the Mainland/Southwest (0.643 ski days / capita).
       Conversely, Vancouver Island/Coast, with more limited nearby skiing options,
       has significantly lower resident ski activity (0.374 visits / capita, or 42% less than
       the Mainland/Southwest). These variances suggest that the availability and
       quality of proximate skiing options can have a substantial influence on resident
       skiing behavior. Such variances are widely seen in other resident ski markets in
       North America.

   •   Traffic Patterns near BVMR. An analysis of traffic counts on the Trans-Canada
       Highway near BVMR show strong and growing number of vehicles traveling past.
       At both traffic counters analyzed for this study, there is substantial net eastbound
       flow on Thursdays, Fridays, and Saturdays (particularly in May – August), and
       substantial net westbound flow on Sundays and Mondays. These patterns are
       strongly indicative of outbound weekend trips from the Lower Mainland area to
       points east. The patterns indicate the presence of a large flow of leisure travelers
       passing right by BVMR, particularly in summer and on weekends. Weekend
       tourism traffic flows are also present but more muted in the winter months than
       the summer months (with the exception of Family Day, Good Friday and
       Christmas holidays) – an indication that Route 1 may be relatively less developed
       as a winter tourist travel corridor.

   •   Local Lodging Statistics. Looking at lodging statistics shows that room revenues
       subject to MRDT more than doubled from 2012 to 2019 (+115%), before taking a
       sharp downturn as a result of the Covid-19 pandemic. Room revenues are
       highest in the summer months and lowest in the winter months, consistent with
       occupancy and ADR patterns. All months have exhibited significant growth in
       room revenues. The strong gains, along with the summer peaking, suggest that
       the region is gaining increasing strength as an overnight leisure travel
       destination. As a new tourism offering in the region, BVMR would thus likely be
       building upon an established and growing local tourism sector.

   •   Competition. British Columbia is home to 10 mountain ranges and boasts 13
       major mountain resorts, many of which have global brand recognition and have
       been recognized with industry awards and honors. These major mountain
       resorts, much like the vision for BVMR, offer all-season outdoor recreational

                                                                                         5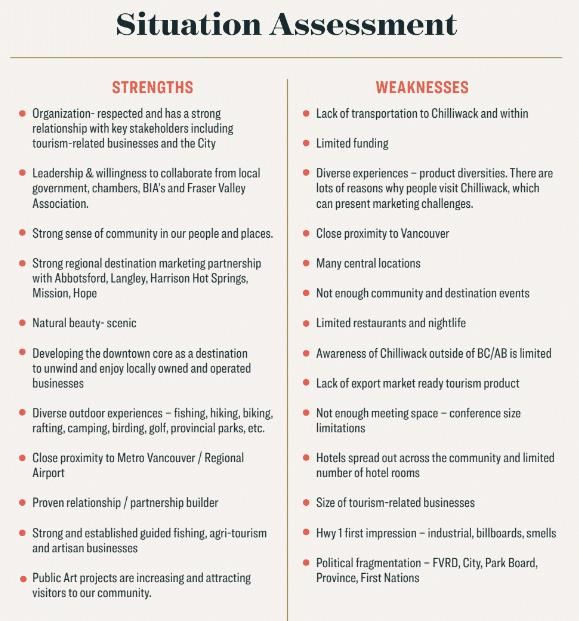
BVMR – All-Season Market Assessment                                              June 2021

       opportunities, supported by an array of facilities, amenities, and tourism
       infrastructure catering to local, regional and destination visitors alike. To be
       successful, BVMR will have to find its niche within this competitive landscape,
       particularly against the regional south coast BC ski areas. As envisioned, BVMR
       has unique propositions and competitive advantages that would distinguish it
       from the regional group of ski resorts.

   •   Opportunities. Given a variety of factors, including population growth, high
       interest in outdoor activities in both winter and summer, growing tourism levels in
       BC, and other trends, it appears that BVMR has many opportunities to succeed
       as a year-round mountain resort. Some competitive pressures exist and will
       potentially present challenges to BVMR, but the market potential of both local
       population and regional/destination visitors for BVMR remains high.

                                                                                      6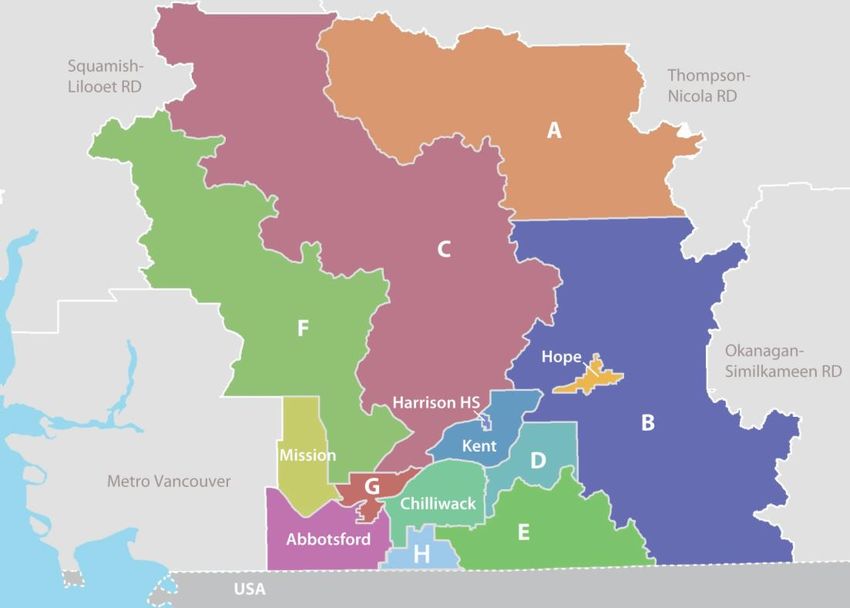
BVMR – All-Season Market Assessment                                             June 2021

Trends in Mountain Resort Destinations
Mountain resort destinations have changed considerably during the past 20 years due
to shifting demographics, changes in resort ownership, and the rise of new expectations
in the marketplace. Winter continues to be the primary season for most mountain
resorts; however, summer has become much more important for attracting guests and
generating revenue. Additionally, the resort landscape in the U.S. and Canada has
shifted, with ongoing resort consolidation, partnerships forming across the industry, and
new competitive challenges rising for many destinations.

A review of industry trends and data is a necessary first step in identifying BVMR’s
market feasibility. The following section outlines data from the Canadian Ski Council,
U.S. National Ski Areas Association, and Outdoor Foundation. The analysis uses
insights from these industry resources to establish a long-term view of the North
American mountain resort industry.

                                                                                     7
BVMR – All-Season Market Assessment                                                June 2021

Canadian Ski Industry Trends
RRC Associates (RRC) has assisted the Canadian Ski Council (CSC) in collecting data
about skiers and snowboarders throughout the country for years. RRC has maintained
various databases used by the CSC to track the Canadian ski industry over time. Over
the past 24 winters, total skier visits in Canada (not including Nordic or Heli visits) have
fluctuated from a low of 15.5 million in 1997/98 to highs of 20.3 million in both 2007/08
and 2018/19. However, little directional variation has occurred over time. The results
suggest that resorts are competing for largely the same participants with long-term
growth relatively stagnant.

                                   Figure 1: Canadian Skier Visits

Source: Canadian Ski Council, RRC Associates

The 2019/20 ski season was greatly impacted by COVID-19 on a global scale. The
Canadian ski industry was on pace to have a very strong season once again in 2019/20
prior to the pandemic forcing the premature shutdown of ski areas across the country.
Canadian snowsports visits had been trending up year-over-year since 2016/17 and hit
a 20-year high of 20.3 million in 2018/19. In the abruptly shortened 2019/20 season,
visits dropped to 17.1 million. Data for the 2020/21 season is not currently available.
While anecdotal reports indicate variability, projections for the 2020/21 season are not
yet available at time of publication of this report.

                                                                                         8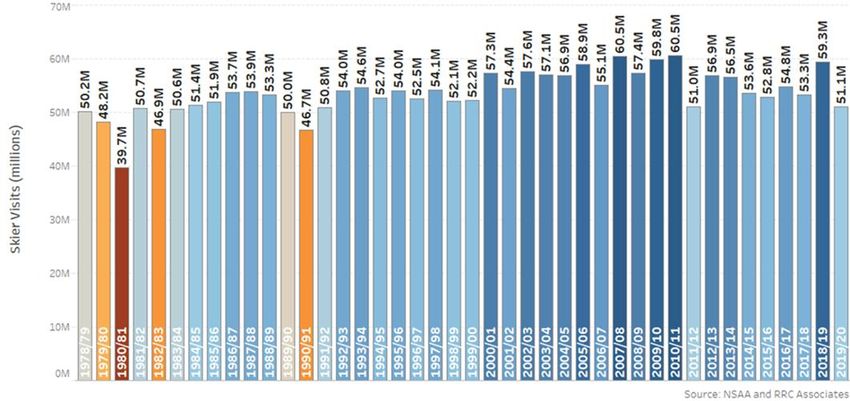
BVMR – All-Season Market Assessment                                            June 2021

   Canadian skier visits were trending up in the seasons prior to the COVID-19 pandemic
   but remained within the historic range of ~17-20 million visits. Post-COVID visits
   numbers will help indicate whether such growth trends are part of longer-lasting industry
   movement or just due to natural variation and/or weather conditions. Monitoring whether
   the positive trend in skier visit growth continues is important in moving back to normal
   once COVID-19 subsides.

                 Figure 2: Skier/Snowboarder Canadian Visitation by Province

Source: Canadian Ski Council, RRC Associates

   Despite decades of relative stability at a national level, skier visit numbers show much
   more variation when analyzed at the regional scale. Quebec led visitation in the 2019/20
   season with approximately 6 million visits. British Columbia and the Yukon (combined)
   go back and forth with Quebec for the top spot. Last season, BC recorded 5.4 million
   visits, down significantly from 2018/19’s high in the 6.5+ million range. COVID-19’s
   impact on border crossings likely caused much of that decline; similar results were
   observed in Ontario.

                                                                                        9
BVMR – All-Season Market Assessment June 2021
Figure 3: Canadian Skier Visits Market Share by Province
Source: Canadian Ski Council, RRC Associates
The importance of the BC market to the overall Canadian ski industry cannot be
overstated. British Columbia’s share of total Canadian skier visits has hovered between
~30 to 35% (minus outliers) since 2010. Together, Québec and BC account for two-
thirds of all skier visits in Canada. When either province has a seasonal decline, the
impacts are felt on a larger scale.
10BVMR – All-Season Market Assessment June 2021
Figure 4: Percent of Visits from the U.S. and Other International
Source: Canadian Ski Council, RRC Associates
U.S. and offshore visitation account for a share of the Canadian ski industry. Until
2017/18, offshore visitation (between 7-8%) exceeded the U.S. share (3-4.5%).
However, U.S. visitation overtook offshore in 2018/19, accounting for 7.6% of Canadian
visitation with offshore at 5-6%. Multi-season mountain passes are likely the cause of
this change, enticing more U.S. skiers to travel to new mountains.
11BVMR – All-Season Market Assessment June 2021
Figure 5: U.S. Skier/Snowboarder Visits. Vs. Exchange Rate
Source: Canadian Ski Council, RRC Associates
For many tourism businesses, the exchange rate between the U.S. and Canada has a
notable impact on visitation. As displayed, when the exchange rate starts to dip, so do
U.S. skier/snowboarder visits to Canada. In the early 2000s, a strong exchange rate
contributed to the highest number of visits from the U.S. in the past 20+ years (1.8-1.9
million). However, when the exchange rate neared equal, the figure dropped by half or
more. The early 2010s experienced a prominent decline in U.S. visitation with under
600,000 U.S. visits in 2014/15. Recently, those figures have turned around, with the
2018/19 season back up to over 1.4 million.
12BVMR – All-Season Market Assessment June 2021
Figure 6: Domestic Visits and Number of Active Participants vs. Percent of
Canadian Population Actively Skiing/Snowboarding
Source: Canadian Ski Council, RRC Associates
The total number of Canadian skiing and snowboarding participants has remained very
steady over the past 20 years, with a dip in 2019/20 because of the Covid-19 pandemic,
which reduced the number of individual skiers that season. In 2002/03, the number of
active snowsports participants in Canada was 2,719,572 or 8.6% of the total population.
In 2018/19, pre-COVID, the total number of active participants had dropped to
2,713,014 or 7.3% of the total population. However, the percent of the total population
who ski/snowboard in Canada saw a long period of decline and stagnation from
2005/06 (6.6%) to 2015/16 (5.8%). Among residents of British Columbia, this
percentage is higher, likely in the 12% to 15% range depending on the year.
13BVMR – All-Season Market Assessment June 2021
Figure 7: Estimated Active Snowsports Participants by Province
Source: Canadian Ski Council, RRC Associates
The number of active skiers/snowboarders declined in 2019/20 due to the Covid-19
pandemic, particularly residents of British Columbia. By area of residence, Québec
(881,000) and Ontario (612,129) lead the way in total participants as of 2019/20. British
Columbia has seen a steady decrease from 2017/18’s 537,802 down to 386,102 in
2019/20, although likely seeing impacts from the pandemic. Although British Columbia
has some of the most visits, the number of unique participants is significantly lower than
the top two provinces. For BVMR, a low number of unique participants is not a major
cause for concern, as the total number of visits is still significant; however, fewer
participants mean the same customers do need to visit more frequently to keep pace.
For BVMR in particular, the growing local population and the differentiation from other
regional resorts means that the resort has a greater chance to increase the number of
unique customers who visit BVMR.
14BVMR – All-Season Market Assessment June 2021
Figure 8: Estimated Active Participants by Generational Cohort
Millennial skier
visits still
outpacing en
, with en
having
overtaken Baby
Boomers in the
2017/18 season.
ll segments
down due to
COVID 19.
Source: Canadian Ski Council, RRC Associates
The Canadian (and U.S.) ski industry is currently experiencing a turnover in one of the
most loyal age groups (Baby Boomers) and shifts to the large force that is Gen Z and
Millennials. While the figure above illustrates trends for U.S. skiers at U.S. ski resorts,
similar trends have been documented in other markets, and are expected to be relevant
to the Canadian ski industry. Millennials (aged 23-38) are currently the largest
demographic cohort, peaking at 1.0 million U.S. participants in 2018/19. However, Gen-
Z participation has steadily increased as they age into college and careers. Gen X still
represents a large share of active skiers, and will for a while, but the cohort is not
growing and has likely plateaued.
15BVMR – All-Season Market Assessment June 2021
Figure 9: Household Income of Canadian Skiers and Snowboarders, 10/11 - 19/20
Source: Canadian Ski Council, RRC Associates
Demographically, Canadian skiers and snowboarders have been getting wealthier.
Since 2010/11, the share of visits from those who earn under $50k has dropped by 10
percentage points (26% to 16%) while the share earning $250k or more has jumped
from 2% to 15%. Skiing/snowboarding has historically been perceived as expensive.
The gear, accommodations, and ticket prices turn many people away who cannot afford
the sport. Increased shares of visits from those with high incomes is not unique to
Canada. Prices have increased across the board, especially at major resort
destinations.
16BVMR – All-Season Market Assessment June 2021
Figure 10: Skier/Snowboarder Age
Source: Canadian Ski Council, RRC Associates
In combination with income, the average age of skiers/snowboarders has slowly
increased over time too. While the changes are not as dramatic, the share of visits from
those under 35 has dropped from 40% in 2010/11 to 34% in 2019/20. Growth in visits
has occurred from those aged 35-44, increasing from 21% in 2010/11 to 26% last
season. Overall, it has become clearer that the industry has shifted to a slightly older,
wealthier visitor base.
17BVMR – All-Season Market Assessment June 2021
U.S. Ski Resort Industry
While BVMR is more concerned with skier visitation from Canadian residents, it is
important to also consider how the U.S. ski/snowboard industry has changed over time.
Results from the 2019/20 U.S. National Ski rea ssociation’s annual Kottke End of
Season Report indicated that downhill snowsports visits (skier visits) in the U.S. were
down by over 8 million visits nationwide from the season prior to an estimated total of
51.1 million visits. However, the main driver of the decrease was that most resorts
closed by mid-March 2020 due to COVID-19. Before the pandemic, both the U.S. and
Canadian ski industries were on pace to have a very strong season once again.
The prior winter, the 2018/19 season, was very strong for the U.S. ski industry, but
largely driven by a record performance in the Rocky Mountain region; other parts of the
country had good – but not great – seasons.
Figure 11: U.S. Skier Visits
Source: National Ski Areas Association, RRC Associates
Skiers and snowboarders in Canada represent a larger share of the total population
than the U.S. The U.S. has not seen any major increase or decrease in total participants
either. As of 2019/20, 9.2 million participants were estimated, roughly in the middle of
the historic range of 8.6 to 10.0 million participants. Approximately 3% of the total U.S.
population are considered participants in snowsports compared to ~6 to 7% of
Canadians. Among residents of British Columbia, this percentage is higher, likely in the
12% to 15% range depending on the year
18BVMR – All-Season Market Assessment June 2021
Figure 12: Unique Participants at U.S. Resorts
Source: National Ski Areas Association, RRC Associates
Skier Visit Trends
The Canadian skier/snowboard industry has experienced ups and downs throughout the
past 20+ years. While overall visits were trending up from 2016/17 to 2018/19, little
variation has occurred in recent history. Essentially, ski areas are competing for the
same visitors, while new participants are not really developing. In fact, since 2002/03,
Canada has lost participants to some degree. Again, this is not unique. The number of
downhill Canadian and U.S. skier visits has generally remained stable over the
past 20 years. This historic stability is reflective of a resilient downhill snowsports
market – though factors like snow conditions and the economy may influence ski area
visitation, the numbers tend to be similar from year-to-year.
For BVMR, stagnation in skier visits and participation is concerning to some degree, but
many resorts are still thriving and growing in the industry. The difference is that smaller
ski areas are finding it harder to compete with the larger players. Thus, the visits are
being consolidated into larger resorts that offer wider diversities of activities. Therefore,
winter-focused destinations have begun to implement creative tools to not only
encourage their winter users to visit for more days per season, but also to cultivate non-
ski activities that may appeal to a wider audience. This trend underscores the
importance of considering year-round recreation, new offerings during winter,
and non-ski activities (e.g., events, tubing, dining experiences).
19BVMR – All-Season Market Assessment June 2021
Ski Industry Demographic Research
New generations of visitors are needed to continue sustaining the success of both the
Canadian and U.S. ski industries. The Baby Boomers and to some degree Gen X have
been key markets to the industry. However, both Millennials and Gen Z have really
shown their importance with Baby Boomers aging into retirement and Gen X peaking in
participation. Millennials and Gen Z are not the same as Baby Boomers or Gen X and
cannot be treated as such. They are more focused on technology, not as easy to
advertise to, and expecting of a unique experience. Thus, resources have been
allocated to better understand how to serve these generations and their families now
and into the future.
The National Ski Areas Association (along with other state and regional associations
such as Colorado Ski Country USA and the Pennsylvania Ski Areas Association) has
undertaken a variety of research studies related to the Millennial generation (young
adults aged 24 to 39 years old in 2021). These studies are intended to understand
downhill snowsports participation patterns and preferences among this generation.
When compared to all other age cohorts, the Millennial generation accounts for one
of the largest groups of snowsports participants. However, Millennial skiers and
snowboarders, on average, ski fewer days per season than other age cohorts,
with an average of only approximately 4.9 days on the mountain season (by
comparison, the average number of days that Baby Boomers ski per season is 6.7).
These low numbers for Millennials are troubling to ski-related operators; thus, NSAA is
studying the pattern of Millennial participation and intention to continue with snowsports.
In addition to Millennials, Gen Z (the youngest and largest generation, currently aged 22
and younger) now represents the largest grouping of participants by age cohort.
Furthermore, this group varies in terms of preferences, expectations, and behaviors in
their recreation. Ski areas not only have to consider supporting large constituents of
Millennials, who themselves differ from generations such as Baby Boomers and Gen X,
but also areas need to implement marketing and promotion to Gen Z. This creates
pressure to become innovative in marketing and promotional materials to reach two
large audiences with differing preferences.
Gen Z cannot be placed in the same box as Millennials. The two generations are
lumped together in many cases, but research suggests that Gen Z is even more
technologically-savvy, exposed to other cultural factors at an earlier age, and is willing
to stick up for causes they support. Not all of Gen Z fit this image, but technology is
going to serve as a key cornerstone for this group. In terms of marketing, Gen Z can
spot when they are being marketed to much faster than other generations, since they
have grown up being constantly targeted with ads from an early age. They expect
brands that market to them to interact and have a more human personality than before.
20BVMR – All-Season Market Assessment June 2021
Moving into 2021, it is difficult to not consider the social activism that was led by many
of those in Gen Z. Racial and social equity along with wealth inequalities were issues
brought to the mainstream from recent events. Ski areas may not feel that these events
impact them; however, Gen Z is the largest group of skiers and snowboarders, and they
will continue to be into the future. Considering how these events can impact perceptions
is important for resort marketing.
Detailed research about Gen Z in the ski industry has yet to occur. Interest exists for
further exploration of this cohort, but a solid foundation has yet to be built. That said,
there has been some research into Millennials and Gen-Z that provides some insights
into the younger generations. The section below highlights some of these findings.
Millennial Research
For winter-focused destinations, the importance of growing the user base of young
adults is critical. In the winter, most mountain destinations tend to be populated by an
older, repeat visit clientele; while this customer base is valuable, ski areas need to think
about strategies to appeal to younger demographics and offer non-ski activities. To
further understand this important segment of the industry, the National Ski Areas
Association researched the Millennial generation in 2014/15.
A national survey of over 2,000 Millennials (including both snowsports participants and
non-snowsports participants), in addition to qualitative one-on-one interviews in key
market areas, generated some initial conclusions about Millennials and their propensity
to participate in skiing and snowboarding. In the survey, Millennial skiers and
snowboarders were asked to describe what they like most about downhill snowsports.
The words most frequently mentioned by respondents include “fun,” “freedom,”
“friends,” and “outside.” One aspect that sets Millennials apart from their older
counterparts is their social inclinations, which was noted throughout the qualitative
interviews. Many Millennial skiers and riders indicated that skiing is, to them, a social
activity – they prefer to spend both day visits and overnight destination trips with friends
and family.
21BVMR – All-Season Market Assessment June 2021
When asked what they dislike
about skiing and snowboarding,
Millennial snowsports participants
were most likely to respond with
words like “cold,” “cost,” and “lift
lines.” The cost of the sport is
clearly a barrier for some
Millennials. Respondents were
asked to talk about the reasons
their friends cite for not skiing or
snowboarding, and many
mentioned “money,” “cost,” or the
“expensive” nature of the sport.
large portion of Millennials face financial challenges; however, secondary research has
revealed that there are some 16.6 million Millennials in households earning over
$100,000 per year. While select Millennials can seek out luxurious experiences, the
large majority are likely to gravitate towards lower-cost opportunities.
Despite these limitations, 55 percent of Millennial skiers and snowboarders strongly
agreed with the statement, “I’m committed to skiing/snowboarding for life.” Interestingly,
the percentage strongly agreeing with this statement declined somewhat with age within
the cohort (from younger Millennials to older Millennials) as well as with the presence of
children. This paints a positive picture overall of Millennial participation in the
downhill snowsports market, but a definitive market for alternative options.
Millennials are aging into careers and parenthood while people in Gen Z are still moving
into adulthood, finishing college, or are relatively new to the workforce. Identifying how
to attract those without children, in addition to those with young children, will be an
ongoing effort for winter sports.
22BVMR – All-Season Market Assessment June 2021
Summer Season Business Potential
To generate year-round income and
boost visitation in all seasons, as well
as establishing balanced operations, a
reliable source of career-oriented
employment and a high-quality all-
season tourist experience, destinations
across North America have been
working hard on building
infrastructure to support summer
activities and developing new
programming. T
ravel and accommodations are often more affordable for summer visitors, and most
families are much more willing to travel during the summer. Resorts are placing a high
degree of effort into improving their summer offerings to make their destination well-
rounded and resilient. Alpine slides, mountain coasters, and zip lines are a few of the
new types of activities being installed at resorts across the country to serve summer
guests. Summer guests are likely to have different motivations than winter guests.
Consumer research studies have been conducted by ski areas to understand what
motivates participants to visit a ski area in the summer, preferred activities, and
likelihood to visit in the winter. This information allows for a more comprehensive
strategy to build successful summer operations.
Many destinations and their nearby communities have followed suit, expanding their
multi-season recreation opportunities to encompass a wider visitor market. Most
destinations and nearby communities in the summer marketplace also offer special
events that relate to recreation, food and beverage, health and wellness, music, arts
and culture, and other themes.
A study by the National Ski Areas Association looked at summer operations at over 200
U.S. ski resorts. The top summer/fall activities offered by resorts include hiking,
scenic lift rides, and mountain biking, with over half of the participating resorts
reporting that they offer these activities. The survey also asked respondents about
summer/fall events. Almost all responding resorts indicated that they host weddings,
meetings, and/or family reunions, and about half offer festivals. Similar results would be
expected for mountain resorts in Canada.
As many resorts continue to expand and improve their summer offerings, it could be
more difficult for resorts without multi-season opportunities to remain relevant in the
resort marketplace. However, summer activities still need to be profitable. Additionally,
these activities have their own set of challenges that are not present in winter activities.
23BVMR – All-Season Market Assessment June 2021
For instance, it is more challenging to monetize summer activities if fee-free options are
nearby. Plus, getting visitors to consider a “ski resort” for summer recreation is still
difficult. Changing that perception is necessary.
Pass Partnerships
In recent years, reciprocal ski passes created by
resort partners have become a popular option for
downhill snowsports participants and have shown
strong growth across popular North American
destinations. These pass partnerships allow skiers
and snowboarders to visit a variety of resorts
nationally and internationally under one
comprehensive pass with a one-time purchase.
The products represent an opportunity for skiers
and snowboarders to visit a new ski area, and for
ski areas to bring first-time visitors to their resort; they are also a significant opportunity
for resorts to broaden their reach in the competitive marketplace.
Until 2018, the three main players in the multi-mountain pass industry were the Epic
Pass, the Mountain Collective, and the Rocky Mountain Super Pass Plus. In 2018/19,
the Ikon Pass replaced the RMSP and emerged as an enticing new product that
encourages purchasers to travel to other ski resorts based on its large number of
destination resorts. Epic Pass’s announcement of the “Epic Day Pass” starting in the
2019/20 season also provided a new twist on pass products for those who are in
between the season pass and day pass option by allowing for massively reduced ticket
prices if purchased pre-season.
Flexibility and affordability will continue to play a role in the pass marketplace. Pre-
purchasing has become standard even for day passes, largely due to Covid-19.
Especially for the upcoming the 2021/22 season, guests will be even more accustomed
to planning and purchasing before they decide to visit. New pass options generate pre-
season revenue, an important aspect of cash flow management today. It is anticipated
that multi-mountain pass partnerships will continue to evolve in the future.
24BVMR – All-Season Market Assessment June 2021
Skiing/Snowboarding Participation Rates
British Columbia in general, and the Mainland / Southwest area in particular, have well-
established resident ski/snowboard markets.
Based on seven-season winter averages (2013/14 – 2019/20), British Columbia
residents generate an annual average of 3.07 million skier days in Canada (where one
skier day = one person downhill skiing or snowboarding for any part of a day).
With an average population of 4.93 million over the 2014-2020 period, BC residents
generated an annual average of 0.622 skier days per capita in Canada (Figure 41).
Over the same period, the 3.02 million residents in the Mainland/Southwest
Development Region took an annual average of 1.94 million skier days, or 0.643 skier
days per capita, similar to the overall BC average.
Looking elsewhere in BC, the Thompson/Okanagan area, with multiple quality
destination ski areas, exhibits 75% higher skier visits per capita (1.123 visits/capita)
than the Mainland/Southwest (0.643 ski days / capita). Conversely, Vancouver
Island/Coast, with more limited nearby skiing options, has significantly lower resident ski
activity (0.374 visits / capita, or 42% less than the Mainland/Southwest). These
variances suggest that the availability and quality of proximate skiing options can have a
substantial influence on resident skiing behavior. Such variances are widely seen in
other resident ski markets in North America.
Based on existing patterns, as the Lower Mainland area continues to grow, it might be
expected to generate roughly 64,000 incremental skier visits for every additional
100,000 population (subject to the demographics of the population and other factors).
For context, over the 2011-2020 period, the Mainland/Southwest area gained
approximately 425,000 residents, or about 47,000 residents per year.
25BVMR – All-Season Market Assessment June 2021
Figure 13: Average Annual Downhill Skier/Snowboarder Visits and Population:
British Columbia Development Regions
Source: RRC Associates; Canadian Ski Council skier demographic surveys; Statistics Canada.
Looking ahead, continued population growth is likely to expand the local ski market over
time, all else held equal. For example, 20% growth in the Mainland/Southwest
population (+630,399 people) might translate into approximately 388,000 additional
local resident skier visits, all else held equal (Figure 14).
Additionally, it is likely that BVMR would have a stimulative effect on local skiing activity,
helping expand the size of the Mainland / Southwest market, which would likely be an
important (but not sole) market for BVMR. For example, if the lower Mainland/
Southwest skiing participation rate increased by 5%, that would translate into an
additional 97,000 annual skier visits (Figure 15).
The foregoing data indicate that BVMR is positioned within a sizeable and growing
regional skiing market from which it can draw (in addition to drawing from other
markets). The likelihood of future regional growth and BVMR’s potential to stimulate
interest and expand options for the downhill skiing market are also important reasons in
the evaluation of BVMR.
26BVMR – All-Season Market Assessment June 2021
Figure 14: Hypothetical Increase in Mainland/Southwest
Skier Visits with Population Growth
With change in population
10% 20% 30%
Current
increase increase increase
Mainland / Southwest population 3,151,996 3,467,196 3,782,395 4,097,595
Incremental additional population (vs. current) n/a 315,200 630,399 945,599
Mainland / Southwest skier visits 1,940,000 2,134,000 2,328,000 2,522,000
Incremental additional skier visits (vs. current) n/a 194,000 388,000 582,000
Source: RRC Associates.
Figure 15: Hypothetical Increase in Mainland/Southwest
Skier Visits with Increased Skiing Participation Rates
With change in skier visits / capita
Current 2% increase 5% increase 10% increase
Mainland / Southwest skier visits per capita 0.643 0.656 0.675 0.707
Mainland / Southwest resident skier visits 1,940,000 1,978,800 2,037,000 2,134,000
Incremental additional skier visits (vs. current) n/a 38,800 97,000 194,000
Source: RRC Associates.
27BVMR – All-Season Market Assessment June 2021
Trends in Tourism and Outdoor Recreation
Mountain Bike Tourism
Downhill mountain biking continues to be a popular summertime mountain activity.
Interest in the sport has grown since the pandemic. According to Grand View Research,
the global bicycle market size was valued at USD $54.44 billion in 2020. It is expected
to expand at a compound annual growth rate (CAGR) of 7.0% from 2021 to 2028.
According to a survey by Statistics Canada, in 2016, approximately 13 percent of
individuals participated in mountain biking that summer.
Figure 16: North America Bicycle Market Size, by Product, 2016-2028
(USD, Billion)
Source: Grand View Research
Figure 17: Monthly U.S. Sales Growth for Key Bicycle Categories
January-April 2020 vs. 2019
Source: The NPD Group/ U.S. Retail Tracking Service/ Dollar Sales/January-April 2020 vs. 2019
28BVMR – All-Season Market Assessment June 2021
In BC specifically, mountain bike tourism continues to increase. An economic impact
study by the Mountain Bike Tourism Association and Destination British Columbia
indicated an increase of over 100% revenues and employment numbers related to
mountain biking over a decade.
This information is promising for BVMR. With strong and growing interested in mountain
biking as a sport, the opportunity to operate year-round while charging for bike rentals,
lift tickets and possibly lessons, is an attractive option.
The following recent studies exemplify the economic opportunities that mountain biking
can potentially provide to resorts:
Whistler
A study of the economic impact of mountain biking in Whistler conducted in by
the Canadian Sport Tourism Alliance 2016 identified considerable economic
value in mountain biking.
Three surveys were administered during the 2015-16 seasons at four separate
locations (Whistler Bike Park, Lost Lake Trails, Whistler Cross Country Trails and
Crankworx) and provided the following results:
• $46.6 million in visitor spending directly attributable to mountain biking
• 389 Whistler jobs
• $75.9 million in economic activity supported in British Columbia
• 102,500 out-of-town visits were made to ride in Whistler during 2016
• $18.1 million in wages & salaries supported in Whistler
• $39.3 million boost to provincial GDP
Squamish
The Mountain Biking Economic Impact study published in April 2017 of the
Squamish area offered several positive economic indicators of the value of the
sport. This data is from intercept surveys at 4 locations in Squamish from June
11 to August 29, 2016, which produced a total of 445 surveys. Since the previous
survey ten years ago, the share of out-of-town riders staying overnight increased
by 23% and the average length of stay increased by 2.6 nights. Overall tourism
spending increased $7.4 million from 2006 to 2016.
In 2016:
• There were 22,820 out-of-town riders which contributed $9.9 million in
visor spending
• 71 Squamish jobs supported by the tourism expenditures of mountain
bikers
29BVMR – All-Season Market Assessment June 2021
• 44% of out-of-town riders stayed overnight
• $7.3 million boost to provincial GDP
• $.1. million in taxes supported in BC
Another study done on the Test of Metal, a 67 km course mountain biking event
in Squamish during a weekend in June in 2016, proves that events also play a
significant role in the tourism economy. The 21st and final edition of the Test of
Metal took place in Squamish June 18 & 19, 2016 and was open to 1,200 riders.
With spectators and supporters, this event provided a considerable boost in
tourism and economic activity for Squamish.
A post event survey was sent out and provided the following results:
• The Test of Metal attracted 1,164 out-of-town participants & spectators
• The event generated $397,000 in visitor spending
• Total GDP was $418,000 attributable to the event
Pemberton
The Mountain Biking Economic Impact study conducted in May 2017 highlights
several important figures which signify the profitability of mountain biking and the
attraction of visitors. Intercept survey data was collected from July 8 to August 29
with a total of 2,010 surveys.
In 2016:
• There were 2,974 out-of-town riders, half of which stayed overnight
• $858,000 in visitor spending directly attributable to mountain biking in the
area
• 6.5 Pemberton jobs supported by mountain bike tourism and operational
spending
• $627,000 boost to provincial GDP
This economic impact of mountain biking in other mountain resort locations like
Pemberton and Whistler are an encouraging sign for BMR. Increases to visitors,
spending, jobs, labor income, and GDP noted at these other locations signify that the
opportunity at BVMR with downhill mountain biking is significant.
30BVMR – All-Season Market Assessment June 2021
Gondola Sightseeing
Another economic opportunity is gondolas for the purpose of sightseeing. One popular
gondola in the area is the Sea to Sky Gondola. There are 39 gondola cabins that hold 8
passengers each. With daily lift tickets at $56 each, this gondola has significant
economic potential.
Since its opening in 2014, the Sea to Sky Gondola, which is within Stawamus Chief
Provincial Park and Protected area and near the popular Shannon Falls Provincial Park,
has led to a large increase in visitor numbers in Squamish. According to an Economic
Impact of Squamish Tourism Sector 2020 report by Crane Management Consultants
since the Sea to Sky gondola opened, the following changes have been recorded:
• Visitors seeking information at Squamish Adventure Centre increased by 37%.
• Tour buses stopping at Squamish Adventure Centre increased by 40%.
• Traffic on the Tourism Squamish website increased by 32%; and
• Hotel occupancy increased by 10% (Colebourn, 2015).
In 2017, the gondola hosted its millionth visitor. Since its opening, the gondola averaged
about 330,000 visitors annually; the majority (320,000) of these visitors were tourist or
non-residents of the area. It is also a large employer with about 150 staff during high
season.
A table showing regional gondola visitation is shown below.
Figure 18: Annual Visitors to Regional Cable Cars
Source: Prairie Sky Gondola Inc.
31BVMR – All-Season Market Assessment June 2021
In 2017, the Banff scenic gondola reopened after renovation (between October 2015
and April 2016). Compared to pre-renovations, revenue grew by 57%, the number of
passengers increased by 20%, and revenue per passenger from ticket sales, retail, and
dining rose by 31%.
Another popular sightseeing gondola is the Palm Springs, California Tram, which
averages an estimated 750,000 visits annually.
Squamish Adventure Center
Figure 19: Visitors at the Squamish Adventure Centre (number), 2010-2019
Source: Destination BC 2020
Visitor numbers at the Squamish Adventure Center have been increasing, though at an
irregular rate, from around 20,000 annually in the 2010 to 2014 period, peaking at about
60,000 in 2016, and then rising again in 2019 to 80,000 visitors.
Fraser Valley Regional District Provincial Parks
Provincial parks play an important role in tourism and Canada’s economy. study done
for the Canadian Parks Council published in 2011 estimated that all of Canada’s
national, provincial, and territorial parks create over 64,000 full time jobs, generating
$2.flodgin9 billion in labor income and contributing $4.6 billion to Canada’s GDP in
2008/09. For British Columbia, 9,990 full time equivalent jobs were created resulting in
$544 million in labor income and contributed $728 to the province’s GDP. These
numbers have only increased in the past decade.
32BVMR – All-Season Market Assessment June 2021
The FVRD hosts over 20 provincial parks. Provincial parks in the Southern Coast
Region (including Chilliwack area) have seen an increase in visitation and consequently
revenue over the past few years. These trends show an interest in the area for spending
time in local outdoor areas and is promising for recreation opportunities at BVMR.
• Total increase in revenue from camping, day use and boating fees increased by
$294,251 from 2016/17 to 2017/18 in the Southern Coast Region
• For Chilliwack Lake Park specifically revenue increased by 12% from 2016/17 to
2017/18
• Camping revenue in the Southern Coast Region increased by 7.6% during the
same time frame for a total of $2.8 million in 2017/18
Other prominent provincial parks in the area have seen increases over time as well.
From 2007/08 to 2016/17, annual day visitor attendance increased at each of Shannon
Falls (286%), Stawamus Chief (36%) and Alice (79%) provincial parks.
Figure 20: Day Use Attendance at Squamish Area Provincial Parks (# of Persons),
2007/08-2016/17
Source: BC Parks various years
For provincial parks in the FVRD, park visitation has also been increasing. The revenue
form day passes, and camping help fuel the regional economy. Of the more than 20 in
the region, these parks, (Bridal Veil Falls, Chilliwack Lake, Cultus Lake, E.C. Manning
Park, Sasquatch Park and Skagit Valley Park) are in proximity to BVMR.
33BVMR – All-Season Market Assessment June 2021
Figure 21: Annual Visitation to FVRD Area Provincial Parks
1,400,000
1,200,000
E.C. Manning Park,
1,091,149
1,000,000
800,000 Cultus Lake Park, 802,159
600,000
400,000
Sasquatch Park, 300,437 Bridal Veil Falls Provincial
200,000 Park, 209,969
Chilliwack Lake Provincial
0 Skagit Park,
Valley199,052
Park, 36,834
2014-2015 2015-2016 2016-2017 2017-2018
The maps below show the regional distribution of nearby parks.
34BVMR – All-Season Market Assessment June 2021
Figure 22: Map of Nearby Provincial Parks
Source: Government of BC
Figure 23: Annual Revenue Generated by Provincial Park Visitation
1200000
1000000
Revenue (net of taxes)
800000 Bridal Veil Falls Provincial Park
Chilliwack Lake Provincial Park
600000
Cultus Lake Park
400000 E.C. Manning Park
Sasquatch Park
200000
Skagit Valley Park
0
2014-2015 2015-2016 2016-2017 2017-2018
Year
Source: BC Parks various years
35BVMR – All-Season Market Assessment June 2021
Local Traffic Counts
One of the important competitive advantages of BVMR is its location just off the Trans-
Canada Highway (Route 1), which provides superior access to BVMR from the Lower
Mainland market and points beyond. Moreover, Route 1 is a well-established travel
route for tourists, likely carrying several million visitors annually from the
Vancouver/Fraser Valley region (plus Washington/US) to destinations further east in BC
and Alberta. BVMR would likely both tap into this existing and growing stream of visitor
travel, as well as stimulate incremental new demand by virtue of being an especially
convenient travel option due to its easy access to Lower Mainland population centers.
Several of the characteristics of the Route 1 tourism travel market can be inferred from
local traffic counts. Permanent traffic counters are located on Route 1 in Chilliwack
(Vedder traffic counter, 1.3 km west of Vedder Road) and Laidlaw, approximately 40 km
northeast of Chilliwack (Lorenzetta traffic counter), as shown in the two maps to follow.
Figure 24: Locations of Vedder & Lorenzetta Permanent Traffic Counters, Route 1
Lorenzetta traffic counter
P-17-1EW
Vedder traffic counter
P-17-99EW
Source: BC Ministry of Transportation and Infrastructure, https://prdoas6.pub-apps.th.gov.bc.ca/tsg/
36BVMR – All-Season Market Assessment June 2021
Figure 25: Locations of Vedder Permanent Traffic Counters, Route 1 (zoom-in)
Vedder traffic counter
P-17-99EW
Source: BC Ministry of Transportation and Infrastructure, https://prdoas6.pub-apps.th.gov.bc.ca/tsg/
The BC Ministry of Transportation and Infrastructure assigns permanent traffic
measurement sites into “factor groups” based on shared traffic pattern characteristics.
Sites are grouped into one of three categories – consistent, seasonal, and highly
seasonal – based on the variation of monthly traffic relative to annual average traffic, as
illustrated in Figure 26 to follow.
• The Vedder traffic counter is classified in the “seasonal” factor group, which is
“characterized by low to moderate proportions of commuter traffic and increasing
pass-through and recreational traffic.”
• The traffic patterns at Lorenzetta are cited as a textbook example of the “highly
seasonal” factor group, with substantially higher proportions of recreational and
pass-through traffic in the summer, and higher volumes on weekend days than
weekdays. Such traffic patterns are “common near summer recreation areas and
on tourist routes.”
37BVMR – All-Season Market Assessment June 2021
Figure 26: Factor Groups for BC Permanent Traffic Measurement Sites
Source: Traffic Reports User Documentation, May 16, 2019, British Columbia Ministry of Transportation and Infrastructure.
Although the Vedder and Lorenzetta counters fall into two different seasonal factor
groups, further analysis (as well as intuition) indicates that many of the travelers
measured at the Lorenzetta counter also pass through the Vedder counter. As such, the
“tourist route” characterization of Lorenzetta also effectively applies at Vedder and
Chilliwack insofar as travelers pass by both areas. The series of graphs and discussion
to follow go into more detail on these travel patterns and findings, and seek to
characterize the nature of tourism traffic passing through Chilliwack (and by extension,
past BVMR).
38BVMR – All-Season Market Assessment June 2021
Figure 27 to follow illustrates daily traffic counts in 2018 at the Vedder and Lorenzetta
traffic counters. Figure 28 summarizes the associated average daily traffic counts by
month and day of week, and Figure 29 goes a level deeper by summarizing average
daily traffic by day of week by month.
A few patterns of interest are apparent:
• At both counters, traffic is substantially higher in the summer months than the
winter months, typically an indicator of summer tourism.
• Average daily traffic counts at Vedder are consistently about 40,000 higher than
at Lorenzetta on Tuesdays through Fridays throughout the year – likely a sign of
consistent workweek traffic present at Vedder but absent at Lorenzetta.
Additional patterns of interest become clear when the traffic data are analyzed
directionally (eastbound vs. westbound), as shown in Figure 30 to Figure 34 to follow.
Patterns of interest include the following.
• At both the Vedder and Lorenzetta counters, there is substantial net eastbound
flow on Thursdays, Fridays and Saturdays (particularly in May – August), and
substantial net westbound flow on Sundays and Mondays (Figure 31 and Figure
32). These patterns are strongly indicative of outbound weekend trips from the
Lower Mainland area to points east.
• Moreover, these net directional flows of weekend travel are highly similar in
pattern and scale at both the Vedder and Lorenzetta counters – a very strong
sign that the same weekend travelers pass through both counters – and by
extension, indicate the presence of a large flow of leisure travelers passing right
by BVMR, especially in summer and on weekends.
• Figure 34 illustrates the cumulative eastbound traffic flow on Route 1 at
Lorenzetta in 2018, summing up daily net eastbound flows throughout the year.
o The pattern shows a strong net eastbound flow rising through the spring
and summer, peaking at a cumulative net 48,000 vehicles at points east of
Lorenzetta through the British Columbia Day weekend. Thereafter, the
flow reverses, with vehicles cumulatively returning west through the fall,
before a net eastbound flow returns over the Christmas holiday.
o The patterns also show cumulative net eastbound flows of roughly 10,000
vehicles on non-holiday July weekends. On summer holiday weekends,
net eastbound flows are often dramatically higher (e.g. approximately
28,000 net eastbound vehicles over the Canada Day holiday, and close to
26,000 net eastbound vehicles over the British Columbia Day holiday).
Conversely, net eastbound flows are lower on non-holiday weekends in
the spring and fall.
39You can also read