What drives daily precipitation over the central Amazon? Differences observed between wet and dry seasons - ACP ...
←
→
Page content transcription
If your browser does not render page correctly, please read the page content below
Atmos. Chem. Phys., 21, 6735–6754, 2021
https://doi.org/10.5194/acp-21-6735-2021
© Author(s) 2021. This work is distributed under
the Creative Commons Attribution 4.0 License.

What drives daily precipitation over the central Amazon?
Differences observed between wet and dry seasons
Thiago S. Biscaro1 , Luiz A. T. Machado1,3 , Scott E. Giangrande2 , and Michael P. Jensen2
1 MeteorologicalSatellites and Sensors Division, National Institute for Space Research, Cachoeira Paulista,
São Paulo, 12630000, Brazil
2 Environmental and Climate Sciences Department, Brookhaven National Laboratory, Upton, NY, USA
3 Multiphase Chemistry Department, Max Planck Institute for Chemistry, 55128 Mainz, Germany

Correspondence: Thiago S. Biscaro (thiago.biscaro@inpe.br)

Received: 20 October 2020 – Discussion started: 22 October 2020
Revised: 24 March 2021 – Accepted: 30 March 2021 – Published: 5 May 2021

Abstract. This study offers an alternative presentation re-        tion cycle has been studied for decades using various numer-
garding how diurnal precipitation is modulated by convec-          ical models (Bechtold et al., 2004; Sato et al., 2009; Strat-
tive events that developed over the central Amazon during          ton and Stirling, 2012) and observational techniques (Itterly
the preceding nighttime period. We use data collected during       et al., 2016; Machado et al., 2002; Oliveira et al., 2016).
the Observations and Modelling of the Green Ocean Amazon           Despite these efforts, there remain several unresolved is-
(GoAmazon 2014/2015) field campaign that took place from           sues related to the representation of tropical precipitation in
1 January 2014 to 30 November 2015 in the central Amazon.          large-scale atmospheric models, including (a) an incorrect
Local surface-based observations of cloud occurrence, soil         phasing of the diurnal cycle of precipitation over land that
temperature, surface fluxes, and planetary boundary layer          favors models triggering precipitation too early in the day
characteristics are coupled with satellite data to identify the    (Gentine et al., 2013); (b) the poor positioning and poten-
physical mechanisms that control the diurnal rainfall in cen-      tial doubling of the Intertropical Convergence Zone (Hwang
tral Amazon during the wet and dry seasons. This is accom-         and Frierson, 2013); and (c) the underestimation of rainfall
plished through evaluation of the atmospheric properties dur-      over the Amazon forest (Huntingford et al., 2004). Regard-
ing the nocturnal periods preceding raining and non-raining        ing the diurnal cycle of precipitation, Guichard et al. (2004)
events. Comparisons between these non-raining and raining          and Grabowski et al. (2006) demonstrated that single-column
transitions are presented for the wet (January to April) and       models (SCMs), using parameterizations to represent moist
dry (June to September) seasons. The results suggest that          convection and clouds, reproduced the same early precip-
wet-season diurnal precipitation is modulated by nighttime         itation behavior presented in full 3-D large-scale models.
cloud coverage and local influences such as heating induced        Also, SCMs predict instantaneous growth of deep convec-
turbulence, whereas the dry-season rain events are controlled      tive clouds within one time step after their tops overcome
by large-scale circulations.                                       the surface-based convective inhibition. Hence, a correct de-
                                                                   piction of the convective diurnal cycle depends not only on
                                                                   the correct representation of deep convection but also on
                                                                   the representation of a progression of regimes, from dry to
1   Introduction                                                   moist non-precipitating to precipitating convection. Cloud-
                                                                   resolving models (CRMs), on the other hand, can capture
As a key component of the atmospheric system, convective           qualitative aspects of the convective diurnal cycle, although
cloud processes and their inadequate model representations         they are subject to model resolution and subgrid-scale pro-
in tropical regions introduce significant uncertainty in nu-       cess representation.
merical weather and climate predictions (Betts and Jakob,
2002; Dai, 2006). In particular, the tropical diurnal precipita-

Published by Copernicus Publications on behalf of the European Geosciences Union.
6736                                                 T. S. Biscaro et al.: Differences observed between wet and dry seasons

   Given its unique tropical location and propensity for deep    fall cycle in the central Amazon and contrast the variabil-
convective clouds with important feedbacks on the global cir-    ity between the wet and dry seasons. Specifically, this study
culation, several scientific campaigns have focused on the       emphasizes the changes in the atmospheric conditions and
clouds, aerosol transportation, and land–atmosphere process      cloud properties observed during the nocturnal periods from
interactions over the Amazon forest (e. g., Adams et al.,        days preceding events having rainfall and those events with
2013; Machado et al., 2014; Martin et al., 2016; Silva Dias      no rainfall. We do not assume that convection is only depen-
et al., 2002; Wendisch et al., 2016). Since convection is pa-    dent on nocturnal conditions, but our aim is to isolate the
rameterized in general circulation models (GCMs), with con-      potential factors in the evolution of the convective environ-
vective cloud scales ranging from smaller to larger than the     ment that may lead to diurnal precipitation. This is a con-
typical GCM grid resolution, the variability in the convective   venient simplification, as isolated convection also may occur
scale driven by the large-scale circulation needs to be con-     during overnight periods (which would affect soil moisture
sidered in convection parametrization schemes and satellite-     and atmospheric stability during the morning, among other
based rainfall retrievals (Rickenbach et al., 2002). Knowl-      factors), and expanding this period would result in observing
edge of the factors controlling the dynamical, microphys-        the previous day’s convection. One motivation for this study
ical, and environmental differences between the organized        is to establish potential physical mechanisms responsible for
(i.e., larger areal coverage cloud regimes, mesoscale con-       the contrasts between raining and non-raining days. These
vective systems – MCSs; Houze, 2018) and/or isolated con-        analyses consider the atmospheric cloud and environmental
vective cloud regimes (Schiro and Neelin, 2018) have also        conditions over multiple scales by incorporating local con-
been highlighted as challenges for the correct representation    vection and/or column observations with mesoscale/regional
of convective processes in the Amazon. Specific to the di-       cloud properties. This paper is structured as follows: Sect. 2
urnal cycle of cloud systems in the Amazon, the deficien-        presents the data used, Sect. 3 defines the methodology for
cies in model treatments of shallow convection and cloud         quantifying the precipitation transitions, Sect. 4 presents the
transitions to deeper convective modes have been identified      results, and the conclusions are shown in Sect. 5.
as a continuing challenge towards its correct representation
in GCMs (Khairoutdinov and Randall, 2006; Adams et al.,
2015, 2017). Recently, Zhuang et al. (2017) carried out an       2   Data
observational analysis and proposed that diurnal shallow-
to-deep transitions are highly correlated with large-scale       The GoAmazon 2014/2015 field campaign was conducted
moisture transport convergence, lower surface temperature,       between January 2014 and December of 2015. The main site
higher surface humidity, shallower mixed layer, smaller sen-     (herein, T3) was located in Manacapuru, state of Amazonas
sible heat flux, and smaller surface wind speed. Similarly,      (3.213◦ S, 60.598◦ W), which is at a location roughly 70 km
Meyer and Haerter (2020) showed numerically that in the ab-      west of Manaus. A comprehensive suite of instruments to
sence of large-scale moisture advection, cold-pool collisions    measure cloud, precipitation, aerosol, and atmospheric state
act as precursors of shallow-to-deep transitions. Shallow-to-    was deployed at T3 as part of the US Department of Energy
deep transitions are also connected with the representation of   Atmospheric Radiation Measurement (ARM; Ackerman and
the diurnal cycle of precipitation (Couvreux et al., 2015) and   Stokes, 2003; Mather and Voyles, 2013) Mobile Facility 1
medium-range predictability associated with the Madden–          (AMF1; Miller et al., 2016) during GoAmazon 2014/2015.
Julian oscillation (Klingaman et al., 2015). While proxim-       Additional details on the AMF deployment and its dataset
ity to topography or coastlines that drive local circulations    collection to include an overview of the cloud coverage and
can play an important role in Amazonian convective life cy-      radiative properties, as well as campaign thermodynamic
cle, shallow clouds over the central Amazon and their transi-    conditions, are provided by Giangrande et al. (2017, 2020).
tion to deep convection are associated with the growth of di-       The primary ARM data source for this study is the Ac-
urnally driven evening deep convection (Chakraborty et al.,      tive Remote Sensing of CLouds (ARSCL; e.g., Clothiaux et
2020).                                                           al., 2000) value-added product. This data product combines
   The Observations and Modelling of the Green Ocean             measurements from a ceilometer, a micropulse lidar, and a
Amazon (GoAmazon 2014/2015) campaign (Martin et al.,             vertically pointing W -band (94 GHz) radar (ARM, 2014b).
2016) was a 2-year deployment over Manaus, Brazil, and its       We use the cloud mask available in the ARSCL product
surroundings, including an advanced complement of cloud          to derive profiles of cloud frequency of occurrence. These
and precipitation profiling instruments. This unique deploy-     cloud frequency values were calculated by averaging the oc-
ment enabled an unprecedented new investigation of cloud         currences observed over our periods of observation and for
life cycle and associated environmental controls sampled         the cloud transition modes as defined in Sect. 3. Similarly,
prior to cloud initiation and during subsequent cloud devel-     we draw from the ARM eddy correlation (ECOR) flux mea-
opment stages, as well as the associated cloud and precipita-    surement system (ARM, 2014a) observations that are used
tion properties. The purpose of this study is to compare the     to derive the turbulent kinetic energy and latent and sensi-
environmental conditions observed within the diurnal rain-       ble heat fluxes. The T3 site also included a surface energy

Atmos. Chem. Phys., 21, 6735–6754, 2021                                           https://doi.org/10.5194/acp-21-6735-2021
T. S. Biscaro et al.: Differences observed between wet and dry seasons                                                     6737

balance system (SEBS) (ARM, 2013b), used to compute the          sitions as NR–NR (no rain to no rain) and NR–RR (no rain
soil temperature, and a radiometer used to measure long-         to rain), which represent two separate diurnal period rain-
wave irradiances. GoAmazon 2014/2015 included frequent           fall outcomes. Our intention is to identify the potential con-
radiosonde (ARM, 1993) launches (four times a day, fixed         trols during nocturnal periods that initiate or stifle precipi-
at 00:00, 06:00, 12:00, and 18:00 GMT) that are used to es-      tation in the subsequent diurnal window. For completeness,
timate convective indices, convective available potential en-    we note that the complete GoAmazon 2014/2015 dataset in-
ergy (CAPE), and convective inhibition (CIN) (Jensen et al.,     cludes several days that record rain within the nocturnal pe-
2015). For CAPE and CIN calculations, the traditional ap-        riod (39 % of the days during the wet season and 9 % of
proach of parcel theory was applied – water vapor phase          those during the dry season). These days are not consid-
changes only and irreversible parcel ascent in a virtual po-     ered for our current analysis since we are only interested in
tential temperature framework (Bryan and Fritsch, 2002). We      simpler, archetypal diurnal cycle examples associated with
define the originating level of the convective parcels as the    daytime onset of clouds and precipitation. Our choice for a
level of maximum virtual temperature in the lowest 1000 m        precipitation-free 12 h nocturnal period also acts as an ad-
of the atmosphere representing the most buoyant parcel in the    ditional control, since organized MCSs or other widespread
boundary layer, maximizing the CAPE and minimizing the           precipitation may propagate into the Amazon basin at all
CIN. Finally, a ceilometer-based approach is used to derive      times and are frequently found during the wet and transi-
the estimates of the planetary boundary layer (PBL) height       tional seasons (e.g., Giangrande et al., 2020). Moreover, one
(ARM, 2013a).                                                    cannot assume that convection (generic) is only dependent on
   Rainfall observations are collected by an automatic           nocturnal conditions. Thus, this study offers partial insights
weather station, with additional support from a nearby           into these themes, noting that expanding proposed analyses
surveillance radar to identify rainfall in the vicinity of the   into the previous day’s diurnal period increases the likeli-
site. The SIPAM (Amazonian Protection System) S-band             hood of lingering clouds and precipitation influencing these
(2.2 GHz) radar is a single polarization Doppler weather         efforts.
radar that performs a volume scan every 12 min, with a               Precipitation events are defined by using local weather sta-
2◦ beam width and radial (gate) resolution of 500 m. The         tion datasets at T3, as well as gridded SIPAM radar datasets
SIPAM radar is located in Manaus and has a 240 km ra-            (1 km horizontally gridded, 3 km level constant-altitude plan
dius coverage area. For spatial cloud field property analy-      position indicator (CAPPI)). The SIPAM datasets act as an
sis, the Geostationary Operational Environmental Satellite       areal constraint to include days where point and/or column
(GOES) 10.4 µm brightness temperature data acquired over         T3 observations may have miscategorized reasonable rain-
a 10◦ × 10◦ box centered on T3 were used to verify the oc-       fall events due to an unrepresentative or poor gauge mea-
currence of cold cloud tops to indicate the presence of pre-     surement. A 50 × 50 km area (similar to a typical GCM grid-
cipitating clouds around the studied region. GOES data were      box resolution) centered at the T3 site was adopted for these
received and processed operationally by CPTEC/INPE (Cen-         SIPAM checks, with gridded radar reflectivity factor values
tre for Weather Forecasting and Climate Research/National        greater than 25 dBZ considered to be “precipitation” echoes.
Institute for Space Research) (Costa et al., 2018).              For these checks, if more than 10 % of the area was covered
                                                                 by such SIPAM reflectivity values at any time during any
                                                                 given hour, or if the local weather station reported a rainfall
3   Classification of raining and non-raining events             accumulation greater than 1 mm during that same hour, the
                                                                 day was categorized as a rain (NR–RR) event.
Amazon convection typically initiates around noon, with the          For this study, the “wet” season has been defined as the pe-
associated precipitation peaking close to 14:00 LT (Adams        riod between January and April, and the “dry” season as the
et al., 2013; Machado et al., 2002; Tanaka et al., 2014). This   period between June and September (Giangrande et al., 2017;
study defines the previous day’s “nocturnal period” as the pe-   Machado et al., 2018). To ensure sufficient sampling, we
riod between 00:00 and 12:00 GMT (20:00 to 08:00 LT) and         included all of the available GoAmazon 2014/2015 record
the following day’s “diurnal period” as the period between       (2014 and 2015) in our analysis and did not attempt to differ-
12:00 and 00:00 GMT (08:00 to 20:00 LT). Thus, this def-         entiate year-to-year variability (e.g., Jiménez-Muñoz et al.,
inition of the diurnal period begins approximately 2 h after     2016). Following the definitions presented above, we iden-
the sunrise in Manacapuru, which consistently occurs around      tified 51 NR–NR cases and 113 NR–RR cases during the
06:00 LT throughout the year. To understand the controls on      wet season. The dry-season event breakdown was the re-
convective development for these daytime diurnal periods,        verse, with 148 NR–NR cases and 64 NR–RR cases. The
we categorize our Amazon observations into two classes:          cases were distributed throughout the campaign period as
(a) days having no rain during the nocturnal period and no       presented in Fig. 1. No obvious intra-seasonal variability
rain during the subsequent diurnal period; and (b) days hav-     is apparent from these distributions; however, the El Niño–
ing no rain during the nocturnal period but observing rain       Southern Oscillation (ENSO) event of 2015 is suggested
during this subsequent diurnal period. We refer to these tran-   (e.g., Jiménez-Muñoz et al., 2016), as represented by the

https://doi.org/10.5194/acp-21-6735-2021                                          Atmos. Chem. Phys., 21, 6735–6754, 2021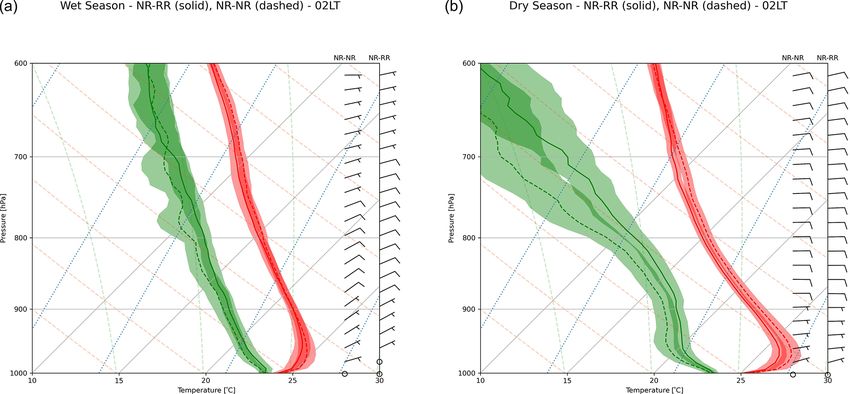
6738                                                     T. S. Biscaro et al.: Differences observed between wet and dry seasons

                                                                      (Adams et al., 2015). Note that most data for this effort were
                                                                      obtained over the same site (T3) that is located 10 km from
                                                                      the Solimões River and 25 km from the Rio Negro. Cumula-
                                                                      tive radar analyses (not shown) suggest that precipitation is
                                                                      enhanced southwest from the SIPAM radar during this cam-
                                                                      paign period, which may complicate any attempts to attribute
                                                                      select behavior to river proximity. To the best of the authors’
                                                                      knowledge, the site and its surroundings also did not suffer
                                                                      any deforestation or change in its surface coverage over the
                                                                      2-year period of our analysis. Overall, we define “local in-
                                                                      fluences” as influences within a few kilometers of the site,
                                                                      occurring in this area between the rivers, which may be rep-
                                                                      resented as occupying a typical GCM grid box.

                                                                      4     Results

                                                                      4.1     Results from local observations

                                                                      4.1.1    Low cloud diurnal cycle from cloud radar

                                                                      In Fig. 2, we display ARSCL-derived mean cloud fraction
                                                                      values. The plot presents the average fraction of time when
                                                                      clouds were observed over the site during each observation
                                                                      period for the various rain regime separations (e.g., various
                                                                      pairings for NR–NR and/or NR–RR modes under wet- and/or
                                                                      dry-season breakdowns). Our initial emphasis is on the lower
                                                                      portion of the atmosphere below the freezing level (approxi-
                                                                      mately 4.5 km above ground level; AGL), since we anticipate
                                                                      shallow clouds may play a pivotal role during non-raining
Figure 1. NR–NR and NR–RR case distributions during the wet           nocturnal periods. Here, residual cirrus clouds from the pre-
and dry seasons of 2014 and 2015. Day 0 is defined as 1 January for
                                                                      vious day’s deeper cumulus clouds (or advected into the do-
the wet season and 1 June for the dry season.
                                                                      main from a distance) are also anticipated; however, upper-
                                                                      level clouds of a similar frequency are ubiquitous for the T3
                                                                      location (e.g., Giangrande et al., 2020). In the bottom panels
larger number of NR–NR cases during the dry season of 2015            of Fig. 2, we plot the difference of the absolute cloud occur-
(Fig. 1d).                                                            rence between the various modes for the wet and dry seasons,
   While not the focus of this study, NR–RR days with an              respectively. The local time axes on these images have been
active Kelvin wave mode were only found associated with               extended to 12:00 LT to better illustrate the onset of convec-
7 % of our wet-season dataset (not shown; a classification of         tion (or lack thereof) in these composites.
Kelvin wave activity was kindly provided by Yolande Serra                 Consulting wet-season properties along the leftmost pan-
from the Joint Institute for the Study of the Atmosphere and          els, the NR–NR transition (Fig. 2a) reveals higher cloud cov-
Ocean – University of Washington). Additional discussion              erage during the overnight period than the NR–RR mode
on the relationships between Kelvin wave activity and deep            (Fig. 2b). The NR–NR mode features low-level (0–3 km)
convection over the central Amazon can be found in Serra et           cloud occurrences exceeding 20 % from 22:00 to 04:00 LT.
al. (2020). Similarly, possible river-breeze or other land con-       In addition, the NR–NR mode suggests an earlier onset for
trast influences in the rainfall distribution are expected, but       shallow clouds than the NR–RR transition days, and the
they are not considered in our analyses. For example, land-           near-surface occurrences exceed 20 % frequently in the time
breeze effects are known to enhance the nocturnal and early           between 00:00 and 04:00 LT. These near-surface shallow
morning rainfall in near-river areas (Cohen et al., 2014; Fitz-       clouds may be attributed to fog, frequently observed from
jarrald et al., 2008; Tanaka et al., 2014) and affect local low-      midnight to noon during the wet season (Anber et al., 2015;
level circulation in near-river areas (de Oliveira and Fitzjar-       Giangrande et al., 2020). From sunrise (around 06:00 LT) un-
rald, 1993). Moreover, the diurnal cycle of precipitable water        til 10:00 LT, the NR–RR mode also suggests low-level cloud
vapor near river areas are influenced by their location with          activity, possibly related to fog occurrence. During the late
respect to the dominant lower-tropospheric easterly winds             morning, the NR–NR mode indicates a high frequency of

Atmos. Chem. Phys., 21, 6735–6754, 2021                                                 https://doi.org/10.5194/acp-21-6735-2021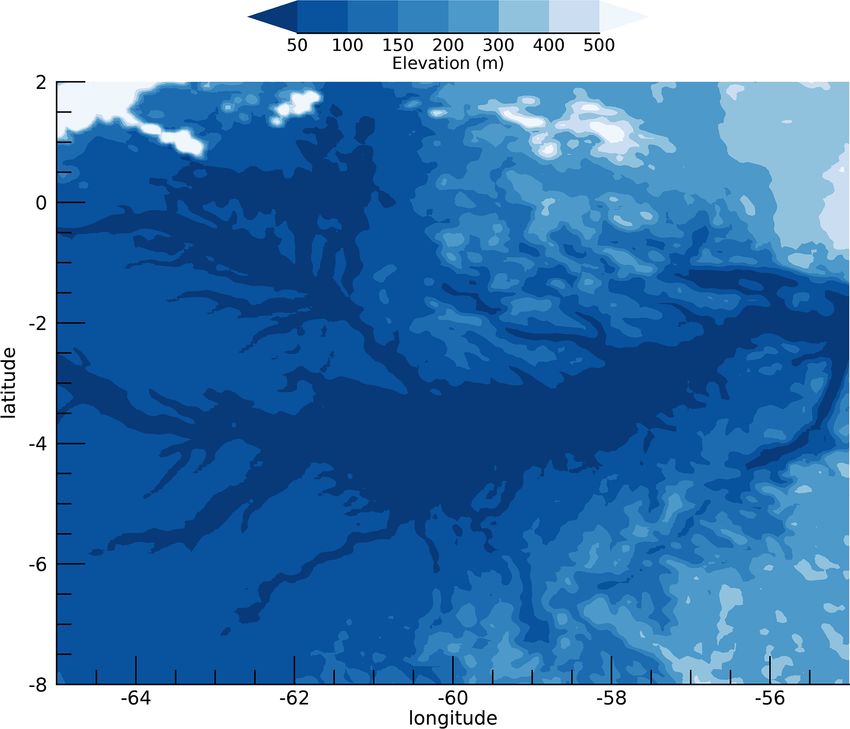
T. S. Biscaro et al.: Differences observed between wet and dry seasons                                                        6739

                                                                     sumption of CAPE. However, CAPE and CIN observations
                                                                     (subsequent sections to follow) indicate that these thermody-
                                                                     namic parameters are reduced for the NR–NR modes. In ad-
                                                                     dition, cloud coverage during early mornings (frequency over
                                                                     25 % observed between 06:00 and 07:00 LT near the surface
                                                                     and at 3 km AGL) would limit surface heating, e.g., through
                                                                     a reduction of downwelling solar radiation. Alternatively, an
                                                                     increase in downwelling solar radiation during the NR–RR
                                                                     mode associated with reduced cloud coverage generates sur-
                                                                     face heating that would favor subsequent daytime convective
                                                                     development. This behavior was discussed from an energy
                                                                     budget standpoint by Machado (2000), where it was shown
                                                                     that the surface loses more energy than it receives during con-
                                                                     vective events, and therefore reduced energy is available at
                                                                     the surface following a cloudy period. Using observations
                                                                     over the Amazon, Machado (2002) shows that the surface
                                                                     absorption of solar energy was always smaller (larger) than
                                                                     the total surface flux provided to the atmosphere throughout
                                                                     convective (non-convective) events. The quantity of energy
                                                                     stored at the surface seemed to be constrained, and it defines
Figure 2. Cloud occurrence and absolute differences between non-     a timescale during which the surface needs to export or re-
raining and raining transitions for wet and dry seasons. (a) Wet-    ceive energy to stabilize its deficit or gain of energy. Begin-
season NR–NR cloud fraction; (b) wet-season NR–RR cloud frac-        ning at 06:00 LT, the differences throughout the whole col-
tion; (c) wet-season cloud fraction difference between NR–NR and     umn (except close to surface between 06:00 and 07:00 LT)
NR–RR modes; (d) dry-season NR–NR cloud fraction; (e) dry-           favor the NR–RR mode.
season NR–RR cloud fraction; (f) dry-season cloud fraction differ-      The dry-season behavior in Fig. 2 suggests most of the
ence between NR–NR and NR–RR modes. Non-significant differ-          cloud activity during the nighttime window occurs at the
ences (areas where differences and their standard deviations over-   higher cloud levels (i.e., above 7 km), and this contrasts the
lap) are marked in white in panels (c) and (f).
                                                                     increased lower-level cloud coverage observed during the
                                                                     wet season (e.g., between 0 and 6 km). The NR–NR mode
                                                                     (Fig. 2d) suggests reduced cloud occurrence (e.g., frequency
shallow convection after 10:00 LT, with cloud occurrences            values less than 15 %) during the nighttime hours. The NR–
exceeding 45 % confined to a shallow layer around 1 km al-           RR cases (Fig. 2e) suggest increasing cloud coverage above
titude. During the transition to rainy NR–RR conditions, the         1 km and additional near-surface/low clouds after 08:00 LT,
1 km layer cloud coverage is generally lower compared to             again in contrast to the NR–NR modes that suggest low-
the NR–NR mode, where before 06:00 LT the NR–NR cloud                cloud occurrence of less than 5 %. The difference field for the
occurrence rarely exceeds 15 %. The shallow convective ac-           dry season (Fig. 2f) implies that the raining mode is predom-
tivity observed at sunrise is weaker in the NR–RR compos-            inantly cloudier than the NR–NR mode. During the noctur-
ites than found for the wet-season NR–NR mode, but after             nal period, the maximum difference in cloud occurrence lies
10:00 LT cloud occurrence exceeds 45 % and its 30 % con-             between an 8 % and 12 % increase in the favor of the NR–
tour height reaches 2.5 km. The absolute difference (Fig. 2c)        RR mode for the level between 2 and 4 km. Thus, dry-season
indicates that primarily in the time from 22:00 to 04:00 LT,         non-rain-to-rainy differences are reduced (in absolute value)
the non-raining NR–NR mode has higher cloud occurrence,              when compared to the wet-season behavior. A physical in-
particularly for clouds below 6 km. These differences are            terpretation of this dry-season behavior will be discussed in
approximately 20 % in occurrence and are also frequently             Sect. 4.2.
found at higher levels (around 10 km) between 20:00 and
22:00 LT. After 10:00 LT, the NR–RR mode shows the max-              4.1.2   Radiosonde analysis
imum negative cloud differences, reaching −20 %.
   One physical interpretation of these wet-season character-        In Fig. 3, we present statistics for the thermodynamic pa-
istics is that the higher cloud occurrence in the NR–NR mode         rameters CAPE and CIN using data derived from the noc-
during the nocturnal periods implies additional consumption          turnal (20:00, 02:00, and 08:00 LT) radiosondes launched at
of energy that might have been available for convection dur-         T3. The boxplots were constructed to display the minimum,
ing the following daytime period. A question is whether these        lower quartile, median, upper quartile, and maximum values.
nighttime clouds are formed by radiative cooling from the            For CAPE and CIN calculations, the traditional approach of
top of the boundary layer and thus not associated with con-          parcel theory was applied – water vapor phase changes only

https://doi.org/10.5194/acp-21-6735-2021                                              Atmos. Chem. Phys., 21, 6735–6754, 2021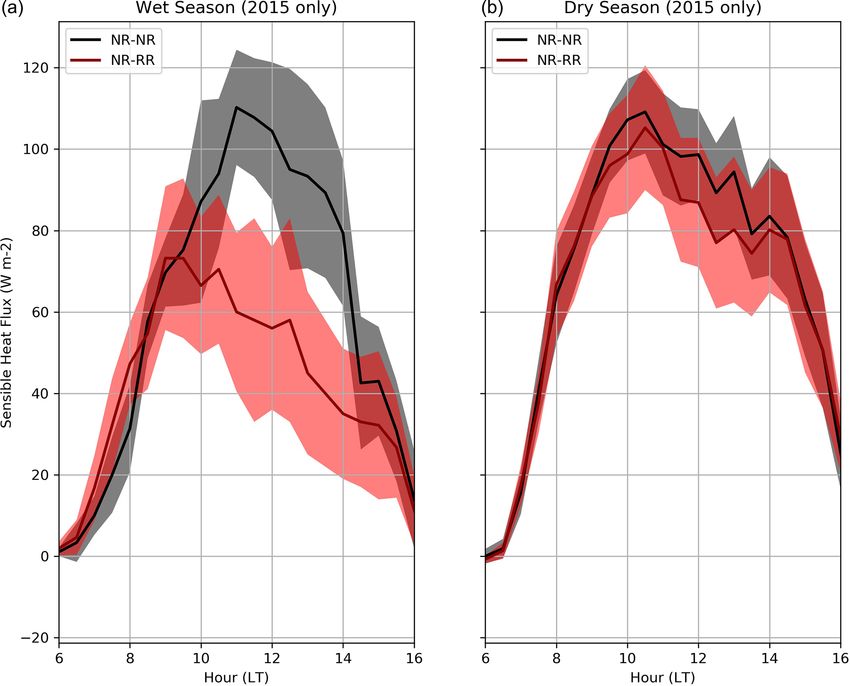
6740                                                   T. S. Biscaro et al.: Differences observed between wet and dry seasons

Figure 3. CAPE and CIN statistics derived with the radiosondes during the nocturnal period at T3 for dry and wet seasons and NR–NR and
NR–RR transitions. The boxes and whiskers represent the minimum (excluding possible outliers), the lower quartile, the median, the upper
quartile, and the maximum (excluding possible outliers).

and irreversible parcel ascent in a virtual potential tempera-        the surface heating and the increase of the surface temper-
ture framework (Bryan and Fritsch, 2002). By choosing the             ature after the sunrise. Elevated CAPE values are observed
maximum virtual temperature in the first 1000 m of the atmo-          for the NR–RR mode for the 02:00 and 08:00 LT radioson-
sphere, we define the level from which the parcels are lifted.        des when compared to the NR–NR mode composites. By
We expect that the calculations for CAPE and CIN thus rep-            20:00 LT (typically after daytime rainfall onset), the non-
resent the most buoyant parcel in the boundary layer. As pre-         raining mode still indicates the largest upper quartile value
viously introduced, the wet-season CAPE estimates (Fig. 3a)           and maximum CAPE values, albeit the medians are nearly
suggest a reduction of the potential energy from 20:00 to             identical between NR–RR and NR–RR modes.
02:00 LT during the NR–NR transition (gray boxes), whereas               The dry-season (Fig. 3b) plots indicate higher CAPE val-
the NR–RR mode CAPE estimates (blue boxes) are similar                ues for the morning (08:00 LT) radiosonde times compared
for these two times. Recall that a physical explanation for this      to the wet season. This behavior is physically consistent with
reduction in CAPE between the two first observations (20:00           the higher soil temperature (and overall reduced precipita-
and 02:00 LT) is convective cloud energy consumption, since           tion, surface moisture) observed during the dry season. The
a cloudier condition is observed between 22:00 and 02:00 LT           energy decrease in the NR–NR mode between 20:00 and
for these NR–NR transition events (see Fig. 2c). The NR–              02:00 LT is present, yet less pronounced than the decrease
NR CAPE at 20:00 LT is the highest magnitude/distribution             observed during the wet season. The NR–RR changes ob-
we observe, suggestive of an eventual increase of the cloud           served between 20:00 and 02:00 LT are subtle: a slight in-
coverage, which in turn consumes this energy, yet ultimately          crease of the upper quartile value and a decrease of the max-
decreases the CAPE by the measurements from the subse-                imum value. A physical explanation for the similarities be-
quent soundings. Between 02:00 and 08:00 LT, we observe               tween the 20:00 and 02:00 LT results, for both modes, and
an increase in the distributions for CAPE for NR–NR and               their differences in comparison with the wet-season results,
NR–RR modes. This increase is suggested to be a result of             is the reduced cloud coverage (overall). Moreover, reduced

Atmos. Chem. Phys., 21, 6735–6754, 2021                                                  https://doi.org/10.5194/acp-21-6735-2021
T. S. Biscaro et al.: Differences observed between wet and dry seasons 6741
Figure 4. Composite 02:00 LT radiosondes launched at T3: (a) wet season; (b) dry season. Solid lines are NR–RR data, and dashed lines are
NR–NR data. The red line is dry temperature and green the dew point temperature. Shaded areas represent 1 standard deviation.
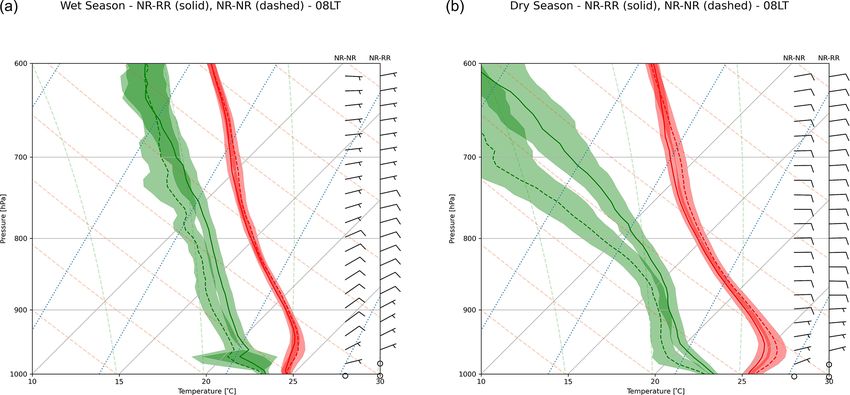
Figure 5. Same as Fig. 4 but for the 08:00 LT radiosondes.
or less favorable cloud coverage, as found during the dry implies a higher probability of deep/precipitating convection
season, implies a lower convective activity overall. The wet- during the afternoon.
season CIN (Fig. 3c) shows that the convective inhibition A Student’s t test was applied to the radiosonde
is less intense than those observed during the dry season CAPE/CIN dataset. These tests suggest that the differences
(Fig. 3d) for all times and transitions. For both seasons, the between the modes were significant at the p = 0.05 level for
largest inhibitions are displayed during the 02:00 LT sound- the 02:00 and 08:00 LT results above. However, the 20:00 LT
ing for the NR–NR mode. Between 02:00 and 08:00 LT, CIN observations were not found to meet these significance crite-
reduction observed in both seasons for the NR–RR mode ria. These statements cover both the CAPE and CIN behavior
and the behavior for wet and dry seasons. Overall, less con-
https://doi.org/10.5194/acp-21-6735-2021 Atmos. Chem. Phys., 21, 6735–6754, 2021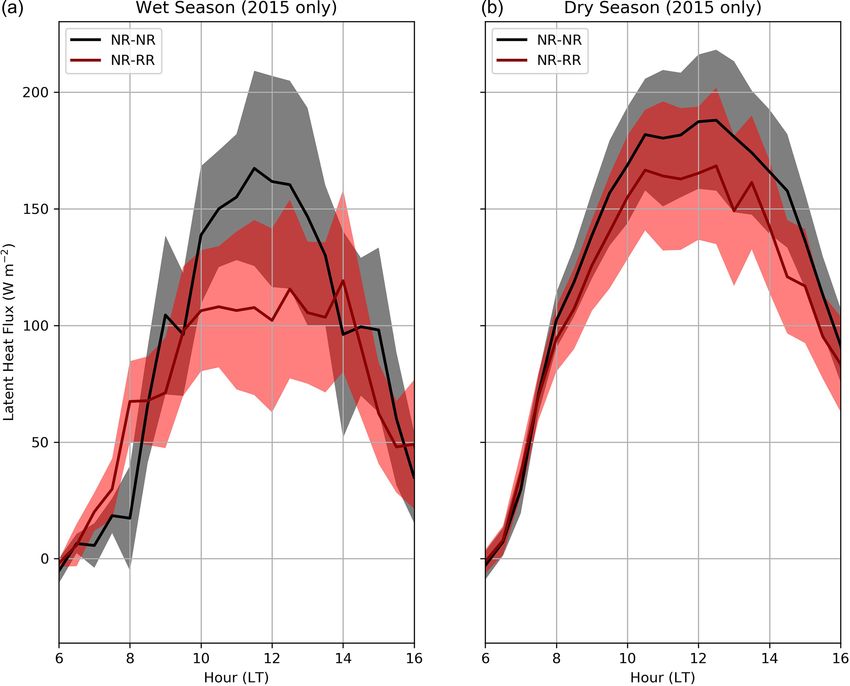
6742                                                T. S. Biscaro et al.: Differences observed between wet and dry seasons

Figure 6. Mean (composite dataset) latent heat fluxes measured by ECOR for dry and wet seasons and NR–NR and NR–RR transitions.
Shaded areas represent 1 standard deviation.

clusive findings may be somewhat expected, but these prop-        4.1.3   Sensible and latent heat flux analysis
erties are presented to demonstrate a strong consistency with
behavior discussed for the NR–NR versus NR–RR modes.              Cloud coverage directly impacts the incoming solar radia-
   Composite radiosonde profiles are presented in Fig. 4          tion by changing the Earth-system albedo. A greater (lower)
(02:00 LT composite) and Fig. 5 (08:00 LT composite). Left        cloud coverage will generally result in less (more) incident
panels indicate wet-season observations, solid lines are NR–      solar radiation reaching the surface, altering the sensible and
RR data, and dashed lines are NR–NR data. As expected,            latent heat flux balance. As the surface heats up, thermally
the dry-season composites are much drier at most levels           induced turbulence is produced, via convection. As shown in
than those from the wet season. One feature that is ap-           Fig. 2, the wet-season NR–RR mode suggests lower cloud
parent in these composites is higher temperatures close to        occurrences up to 1 h after the sunrise, when the magnitude
the surface in the 02:00 LT data than those observed in the       of both sensible and latent heat fluxes begins to grow. To ex-
08:00 LT sounding, corroborating the surface temperature          amine the relationships between cloud coverage and surface
observations (not shown) that indicated higher temperatures       fluxes, we present the mean latent heat flux and the mean
from 02:00 LT to 08:00 LT. The dry-season temperature pro-        sensible heat flux measured by the ECOR system in Figs. 6
files present subtle differences between NR–RR and NR–NR          and 7. Since ECOR did not operate during 2014, only 2015
modes, though these temperature profiles are nearly identical     data are available for this analysis.
for the wet-season composites. Rain/no-rain differences in           During the dry season (Figs. 6 and 7, right panels) both
the dew point temperature profiles are more pronounced than       the sensible and latent heat fluxes have similar values during
those observed in the temperature profiles (especially during     NR–NR and NR–RR modes, with mean behavior often su-
the dry season). There is evidence that dry-season precipita-     perimposed during boundary layer growth. However, in the
tion is linked to larger-scale moisture advection, as we will     wet season, the latent and sensible heat fluxes (Figs. 6 and 7,
discuss in Sect. 4.1.5.                                           left panels) present different characteristics during the NR–
                                                                  NR and NR–RR modes. We observe higher flux values dur-
                                                                  ing the NR–RR modes up to 08:00 LT. After 08:00 LT, with
                                                                  the onset of precipitation, temperature decreases and the dif-

Atmos. Chem. Phys., 21, 6735–6754, 2021                                            https://doi.org/10.5194/acp-21-6735-2021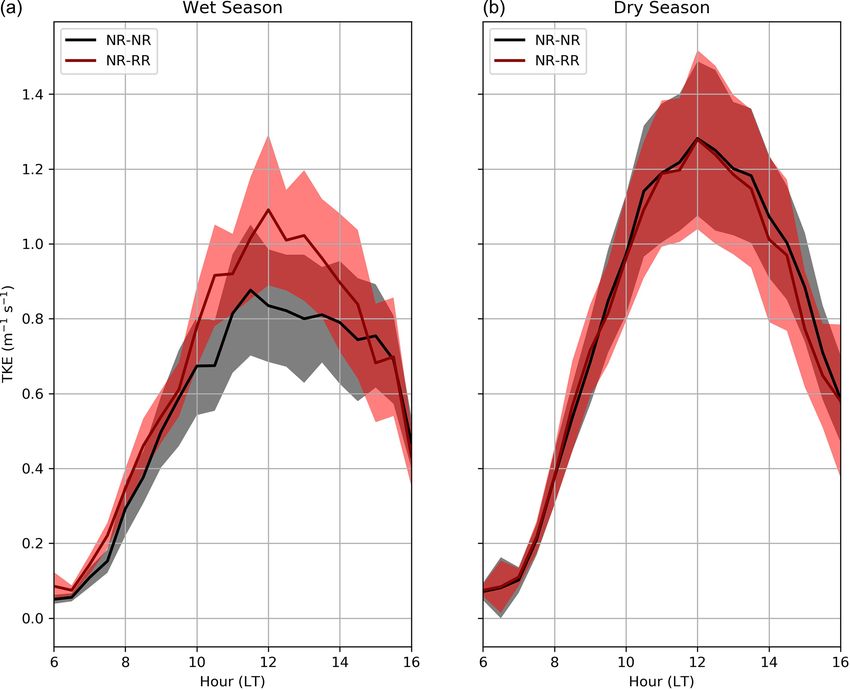
T. S. Biscaro et al.: Differences observed between wet and dry seasons                                                      6743

Figure 7. Mean (composite dataset) sensible heat fluxes measured by ECOR for dry and wet seasons and NR–NR and NR–RR transitions.
Shaded areas represent 1 standard deviation.

ferences between the NR–RR and NR–NR fluxes become                 surface relative humidity and the lifting condensation level,
negative. The flux analysis seems to corroborate the local         is tightly coupled in the diurnal convective boundary layer
cloud occurrence results (e.g., Fig. 2). This is argued since      over the Amazon (Betts et al., 2006). The composite dataset
the dry-season fluxes are statistically the same (when look-       PBL height variability for the various modes and seasons as
ing at low cloud occurrence differences), while during the         estimated using ceilometer is plotted in Fig. 8. PBL height
wet season, the NR–NR fluxes are lower and associated with         is derived from the gradient in the aerosol backscatter profile
additional cloud coverage, reducing the incoming solar radi-       (not from cloud detections but the DOE ARM “value-added
ation and therefore surface heating (in comparison with the        product” CEILPBLHT, e.g., ARM, 2013a). It is important to
NR–RR mode). This analysis also indicates the role of the          note that there is a cloud/precipitation filter associated with
surface moisture in the PBL development, since higher soil         this product. This is different than radiosonde-based prod-
moisture in the wet season may lower the Bowen ratio, thus         ucts that may associate PBL with lifting condensation level
lowering the PBL compared to the dry season, as also dis-          (LCL) (e.g., Thomas et al., 2018).
cussed in the next sections.                                          As already demonstrated in previous studies (e.g., Betts
                                                                   et al., 2002, 2013), the wet season, as the season with the
4.1.4   Planetary boundary layer analysis                          most convective precipitation activity overall, has lower PBL
                                                                   heights compared to the dry season. As shown in Fig. 8,
The PBL over the Amazon was the subject of study for               the observed PBL heights during the dry season are higher
several previous field campaigns, including the Amazon             than estimated during the wet season, noting that even the
Boundary-Layer Experiment (ABLE2a and ABLE2b; Har-                 precipitating NR–RR mode of the dry season is associated
riss et al., 1988; Garstang et al., 1990) and the Large Scale      with a higher PBL than the wet-season non-precipitating
Biosphere-Atmosphere Experiment (LBA; Silva Dias et al.,           NR–NR mode. During the wet season, the distinction be-
2002). Studies such as Martin et al. (1988) and Fisch et           tween the NR–NR and NR–RR transitions begins to appear
al. (2004) described the characteristics and evolution of the      at 08:00 LT. The diurnal maximum in PBL height (approxi-
PBL over the Amazon during these experiments. The depth            mately 1000 m) is reached around local noon for the NR–RR
of the mixed layer below cloud base, as well as the near-          transition, whereas the NR–NR maximum is 500 m higher

https://doi.org/10.5194/acp-21-6735-2021                                            Atmos. Chem. Phys., 21, 6735–6754, 2021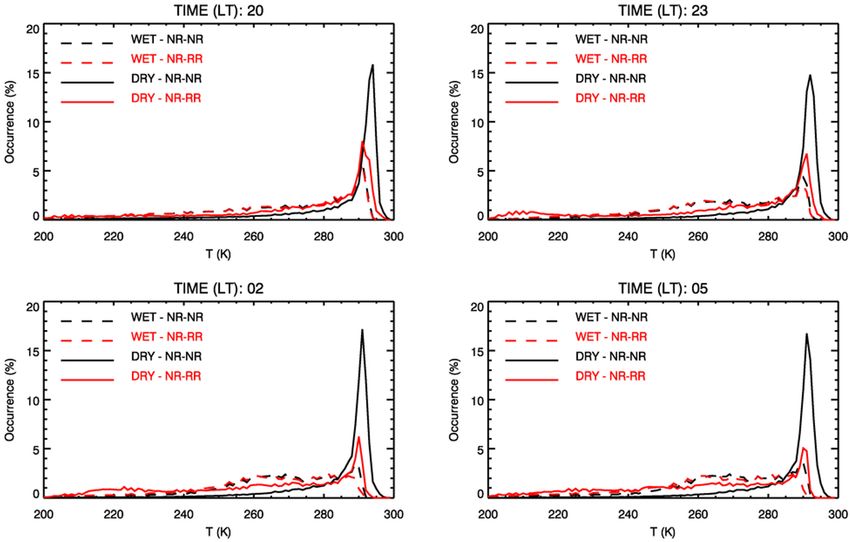
6744                                                  T. S. Biscaro et al.: Differences observed between wet and dry seasons

Figure 8. Planetary boundary layer mean (composite dataset) height derived with the ceilometer for dry and wet seasons and NR–NR and
NR–RR transitions. Shaded areas represent 1 standard deviation.

and attained 2 h later. Both of these height and time dif-
ferences can be explained physically by the more frequent
convective development that occurs during the wet season.
With moisture freely available during the wet season, any
conditional instability that favors cloud development such as
surface heating or local instabilities can trigger convection,
thus lowering the PBL height. For example, Carneiro (2018)
and Carneiro et al. (2020), using observational data from
ceilometer, lidar, and large eddy simulations (LESs) showed
that the erosion of the nocturnal boundary layer occurs 2 h af-
ter the sunrise during the dry season and 3 h after the sunrise
during the wet season.
   The normalized hourly rainfall occurrence distribution
(Fig. 9) suggests that the precipitation occurrences are dis-
tributed over the daytime window during the wet season,
while the dry-season distribution indicates a distinct peak
around noon. The seasonal differences between the diurnal           Figure 9. Normalized hourly rainfall occurrence distribution ob-
                                                                    served over T3 for the wet and dry seasons (NR–RR days only).
cycles of the rainfall occurrence may help explain the con-
trasts observed between the PBL heights. In the dry season,
one-third of the rainfall occurrences are observed between
12:00 and 14:00 LT, which corresponds to the time when the             The ECOR-derived turbulent kinetic energy (TKE) prop-
NR–RR and NR–NR PBL heights begin to present a more                 erties are presented in Fig. 10. TKE was measured at 3 m
prominent difference, in contrast with the wet season, where        from surface. Note that TKE observations from aircraft were
the PBL heights are different from 08:00 LT.                        available during the campaign (Martin et al., 2016; Wendisch
                                                                    et al., 2016); however, these observations were scarce (less
                                                                    than 20 flights per intensive operation period; IOP) and not

Atmos. Chem. Phys., 21, 6735–6754, 2021                                               https://doi.org/10.5194/acp-21-6735-2021
T. S. Biscaro et al.: Differences observed between wet and dry seasons 6745 Figure 10. Mean (composite dataset) turbulent kinetic energy derived with ECOR for dry and wet seasons and NR–NR and NR–RR transi- tions. Shaded areas represent 1 standard deviation. sufficient for a statistical analysis. TKE is derived using the during rain cell events. Oppositely, the dry-season TKE is variances of the u, v, and w wind components provided by similar for both the NR–NR and NR–RR modes. The sim- the sonic anemometer which is part of the ECOR system. ilar magnitudes may be an indication of drier soil condi- We did not discard data due to synoptic conditions; hence, tions, overall absence of shallow clouds, higher temperatures all good-quality flagged data were included in the analy- during both modes, or some combinations therein to be dis- sis. There is additional information on the ARM ECOR lo- cussed below. Nevertheless, during the wet season, these dif- cated at https://www.arm.gov/capabilities/instruments/ecor, ferences are suggestive of the importance of local cloud pro- last access: 29 April 2021 and within the instrument cesses in the subsequent rainfall events. handbook at https://www.arm.gov/publications/tech_reports/ Finally, surface temperature also plays an important role handbooks/ecor_handbook.pdf, last access: 29 April 2021. on the TKE, since higher surface temperatures will increase The TKE estimates show that the dry season generally has thermal turbulence and near-surface wind speed (Jacobson, higher values of TKE than the wet season, with minor dif- 2005). For the TKE behavior that we plot (Fig. 10), we ob- ferences observed between the modes. However, clear dif- serve that TKE is lower during the wet season, for both ferences between the wet-season modes are observed, with modes, which can be a response to the lower temperatures the NR–RR mode having the higher values of TKE, reach- observed in this period (Fig. 11). The wet-season temper- ing 1.2 m−2 s−2 around local noon. The NR–NR and NR–RR atures (Fig. 11b) show larger differences between NR–NR wet-season curves show significantly different values after and NR–RR modes beginning at 12:00 LT, arguably due to 10:00 LT, indicating a more turbulent low-level atmosphere surface evaporative cooling caused by rainfall onset near in the presence of rain during the wet season. Moreover, dur- 08:00 LT. Dry-season temperatures (Fig. 11a) are similar for ing the wet season, the raining NR–RR mode has higher TKE both modes, which is an indication that the temperature does values overall. Before the onset of convection, this behavior not change as much during rain events in comparison with may be physically related to larger surface heat fluxes (pre- the wet season. This offers one explanation for the similarity sented in Figs. 4 and 5, right panels) from 06:00 to 09:00 LT. between NR–NR and NR–RR dry-season TKE curves. Also In the presence of rain, the larger TKE values may be ex- during the dry season, one might anticipate a drier soil (re- plained by turbulence generated by stronger winds observed sulting in higher Bowen ratios), and a drier boundary layer https://doi.org/10.5194/acp-21-6735-2021 Atmos. Chem. Phys., 21, 6735–6754, 2021
6746 T. S. Biscaro et al.: Differences observed between wet and dry seasons
Figure 11. Mean (composite dataset) soil temperature as measured by SEBS for dry and wet seasons and NR–NR and NR–RR transitions.
Shaded areas represent 1 standard deviation.
(fewer clouds), implying in a stronger generation of turbu- by Lintner et al. (2017) shows that the water vapor profile is
lent boundary layer growth (Giangrande et al., 2020; Jones associated with precipitation, and the models examined are
and Brusnell, 2009). typically too dry compared to mean radiosonde profiles, es-
pecially during the dry season. Also, Henkes et al. (2021)
4.1.5 Local observations – summary show that the timing of the morning transition of the noc-
turnal boundary layer may have an impact on the shallow-
The results presented in the previous subsections indicate to-deep transition. Here, we did not find evidence of local
that the precipitation onset in the dry season is weakly interactions being responsible for dry-season diurnal precip-
associated with local factors. However, the local ARM itation. However, an additional focus will be devoted to po-
site observations presented – cloud fraction, surface heat tential large-scale to mesoscale cloud analyses and controls
fluxes, CAPE/CIN, PBL characteristics, surface tempera- in the next section.
tures, and turbulence – show distinct differences between
non-raining and raining transitions during the wet season, 4.2 Large-scale to mesoscale analysis
with CAPE/CIN having a more significant difference be-
tween raining and non-raining modes during the dry sea- To further investigate the influences of local effects versus
son. Also, the following features are suggested as potential the influence of the macro- and mesoscale (meso-α; Orlan-
controls: soil temperature and TKE present the same NR– ski, 1975) cloud patterns from the nocturnal period on the
NR/NR–RR difference characteristics, as well as PBL height subsequent rain transitions, we calculated the mean field of
and rainfall, surface fluxes, and cloud coverage. Although the the GOES 10.4 µm brightness temperatures observed over a
dry-season analysis suggests similar characteristics between 10◦ × 10◦ box centered at T3 during the nocturnal period.
raining and non-rain modes, Ghate and Kollias (2016) state In addition, we calculated the cumulative distribution func-
that during the dry season, local land–atmosphere interac- tion (CDF) and the probability distribution function (PDF)
tions may trigger the transition from shallow to deeper con- of these brightness temperatures, grouped in 3 h intervals
vection and indicate a relationship between large-scale mois- and separated by transition type and season. Mean bright-
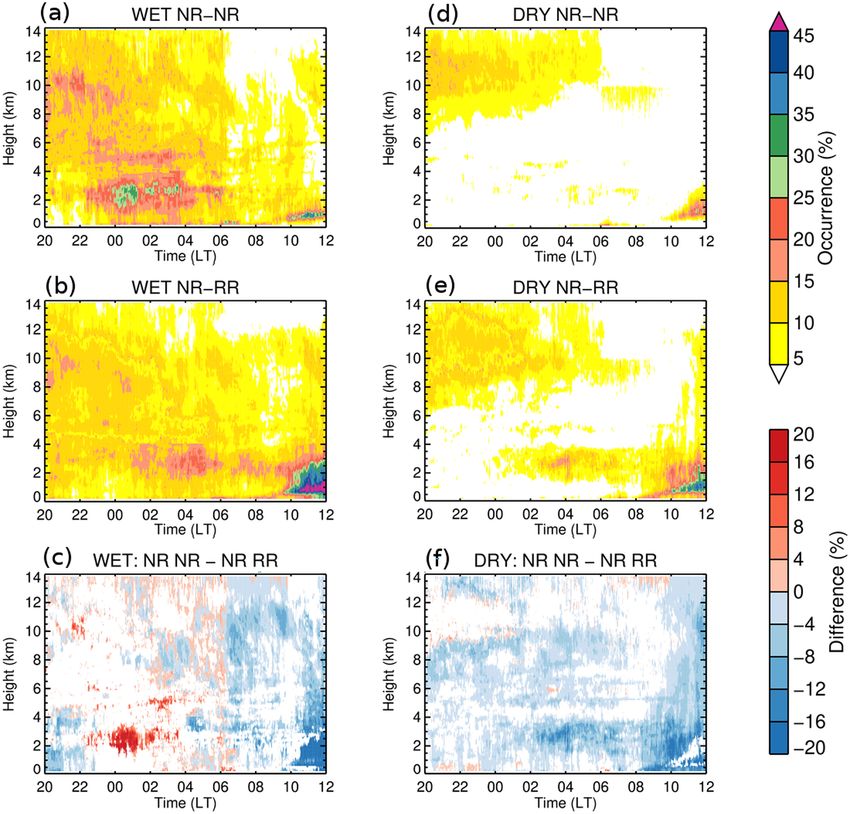
ture advection and precipitation. A model comparison study ness temperature fields during the nocturnal period (20:00 to
Atmos. Chem. Phys., 21, 6735–6754, 2021 https://doi.org/10.5194/acp-21-6735-2021T. S. Biscaro et al.: Differences observed between wet and dry seasons 6747 Figure 12. Mean GOES 10.4 µm brightness temperature fields and absolute differences from 20:00 to 08:00 LT for dry and wet seasons and NR–NR and NR–RR transitions. The cross marks the T3 position. Non-significant differences (areas where differences and their standard deviations overlap) are marked in white. 08:00 LT) observed over a 10◦ × 10◦ box centered at T3 (the NR–NR and NR–RR modes are not statistically significant cross in each panel) are presented in Fig. 12. These are pro- (Fig. 12c). This is because these differences among the two vided for the NR–NR and NR–RR modes (top and middle transition modes in the wet season are related to the terrain. panels), and for wet- and dry-season breakdowns (left and The regions in the north and southwest of the domain, where right columns, respectively), with absolute differences pre- the main differences are most prevalent, are areas where the sented on the bottom panel. Overall, similar differences (to dominant wind flow (from northeast) results in clouds be- the ARSCL properties in Fig. 2) in convective activity be- ing lifted over areas where the terrain elevation increases tween NR–NR and NR–RR transitions during wet and dry (Fig. 13). seasons are found when switching to these spatial cloud field Specific to the dry-season properties, the NR–NR transi- representations. For example, convection is more intense dur- tion (Fig. 12d) is associated with warmer temperatures com- ing the wet season (Fig. 12a and b), and it is observed over pared to the wet season, with values greater than 280 K occu- the entire domain. Specific to the wet season, temperatures pying almost all the observed region. The dry-season NR–RR below 275 K can be observed in more than 90 % of the region transition (Fig. 12e) suggests colder temperatures, 5 to 10 K for both raining and non-raining transition types. Note that lower than the NR–NR transition overall. Approximately approximately 81 % of the differences suggested between 72 % of the temperature differences between the non-raining https://doi.org/10.5194/acp-21-6735-2021 Atmos. Chem. Phys., 21, 6735–6754, 2021
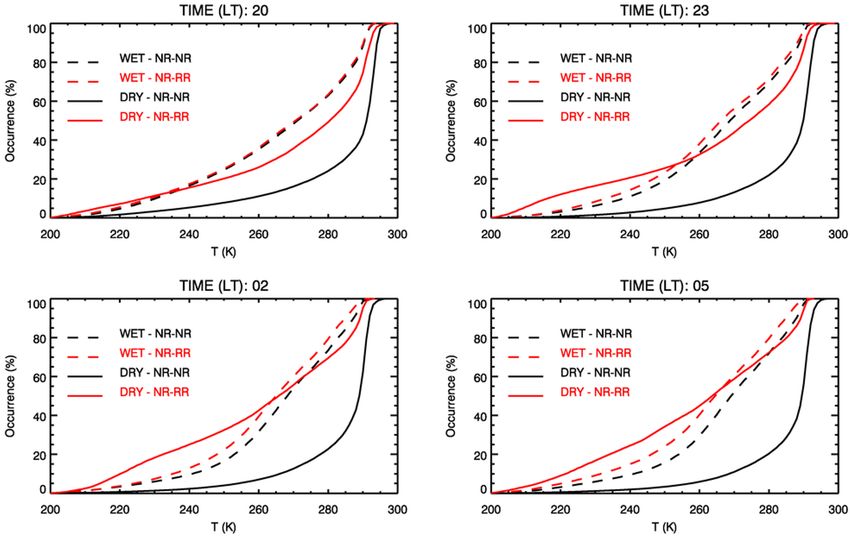
6748                                                      T. S. Biscaro et al.: Differences observed between wet and dry seasons

                                                                       the NR–RR transitions (red lines) is often reached around
                                                                       250 K, whereas for the NR–NR transitions (black lines), the
                                                                       Q1 value resides around 280 K. The NR–NR CDFs are very
                                                                       similar for all time intervals during the dry season, but the
                                                                       NR–RR CDFs change with the time, and the differences be-
                                                                       tween them increase as time passes. The dry-season NR–RR
                                                                       curves also suggest colder values than the wet-season curves
                                                                       from 23:00 LT onwards, which implies that when precipitat-
                                                                       ing convection happens during the dry season, these clouds
                                                                       tend to be stronger/deeper than those in the wet season. This
                                                                       finding for intense dry-season convection is consistent with
                                                                       several previous studies (e.g., Itterly et al., 2016; Tanaka et
                                                                       al., 2014). Overall, the difference between the wet and dry
                                                                       seasons and the results presented in Sect. 4.1 (with local ob-
                                                                       servations) suggest that for the dry season, precipitation is
                                                                       controlled directly by large-scale to mesoscale circulation,
                                                                       whereas local effects are less important. In contrast, the wet
                                                                       season suggests that local processes are more of the domi-
Figure 13. Terrain elevation for the large-scale to mesoscale analy-   nant factor in the nighttime hours preceding the next days’
sis domain.                                                            diurnal rainfall.

and raining mode are found between 8 and 20 K (Fig. 12f).              5   Conclusions
This feature strongly suggests that the large-scale cloud con-
ditions during the dry season are very different between rain-         In this paper, we present an alternative approach on how to
ing and non-raining days.                                              visualize the potential controls on the daytime diurnal cy-
   In Fig. 14, we present the PDF of the GOES-13 10.4 µm               cle of precipitation by isolating nighttime, previous-day in-
brightness temperatures grouped into 3 h time steps over the           fluences on convection in the central Amazon. Our analysis
nocturnal period. This breakdown helps diagram the evolu-              is based on a starting hypothesis that nighttime cloudiness
tion of the convective systems around the T3 site and iden-            delays surface solar heating on the following day during the
tify the differences found between the seasons and transitions         wet season; this contrasts with the dry season that suggests a
therein. All distributions plotted in Fig. 14 are left-skewed          smaller cloud coverage during those periods. We break down
unimodal distributions, with peaks between 285 and 295 K.              our results based on season – wet and dry – and two modes
Wet-season distributions (dashed lines, both modes) are simi-          of transition: non-raining evenings to non-raining days and
lar for both transition modes and for all time intervals consid-       non-raining evenings to raining days. These results suggest
ered. Values observed for the wet season are generally lower           that during the wet season, several local influences are key
(colder cloud tops) than those observed in the dry season, in-         drivers of rainfall occurrence over this region. During the dry
dicating stronger convective activity throughout the domain            season, mesoscale to large-scale factors appear to be more
independent of transition type or time interval. Dry-season            important and dominate the development of the precipitation.
distributions (solid lines, both modes) are quite different dur-       Moreover, precipitating cloud development is suggested to
ing NR–NR (black lines) and NR–RR (red lines) events, with             be associated with moisture availability and boundary layer
a larger incidence of higher values (e.g., warmer tempera-             vertical motions or turbulence. We propose that during the
tures or absence of higher clouds) during NR–NR transitions.           wet season, when moisture levels observed are higher, cloud
   The wet-season mean cloud field similarities are better il-         development is a direct effect of the locally forced vertical
lustrated in CDF formats (e.g., Fig. 15), where these CDFs             motions. During the dry season, with moisture being less
indicate that the wet-season mean cloud field does not change          available and most of the incident solar radiation being con-
as much as the dry-season distributions during the overnight           verted to sensible heating, precipitating clouds are driven by
window, regardless of the precipitation observed during the            large-scale to mesoscale circulation.
subsequent day. In other words, the wet-season large-scale                The results presented here indicate that during the wet sea-
to mesoscale mean convective characteristics have approx-              son, the diurnal precipitation is modulated by the cloud cov-
imately the same characteristics for both transition modes,            erage during overnight hours. Since cloud development is as-
and the development of precipitating clouds observed at T3             sociated with vertical motion and moisture availability, and
during the wet season appears to be influenced mostly by               since during the wet season moisture is freely available, we
local factors. In contrast, the dry-season distributions (solid        speculate that the local-scale, nocturnal, vertical motion is
lines) are quite different: the lower quartile (Q1 ) value of          responsible for the cloud development. Therefore, the wet-

Atmos. Chem. Phys., 21, 6735–6754, 2021                                                  https://doi.org/10.5194/acp-21-6735-2021
T. S. Biscaro et al.: Differences observed between wet and dry seasons 6749 Figure 14. Probability distributions (grouped in 3 h groups) of GOES 10.4 µm brightness temperatures for dry and wet seasons and NR–NR and NR–RR transitions during the nighttime period. The time at each panel is the start time (LT). Figure 15. Cumulative distribution functions (grouped in 3 h groups) of GOES 10.4 µm brightness temperatures for dry and wet seasons and NR–NR and NR–RR transitions during the nighttime period. The time at each panel is the start time (LT). https://doi.org/10.5194/acp-21-6735-2021 Atmos. Chem. Phys., 21, 6735–6754, 2021
6750                                                   T. S. Biscaro et al.: Differences observed between wet and dry seasons

season NR–RR transition has a weaker upward vertical mo-            observed in the wet season, indicating that rainfall modula-
tion during the night (from 22:00 to 04:00 LT) and immedi-          tion during the wet season is less affected by the large-scale
ately following the sunrise (from 06:00 to 07:00 LT), reduc-        cloud background.
ing cloud formation during the first hours of the morning.             In summary, these results highlight the complexity of the
This physical pathway allows the surface to receive more            Amazon, specifically that models and parameterizations may
solar energy, favoring instability. These arguments are sup-        consider different formulations based on the seasonal cycle
ported by the soil temperature and turbulent kinetic energy         to correctly resolve the precipitating convection over cen-
observations during the diurnal period. Since there is ample        tral Amazon. A convective parameterization scheme using
moisture available in the Amazon basin, we hypothesize that         only local or small-scale interactions could give poor results
heating is transformed into latent heating, building convec-        during the dry season based on our findings. On the other
tive cells that will precipitate later during the day.              hand, larger mass-flux convergence approaches will not per-
   However, in the wet-season NR–NR mode, nights with               form well during the wet season, triggering precipitation at
dominant shallow convection will reduce convection during           the wrong times or quantifying it erroneously. Parameteriza-
the day, because the clouds formed during the night will re-        tion schemes must consider seasonal differences in their for-
duce solar radiation at the surface during the first hours of the   mulation, as noted by several studies (D’Andrea et al., 2014;
day. Similarly, during the wet season, a clear distinction dur-     Grabowski et al., 2006; Guichard et al., 2004 and references
ing the night is observed between the NR–NR and NR–RR               therein), and unified PBL–shallow convection–deep convec-
days, but for the dry season no significant signal is observed.     tion parametrization schemes seem to offer the better option
This implies that the local processes are not the key mech-         to correct representation of the rainfall diurnal cycle.
anism controlling the transition from shallow convection to
rainfall during the months from June to September. Previ-
ous studies (D’Almeida et al., 2007; Khanna et al., 2018;           Data availability. All ARM datasets used for this study can be
Lawrence and Vandecar, 2014) show that contrasts in land            downloaded at http://www.arm.gov (ARM, 2013a, b; ARM, 2014a,
occupation (e.g., forest and pasture, forest and deforested         b) and are associated with several “value-added” product streams.
areas) have more impact on atmospheric and hydrological
properties (PBL development, precipitation, etc.) during the
dry season. These studies were performed measuring surface          Author contributions. TSB was responsible for the formal analysis,
                                                                    investigation, preparation of the original draft, and data curation.
and atmospheric properties over different surfaces, showing
                                                                    LATM was responsible for funding acquisition, conceptualization,
that land occupation contrasts cause local circulations that        and review and editing. SEG and MPJ were responsible for data
can trigger convection and rainfall more often in the dry sea-      curation and review and editing.
son. Here, we do not verify such land occupation contrasts,
since all of our data were obtained over the same site (T3),
and the site and its surroundings did not suffer any deforesta-     Competing interests. The authors declare that they have no conflict
tion or change in its surface coverage over the 2-year period       of interest.
of our analysis.
   Our PBL analysis indicates that thermal turbulence does
not play a major role on cloud formation during the dry sea-        Acknowledgements. We acknowledge FAPESP (São Paulo Re-
son – there are no distinguishable differences between the          search Foundation) projects (2009/15235-8 and 2015/14497-0).
NR–NR and the NR–RR transitions. Alternatively, the dis-            This paper has been authored by employees of Brookhaven Sci-
tinction between the transitions is clear during the wet season     ence Associates, LLC, under contract no DE-SC0012704 with the
– both the turbulent kinetic energy and PBL heights have dif-       US Department of Energy (DOE). The publisher, by accepting the
ferent values between raining and non-raining modes. TKE            paper for publication, acknowledges that the United States Gov-
                                                                    ernment retains a nonexclusive, paid-up, irrevocable, worldwide li-
observations are corroborated by the soil temperature mea-
                                                                    cense to publish or reproduce the published form of this paper, or
surements, showing a connection between seasonal and rain-
                                                                    allow others to do so, for United States Government purposes. We
induced temperature differences and TKE observed.                   also acknowledge the Atmospheric Radiation Measurement (ARM)
   In addition, the satellite data analysis suggests that during    Climate Research Facility, a user facility of the US DOE, Office of
the dry season, precipitation is observed at T3 during days         Science, sponsored by the Office of Biological and Environmen-
where cloud activity is seen throughout the region during           tal Research, and support from the ASR program of that office.
the overnight hours. This implies a large-scale to mesoscale        We would like to thank SIPAM for providing the S-band radar
modulation in the convection during this season. There is a         data. The manuscript was greatly improved by suggestions from
clear difference in the PDFs and CDFs between the raining           David R. Fitzjarrald (Atmospheric Sciences Research Center, UAl-
modes. However, wet-season brightness temperature distri-           bany, SUNY), David K. Adams (Centro de Ciencias de la Atmós-
butions are similar for NR–NR and NR–RR transitions. Sta-           fera, Universidad Nacional Autónoma de México), and one anony-
                                                                    mous reviewer.
tistically significant differences between NR–NR and NR–
RR modes during the wet season are less frequent than those

Atmos. Chem. Phys., 21, 6735–6754, 2021                                                https://doi.org/10.5194/acp-21-6735-2021
You can also read