CLOUD AND WEATHER SYMBOLS IN THE HISTORIC LANGUAGE OF WEATHER MAP PLOTTERS
←
→
Page content transcription
If your browser does not render page correctly, please read the page content below
NOTE:
Abstract and supplement are at the end of this pdf.
Adaption of this article is in the January 2020 print edition of BAMS

                   CLOUD AND WEATHER
                       SYMBOLS IN THE
                   HISTORIC LANGUAGE OF
                   WEATHER MAP PLOTTERS
                                          Robert A. Houze Jr. and Rebecca Houze

              The traditional cloud and weather symbols used in weather mapping have a history deeply
                rooted in developments in art, science, technology, and international communication.

        H
             ave you ever wondered about the symbols on the
             AMS ties, scarves, and umbrellas (Fig. 1)? These
             little designs, somewhat reminiscent of cattle
        brands, may now seem enigmatic. But during the first
        50–75 years of the twentieth century they were im-
        portant as a shorthand way of indicating the state of
        the weather and sky seen by an observer at a weather
        station. Before today’s communication technology
        and automation, skilled technicians plotted observa-
        tions on weather maps by hand. The staffs of working
        weather stations in the early to mid-twentieth century
        included plotters, and these hardworking people were
        an important part of meteorological practice. During
        those years, meteorology was distinctly layered into
        four fundamental functions: 1) Observers would
        read instruments measuring temperature, pressure,
        humidity, and wind. In addition, they would note
        down qualitative information, namely, the weather
        phenomena occurring at the station and the state of
        the sky overhead. They would code this information
        and send it out over telegraph or Teletype so that
        every weather station would know the conditions at
        every other weather station over some large portion of
        Earth. 2) Plotters at a station, or sometimes at a central
        location, would receive the coded observations, de-          F ig . 1. Tie and scarf available from the American
        code them, and plot every station’s observations on a        Meteorological Society merchandise catalog.

        AMERICAN METEOROLOGICAL SOCIETY                                                         DECEMBER 2019      | ES423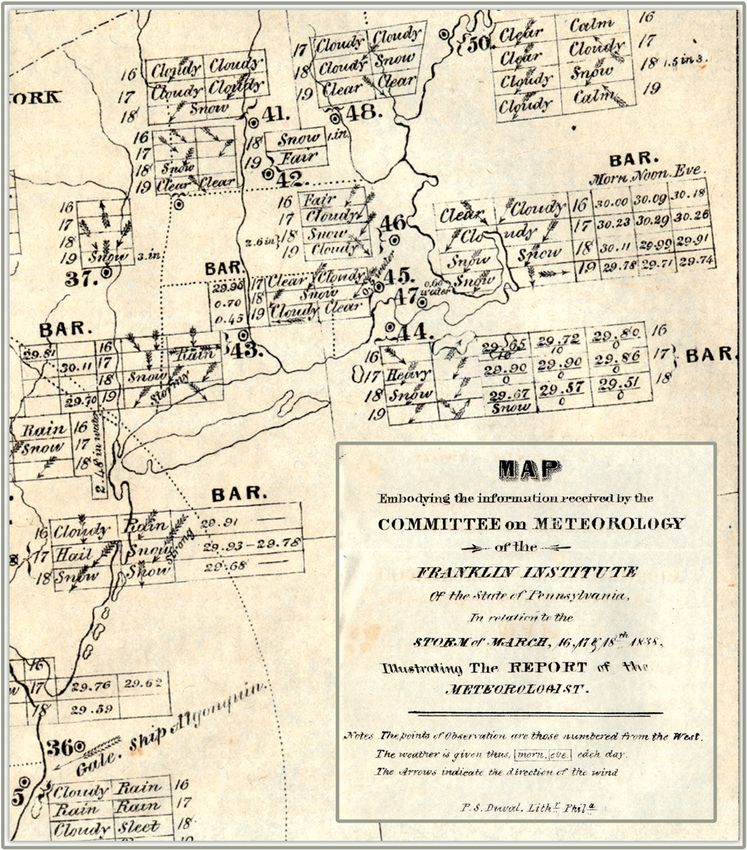
map. The plotters used the symbols seen on the AMS                      instrument readings and visually evaluated the state
      ties, scarves, and umbrellas to represent the weather                   of the sky and weather at a station, were, of course,
      and clouds, which were observed not by instruments                      critical. But in this paper we highlight the role of the
      but by eye. 3) Analysts took the maps provided by the                   map plotters, who entered the observational informa-
      plotters and added analyses in the form of isolines,                    tion at the location of each weather station onto blank
      fronts, highs and lows, which interpolated the plotted                  maps. This plotting was a critical step in making it
      data to provide patterns of weather over a large area                   possible for analysts to interpret and extrapolate the
      in which the stations were located. 4) Forecasters                      information in a way that created maps showing
      used the sequence of analyzed maps provided by the                      broad patterns of atmospheric circulation that were
      analysts as the basis for prognostication that served                   consistent with the data plotted at each station.
      aeronautical and seagoing navigation, agriculture,                          The weather map plotter had to work under pres-
      military operations, severe weather warning, and                        sure, with skill and efficiency. A plotter had to create
      other applications.                                                     a new current weather map every time a new set of
         Our paper remembers and celebrates the plotters,                     observations from stations around the world arrived
      whose work laid the foundation for weather analysts                     over telegraph or Teletype. The information arrived
      and forecasters. The fully analyzed weather map,                        in an alphanumeric code, and the plotter would
      based on plotted station observations, was the fun-                     have to decode and write the information on a map
      damental element of progress in meteorology as a                        at the location of each station. The information had
      science. Strategies for producing and disseminating                     to be entered quickly in order for the plotted map to
      analyzed maps of atmospheric conditions over broad                      be current, it had to be entered at each station in a
      expanses of the globe have been the subject of several                  universally accepted format, and it had to be legible
      historical works. Monmonier (1988, 1999), Fleming                       so that the analyst could take over the plotted map
      (1990, 2016), Anderson (2006), and Edwards (2010)                       and quickly prepare the analyzed map.1
      detail how international organization and coordina-                         The legions of weather map plotters at work in
      tion of government weather services have been essen-                    the early to late 1900s, who skillfully performed this
      tial to developing common practices of representing                     crucial function, are now extinct, as technology has
      simultaneous atmospheric conditions over broad                          replaced the need for their unique handicraft. So
      regions. Anderson’s work, in particular, chronicles the                 in this centennial year of the AMS, it seems appro-
      experimentation with different methods of mapping                       priate not to forget these bygone but important and
      that have led to today’s common practices for map-                      unsung contributors to meteorology. To remember
      ping weather over large areas. These historical studies                 them, we focus on the symbols they used to represent
      focus on the messages contained in fully analyzed                       the descriptive observations of clouds and weather.
      weather maps, with their isolines, fronts, and other                    The plotters of course had to inscribe the numerical
      features that allow the user of weather information to                  information on wind, temperature, humidity, and
      grasp global or regional weather patterns at a glance.                  pressure at each station. But the descriptive informa-
         Somewhat overlooked in these studies has been                        tion from visual observations of sky and weather at
      the role of the workers and methodologies that un-                      each site could not be entered numerically. Instead,
      derpinned the ability to map atmospheric phenom-                        ingeniously simple symbols suggestive of the visual
      ena over vast regions. The observers, who recorded                      observations were quickly drawn at each point on

AFFILIATIONS: R. A. Houze —University of Washington, Seattle,
                                                                              1
                                                                                  Long before winning the Rossby Medal of the American
Washington; R. Houze—Northern Illinois University, DeKalb, Illinois               Meteorological Society and the Symons Medal of the Royal
CORRESPONDING AUTHOR: Robert A. Houze Jr.,                                        Meteorological Society, author RAH’s first job in meteorol-
houze@uw.edu                                                                      ogy was as a map plotter at Texas A&M University, where
The abstract for this article can be found in this issue, following the           he plotted the maps for classes in synoptic meteorology in
table of contents.                                                                the 1960s. In the 1970s after RAH became a Professor in
DOI:10.1175/BAMS-D-19-0071.1                                                      the Department of Atmospheric Sciences at the University
                                                                                  of Washington, coauthor RH, herself now a Professor of
A supplement to this article is available online (10.1175/BAMS-D-19-0071.2)
                                                                                  Art History at Northern Illinois University, remembers as a
In final form 20 August 2019                                                      child watching Lorrie Grider plotting maps from Teletype
©2019 American Meteorological Society
For information regarding reuse of this content and general copyright
                                                                                  reports for the department’s synoptic meteorology classes.
information, consult the AMS Copyright Policy.                                    Lorrie was an expert plotter, who had learned the skill while
                                                                                  she was serving in the U.S. Navy.

ES424 |         DECEMBER 2019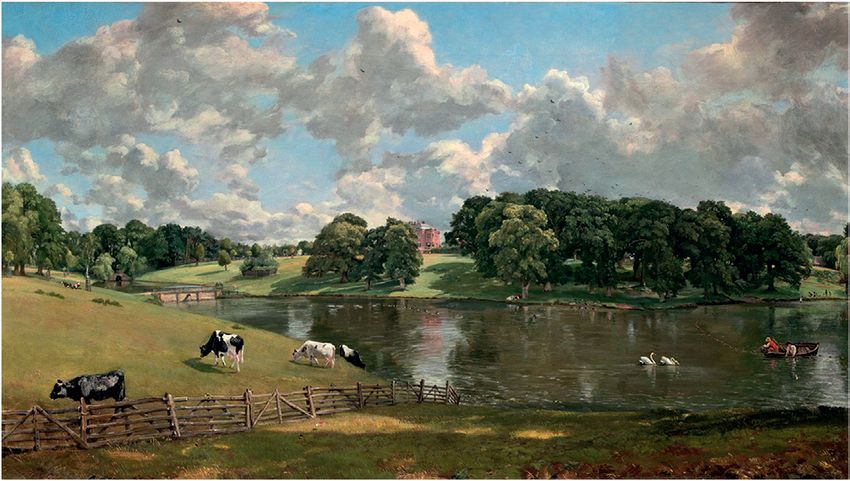
the map where visual observations were made. The           surface weather map, which reached its highest form
    symbols on the AMS merchandise were among those            as a manual craft during the mid-twentieth century,
    used to quickly plot all the data from every station on    started with the hand plotting of observational data at
    a map of the United States or some other region of the     each reporting station’s location on a map. The symbols
    globe. These quickly drawn symbols for clouds and          representing the observers’ description of the clouds
    weather phenomena seen by an observer facilitated          and weather occurring at every station on the map were
    the necessarily fast plotting and efficient nonverbal      an important part of this manual plotting skill. The
    representation of complex descriptive information          design of these small ideographs used in hand plotting
    about the weather at a given location.                     to represent cloud and weather elements has a sur-
        From about the mid-1940s to the end of the 1960s,      prisingly rich history. Clouds and weather, of course,
    handcrafted weather mapping using these symbols            have been the subject of both artists and scientists for
    reached a pinnacle of skill and expertise. Subsequently,   centuries. Weather on the ground and clouds in the
    the communication of images by facsimile allowed           sky are essential to people’s experience of Earth’s atmo-
    maps to be created in a central location and dissem-       sphere. While numerical quantities like rain amount
    inated to weather stations in fully finished form,         and cloud-base height can be measured in numbers
    eliminating the need for an army of skilled plotters       and serve as input and output variables for numerical
    distributed around the world. By the 1990s, facsimile      forecasts, they do not tell the whole human story of
    transmission was being replaced by the transmission        what is happening weatherwise at a specific time and
    of imagery over the internet. Increasingly sophisticated   location. What it looks like out the window is as much
    computer-generated forecast products began replacing       feeling as fact. The cloud and weather observations rep-
    the need for traditional weather maps, and local fore-     resented on a map therefore tell what conditions looked
    casters evolved into interpreters of maps of centrally     and felt like in ways that relate to people’s experience,
    generated numerical model output.                          which explains why the cloud and weather symbols
        In this centennial year of the AMS, we revisit this    on the AMS souvenirs are so important, appropriate,
    period of historical interest, with the theme of cloud     and endearing. We suggest that as hand plotting of
    and weather symbols used by map plotters, to consider      observations of clouds and weather at individual
    whether anything in terms of representing and think-       stations has become more automated and numerical,
    ing about weather has been lost in the digital techno-     this human experiential element of the weather map
    logical age to which we are now bound. The traditional     has been lost. So, as part of the retrospective look at

Fig. 2. John Constable. Wivenhoe Park, Essex. 1816. Oil on canvas. National Gallery, Washington, D.C.

    AMERICAN METEOROLOGICAL SOCIETY                                                             DECEMBER 2019          | ES425
meteorology in the centennial year of the AMS, we
      examine here how meteorologists represented weather
      phenomena and clouds symbolically at the pinnacle of
      the era of weather mapping by the human hand, how
      the symbols used in this activity formed and evolved
      over time, ways in which this representation of the
      human experience of clouds and weather might be
      vanishing in today’s technological age, and why this
      loss might have consequences.

      CLOUD SYMBOLS: REPRESENTATION OF                          F ig . 3. Cloud symbols suggested by Howard (1803,
                                                                p. 345).
      AESTHETIC BEAUTY AND MEANINGFUL
      SCIENCE IN SIMPLE STROKES OF A PEN.
      People have long been fascinated and inspired by          of violent Alpine thunderstorms and fiery sunsets
      clouds. In the early 1800s, British landscape painters    above the Thames to Constable’s careful depictions
      John Constable (1776–1837) and William Turner             of the tidy English countryside in pleasant weather
      (1775–1851) were well known for their natural-            (Rees 1982).
      istic representations of atmospheric phenomena.              The first half of the nineteenth century was a time
      Constable’s painting Wivenhoe Park (Fig. 2) depicts       when the intellectual worlds of art and science were
      cumulus clouds over English farmland with attention       coming together, and it was actually the London
      to visual accuracy based on his own observations. The     Meteorological Society’s Transactions that published
      pastoral foreground with the rustic fence suggests        one of Ruskin's early articles about nature observation
      how the clouds form part of the scene of everyday life.   (Ruskin 1839). Long before airplanes and satellites,
      Contemporary discussions of these works emphasize         clouds dominated the human perception of the sky
      the experiential aspect of atmospheric conditions. For    and were thus at the center of the early nineteenth
      example, the outspoken and influential modern art         century’s convergence of art and science. Poetry as
      critic of the time John Ruskin (1819–1900) propound-      well as visual art was part of this movement, exem-
      ed a preference for Turner’s dramatic renderings          plified by Johann Wolfgang von Goethe’s (1749–1832)
                                                                poem “In Honor of Howard.” This poem muses about
                                                                how human imaginations roam free when looking at
                                                                clouds in the sky:

                                                                   Here lions threat, there elephants will range,
                                                                   And camel-necks to vapoury dragons change.

                                                                    Goethe’s title refers to the English pharmacist and
                                                                amateur meteorologist Luke Howard (1772–1864),
                                                                who in 1803 suggested a set of evocative symbols to
                                                                signify the three fundamental cloud forms by the
                                                                simplest of line drawings: a diagonal line for cirrus,
                                                                a semicircular curve for cumulus, and a horizontal
                                                                bar for stratus (Fig. 3). These simple, quickly executed
                                                                strokes of a pen convey in an efficient way the com-
                                                                plexities that Turner and Constable painted and that
                                                                Goethe sought to describe in words.
                                                                    Later in the nineteenth century, in the scientific
                                                                world, three other key figures emerged in an effort
                                                                to identify the different types of clouds seen from the
                                                                ground and decks of ships. These were the Scottish
                                                                meteorologist Ralph Abercromby (1842–97), the
                                                                Swedish physicist Hugo Hildebrand Hildebrands-
Fig. 4. Cloud symbols suggested by Ley (1894) in his book       son (1838–1925), and the English clergyman and
Cloudland, here shown as reproduced in Talman (1916).           early meteorologist William Clement Ley (1840–96).

ES426 |      DECEMBER 2019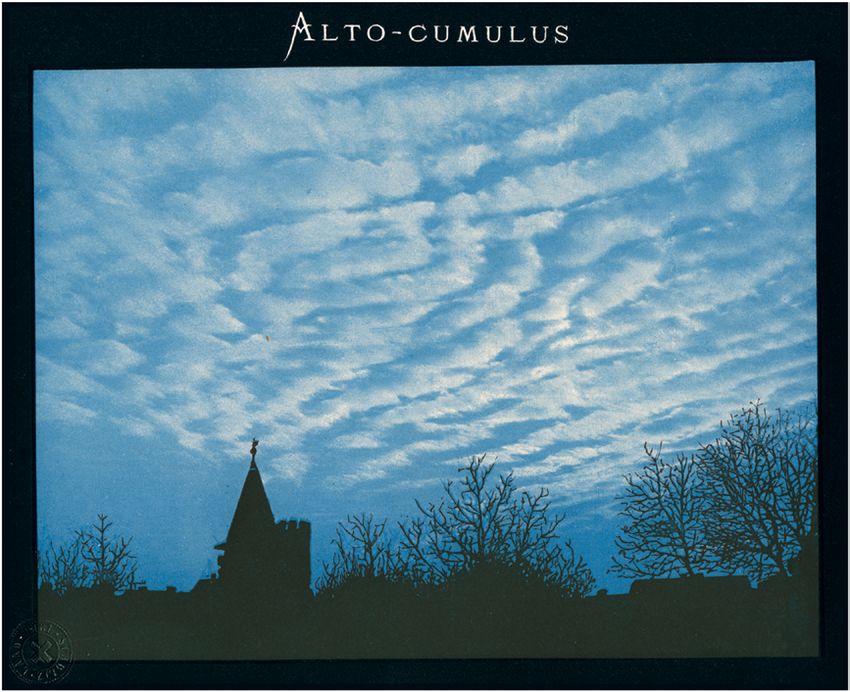
All three realized the impor-
     tance of connecting pictures
     of clouds with their naming
     and their symbolic represen-
     tation. Abercromby (1887)
     wrote of “the impossibility of
     expressing the varying forms
     of clouds in words.” It was
     becoming obvious that clouds
     took so many fundamentally
     different forms that Howard’s
     three symbols were insuffi-
     cient on their own for observ-
     ers to characterize the state
     of the sky. In an 1894 treatise
     called Cloudland, using a com-
     bination of artwork and a few       Fig. 5. An example from Ralph Abercromby’s collection of photos that he
     early photographs, Ley (1894)       took on his around-the-world tour documenting clouds at diverse locations.
                                         This example taken at Tenerife in the Canary Islands shows stratocumulus
     elaborated on Howard’s three
                                         clouds over the subtropical ocean. Courtesy Met Office Library Archives.
     basic cloud-form symbols to
     suggest symbols for a large
     number of variations and hybrid symbols (Fig. 4). skies, but more significantly, to a rich, physically
     One combination of these shapes, for example, was meaningful, and nuanced visual depiction of the
     the use of small concave downward curved lines atop varying sky on expansive weather maps that covered
     a horizontal bar, to represent stratus castellatus (or vast geographical territory, extending the reach of
     what we now call altocumulus castellanus). Three what could be observed by a single set of eyes in one
     quick strokes of the pen evoked the unmistakable location at a given moment.
     form of a turreted medieval castle or city wall. For       In the late nineteenth century, photography was
     both Howard and Ley, imaginative, visually evocative still in its infancy, but Ley, Abercromby, and Hil-
     but simple-to-execute cloud symbols lent themselves debrandsson saw its potential power and became
     not only to efficient notation of the condition of the advocates of using photographs of clouds to relate to
                                                                                    nomenclature and symbols.
                                                                                    Photography could capture the
                                                                                    transient and ephemeral nature
                                                                                    of clouds much more efficient-
                                                                                    ly than the slow processes of
                                                                                    sketching and painting. But in
                                                                                    these early days of photography
                                                                                    it was nevertheless difficult
                                                                                    to capture the fleeting forms
                                                                                    of clouds on glass plates. As a
                                                                                    result, early cloud atlases had
                                                                                    to rely on combinations of pho-
                                                                                    tographs with hand-illustrated
                                                                                    renderings of clouds to guide
                                                                                    nomenclature. After trying
                                                                                    unsuccessfully to collect cloud
                                                                                    pictures from other people,
                                                                                    Abercromby spent a decade
                                                                                    traveling around the world tak-
                                                                                    ing pictures of clouds, which
Fig. 6. Illustration of stratocumulus cloud in the cloud atlas of Hildebrands-      were printed as miniatures on
son et al. (1890, plate 6).                                                         paper 113 mm × 62 mm, which

    AMERICAN METEOROLOGICAL SOCIETY                                                      DECEMBER 2019        | ES427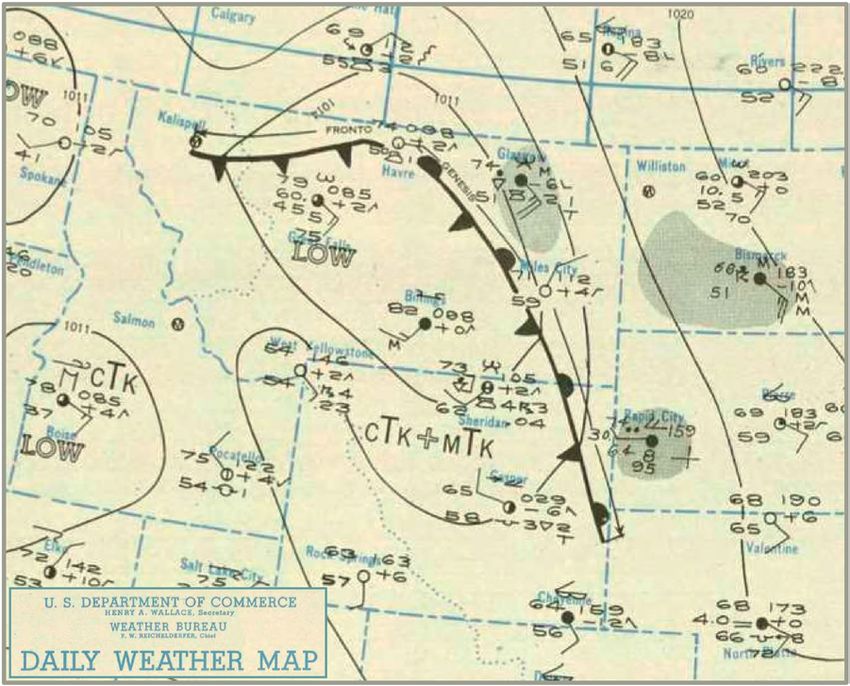
he described as the size of a
     calling card of the type used
     by the Victorian-era gentry
     (Abercromby 1887; Fig. 5).
     These travels led him to the
     conclusion that an interna-
     tional system of cloud identi-
     fication was essential because
     “cloud forms are the same all
     over the world”—a fact we now
     take for granted, but which was
     not known at that time. In the
     course of his travels he “had
     the opportunity of conversing
     with the Directors of many
     Meteorological Institutes in
     various parts of the world,
     and…found that though some
     forms of cloud were almost
     universally assigned the same
                                       Fig. 7. Illustration of cumulus cloud in the cloud atlas of Hildebrandsson
     name, others—especially the       et al. (1890, plate 8).
     lower clouds—received a dif-
     ferent name from nearly every
     Director.” He declared, “The question of an Interna- Wolken-Atlas, an early pictorial atlas of cloud types
     tional Nomenclature of Clouds becomes of the highest (Hildebrandsson et al. 1890). But at this stage, even
     importance.” Hildebrandsson shared Abercromby’s with the apparent availability of Abercromby’s collec-
     opinion that a naming system for cloud types was tion of cloud pictures, the atlas was primarily a port-
     sorely needed, and they developed similar ideas for folio of full-page paintings of each of the basic cloud
     this much-needed taxonomy, although they publicly types with only a few small black and white photos used
     disagreed about names that should be used (Aber- to supplement the verbal discussion of cloud types.
     cromby 1887; Hildebrandsson 1887). Along with Ley’s Cloudland published just four years later (Ley
     Wladimir Köppen (1846–1940) and Georg Balthazar 1894) was not an atlas but rather a verbose monograph
     von Neumayer (1826–1909), Hildebrandsson published attempting to explain cloud formation processes and
                                                                                  their relation to larger atmo-
                                                                                  spheric circulations. However,
                                                                                  like Wolken-Atlas, it also made
                                                                                  heavy use of artwork for its
                                                                                  illustrations, supplemented
                                                                                  by just a few small black and
                                                                                  white photographs, with one
                                                                                  of its purposes being to connect
                                                                                  cloud pictures with his symbols
                                                                                  and naming system (Fig. 4).
                                                                                      T he pa i nt i ngs used by
                                                                                  Hildebrandsson et al. (1890)
                                                                                  and Ley (1894) are interest-
                                                                                  ing not only for the clouds
                                                                                  t he y i l lu st r ated but a lso
                                                                                  for the way that the scenes
                                                                                  were composed. Like Con-
                                                                                  stable’s pastoral painting in
Fig. 8. Illustration of towering cumulus and cumulonimbus in Cloudland            Fig. 2, the foregrounds of
(Ley 1894, frontispiece).                                                         these paintings emphasize

ES428 |    DECEMBER 2019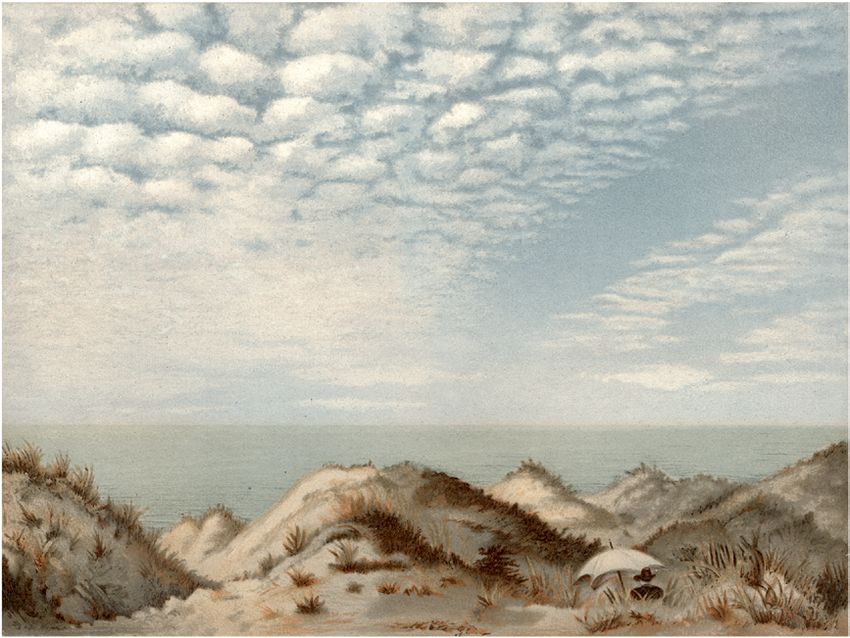
how the cloudscapes relate
     to human experience. For
     example, Fig. 6 shows a sky of
     gray stratocumulus hovering
     over a wintry scene depicting
     a snow-covered farmhouse.
     Figure 7 shows a rural man
     and his dog looking out over
     a vast scrubland with a sky
     of flat-based cumulus clouds
     reaching into the distance to
     a faraway mountain range.
     Figure 8 illustrating larger
     cumulus clouds and cumu-
     lonimbus is a clear imitation
     of Constable’s pastoral scene
     of farmland under the cloudy
     sky. This illustration was the
     frontispiece of Cloudland and
     illustrates with little doubt        Fig. 9. Illustration of altocumulus cloud in the cloud atlas of Hildebrandsson
     how profoundly the early             et al. (1890, plate 4).
     cloud atlases were influenced
     by the earlier landscape painters. The emphasis on are elongated, they evoke a school of fish, expressed
     human experience of the skies was clearly an import- colloquially and in literature as “mackerel sky” (e.g.,
     ant aspect of the illustrations of cloud types in both by John Updike in Rabbit Run). This common usage
     the 1890 Wolken-Atlas and 1894 Cloudland.                    was Latinized by Ley (1894) as Stratus maculosus.
        Altocumulus clouds have been especially inspira- The illustrations of altocumulus clouds in the early
     tional. In Cloudland, Ley says, “Many of the skyscapes cloud atlases strongly reflect the human experience
     due to the occurrence of Stratus Maculosus are of very of altocumulus skies. Figure 9 shows a person sitting
     great beauty. The minute rounded masses, compared among sand dunes along a shore. A field of altocu-
     by some authors to a flock of sheep lying down, pro- mulus cloud extends over the water and vanishes in
     duce in perspective an impression of quiet grandeur, the distance. This painting was perhaps a self-portrait
     and delicate colouring and elegant mottled appear- of the artist, who like many people meditating on a
     ance, which cannot fail to excite admiration in an beach, was evidently inspired by a scene enhanced by
     artistic mind” (Ley 1894). When the cloud elements the cloud-filled sky above. Four years later, in Cloud-
                                                                                       land, Ley (1894) included a
                                                                                       somewhat similar painting
                                                                                       of altocumulus vanishing in
                                                                                       the distance but in this in-
                                                                                       stance over a wide landscape
                                                                                       of arid hills (Fig. 10). This
                                                                                       type of scene often inspires
                                                                                       the human perception of the
                                                                                       vastness of Earth’s reach in
                                                                                       relation to people’s experience.
                                                                                       Driving across open country,
                                                                                       one might be tempted to pull
                                                                                       over and photograph a similar
                                                                                       scene. If the foregrounds were
                                                                                       removed from the paintings in
                                                                                       Figs. 9 and 10, the illustrations
                                                                                       would not contain the impres-
Fig. 10. Illustration of altocumulus in Cloudland (Ley 1894, plate III).               sion of how the scene felt and

    AMERICAN METEOROLOGICAL SOCIETY                                                          DECEMBER 2019         | ES429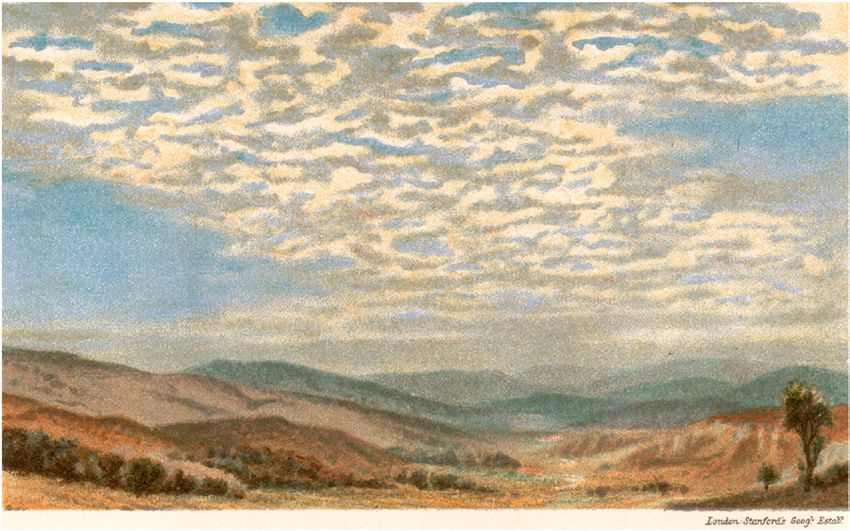
would be uninteresting views
     of clouds with no experiential
     perspective. Figure 11 is an
     early photograph of altocumu-
     lus that was also in Cloudland.
     This photo was embedded as a
     small illustration in the text of
     the book used only to supple-
     ment the defining Fig. 10.
         But technology was rapidly
     developing, and photographs
     of clouds were soon to replace
     hand-illustrated renderings
     as the reference for cloud no-
     menclature. In 1896, Hildeb-
     randsson, working with Swiss
     meteorologist Albert Riggen-
     bach (1854–1921) and French
     meteorologist Léon Teisserenc
     de Bort (1845–1918), produced
     the first mostly photograph-
                                        Fig . 11. Photograph of altocumulus in Cloudland (Ley 1894, p. 54, illus-
     ic International Cloud Atlas
                                        tration I).
     (Hildebrandsson et al. 1896).
     This atlas was notable for
     its inclusion of a number of chromotypographs of in colored inks. The name combines “chromo” (color)
     certain types of clouds. Chromotypographs were an with “typographic” (the design and arrangement of
     innovation in industrial print technology, which en- letterforms for the printed page). These chromoty-
     abled publishers to mechanically reproduce black and pographs were forerunners of the high-quality color
     white photographic images with rich tonal gradation photographs used in today’s online International
                                                                                 Cloud Atlas. Figure 12 is the
                                                                                 chromotypograph used by
                                                                                 Hildebrandsson et al. (1896) to
                                                                                 replace the artists’ renderings
                                                                                 of Figs. 9 and 10. For compar-
                                                                                 ison, Fig. 13 shows a high-res-
                                                                                 olution photograph from the
                                                                                 current version of the Inter-
                                                                                 national Cloud Atlas. This
                                                                                 modern photo is strikingly
                                                                                 similar to the early chromoty-
                                                                                 pograph, not only in detail but
                                                                                 also in composition. The fore-
                                                                                 ground silhouette of trees and
                                                                                 buildings gives both the chro-
                                                                                 motypograph and modern
                                                                                 photo a human perspective,
                                                                                 indicative not only of scale but
                                                                                 also suggestive of the mood of
                                                                                 the scene. The now frequent
                                                                                 posting of digital photographs
                                                                                 of clouds on social media un-
Fig. 12. Chromotypograph illustrating altocumulus in Fig. 10 of the Inter-       derscores the importance of
national Cloud Atlas of Hildebrandsson et al. (1896).                            clouds affecting mood but as

ES430 |    DECEMBER 2019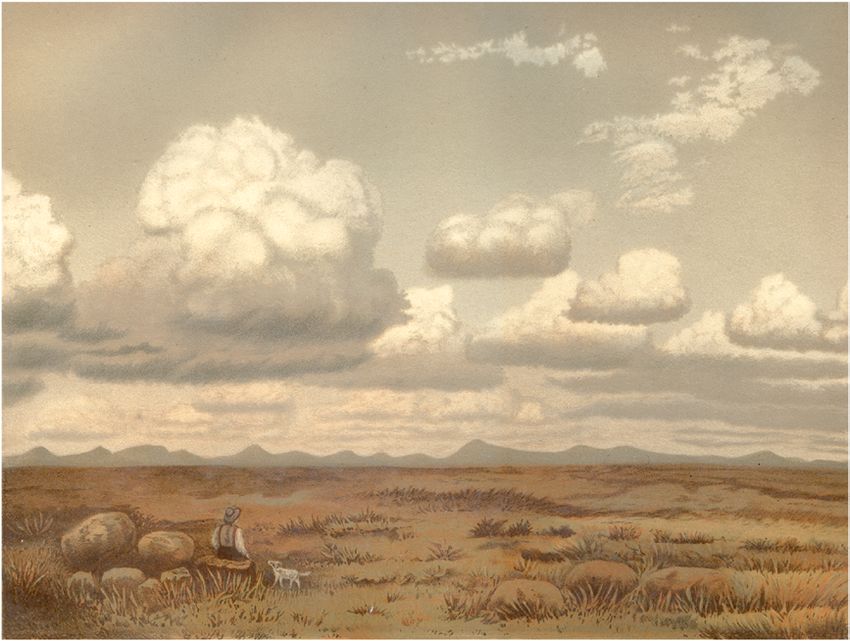
yet the voluminous archive
of such photographs has not
changed the classification
of clouds represented by the
symbols on maps.
   The creation of pictorial
cloud atlases in the 1890s co-
incided with a nineteenth-cen-
tury movement of European
and American scientists to
standardize meteorological
observations so that weather
mapping would be under-
standable and useful in track-
ing weather events across in-
ternational borders. The first
international conference on
these matters was in Brus-
sels in 1853, and among the
agreements reached was the
matter of codes and symbols
for observed clouds (Pouncy
2003). That conference was
an ad hoc meeting of scientists
concerned about the orga-
nization of meteorology. A
subsequent conference was
held in Vienna in 1873, at the
time of the International Ex-
position, when the necessity
for increasing and improv-
ing communication among
nationalities affected many
disciplines, including meteo-
rology. The Vienna conference
formalized a consortium of
meteorologists from various         Fig. 13. High-resolution photograph of altocumulus in the 2017 online ver-
                                    sion of the World Meteorological Organization’s International Cloud Atlas.
countries by overseeing the
                                    See https://cloudatlas.wmo.int/home.html.
formation of the International
Meteorological Organization
(IMO), the forerunner of the World Meteorological observations.” The 1896 version of the International
Organization (WMO). The IMO held an especially Cloud Atlas (Hildebrandsson et al. 1896) was the
important follow-up meeting in Munich in 1891. result of that committee’s work. This outcome was
According to the meeting’s rapporteur (Scott 1892), probably the most important step in establishing the
a particularly long and disputatious discussion was 10 basic cloud types still in use today. In the United
devoted to the identification of clouds, but when States, Cleveland Abbe (1838–1916), a key early pro-
brought to a vote, “The resolution of the Confer- moter of coordinated telegraphy of meteorological
ence, carried by a large majority, was to adopt the observations, adopted these basic cloud types and
classification of clouds, with 10 grades, proposed by advocated that station observers systematically record
Prof. Hildebrandsson and Mr. Ralph Abercromby.” the types present at a given time on a common ob-
A committee was then formed to follow up with the servational form (Richards and Abbe 1898). The IMO
task of forming a cloud atlas “to introduce unifor- and WMO have revised the atlas many times since
mity in the classification and nomenclature of cloud 1896, with the use of ever more clear and beautiful

AMERICAN METEOROLOGICAL SOCIETY                                                     DECEMBER 2019        | ES431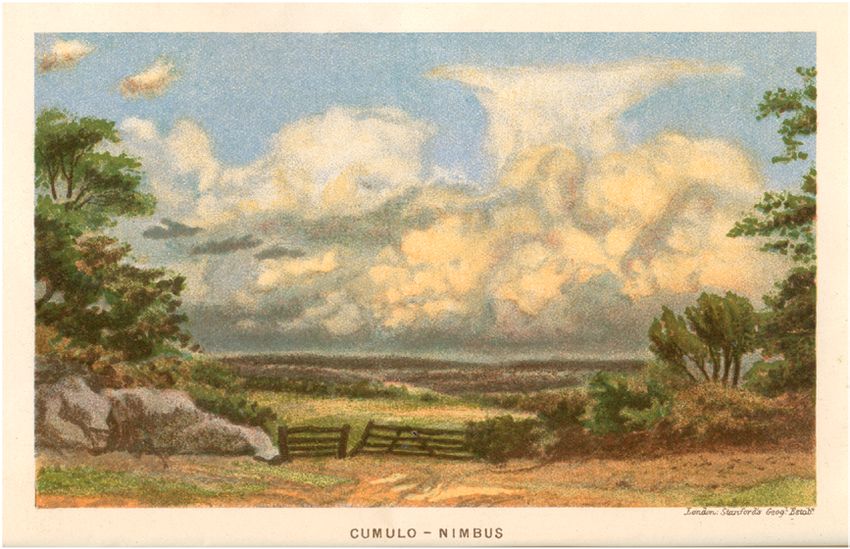
photography, but always with 10 basic cloud types.
                                                          The 2017 revision of the WMO’s International Cloud
                                                          Atlas is available online (https://cloudatlas.wmo.int/).
                                                          Its 10 basic cloud types, indicated by uppercase words
                                                          in Fig. 14, correspond precisely to the categories
                                                          identified by Abercromby and Hildebrandsson and
                                                          listed at the end of Abercromby’s (1887) paper, albeit
                                                          with somewhat different names than are used now. A
                                                          comparison of the 10 names used by Abercromby and
                                                          in the modern lexicon is provided by Pouncy (2003).
                                                              The 10 basic cloud types identified by Abercromby
                                                          and Hildebrandsson occur in a variety of structural
                                                          variations and hybrid forms. Figure 14 therefore inte-
                                                          grates the 10 basic types into 27 specific and frequent-
                                                          ly observed combinations, each to be indicated on
                                                          maps by a specific symbol. These symbols are clearly
                                                          descendants of those of Howard and Ley (Figs. 3 and
                                                          4). The 27 varieties are subdivided into three groups
                                                          of 9 specific cloud types considered to be low, middle,
                                                          or high, where the heights are those of the bases of the
                                                          clouds. These categories have been institutionalized,
                                                          standardized, and illustrated by the International
                                                          Cloud Atlas and the WMO “Manual of codes” (WMO
                                                          2017) with little modification since the early 1900s.
                                                          As Abercromby and Hildebrandsson hoped, these
                                                          identifiable cloud types have succeeded in making
                                                          the language of cloud identification efficient. The
                                                          nineteenth-century meteorologists thus produced a
                                                          stable and enduring legacy allowing the complexities
                                                          of cloud variations to be embodied neatly in a family
                                                          of simple definitions and graphic symbols readily
                                                          applicable for use on maps. The 27 basic cloud types in
                                                          Fig. 14 have appeared unchanged for about a century,
                                                          not only in the WMO’s current International Cloud
                                                          Atlas but also, significantly, in the WMO “Manual of
                                                          codes” (WMO 2017), which indicates that the symbols
                                                          in Fig. 14 should be used on maps to indicate cloud
                                                          types seen by weather observers on Earth’s surface.
                                                              A frequent point of confusion after the launch of
                                                          the first weather satellites is that the WMO categories
                                                          of low, middle, and high clouds in Fig. 14 refer to
                                                          the height of cloud base, not cloud top. Cloud types
                                                          like cumulonimbus and nimbostratus may reach
                                                          great heights but remain classified as low, according
                                                          to the height of cloud base. Satellite-based nomen-
                                                          clature often uses cloud-top height to distinguish
                                                          cloud types (e.g., Rossow and Schiffer 1999), and
                                                          that lexicon is useful for many scientific studies.
                                                          But for surface weather reports, which convey the
                                                          experience of a person on the ground, or of a ship, or
                                                          the needs of a pilot of an aircraft landing or taking
Fig. 14. Cloud symbols, codes, and descriptions used by   off, the more relevant height is cloud base. For these
the World Meteorological Organization (WMO 2017).         reasons, the “Manual of codes” retains the categories

ES432 |    DECEMBER 2019
by cloud-base height for surface weather reporting
and mapping.
One of the reasons that the cloud types and cor-
responding symbols in Fig. 14 have had a stable and
successful history is that they do not require the
observer to make a determination of the atmospheric
physical and dynamical processes producing the vis-
ible cloud forms. An observer need only be trained to
recognize shapes; it is not the observer’s responsibility
to interpret how the clouds are being formed. And
yet these astutely distinguished types, based solely
on appearance, have turned out to have crucially
distinct physical interpretation. Books on the physics
and dynamics of clouds have been organized around
these types (e.g., Houze 2014). Their use in plotting
weather observations on maps thus adds physical
meaning to the report of weather conditions at a
particular location on a map as well as a subjective
representation of how the state of the sky seemed to
a person on Earth’s surface. The fact that these basic
F ig . 15. Rudimentary symbols proposed for basic
cloud categories and symbols are both easily appli-
weather elements by Lambert (1771, p.63).
cable and carry physical meaning is a testament to
the cleverness of the nineteenth-century advocates
of cloud study. Much like today’s keyboard-created emoticons pop-
ularized in the early computer age, weather symbols
WEATHER SYMBOLS: A GRAPHIC SYS- make extensive use of commas, periods, hyphens,
TEM RELATED TO WRITING. Besides the state apostrophes, brackets, asterisks, and tildes. Three de-
of the sky overhead, reports from meteorological sta- cades before Luke Howard introduced the elemental
tions include other information about the experience cloud symbols, the Swiss scientist Johann Heinrich
of atmospheric conditions on the ground or on the Lambert (1728–77) suggested the basic elements of
deck of a ship at sea. Like clouds, these conditions weather symbols (Fig. 15). They comprised simple
cannot always be simply expressed as numbers. lines, apostrophes, x marks, dots, and a zigzag form
The conditions at Earth’s surface, as opposed to the attempting to represent clouds, rain, snow, fog, and
sky overhead, are what meteorologists classify as thunder. These minimalist marks recalled complex
“weather.” These conditions include rain, snow, hail, phenomena and were the seeds from which modern
drizzle, fog, sleet, lightning, haze, smoke, blowing symbols have evolved. The x marks representing
dust, snow, and several variants of these phenomena. snow and the zigzag representing thunder (often as-
They represent the diverse ways that the atmosphere sociated with a lightning stroke) are clear progenitors
affects us as we go about the business of our daily of the modern symbols in which an asterisk is used
lives. Meteorologists have been thinking about how for snow and various zigzags are used for different
to represent these conditions on a map for more than forms of thunder and lightning. These elements are
two centuries, and the symbols we use today, like pictorially suggestive, with the branches of the x or
the symbols for clouds overhead, have undergone an asterisk suggesting a snowflake and the dot or period
evolution. Interestingly, while cloud iconography was suggesting rain, yet they are largely derived from ab-
influenced by visual art, weather symbols have had a stract systems of writing, except for the bent arrow for
rather different history, seeming influenced more by thunder. Through subsequent years, up until present
technology than art. In contrast to the cloud symbols, times, the dominant features of the weather symbols
which took the form of abstract shapes reminiscent have remained largely the same. In their shorthand
of naturalistic yet complex cloud forms, the weather notation, they expressed not only the practice of
symbols have been built largely on the nonalphabet- handwriting, but also the new technologies of writ-
ic elements of writing, such as punctuation marks, ing and printing in a world increasingly defined by
which became increasingly standardized in the de- industrial mechanical reproduction and the quick
velopment of different typefaces used for printing. transmission of information.
AMERICAN METEOROLOGICAL SOCIETY DECEMBER 2019 | ES433Fig. 16. Weather map printed by the Franklin Institute “embodying the Information Received by the Committee
on Meteorology of the Franklin Institute of the State of Pennsylvania in Relation to the Storm of 16th, 17th, &
18th, Mar 1838.” From Espy (1838) and viewable online (http://libweb5.princeton.edu/visual_materials/maps
/websites/thematic-maps/quantitative/meteorology/meteorology.html).
Lambert was somewhat ahead of his time. Weather of data by wire from many points on Earth, and in-
mapping and forecasting did not take on rapid de- terest in producing current synoptic maps showing
velopment until the nineteenth century; particularly simultaneously the weather conditions over broad ar-
following the introduction of the telegraph. Electrical eas came into vogue. Printing of maps by agencies and
communication enabled simultaneous transmission commercial enterprises began in the early 1800s. One
ES434 | DECEMBER 2019Fig. 17. Weather map showing conditions over England at 0900 LT 16 Jan 1861. The map was published by Fran-
cis Galton, FRS, and reproduced in a book by his colleague on the Meteorological Council of Great Britain, Sir
Napier Shaw (Shaw 1926).
of the novelties of modern technology produced for broad glance. Symbols made for a more comprehen-
Prince Albert’s Great Exhibition in London in 1851 sible map. In the 1860s Francis Galton (1822–1911)
was a same-day weather map (Monmonier 1999). But of the Royal Geographical Society published “syn-
the ways in which weather conditions such as precipi- chronous weather charts” of meteorological condi-
tation were represented varied from one mapmaker to tions over England. Galton’s maps included iconic
the next. In the 1830s, weather maps published by the graphic symbols for rain or snow at a station. Rain
Franklin Institute in the United States wrote out the was indicated by a field of circles and snow by a field
weather conditions in full in English at each station of asterisks (Fig. 17). These choices may have been
(Fig. 16, from Espy 1838), producing a map, which, influenced by Lambert’s suggested symbols of nearly
though beautifully printed, was not readily legible at a century earlier (Fig. 15). In this same time period,
AMERICAN METEOROLOGICAL SOCIETY DECEMBER 2019 | ES435Fig. 18. Weather map of the British Isles issued by the Daily Weather Map Co. for a date in the 1860s (year
unspecified). Reprinted by Shaw (1926).
a commercially produced British daily weather map mapping was taking place in many countries and
used a field of little circles to indicate “showers” and institutions.2 In the mid- to late 1800s, each country
a field of small dots to indicate rain, thus marking a used the explosion of current weather information
first attempt to distinguish short bursts of rain from available by telegraphy according to its own linguistic
steady precipitation, as is still done today (Fig. 18). and cultural traditions, and diverse notation systems
Weather mapping was seen as something new and
powerful, but it was proceeding in the absence of any 2
For a detailed account of the development of a telegraphic
international coordination or standard. And with the weather-reporting network in the United States, see chapter
availability of weather reports by telegraph, weather 7 of Fleming (1990).
ES436 | DECEMBER 2019Fig. 19. Symbols and letters used in different countries to represent weather conditions at a station on a map
as shown in a table in the report of the First International Meteorology Congress in Vienna in 1873.
proliferated and differed from one geographical,
cultural, and linguistic context to another, making
for inefficiency in the advance of meteorology. As a
result, a major concern taken up by the International
Meteorological Conference in Vienna in 1873 was
to standardize weather mapping among different
countries. 3 Sometimes standardization of proce-
dures can be as important as discovery in science.
Standardization may in fact set the stage for the next
discovery, by getting everyone to speak the same
language! The conference recognized that weather
stations in different countries were often indicating
weather observations on maps with alphabetic letters
3
Bericht über die Verhandlungen des Internationalen Me-
teorologen-Congresses zu Wien. 2–16 September 1873.
Protokolle und Beilagen (Report on the negotiations of the
International Meteorologists Congress in Vienna. 2–16 Fig. 20. Weather symbols put forth by the First Inter-
September 1873. Protocols and supplements). Druck der k. national Meteorology Congress in Vienna in 1873 for
k. Hof- und Staatsdruckerei, 1873 (http://hdl.handle.net/2027 common usage across Europe and North America.
/pst.000007213502). See text.
AMERICAN METEOROLOGICAL SOCIETY DECEMBER 2019 | ES437Fig. 21. The 100 weather symbols and codes in the WMO “Manual of codes.” These symbols and codes have
been in use unaltered for most of the twentieth century and all of the twenty-first century to date (WMO 2017).
The explanations for the symbols are in Fig. ES1.
corresponding to words in their own languages Weather stations in Austria used a double vertical line
(Fig. 19). For example, a common practice was the to denote rain, while in France and Russia rain was
use of the single letter R (or a variation, r, Rg, or ®) sometimes signified by a solid black dot. In Austria
to indicate rain. That practice worked for Germany, a black dot indicated fog rather than rain.
Switzerland, the Netherlands, England, Denmark, At the 1873 Vienna meeting, almost exactly a
Sweden, and North America, where the word for century after Lambert’s suggestion of basic weather
rain began with r in various languages (e.g., regnet, symbols, the nascent International Meteorological
regn, regen). However, in Italy and Russia, the letters Organization agreed that pictorial or abstract sym-
pl (from the Latin “pluviam”) were used. Some coun- bols, not alphabetic characters, would be used, and a
tries were also beginning to use symbols to indicate standard set was adopted and published in the meet-
weather, but without international coordination. ing report: a black dot for rain, a snowflake-shaped
ES438 | DECEMBER 2019Fig. 22. Instructions for plotting surface weather observations at a station on a map, according to the WMO
“Manual of codes” (WMO 2017).
asterisk (better than an x) for snow, a dynamic angled symbols were suggested (Jelinek 1905; Talman 1916).
line with an arrow tip for thunderstorm, a solid black However, in the end, the weather symbols have
triangle for hail, an open triangle for soft snow pellets/ retained their characteristic of being heavily in-
freezing rain/sleet, three horizontal bars for fog, a fluenced by writing, making them fundamentally
horizontal bracket for rime ice, and a rounded drop different from the more artistically inspired cloud
upon a horizontal bar for dew (Fig. 20). Again, the symbols. To reach 100 symbols, various nonal-
symbols are largely abstract. The hail and graupel phanumeric elements of writing were used in con-
depart slightly from more typical orthographic sym- structing symbols. In addition to periods, commas,
bols but triangles are often used in printing for data and dashes, the tildes (~) are now used for freezing
points. The symbol for dew combines the dash used rain and drizzle. Brackets and parentheses are used
for fog and the dot used for rain. The thunderstorm extensively in the symbols. The alphabetic letter
symbol can be reproduced in graphs with a stylized S is used several times, and a few mathematical
letter R, used not as a letter of the alphabet, but rather symbols appear, such as the infinity mark (∞) and
as a simple representation of a storm with a lightning some small arrows. Only a few characters are used
bolt. The meeting report contains the additional state- that do not have their origins in writing (e.g., smoke
ment, “the Commission recommends that if any other and tornado are little drawings).
abbreviations or symbols are used in a publication, The weather symbols in Fig. 21 as well as the
their explanation shall be given in a prominent place cloud symbols in Fig. 14 are applied to a map by first
and not only in the national language, but in several locating the station, usually indicated by a circle. The
languages.” This concern over language and the move symbols are plotted according to a now-standard
away from language toward symbols is not surprising model (Fig. 22). The weather symbols are placed on
as France, Austria, and Russia were each sprawling the middle left, just below the reported temperature,
empires that encompassed many language groups. It and the cloud symbols are plotted below and above
is understandable that meteorologists there would the station circle. Although the symbols in Figs. 14
have chosen nonalphabetic symbols to convey basic and 21 and the plotting method in Fig. 22 still reside
weather information from diverse locations. A mod- in the “Manual on codes,” they are not used much
ern analogy is the need for purely pictorial, extremely in today’s operational meteorology, although they
simple drawings for international road signs—quick can still be seen on current weather maps on certain
comprehension without resort to language to promote websites (e.g., http://weather.rap.ucar.edu/surface/).
smooth movement from country to country.
The symbols adopted in 1873 have evolved TWENTIETH CENTURY MAP PLOTTING
through usage and subsequent international agree- IN THE NORWEGIAN SCHOOL AND THE
ments into a set of 100 now-standard symbols that U.S. WEATHER BUREAU. The modern weather
are included in the WMO’s “Manual on codes” and cloud symbols and station model came into com-
(WMO 2017) and reproduced here in Fig. 21 (See mon usage sometime in the 1920s, at the time that the
Fig. ES1 in the online supplemental material for Bergen School, led by Vilhelm Bjerknes (1862–1951),
explanations of the symbols; https://doi.org/10.1175 was developing the polar front theory of midlatitude
/BAMS-D-19-0071.2). Along the way many other cyclones. At this time, analysts begin to add fronts
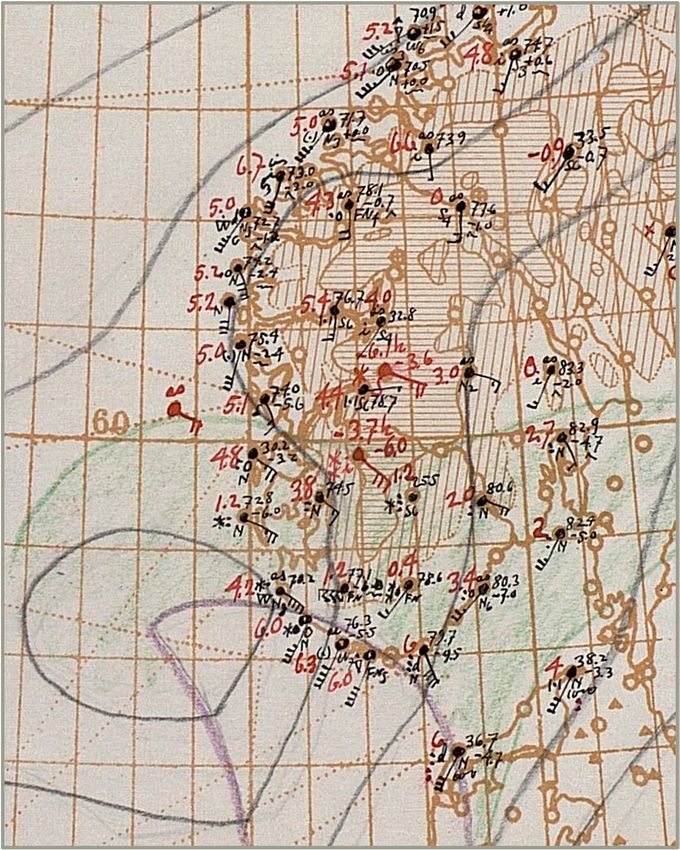
AMERICAN METEOROLOGICAL SOCIETY DECEMBER 2019 | ES439Fig. 23. Norwegian Weather Service surface weather map for 1400 LT 28 Jan 1927. ES440 | DECEMBER 2019
way as was being done at
                                                                                       individual weather stations
                                                                                       around the country and
                                                                                       world. An example of the
                                                                                       Daily Weather Map, from
                                                                                       3 August 1945, is in Fig. 24.
                                                                                       This map was plotted by
                                                                                       hand, probably by a skilled
                                                                                       draftsperson. Notice how
                                                                                       the same numeral differs
                                                                                       just slightly from one sta-
                                                                                       tion to the next, and how
                                                                                       t he sy mbols for clouds
                                                                                       and weather seem to burst
                                                                                       with personality, just as
                                                                                       handwriting reveals the
                                                                                       unique individuality of
                                                                                       each writer. These 1927
                                                                                       and 1945 weather maps
                                                                                       represent the era when
                                                                                       plotting station data by
                                                                                       hand added a human touch
Fig. 24. U.S. Weather Bureau daily weather map for 3 Aug 1945.
                                                                                       to weather maps.

    on top of the weather maps provided by plotters. An      WHY ARE CLOUD AND WEATHER SYM-
    example is the map in Fig. 23 used by the Norwegian      BOLS DISAPPEARING, AND WHAT ARE
    Weather Service in 1927 to warn of a dangerous storm     THE CONSEQUENCES? The era of hand-plot-
    approaching the Norwegian coast. A frontal cyclone       ted weather maps began to decline in the mid-1960s,
    is in the southwest part of the map. Unfortunately,      as meteorology was becoming more technological
    poor ship-to-shore communication prevented the           and complex. The delightful, artistic and clever
    warning from getting to ships and boats offshore, and    symbols for the clouds seen from Earth’s surface
    a disaster ensued, leading Jacob Bjerknes (1897–1975)    discussed above and celebrated on the AMS ties,
    (Vilhelm’s son, then in charge of weather prediction     scarves, and umbrellas have now fallen into disuse.
    in western Norway) to call for improved communica-       They have not been printed on the Daily Weather
    tion so that timely warnings could be received at sea.   Map since the year 2000. One motivation might
    On the map in Fig. 23 are weather symbols for rain,      be that satellites have been providing global cloud
    rain showers, snow, snow showers, mixed rain and         images for the last half century. However, the cloud
    snow, and a thunderstorm. The combination of strong      symbols document a fundamentally different and
    winds along and ahead of the warm front (northeast       no less important perspective—how the sky looks
    of the low center) combined with these wild weather      from below, which is how people experience clouds
    conditions were clearly dangerous for the boats off-     from the ground and how pilots experience them
    shore of this highly maritime country. The map itself,   in the air as their planes land and take off. This
    with its symbols neatly plotted by hand, not only had    human perspective is hard to quantify or measure
    the practical ability to tell the story of an oncoming   by any existing instrument. Another factor is the
    storm, but it did so with visual elegance.               automation of weather stations, which eliminate the
        This elegance of weather mapping continued as        human observer, trained to report the state of the sky
    long as maps were plotted and analyzed by hand.          and the nature of the current weather. Automation
    In addition to routine weather mapping in forecast       can indicate a few aspects of weather—for example,
    offices, the National Weather Service (formerly          whether or not it is raining—but not the more subtle
    U.S. Weather Bureau) for many years published one        aspects indicated in the 100 standardized weather
    hand-generated map every day that could be ob-           symbols in Fig. 21 or the 27 types of clouds defined
    tained through the mail by subscription. This Daily      in Fig. 14. Thus, neither the nature of the state of
    Weather Map was plotted and analyzed in the same         the sky nor the more subtle and qualitative aspects

    AMERICAN METEOROLOGICAL SOCIETY                                                          DECEMBER 2019         | ES441
of weather experienced at the ground are being plotting are interesting in their curiously different
plotted on maps. Instruments such as vertically histories: the convergence of naturalist art and
pointing cloud radars could partially replace the scientific inquiry that led to symbols for clouds
human-based evaluation of the state of the sky, but overhead, and the use of abstract written symbols
as of now there is no systematic network of such to represent weather on the ground. Despite these
observations in place anywhere in the world. very different evolutions, these symbols have proven
Advances in models, satellite data, physical un- themselves as a way to depict the human experience
derstanding, and measurement techniques have led of the surrounding atmosphere. The wonderment of
to great successes in weather forecasting, warnings J. H. Lambert and Luke Howard, and the determined
of extreme events, and climate assessment over the efforts of the early cloud enthusiasts Ley, Hildeb-
last century. But along with this march of technology randsson, and Abercromby laid the groundwork
weather maps may have lost some ability to convey for international coding and mapping of clouds and
the everyday human experience of weather. The weather by the IMO and WMO. Over the course of
disappearance of the qualitative observations repre- more than two centuries, these desires and efforts
sented by symbols at individual weather stations has led to the 27 clever symbols representing different
made it more difficult to assess from a map how the and physically distinct cloud types and the 100 types
clouds and weather are affecting people looking out of weather events as seen by a human observer. How-
the window and up at the sky. ever, the implementation and use of these symbols
An often-forgotten but important application of that evolved in the first two-thirds of the twentieth
weather mapping is how it aids historians, social century, when weather mapping was done by hand,
science researchers, and even fiction writers, who are have fallen away with increased automation and
crucial to the recording of life on Earth. These schol- the disappearance of cloud symbols from the Daily
ars and artists depend on library resources to carry Weather Map. Whether the use of cloud and weather
out their work looking into past events. For example, symbols on surface weather maps can or should be
one might want to know what the weather was like revitalized in our hypertechnological age is unclear,
in the United States on the day of the assassination though we think it would be beneficial to restore the
of John F. Kennedy, the attack on the World Trade human element that these symbols represent. In any
Center, the launch of the first Apollo moon landing, case, the peculiar and interesting history of how the
or some less notable but significant event (e.g., RAH’s somewhat enigmatic symbols came about and were
birthdate; Fig. 24). A quick look at an archived doc- used in the age of manual weather plotting seem
ument like the bygone hand-plotted Daily Weather worth remembering in this centennial year, and the
Map efficiently and simply conveyed that information AMS ties, scarves, and umbrellas remain a link to
in terms not only of temperature, wind, humidity, this rich history.
and pressure, but also in what kinds of clouds and
weather formed the background scene of the event ACKNOWLEDGMENTS. We thank the following
as experienced by people on the ground. Satellite or individuals and organizations for help in making this
radar imagery does not convey this human experience article possible: Catherine Ross of the Met Office Library
of weather, which is so important to artists and writ- Archives for making the Abercromby photos available;
ers. Meteorology is an important part of the human Brianna Cregle of the Rare Books and Special Collections,
experience, and losing the art of weather map plotting Firestone Library, Princeton University, for providing an
has implications that affect our ongoing understand- images of the Espy Map; Noel Keenlyside and Jan Asle
ing of the human condition. Dropping the cloud Olseth of the Geophysical Institute, University of Bergen
symbols from the Daily Weather Map has removed and the Norwegian Meteorological Institute for providing
useful information about the sky overhead. Fortu- vintage weather maps from the Bjerknes era; the University
nately, the weather symbols have been retained and of Washington Interlibrary Loan for obtaining copies of
access to the Daily Weather Map is available online the cloud atlases of the 1890s; and Beth Tully for refining
(www.wpc.ncep.noaa.gov/dailywxmap/index.html). the graphics and editing the text.
This access is important for maintaining the ability
to understand, record, and appreciate the experience
of the natural world. REFERENCES
Abercromby, R., 1887: Suggestions for an international
CONCLUSIONS. The cloud and weather sym- nomenclature of clouds. Quart. J. Roy. Meteor. Soc.,
bols used in the age of handcrafted weather map 13, 154–166, https://doi.org/10.1002/qj.4970136212.
ES442 | DECEMBER 2019Anderson, K., 2006: Mapping meteorology. Intimate Monmonier, M., 1988: Telegraphy, iconography, and
Universality: Local and Global Themes in the History the weather map: Cartographic weather reports
of Climate and Weather, Science History Publica- by the United States Weather Bureau, 1870–1935.
tions, 69–92. Imago Mundi, 40, 15–31, https://doi.org/10.1080
Edwards, P. N., 2010: A Vast Machine: Climate Models, /03085698808592636.
Climate Data, and the Politics of Global Warming. —, 1999: Air Apparent: How Meteorologists Learned
MIT Press, 518 pp. to Map, Predict, and Dramatize Weather. University
Espy, J. P., 1838: Report of the Committee on Meteorology. of Chicago Press, 324 pp.
J. Franklin Inst. State Pa. Mech. Regist., 22, 161–175. Pouncy, F. J., 2003: A history of cloud codes and sym-
Fleming, J. R., 1990: Meteorology in America, 1800-1870. bols. Weather, 58, 69–80, https://doi.org/10.1256
Johns Hopkins University Press, 264 pp. /wea.219.02.
—, 2016: Inventing Atmospheric Science: Bjerknes, Rees, R., 1982: Constable, Turner, and views of nature
Rossby, Wexler, and the Foundations of Modern Me- in the nineteenth century. Geogr. Rev., 72, 253–269,
teorology. MIT Press, 296 pp. https://doi.org/10.2307/214526.
Hildebrandsson, H. H., 1887: Remarks concerning Richards, G. W., and C. Abbe, 1898: A form for the
the nomenclature of clouds for ordinary use. record of cloud observations. Mon. Wea. Rev., 26,
Quart. J. Roy. Meteor. Soc., 13, 148–154, https://doi 456–457, https://doi.org/10.1175/1520-0493(1898)26
.org/10.1002/qj.4970136211. [456b:AFFTRO]2.0.CO;2.
—, W. Köppen, and G. Neumayer, 1890: Wolken-Atlas Rossow, W. B., and R. A. Schiffer, 1999: Advances in un-
(Cloud Atlas). Gustav W. Seitz, 12 pp., plus plates. derstanding clouds from ISCCP. Bull. Amer. Meteor.
—, A. Riggenbach, L. Teisserenc de Bort, 1896: Inter- Soc., 80, 2261–2287, https://doi.org/10.1175/1520-04
national Cloud Atlas. Gauthier-Villars et Fils, 31 pp., 77(1999)0802.0.CO;2.
plus 14 sheets of colored maps. Ruskin, J., 1839: Remarks on the present state of me-
Houze, R. A., Jr., 2014: Cloud Dynamics. 2nd ed. Else- teorological science. Trans. London Meteor. Soc., 1,
vier, 432 pp. 56–59.
Howard, L., 1803: On the modifications of clouds, Scott, R. H., 1892: Report on the International Mete-
and on the principles of their production, suspen- orological Conference at Munich, August 26th to
sion, and destruction; being the substance of an September 2nd, 1891. Quart. J. Roy. Meteor. Soc., 18,
essay read before the Askesian Society in 1802–3. 1–17, https://doi.org/10.1002/qj.4970188101.
Philos. Mag., 16, 344–357, https://doi.org/10.1080 Shaw, S. N., 1926: Meteorology in History. Vol. 1, Manual
/14786440308676358. of Meteorology, Cambridge University Press, 386 pp.
Jelinek, C., and Coauthors, 1905: Jelinek’s Anleitung Zur Talman, C. F., 1916: Meteorological symbols. Mon. Wea.
Ausführung Meteorologischer Beobachtungen Nebst Rev., 44, 266–274, https://doi.org/10.1175/1520-0493
Einer Sammlung Von Hilfstafeln. Druck der Kaiser- (1916)442.0.CO;2.
lich-Königlichen Hof- und Staatsdruckere, 227 pp. WMO, 2017: Manual on codes: International codes.
Lambert, J. H., 1771: Exposé de quelques observations Annex II to the WMO technical regulations, Part
qu’on pouroit faire pour répandre du jour sur la A—Alphanumeric codes. WMO Rep. 306, Vol. I.1,
météorologie. Nouv. Mém. Acad. Roy. Sci. B.-L. 480 pp., www.wmo.int/pages/prog/www/WMO
Berlin, 2, 60–66. Codes/WMO306_vI1/Publications/2017update
Ley, W. C., 1894: Cloudland: A study on the structure /WMO306_vI1_2011UP2017_en.pdf.
and characters of clouds. Edward Stanford, 208 pp.
AMERICAN METEOROLOGICAL SOCIETY DECEMBER 2019 | ES443LOGIN JOIN AMS HOME MOBILE PAIRING ADMIN HELP
Search the Site
Advanced Search
J OURNALS O NLINE Journals Publish Subscribe About
Home > BAMS > December 2019 > December 2019
Cloud and Weather Symbols in the Historic Language of Weather Map Plotters
< Previous Article Next Article >
Cloud and Weather Symbols in the Historic Language of
Weather Map Plotters
Robert A. Houze Jr
University of Washington, Seattle, Washington Share this Article
Rebecca Houze
Northern Illinois University, DeKalb, Illinois Share |
https://doi.org/10.1175/BAMS-D-19-0071.1 Most Read Most Cited
Final Form: 20 August 2019
Published Online: 7 January 2020
Most Read BAMS Articles
(posted in the last 12 months)
Tropical Cyclones and Climate Change
Assessment: Part I: Detection and Attribution
Abstract Full Text Supplementary Materials (9538 times)
Knutson et al.
Bulletin of the American Meteorological
PDF Society
October 2019, Vol. 100, No. 10
MSWEP V2 Global 3-Hourly 0.1°You can also read