INTERFACIAL SUPERCOOLING AND THE PRECIPITATION OF HYDROHALITE IN FROZEN NACL SOLUTIONS AS SEEN BY X-RAY ABSORPTION SPECTROSCOPY - THE CRYOSPHERE
←
→
Page content transcription
If your browser does not render page correctly, please read the page content below
The Cryosphere, 15, 2001–2020, 2021
https://doi.org/10.5194/tc-15-2001-2021
© Author(s) 2021. This work is distributed under
the Creative Commons Attribution 4.0 License.

Interfacial supercooling and the precipitation of hydrohalite in
frozen NaCl solutions as seen by X-ray absorption spectroscopy
Thorsten Bartels-Rausch1 , Xiangrui Kong1,a , Fabrizio Orlando1,b , Luca Artiglia1 , Astrid Waldner1 ,
Thomas Huthwelker2 , and Markus Ammann1
1 Laboratory of Environmental Chemistry, Paul Scherrer Institut, Villigen PSI, Switzerland
2 Swiss Light Source (SLS), Paul Scherrer Institut, Villigen PSI, Switzerland
a now at: Department of Chemistry and Molecular Biology, Atmospheric Science,

University of Gothenburg, Gothenburg, Sweden
b now at: Omya International AG, Oftringen, Switzerland

Correspondence: Thorsten Bartels-Rausch (thorsten.bartels-rausch@psi.ch)

Received: 1 September 2020 – Discussion started: 27 November 2020
Revised: 3 March 2021 – Accepted: 4 March 2021 – Published: 23 April 2021

Abstract. Laboratory experiments are presented on the phase      has consequences for interfacial chemistry involving chlo-
change at the surface of sodium chloride–water mixtures at       rine as well as for any other reactant for which the sodium
temperatures between 259 and 241 K. Chloride is a ubiq-          chloride provides a liquid reservoir at the interface of envi-
uitous component of polar coastal surface snow. The chlo-        ronmental snow. Implications for the role of surface snow in
ride embedded in snow is involved in reactions that mod-         atmospheric chemistry are discussed.
ify the chemical composition of snow as well as ultimately
impact the budget of trace gases and the oxidative capac-
ity of the overlying atmosphere. Multiphase reactions at the
snow–air interface have been of particular interest in atmo-     1   Introduction
spheric science. Undoubtedly, chemical reactions proceed
faster in liquids than in solids; but it is currently unclear    Chemical cycling of halogens affects the composition of the
when such phase changes occur at the interface of snow with      troposphere and via this effect influences climate and impacts
air. In the experiments reported here, a high selectivity to     human health (Simpson et al., 2007; Abbatt et al., 2012; Saiz-
the upper few nanometres of the frozen solution–air inter-       Lopez and von Glasow, 2012; Simpson et al., 2015). Given
face is achieved by using electron yield near-edge X-ray ab-     the abundance of chloride in the form of sea salt over wide
sorption fine-structure (NEXAFS) spectroscopy. We find that      areas of the globe, the atmospheric chemistry of chlorine has
sodium chloride at the interface of frozen solutions, which      long raised interest in several multiphase reactions that liber-
mimic sea-salt deposits in snow, remains as supercooled liq-     ate chloride into chlorine species in the gas phase (Simpson
uid down to 241 K. At this temperature, hydrohalite exclu-       et al., 2007; Finlayson-Pitts, 2010). Chlorine has a direct role
sively precipitates and anhydrous sodium chloride is not de-     as a sink for ozone. Further, reactive chlorine species act as a
tected. In this work, we present the first NEXAFS spectrum       powerful oxidant on atmospheric cycles that destroy or pro-
of hydrohalite. The hydrohalite is found to be stable while      duce ozone and are relevant for the atmospheric oxidation
increasing the temperature towards the eutectic temperature      capacity (Finlayson-Pitts, 2003; Thornton et al., 2010). At-
of 252 K. Taken together, this study reveals no differences in   mospheric ozone is of concern because it directly impacts at-
the phase changes of sodium chloride at the interface as com-    mospheric composition, health, and climate (Simpson et al.,
pared to the bulk. That sodium chloride remains liquid at the    2007). Prominent examples of these reactions in the atmo-
interface upon cooling down to 241 K, which spans the most       sphere with chloride in sea salt or salt dust are shown in Fig. 1
common temperature range in Arctic marine environments,          and discussed in the following. Acid displacements, where
                                                                 nitric or sulfuric acid is taken up into the aqueous phase,

Published by Copernicus Publications on behalf of the European Geosciences Union.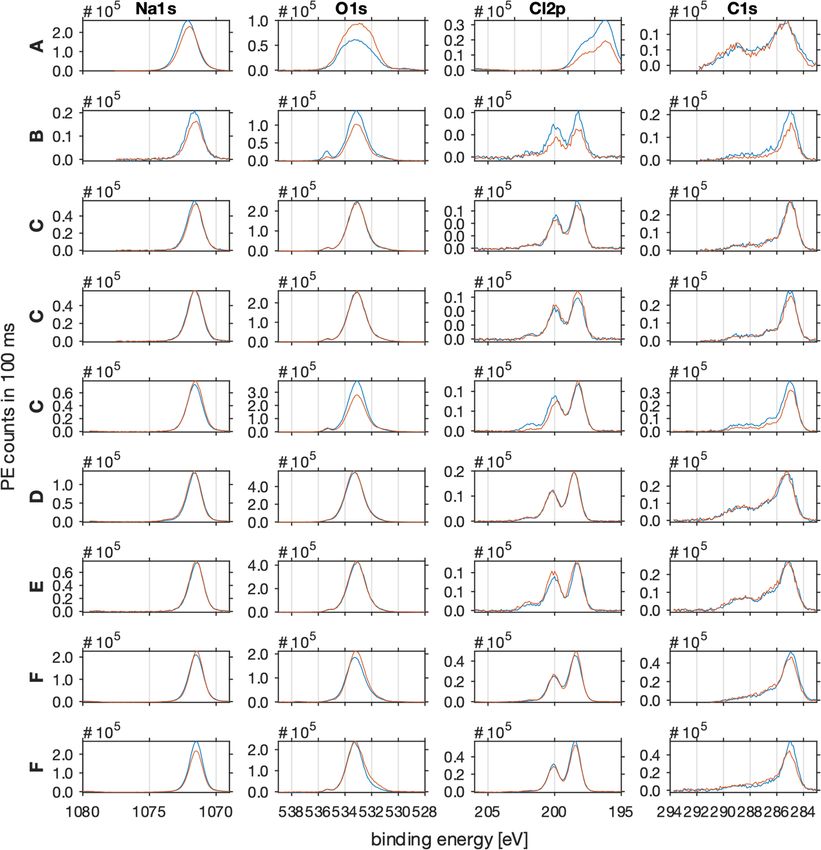
2002                                                                       T. Bartels-Rausch et al.: Interfacial supercooling

lead to the emission of hydrochloric acid to the gas phase.        gested limited availability of chloride as a consequence of
Further examples are reactions with OH radicals (Knipping          the precipitation in this surface snow. Further, Lopez-Hilfiker
et al., 2000; Halfacre et al., 2019) and with nitrogen oxides      and Thornton (2012) proposed the precipitation of sodium
(Osthoff et al., 2008). Common to all of these reactions is        chloride salts to explain the changes in the production yield
the generation of chlorine gases that either react with OH         of ClNO2 from the reaction of N2 O5 with saline frozen sys-
radicals or photolyse at wavelengths available in the tropo-       tems with temperature.
sphere to generate reactive chlorine (Fig. 1 and Finlayson-           More generally, it is not only the chlorine chemistry
Pitts, 2010). Given their importance, these multiphase reac-       that responds to the phase of sodium chloride present in
tions have been intensively investigated in laboratory studies     frozen systems both in the laboratory and in the environ-
over the last decade (Abbatt et al., 2012; Saiz-Lopez and von      ment. Oldridge and Abbatt (2011) showed that the rate of
Glasow, 2012; Simpson et al., 2015). One outcome of these          the heterogeneous reaction of ozone with bromide in sodium
investigations is the importance of reactions at the liquid–air    chloride–water mixtures is strongly reduced once the chlo-
interface as compared to those proceeding in the bulk. An ex-      ride salt precipitates below 252 K. The authors explained this
ample is the oxidation of chloride by OH radicals. In contrast     with the reduction in liquid volume that serves as a reaction
to the aqueous-phase reactions, it does not require the pres-      medium for the bromide in the sample due to the precipi-
ence of acid to proceed fast at the air–water interface (Laskin    tation of sodium chloride. Similarly, the photolytical reac-
et al., 2006).                                                     tion of nitroanisole with pyridine was found to depend on
   The relevance of halogen multiphase chemistry for the at-       the amount of liquid in frozen samples and thus to criti-
mosphere is not limited to chlorine. A more recent example is      cally respond to precipitation of sodium chloride (Grannas
the oxidation of bromide. Bromide is present in sea salt, is a     et al., 2007). Next to its role in atmospheric halogen chem-
key reactant in ozone depletions in polar atmospheres (Simp-       istry, sodium chloride is thus of further importance as salt to
son et al., 2015), and participates in atmospheric chlorine        establish and maintain liquid solutions at subfreezing tem-
chemistry by forming interhalogen compounds (Finlayson-            peratures. Its importance arises from its atmospheric abun-
Pitts, 2003). Oldridge and Abbatt (2011) have shown that a         dance but also because its eutectic temperature of 252 K cor-
Langmuir–Hinshelwood type surface reaction of ozone with           responds to typical springtime Arctic temperatures – a re-
bromide occurs at the liquid–air interface simultaneously          gion and time period where atmospheric halogen chemistry is
with a corresponding bulk reaction in the temperature range        most active. For example, at the Arctic coast near Utqiaġvik
of 263 to 248 K. A surface-active reaction intermediate was        (Alaska) temperatures have been reported to fluctuate be-
found to explain the high interfacial reactivity for the case      tween 247 K and 259 K within days (Custard et al., 2017).
of the reaction with ozone (Artiglia et al., 2017), while other    Another region of Earth’s cryosphere, where temperatures
bromine species may directly exhibit surface propensity on         drop below 252 K, is the troposphere (Thomas et al., 2019).
their own (Gladich et al., 2020). Clearly, this line of research   Wang et al. (2015) have proposed a significant role of tropo-
shows how reaction kinetics and mechanisms differ at the in-       spheric heterogeneous halogen chemistry on the ozone bud-
terface from those in the bulk and that heterogeneous chem-        get there. More recently, Murphy et al. (2019) have shown
istry is a key driver in atmospheric chemistry.                    that the quantity of sea-salt aerosols lifted to the upper tro-
   In the cryosphere, where the snowpack strongly impacts          posphere is small, casting some doubt on the environmental
the chemistry in the overlaying atmosphere (Dominé and             relevance of sea salt as a matrix for multiphase chemistry
Shepson, 2002; Thomas et al., 2019), halogen compounds are         there.
also found within the snow. Sea-salt components, a source             While the phase diagram of sodium chloride–water binary
of halogens in snow in coastal snowpack, might originate           mixtures and the thermodynamic stability domains of salt,
from migration from underlying sea ice or from deposition of       solution, and ice are well known (Koop et al., 2000a), the
wind-transported sea-spray aerosols (Dominé et al., 2004).         precise occurrence of nucleation and sodium chloride pre-
One characteristic of the cryosphere is its subfreezing tem-       cipitation is still debated (Koop et al., 2000a; Wise et al.,
peratures and the consequent precipitation of chemical con-        2012; Peckhaus et al., 2016). Figure 2 shows a part of the
stituents at a specific temperature, their eutectic temperature,   phase diagram of sodium chloride–water mixtures and can
as also observed in sea ice (Petrich and Eicken, 2009). It is      be used to illustrate the appearance of the individual phases.
known that the precipitations or phase changes of the reac-        Below 251.9 K, the eutectic temperatures of sodium chloride
tants critically impact the reactivity (Bartels-Rausch et al.,     (Koop et al., 2000a), solid sodium chloride dihydrate (hy-
2014; Kahan et al., 2014). Reduced chlorine production in          drohalite, NaCl q2H2 O), and solid water (ice) are the ener-
frozen systems was observed by Wren et al. (2013) and by           getically favoured phases. Between the eutectic temperature
Sjostedt and Abbatt (2008), at temperatures below the eutec-       and the so-called liquidus line, ice and sodium chloride so-
tic temperature of sodium chloride–water mixtures in labora-       lutions (brine) co-exist. The ice will melt completely above
tory experiments that was attributed to the precipitation of the   the liquidus line, and an aqueous sodium chloride solution
salt. In an Arctic field study, Custard et al. (2017) observed     is the only phase present. The focus of this work was to ex-
reduced Cl2 production when temperatures dropped and sug-          perimentally observe phase changes of sodium chloride be-

The Cryosphere, 15, 2001–2020, 2021                                                   https://doi.org/10.5194/tc-15-2001-2021
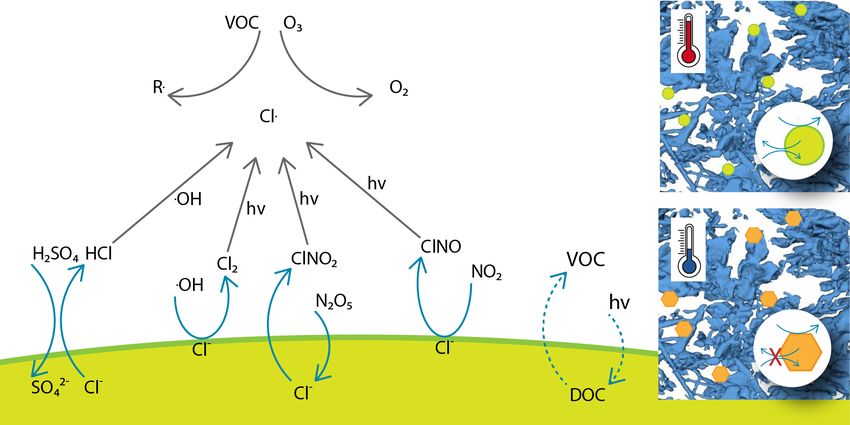
T. Bartels-Rausch et al.: Interfacial supercooling                                                                                       2003

Figure 1. Simplified scheme of multiphase reactions liberating chlorine from sea-salt deposits to the atmosphere and subsequent reactions of
chlorine with impacts on the ozone budget and air quality. These reactions may occur both in the bulk phase and at the air–deposit interface
for liquid particles. The sea salt may also maintain a liquid phase for the reaction of other reactants such as the photolysis of organics. The
inserts illustrate sea-salt deposits in snow and how phase changes from solid (orange hexagon) to aqueous solutions (green circle) impact the
chemical reactivity. See text for details and references.

low the eutectic temperature. A typical experimental proce-               this work on the relative humidity the sample was exposed to.
dure started with a dry sample of anhydrous sodium chloride               The relative humidity is a measure of the partial pressure of
(halite, NaCl) which was exposed to increasing gas-phase                  water relative to the vapour pressure of (supercooled) liquid
water at a constant temperature of 259 K. By absorbing water              at the same temperature (Marti and Mauersberger, 1993). An
from the surrounding air, a phase transition from the solid salt          advantage of this experimental approach with environmental
to a liquid solution (deliquescence) took place. Upon increas-            relevance is that the relative humidity precisely matches that
ing the gas-phase water dosing further (Fig. 2, red arrow), ice           in the atmosphere in contact and in thermodynamic equilib-
crystallized and a two-phase system of ice and brine occurred             rium with ice clouds or snow cover, because the relative hu-
(Fig. 2, red cross). After probing the sample at this position in         midity is a sole function of temperature in the presence of
the phase diagram, temperature was lowered and the dosing                 ice. Therefore, the chemical concentration of such particles
of the water vapour was adopted to move along the liquidus                exactly matches those of the same composition in snow or in
line to below the eutectic temperature. During this cooling               the atmosphere under environmental conditions.
period, salt concentration and volume of the brine changes.                  Koop et al. (2000a) were the first to show that because
Such changes with varying relative humidity (hygroscopic                  precipitation of sodium chloride can be kinetically hindered,
growth) have long been discussed for aerosols in the tro-                 supercooled sodium chloride solutions in the presence of ice
posphere. In other words, the concentration of the sodium                 can prevail down to 240 K. Precipitation of sodium chloride
chloride in solution changes with temperature to maintain                 may not occur even though temperature has dropped below
both phases in equilibrium. At the air–ice interface where                the eutectic temperature where the solid is the thermodynam-
both phases are in equilibrium with water vapour in the gas               ically favoured phase. Cho et al. (2002) have observed a liq-
phase, this can be understood by considering that the aque-               uid fraction in sodium chloride–water mixtures at even lower
ous sodium chloride solution and ice need to have the same                temperatures of between 228 and 273 K based on the eval-
vapour pressure. Otherwise, the phase with the higher wa-                 uation of 1 H-NMR signals. Cho et al. (2002) proposed the
ter vapour pressure would vanish by evaporation and the one               presence of liquid below the eutectic temperature to be an
with the lower vapour pressure would grow by condensation.                interfacial phenomenon, stabilized by surface forces in anal-
The vapour pressure of ice decreases with decreasing tem-                 ogy to the disordered interface observed for neat ice surfaces
perature, while that of an aqueous solution decreases with                when approaching the melting point (Bartels-Rausch et al.,
increasing concentration of solute. With a fixed amount of                2014).
sodium chloride present in our experiments and also in indi-                 The goal of this study is to investigate the precipitation
vidual sodium chloride deposits in snow, the amount of liquid             and the occurrence of liquid features in sodium chloride–
is consequently given by temperature (Koop et al., 2000a).                water binary mixtures in the interfacial region. Both Cho et
Because relative humidity is such a strong driver of the hy-              al. (2002) and Koop et al. (2000a) have applied methods that
groscopic growth, we base the discussion of phase changes in              are not specifically sensitive to the interface but probe the

https://doi.org/10.5194/tc-15-2001-2021                                                          The Cryosphere, 15, 2001–2020, 2021
2004 T. Bartels-Rausch et al.: Interfacial supercooling
that is present in equilibrium with the sodium chloride solu-
tion, and thus small fractions of liquid might have been dif-
ficult to detect. In this work, we therefore discuss Cl K-edge
NEXAFS that has previously been used to inspect the chem-
ical speciation of chlorine in glasses and in coal (Huggins
and Huffman, 1995; Evans et al., 2008). Interest in the local
environment of chloride at the interface in sodium chloride–
water binary mixtures also comes from earlier work on nitric
and hydrochloric acid adsorbed at the ice–air interface. We
have shown that nitrate and chloride form solvation shells
with a hydrogen-bonding structure similar to that in aqueous
solutions in the interfacial region of ice at concentrations low
enough to prevent melting (Krepelova et al., 2010b; Kong et
al., 2017). The aim of this study is thus also to investigate the
occurrence of solvated chloride at the interface of sodium
chloride–water mixtures at temperatures close to the eutectic
one. Motivation comes from the role of heterogeneous chem-
istry in atmospheric science in general and in particular on
the impact that the microchemical environment has on the
reactivity.
2 Experimental part
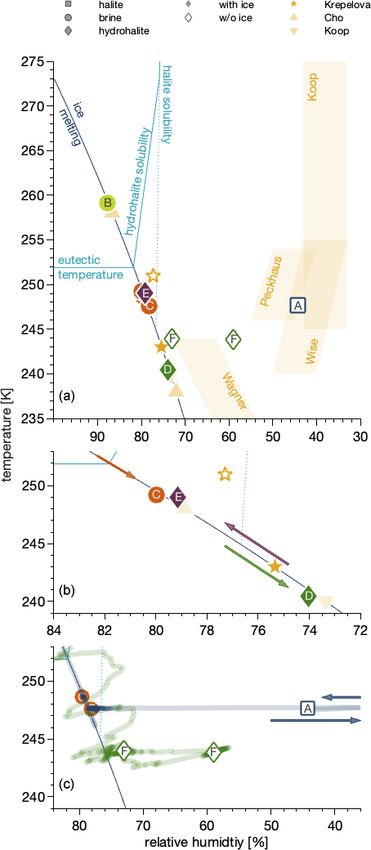
Figure 2. Phase diagram of the sodium chloride–water binary sys- Experiments were performed at the PHOENIX beamline of
tem. The data show the freezing-point depression of sodium chlo- the Swiss Light Source (SLS) at the Paul Scherrer Insti-
ride solutions (filled yellow circles) and give the concentration of tute using the near-ambient pressure photoemission (NAPP)
an aqueous sodium chloride solution in equilibrium with ice in the set-up previously described (Orlando et al., 2016). NAPP is
temperature range of 273 to 254 K (Rumble, 2019). The dark-blue
equipped with a differentially pumped electron analyser (Sci-
lines indicate the phase boundaries (Koop et al., 2000b; Rumble,
2019); that is they denote the so-called liquidus and solidus line, re-
enta R4000 HiPP-2). The central feature of NAPP is a flow-
spectively, and thus show the temperature and concentration range through cell with a sample holder, the temperature of which
where ice and aqueous sodium chloride solutions co-exist. The eu- is computer-controlled by a flow of cooled helium gas. The
tectic temperature of sodium chloride–water binaries is 251.9 K measurements were performed with partial pressures of wa-
(Koop et al., 2000a). Also shown is a typical experimental proce- ter between 0.3 and 1.8 mbar in the flow-through cell and
dure (red arrows and cross). temperatures of the sample between 259 and 241 K.
2.1 Sample preparation and water dosing
bulk. Near-edge X-ray absorption fine-structure (NEXAFS)
spectroscopy is inherently sensitive to the upper few nanome- To prepare a sample, 1 µL of a 2.12 g sodium chloride (Fluka
tres of interfaces when detecting electrons as performed in TraceSELECT 38979-25G-F) solution in 80 mL of water
this work. Oxygen K-edge NEXAFS spectra of H2 O are an (Fluka TraceSELECT 142100-12-F) was dropped at the cen-
established tool to investigate the hydrogen-bonding struc- tre of the sample holder and dried at 60 ◦ C. The sample
ture of water and ice with its clear differences for solid and holder was then moved into the flow-through cell and kept
liquid water (Bluhm et al., 2002; Nilsson et al., 2010; Kre- at ultra-high vacuum and at 60 to 80 ◦ C for 45 min to re-
pelova et al., 2013; Newberg and Bluhm, 2015; Orlando et move volatile impurities. Water vapour was dosed to the
al., 2016; Bartels-Rausch et al., 2017; Ammann et al., 2018; flow-through cell via a 0.8 mm i.d. steel capillary from the
Waldner et al., 2018). In our earlier NEXAFS study (Kre- vapour above liquid water (Fluka TraceSELECT 142100-12-
pelova et al., 2010a), it was shown by probing the X-ray ab- F) in a vacuum-sealed, temperature-controlled glass reser-
sorption of oxygen atoms in sodium chloride–water binary voir. Before dosing, the water was degassed by four freeze-
mixtures that the hydrogen-bonding network did not reveal pump–thaw cycles. The water dosing and thus the partial
the presence of any liquid features at the interface below the pressure or relative humidity that the sample were exposed
eutectic temperature. Interpretation of these oxygen NEX- to was varied by setting the temperature of the reservoir to
AFS spectra was complicated by the appearance of crystal change the flux of water vapour into the experimental cell.
water in the hydrohalite and by the presence of adsorbed Pressure in the flow-through cell was monitored by a ca-
H2 O. Also, the oxygen spectra might be dominated by ice pacitance manometer (Baratron 626A) with a measurement
The Cryosphere, 15, 2001–2020, 2021 https://doi.org/10.5194/tc-15-2001-2021T. Bartels-Rausch et al.: Interfacial supercooling 2005
range from 5 × 10⁻⁴ to 10 mbar and an accuracy of 0.25 % trons at 2370–2390 eV, which corresponds to the KL2,3L2,3
of the reading. Temperature was monitored with a Pt1000 transition in chlorine (Cleff and Mehlhorn, 1969). Detecting
sensor located at the edge of the sample holder. The sensor electrons, as carried out in this work, makes X-ray absorption
was calibrated prior to the experiments by growing ice on inherently surface sensitive, because electrons have a limited
the sample holder and noting its vapour pressure which is a escape depth in matter (Ammann et al., 2018). The escape
direct measure of the temperature at the sample spot (Marti depth can be quantified by relating it to the inelastic mean
and Mauersberger, 1993). During the experiments, the cali- free path (IMFP) of electrons in matter and to the take-off an-
bration was confirmed when ice was present. At 253 K, the gle of detected electrons relative to the surface normal. The
offset between the temperature reading and calibration was IMFP of electrons with a kinetic energy of 2380 eV is about
found to be 4.3 ± 0.2 K. 7 nm in NaCl and in ice (Tanuma et al., 1991). The take-off
angle of electron detection is 30◦ in our set-up (Orlando et
2.2 X-ray-excited electron spectroscopy al., 2016), which gives an escape depth of 6 nm, meaning
that cumulatively, 95 % of the electrons detected originate
Partial Auger–Meitner electron yield NEXAFS spectra at the from 18 nm, with an exponentially decreasing contribution
Cl K-edge were acquired with a fixed kinetic-energy window from the surface towards the bulk. In the following, we re-
of 2370 to 2390 eV, which includes the KL2,3L2,3 Auger– port the NEXAFS spectra derived from this interfacial region
Meitner peak of chlorine. The pass energy and dwell time of NaCl–water binary mixtures to discuss changes in the sol-
were set to 200 eV and 300 ms, respectively. The distance vation of chloride by water as we explore the regions of the
of the sample to the electron analyser inlet (working dis- phase diagram where precipitation of sodium chloride has
tance) was 1 mm. The electron analyser was operated with been described for bulk samples.
an electron sampling aperture with a diameter of 500 µm, All chlorine K-edge spectra show a strong absorption peak
which results in sampling roughly an area on the icy sam- at 2825–2830 eV (region I), the absorption edge, correspond-
ple with a diameter of 500 µm from which the emitted elec- ing to the transition of electrons from the 1s orbital to the
trons reach the detector. NEXAFS spectra were measured empty 4p orbitals. Halite salt, in Fig. 3a, shows a strong ab-
by sweeping the incident X-ray photon energy across the sorption in region I and a characteristic feature at 2838 eV
chlorine K-edge from 2815 to 2845 eV with steps ranging (region II) (Huggins and Huffman, 1995; Evans et al., 2008).
from 0.2 to 1 eV. The NEXAFS spectra were processed by The difference in the relative intensity of region I as com-
dividing by the photon flux (I0 ) as derived in situ using a pared to the intensity at photon energies > 2830 eV between
Ni-coated membrane, subtracting the mean pre-edge inten- Fig. 3a and Huggins and Huffmann (1995) comes from
sity as background, and normalizing to the mean intensity at the latter using fluorescence as a detection mode. Detect-
2830 to 2833 eV X-ray photon energy. Photoemission spec- ing X-ray absorption with fluorescence probes deeper into
troscopy (XPS) spectra of O1s, Cl2p, Na1s, C1s, and Au4f the bulk of the samples and therefore often suffers from self-
were recorded at an incident X-ray photon energy of 2200 eV absorption which leads to fewer signal intensities at the ab-
and with a pass energy of 100 eV and a dwell time of 120 ms. sorption edge (region I).
To quantify, a linear background was applied, and the photoe- The small feature at 2821 eV can be assigned to C–Cl
mission signal was integrated in MATLAB without any peak bonds that may form in situ due to reactions involving sec-
fitting. ondary electrons and organic impurities (Fujimori et al.,
2010). The sample composition in the interfacial region was
3 Results and discussion further investigated by X-ray photoemission spectroscopy.
The C1s and Cl2p spectra support the presence of C–Cl com-
3.1 NEXAFS of brine, halite, and hydrohalite pounds in the samples (Appendix A): a small feature in the
Cl2p spectra at a binding energy 3 eV higher than the main
Figure 3 shows chlorine K-edge X-ray absorption spectra chlorine signal might be attributed to organic carbon species.
of sodium chloride salts and of frozen NaCl–water binary The C1s photoemission spectra show a feature at a binding
mixtures in the presence of ice. This NEXAFS spectroscopy energy 1.5 eV higher than the main feature, typical of C–
probes the X-ray absorption by chlorine atoms, correspond- Cl compounds. The main feature of the C1s photoemission
ing to the resonant excitation of core electrons into unoccu- spectra is attributed to C–H bonds, the dominant component
pied molecular orbitals. As exactly those outer orbitals are of adventitious carbon that forms in a cascade of reactions
forming chemical bonds, NEXAFS spectra directly reflect with secondary electrons during the experiments. A further
changes to the local chemical environment and structural ar- source of carbon might be omnipresent traces of carbon in the
rangement. NEXAFS spectroscopy of halogen salts has thus NaCl and introduced when preparing the NaCl samples. The
been used to discuss their phase and chemical speciation in atomic ratio of the total carbon to oxygen from water present
geological examples (Huggins and Huffman, 1995; Evans et at the interface was below 0.25, except for samples in Fig. 3a
al., 2008). In this work, the X-ray absorption spectra were and f where total carbon-to-oxygen atomic ratios were 0.5–
derived by recording the intensity of Auger–Meitner elec- 0.75. Adsorbed water molecules were present at the interface
https://doi.org/10.5194/tc-15-2001-2021 The Cryosphere, 15, 2001–2020, 20212006 T. Bartels-Rausch et al.: Interfacial supercooling
of all samples, and ice or liquid water formed in some sam- Upon cooling further to 241 K, the spectrum changed sig-
ples, as gaseous water was present in all experiments with nificantly. The NEXAFS spectrum in Fig. 3d shows a wide
pressures between 0.3 and 1.8 mbar. The atomic ratio was peak in region I with two well-resolved features about 3 eV
derived based on the measured C1s / O1s photoemission in- apart. That both features have a similar intensity makes
tensities and a calibration to account for the analyser effi- this spectrum clearly distinct from those of an aqueous
ciency and total X-ray photoionization cross section using NaCl solution with its decreasing trend of absorption in re-
C1s / O1s photoemission intensities of 0.8 mbar CO2 gas fol- gion I. Compared to the spectrum of aqueous NaCl solutions
lowing a procedure used before (Krepelova et al., 2013). Di- (Fig. 3b, c), the absorption edge is shifted to higher pho-
rect comparison between the individual samples and estima- ton energies in the spectrum in Fig. 3d. The absence of a
tion of surface coverages of the carbon impurities is ham- feature in region II makes the spectrum in Fig. 3d distinct
pered by the varying water content at the sample’s interface from the spectrum of anhydrous NaCl salt. Notably, the spec-
as adsorption and water uptake varies with the individual rel- trum quality is greatly improved and is similar to that of the
ative humidity settings. solid, anhydrous halite sample (Fig. 3a). One factor impact-
The spectrum of sodium chloride in aqueous solutions, ing the spectral quality is the stability of the sample during
Fig. 3b, shows a broader absorption peak in region I com- the NEXAFS acquisition. The analysis of the Cl2p photoe-
pared to the spectra of the halite and a second feature at mission spectra acquired before and after each NEXAFS run
2840 eV (region III) (Huggins and Huffman, 1995). In this showed that the amount of chlorine detected in the sample
work, the NEXAFS spectrum of NaCl in aqueous solutions volume fluctuated by less than 10 %, between 0 % and 9 %,
was recorded in a solution–ice binary mixture based on the in samples shown in Fig. 3c–f (Appendix A). For compar-
phase diagram (see Sect. 3.2, “Efflorescence at the inter- ison, samples in Fig. 3a and b showed a decrease of 39 %
face”). Based on freezing-point depression data, the con- and 43 % in the integrated Cl2p signal intensity from prior
centration of sodium chloride in such an aqueous solution to to after, respectively, the NEXAFS was recorded. Possi-
in equilibrium with ice is 3.5 mol L−1 (Rumble, 2019). The ble reasons for these trends are an increase in adsorbed water
spectrum in Fig. 3b generally agrees with the X-ray absorp- with time masking the intensity of the underlying chlorine
tion spectra reported for 0.1 and 1 mol L−1 aqueous solutions (Fig. 3a) and changes in the distance of the sample to the
(Huggins and Huffman, 1995) as it captures the general de- electron analyser with time leading to a reduction in the in-
crease in intensity in region I with excitation energy and the tensities of all compounds (Fig. 3b). Both processes would
increase in absorption in region III (Fig. 3). Discussing dif- also affect the NEXAFS signal by inducing changes in inten-
ferences in the hydration structure of chloride at the water– sity with time. Direct quantitative comparison is beyond the
air interface as compared to the bulk solution is beyond the scope of this work and is hampered by the different probing
scope of this work. Harada et al. (2011) have reported differ- depths of XPS and NEXAFS as given by the kinetic energy.
ences in the hydration structure of Br− at the aqueous surface We assign the spectrum in Fig. 3d to that of sodium
compared to in bulk. Due to the low spectrum quality, evident chloride dihydrate (hydrohalite, NaCl q2H2 O). The NEXAFS
by the wiggles in region I, we refrain from discussing the spectrum of the hydrohalite has to the best of our knowl-
two distinct features in region I, at 2824 and 2829 eV, that edge not been described before. The double-peak feature in
have been observed in previous work on NEXAFS spectra region I, which we observe in this work, is typical of other
of aqueous chloride solutions (Huggins and Huffman, 1995; chloride hydrates such as MnCl2 q4H2 O, CaCl2 q2H2 O, and
Antalek et al., 2016). MgCl2 q6H2 O (Evans et al., 2008). It is also present in the
Figure 3c–e show NEXAFS spectra acquired in the ice sta- NEXAFS spectra of sodium chloride solutions (Huggins and
bility domain at temperatures below the eutectic temperature Huffman, 1995), with a different ratio of the two features
of 251.9 K (Koop et al., 2000a). By comparing these spectra as observed here for the hydrohalite. Antalek et al. (2016)
to the spectra in Fig. 3a and b, the phase of the sodium chlo- have explained this double-peak feature in NEXAFS spectra
ride in the presence of ice below the eutectic temperature will of aqueous chloride solutions by the formation of two distinct
be discussed. When cooling to 248–249 K from above the eu- solvation shells with two distances between the chloride and
tectic temperature, the NEXAFS spectrum resembles that of the solvating water molecules based on NEXAFS and ex-
a typical aqueous solution (Fig. 3c). Figure 3c shows an av- tended X-ray absorption fine-structure spectroscopy as well
erage of three individual NEXAFS spectra which still show as molecular dynamics simulations. We propose here that the
substantial scatter that results in a low spectra quality. We NEXAFS spectra of the hydrohalite can be understood based
assign the spectral quality to the low amount of salt within on the same argument, as the chloride in NaCl q2H2 O is co-
the interfacial region and to potential thermal circulations ordinated by two sodium and four water molecules with two
and thus redistribution of the liquid during the measurements distinct distances of Cl to the neighbouring oxygen of the
upon irradiation by the beam. Despite this uncertainty, the water molecules (Klewe et al., 1974).
results in Fig. 3a–c allow us to clearly differentiate between Figure 3e shows a spectrum after warming the sample back
solid halite and aqueous solutions. to 249 K in the presence of ice. Clearly, the observed shape
in region I shows that hydrohalite and not liquid brine is the
The Cryosphere, 15, 2001–2020, 2021 https://doi.org/10.5194/tc-15-2001-2021T. Bartels-Rausch et al.: Interfacial supercooling 2007
Figure 3. Partial electron yield chlorine K-edge NEXAFS spectra of the sodium chloride–water binary system: (a) Sample A – solid NaCl
at 248 K and 44 % relative humidity (0.34 mbar water vapour pressure). (b) Sample B – Aqueous NaCl solution in equilibrium with ice
at 88 % RH (1.82 mbar) and 259 K. (c) Sample C – an averaged spectrum at the thermodynamic ice stability line at 248 K to 249 K and
78 % (0.60 mbar) to 80 % (0.71 mbar) RH. (d) Sample D – an individual spectrum upon further cooling to 241 K and 74 % RH (0.29 mbar).
(e) Sample E – an individual spectrum upon heating back to 249 K in the ice stability domain at 79 % RH (0.69 mbar). (f) Sample F – the
averaged spectrum at 244 K and a RH of 59 % (0.32 mbar) and 73 % (0.40 mbar), lower than the ice stability domain. See Fig. 4 for precise
measurement settings. The shaded coloured areas of the graphs in (c) and (f) denote the standard deviation of three and two repeated NEXAFS
acquisitions. Also shown for comparison are NEXAFS spectra of NaCl salt and aqueous solutions that were detected in a fluorescence mode
and not via partial electron yield (Huggins and Huffman, 1995, denoted as Huggins (1995) in the figure). The brownish shaded area (I–III)
highlights regions in the NEXAFS spectra discussed in the text. The grey-shaded area at 2821 eV highlights the photon energy region where
carbon–chlorine bonds from carbon contamination might show an absorption feature (see text for details).
dominant phase of this sample. In Fig. 3f an averaged spec- phase diagram. Generally, we have observed solid sodium
trum at 244 K in the absence of ice is shown; again the shape chloride as halite or hydrohalite in the temperature range of
is in good agreement with the spectrum shown in Fig. 3d. 241 to 249 K and at 44 % to 79 % RH and as brine in the
We would like to note the excellent reproducibility of the temperature range of 248 to 259 K and RH of 78 %–88 %.
spectra as seen in Fig. 3f by the small standard deviation of Interestingly, the NEXAFS spectra have revealed the dom-
two samples (shaded area). In summary, we have clearly pre- inant presence of brine in one sample and of hydrohalite in
sented three different chlorine K-edge NEXAFS spectra and other samples below the eutectic temperature. This clearly
argued that these derive from the halite, chloride solution, shows that not only the temperature and relative humidity
and hydrohalite. Hydrohalite at the air–ice interfacial region but also the trajectory to reach these settings (or the history
was thus observed in the temperature range 241–249 K. of the sample) determine the phase. Therefore, we will de-
tail the humidity and temperature history of each sample in
3.2 Efflorescence at the interface the following. Also, we will compare our findings to the ex-
tensive literature work of observed phases in the presence
Now that we have identified halite, the hydrohalite, and chlo- and absence of ice. This discussion will be based on the
ride in an aqueous solution by means of the NEXAFS spectra sodium chloride–water phase diagram in the temperature–
at the interfacial region, we discuss their observation in the
https://doi.org/10.5194/tc-15-2001-2021 The Cryosphere, 15, 2001–2020, 20212008 T. Bartels-Rausch et al.: Interfacial supercooling Figure 4. Phase diagram of the sodium chloride–water binary system showing the conditions and trajectories of the data in Fig. 3 in the relative humidity–temperature space. The relative humidity is the partial pressure of water relative to the vapour pressure of (supercooled) water as parameterized by Marti and Mauersberger (1993). The dark-blue line denotes settings where ice is stable as the partial pressure of water matches the vapour pressure of ice. Above the eutectic temperature, it thus separates regions where ice and NaCl solution co- exist from those where only NaCl solutions exist. The light-blue lines denote conditions where anhydrous NaCl salt (“halite solubility”) and where NaCl q2H2 O (“hydrohalite solubility”) form a solution when increasing the relative humidity at constant temperature and where NaCl q2H2 O dissolves with increasing temperature at a constant relative humidity (“eutectic temperature”). (a) Data from this work compared to previous results (Krepelova et al., 2010a; Cho et al., 2002; Koop et al., 2000a). Also shown, as shaded areas, are the data ranges where efflorescence has been observed in earlier work (Koop et al., 2000a; Wagner et al., 2011; Wise et al., 2012; Peckhaus et al., 2016). (b) Enlarged view of data below the eutectic temperature. The arrows show the sequence of changes in experimental temperature and relative humidity conditions. (c) Enlarged view of the data in the absence of ice. The lines indicate the relative humidity and temperature trajectories to reach the experimental conditions for these data points. The arrows illustrate that the relative humidity was reduced to 0 % prior to returning to the conditions of the measurement. The Cryosphere, 15, 2001–2020, 2021 https://doi.org/10.5194/tc-15-2001-2021
T. Bartels-Rausch et al.: Interfacial supercooling 2009
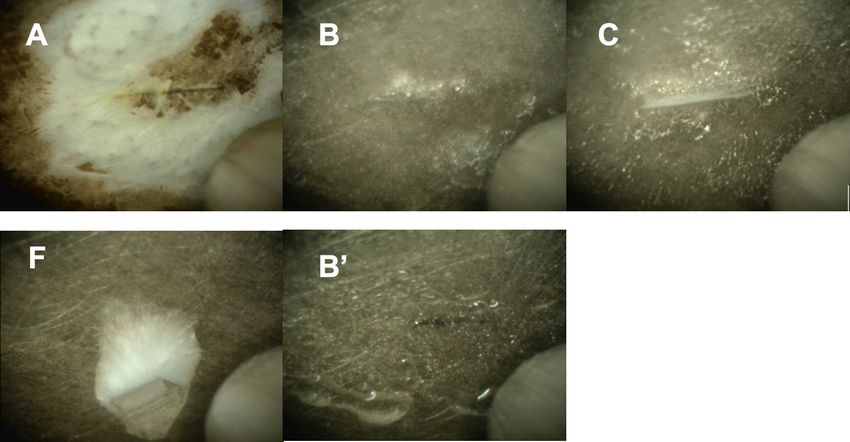
Figure 5. Optical microscopy pictures of the frozen samples. Each picture shows a 1 mm wide section of the sample holder with the sample.
The letters refer to the samples in Figs. 3 and 4: Sample A – solid NaCl at 248 K and 44 % relative humidity. Sample B – ice with brine at
88 % RH and 259 K. Picture B0 shows the deliquesced sample prior to freezing. Sample C – sample below the eutectic temperature at 248
to 249 K in the presence of ice. Sample F – sample in the absence of ice at a relative humidity lower than 73 % and at 244 K. Pictures of
samples D and E were not taken.
relative humidity space (Fig. 4) as initially constructed by nous freezing temperature, which was found at 210 to 230 K
Koop et al. (2000a). In this work, the relative humidity (RH) at a relative humidity of 60 % to 90 % (Koop et al., 2000a).
is referenced to the vapour pressure of (supercooled) water as Generally, in the presence of ice, the partial pressure of wa-
parameterized by Marti and Mauersberger (1993). There are ter in the flow-through cell is given by the vapour pressure
two sets of experiments, those where ice is present – and the of ice and is thus a sole function of temperature. If the water
sodium chloride is in equilibrium with ice (filled symbols) vapour pressure upstream of the flow-through cell exceeds
– and experiments in the absence of ice (open symbols) that this value, the ice on the sample holder is growing; if it is set
were performed with a relative humidity of less than the ice below this value, the ice sublimates. Based on the calibra-
stability line in the phase diagram (dark-blue line). tion of the dosing reservoir temperature and partial pressure
of water in the flow-through cell (in the absence of ice), the
3.3 Liquid below eutectic temperature and nucleation incoming H2 O vapour flux was adjusted such that the equi-
librium pressure in the cell matched the vapour pressure of
In a typical experiment, anhydrous salt was exposed to in- ice.
creased relative humidity at a fixed temperature of 259 K. A NEXAFS spectrum was acquired at 259 K and
Once the relative humidity reached 72 %, the sample started 1.82 mbar on the ice stability line and taken as the reference
to dissolve by water uptake from the gas phase and an aque- for aqueous sodium chloride solutions (Fig. 3b). When the
ous solution was formed (brine). This phase change was ev- temperature was lowered while adapting the flux of water
ident by the sample becoming shiny and then forming trans- into the set-up to match the vapour pressure of ice at 248–
parent spheres as observed by an endoscope digital camera 249 K, thus 3 to 4 K below the eutectic temperature (Fig. 4b),
(Fig. 5, picture B0 ). Then, the relative humidity was further the NEXAFS spectra revealed that the chloride at the air–
increased to cross the ice stability line until ice nucleation oc- ice interface is in an environment identical to that of aque-
curred at a modest supersaturation of typically 90 % to 95 % ous chloride (Fig. 3c). While cooling further and adjusting
relative humidity at 259 K. This relative humidity range cor- the vapour pressure to match that of ice at each temperature,
responds to a supersaturation with respect to ice of 103 % to a sudden change in the sample appearance, becoming less
109 %. Ice nucleation was evident by a sharp pressure drop transparent, was observed by the digital endoscope, indicat-
from the pressure dosed to the cell to the water vapour pres- ing efflorescence of the sample. A recorded NEXAFS spec-
sure of ice at that temperature, for example 88 % relative trum reveals that hydrohalite has precipitated from the brine
humidity at 259 K. In some experiments, temperature was at 241 K and 74 % RH (Fig. 3d). Krepelova et al. (2010a)
lowered by 1 to 2 K as well to trigger ice nucleation. Please have studied phase changes of sodium chloride at the in-
note that temperature was always well above the homoge-
https://doi.org/10.5194/tc-15-2001-2021 The Cryosphere, 15, 2001–2020, 20212010 T. Bartels-Rausch et al.: Interfacial supercooling
terfacial region of sodium chloride–water binary mixtures For samples that were cooled to temperatures that trig-
previously. They have probed the oxygen with XPS and by gered efflorescence, the chlorine NEXAFS spectra show
partial electron yield NEXAFS spectroscopy and concluded that the hydrohalite is the dominating phase at the inter-
that, in the presence of ice, hydrohalite forms at about 11 K face of frozen sodium chloride–water binary mixtures. Cho
below the eutectic temperature (filled star in Fig. 4). Con- et al. (2002) have shown that when frozen aqueous solutions
sistent with that, the chloride has a local environment in- were warmed, a liquid fraction was observed below the eu-
distinguishable from that of the hydrohalite 11.4 K below tectic temperatures. In their experiments, ice was frozen in
the eutectic temperature and in the presence of ice in the NMR tubes lowering the temperature to 228 K in 15 min,
current study (Fig. 3d). Our results of precipitation in the which is significantly colder than the efflorescence tem-
presence of ice surfaces agree with the crystallization tem- peratures observed here and by Koop et al. (2000a). After
perature observed by Koop et al. (2000a). We lack a direct 10 min, the samples were warmed and NMR signals were
comparison to the bulk, because the electron yield NEXAFS recorded. Interestingly, Cho et al. (2002) have observed the
spectroscopy used in our work is inherently surface sensi- liquid fraction only in experiments where the sodium chlo-
tive. Cooling sodium chloride solutions of varying concen- ride concentration in the initial aqueous solution was below
tration, Koop et al. (2000a) found precipitation of hydrohalite 0.01 mol L−1 . If the initial aqueous solution had a concen-
at 240 K in the presence of ice for bulk samples. Because tration of 0.5 mol L−1 , no indication of liquid features be-
precipitation occurred at 20 K higher temperatures compared low the eutectic temperature were found. Tasaki et al. (2010)
to emulsion samples of the same concentration, the authors have shown a similar concentration dependence for sodium
concluded that the presence of surfaces enhances the crys- bromide solutions using X-ray absorption, reporting solvated
tallization rate. In that study, the hydrohalite was identified bromide in the bulk of the samples below the eutectic tem-
by the melting temperatures of the ice–hydrohalite mixtures. perature only for concentrations below 50 mmol L−1 .
Malley et al. (2018) observed crystallization of sodium chlo- We will now detail the concentration of brine in the study
ride solutions at 1 K below the eutectic temperature in the presented here to elaborate if differences in concentration
presence of ice. The hydrohalite was clearly identified using might explain the differences in the observed liquid con-
bulk-sensitive Raman spectroscopy. This difference in crys- tent of sub-eutectic samples. The experiments described here
tallization temperature may reflect the stochastic character of started the freezing process with an aqueous solution that was
freezing, as already noted by Koop et al. (2000a) when dis- formed in situ and was kept in equilibrium with a vapour
cussing the scatter in their data. The precise crystallization pressure of roughly 1.9 mbar. The chloride concentration in
temperature is also influenced by the freezing rate, concen- such solutions is close to the concentration in a solution at
tration, and the availability of surfaces (Bartels-Rausch et al., 1.8 mbar and at 259 K, where ice nucleation occurred and
2014). It thus appears that the precise occurrence of crystal- where the freezing-point depression data give a concentra-
lization is governed by stochastics at the surface as has been tion of 3.5 mol L−1 . This concentration can be directly com-
shown for freezing of bulk samples (Alpert and Knopf, 2016) pared to the concentration in the initial solutions of Cho et
and by experimental settings. Because of the good agreement al. (2002), which ranged from below 0.01 to 0.5 mol L−1 .
between the precipitation temperatures observed in this study This back-of-the-envelope calculation thus suggests that the
and in Koop et al. (2000a), we believe that the deviation from concentration of the solutions from which ice nucleated in
the results of Malley et al. (2018) does not indicate differ- the experiments reported here exceeded those described by
ences in the freezing behaviour at the surface vs. that in the Cho et al. (2002) for which no liquid fraction was observed.
bulk. Next, we discuss how higher concentrations of initial solu-
To investigate the impact of the sample’s history on the tion might impact the location of brine in the frozen matrix.
phase, the sample at 241 K (filled green diamond, Fig. 4b) The concentration of the initial solution from which ice pre-
was warmed towards the eutectic temperature while staying cipitated determines the ice-to-brine ratio after ice formation.
in the ice stability domain. Acquiring a NEXAFS spectrum This is because the volume of the brine relative to that of ice
3 K below the eutectic temperature (Fig. 3e) that resembles is given by the water-to-sodium chloride ratio in the initial
that of hydrohalite shows that liquid brine is not the thermo- solution. The concentration of the brine in the presence of
dynamically stable form at temperatures close to the eutectic. ice is a sole function of temperature and not of the initial
We therefore interpret the existence of liquid during the pre- concentration of the solution. One might speculate that with
vious cooling of the sample (Fig. 4b, orange circle; Fig. 3c) at large amounts of brine relative to ice, that is concentrations
the interface as supercooled solution. The sample was kept at of initial solutions from which ice nucleates > 0.5 mol L−1 ,
this condition for 3 h. This shows that liquid can exist for ex- patches and inclusions are larger in size than for more di-
tended times at the air–ice interface below the eutectic tem- lute solutions. The size of these patches or inclusions is of
perature and that the temperature alone is not sufficient to relevance, as surface forces reduce the melting point only
predict its presence. Rather the thermal history of the frozen for inclusions in the nanometre range (Nye, 1991; Aristov
matrix needs to be considered. et al., 1997; Christenson, 2001; Bartels-Rausch et al., 2014).
The absence of this so-called inverse Köhler effect in larger
The Cryosphere, 15, 2001–2020, 2021 https://doi.org/10.5194/tc-15-2001-2021T. Bartels-Rausch et al.: Interfacial supercooling 2011 patches or inclusions might explain the lack of liquid features Rausch et al., 2017). In particular, we have recently reported both in the results reported here at the interface of ice and in chloride-forming solvation shells in the interfacial region of the high-concentration samples of Cho et al. (2002). Support ice upon adsorption of HCl at 253 K (Kong et al., 2017). The for large patches at the interface when solutions are frozen surface concentration as derived from XPS suggested that comes from a number of studies (Krausko et al., 2014; Toku- this previous work was done in the stability domain of ice; masu et al., 2016; Lieb-Lappen et al., 2017; Malley et al., i.e. the concentration of HCl was too low to melt the ice. 2018). Low-temperature scanning electron microscopy work Oxygen K-edge NEXAFS spectra showed that a substantial suggested the ice surface of frozen 0.05 mol L−1 sodium fraction of the water molecules at the air–ice interface is ar- chloride–water mixtures being covered by micrometre-sized ranged in a hydrogen-bonding structure like that of liquid brine features (Blackford, 2007; Blackford et al., 2007). Mal- water. We would like to note that the oxygen K-edge spec- ley et al. (2018) used Raman microscopy of sodium chloride tra of sodium chloride–ice of Krepelova et al. (2010a) did solutions of between 0.02–0.6 mol L−1 initial concentration not reveal water molecules being coordinated like they are to identify micrometre-sized, partially connected patches of (generally speaking) in the liquid. Taken together, the signal liquid covering 11 % to 85 % of the ice surface at tempera- from the hydrohalite by far exceeds the signal from chloride tures above the eutectic temperature. Despite the impact of in brine or in a liquid-like environment at the molecular level. freezing temperature and rate – which differs among the in- dividual studies – on the distribution of impurities (Bartels- 3.4 Nucleation in the absence of ice Rausch et al., 2014; Hullar and Anastasio, 2016), these re- sults clearly show the tendency of micrometre-sized features Hydrohalite can also precipitate in the absence of ice by to dominate at the air–ice interface. In the dominant presence evaporating water from a solution at temperatures below of nano-inclusions, we would also expect the deliquescence 273 K (Craig et al., 1975; Yang et al., 2017). Such a trajec- to occur at a lower temperature. This was not observed in tory, that is the temperature and water vapour pressure the our experiments, suggesting the absence of nano-inclusions sample experienced, is shown in Fig. 4c (solid green line). in the experiments presented here in the interfacial region. In this set of experiments, water was evaporated by decreas- Please note that the NEXAFS spectroscopy presented here ing the relative humidity to about 70 % at 252 K from a brine probes an area at the interface of the sample with a diameter sample in the absence of ice, followed by lowering the tem- of about 500 µm. As the spectroscopy is selective to chlo- perature to 247 K at constant partial pressure of water (so that rine, we have no information about the fraction of ice in the the relative humidity increased to about 80 %). When the ice probed part of the sample. stability line in the phase diagram was crossed, ice nucleation The previous argumentation is based on the features in the was not observed as the oversaturation was not sufficient to NEXAFS spectrum of sodium chloride–ice mixtures shown trigger ice nucleation. This procedure was repeated to fur- in Fig. 3d and e being dominated by the hydrohalite as seen ther lower the temperature to 244 K at 59 % relative humid- in the NEXAFS spectrum shown in Fig. 3f. In particular the ity. Then, the first NEXAFS was recorded at 244 K and 59 % spectrum in Fig. 3e, acquired 3 K below the eutectic temper- RH (Fig. 4, green diamond), where in the absence of ice, ature, shows a shoulder starting at 2823 eV. Such a feature nucleation was visually observed. The location in the phase is absent in the spectrum of the hydrohalite (Fig. 3f), but the diagram is in agreement with the observation of Wagner et spectrum of brine (Fig. 3b) shows an increase in absorption al. (2012) of salt deposits in aerosol droplets in an aerosol starting at this X-ray energy level. This feature might thus chamber (AIDA) in the absence of ice. The second NEXAFS indicate small amounts of brine, and we can thus not exclude spectrum was recorded at a slightly higher relative humid- the presence of brine in the samples where the hydrohalite ity of 73 % (Fig. 4, green diamond). Both NEXAFS spec- dominates the NEXAFS. Given the spectra quality and the tra (Fig. 4, green diamonds) were identified as hydrohalite small difference in the shape of the liquid and of the hy- (Fig. 3f). drohalite spectrum, it is beyond the scope of this work to The sample at 44 % RH (Fig. 3a) was exposed to 0 % elaborate whether the NEXAFS spectrum in Fig. 3e might RH prior to acquiring the NEXAFS spectrum (Fig. 4c, blue be understood by deconvoluting it into its hydrohalite and square and blue line), which removes the crystal water (Light brine components and by this reveal a fraction of the chloride et al., 2009; Wise et al., 2012). This NEXAFS spectrum being embedded in a brine-like hydrogen-bonding network. recorded at 248 K and 44 % RH shows that no deliquescence Two reasons might explain the presence of liquid-like fea- occurred and thus serves as a reference for a halite spec- tures in the NEXAFS spectra at sub-eutectic temperatures. trum (Fig. 3a). We note that we misinterpreted this spec- First, one might expect a certain distribution in the size of trum as that of hydrohalite in our previous technical paper micropockets and a fraction of the pockets might thus be introducing the NAPP end station (Orlando et al., 2016). The small enough to stabilize liquid at these temperatures. Sec- halite spectrum (Fig. 3a; Fig. 4c, blue square) was recorded ondly, some of the chloride might form solvation shells with at 44 % RH, a humidity where water readily adsorbs on sur- water molecules from the ice matrix as proposed for trace faces (Bluhm, 2010), and the presence of water at the sodium gases adsorbed to ice (Krepelova et al., 2010b, 2013; Bartels- chloride–air interface at elevated RH has been demonstrated https://doi.org/10.5194/tc-15-2001-2021 The Cryosphere, 15, 2001–2020, 2021
2012                                                                     T. Bartels-Rausch et al.: Interfacial supercooling

previously (Ewing, 2005; Wise et al., 2008). A further reason    to somewhat into the bulk (Ammann et al., 2018). In this
for the presence of water at lower RH than that of the deli-     work, we describe the NEXAFS spectrum of hydrohalite for
quescence might be sodium chloride’s high solubility. Kong       the first time.
et al. (2020) have recently suggested that sodium ions from         The results emphasize that the nucleation of hydrohalite
sodium acetate are dissolved in adsorbed water prior to del-     is a function of both the temperature and the relative humid-
iquescence. Indications for solvation of halide ions on sin-     ity. While we show that the nucleation of hydrohalite at the
gle crystals below deliquescence relative humidity have also     interface is favoured by surfaces, we find supercooled solu-
been reported previously (Luna et al., 1998). An analogue in-    tions of sodium chloride in the interfacial region of ice. The
vestigation was beyond the scope of this work. The fact that     supercooled solutions have been observed to be metastable
we find no indication for a dominant liquid feature in the up-   for hours in these experiments. This has direct implications
per 6 nm of the sodium chloride–air interface based on the       for heterogeneous chemistry in cold parts of Earth’s environ-
chlorine X-ray absorption spectrum might be due to probing       ment. Multiphase reactions may proceed at accelerated rates
deeper into the interfacial region in this work as compared to   in these highly concentrated brines at temperatures ∼ 10 ◦ C
that of Kong et al. (2020).                                      below the eutectic temperature compared to reactions on
                                                                 solid hydrohalite. This temperature range of ∼ 241 K is fre-
3.5    NaCl or NaCl q2H2 O                                       quently observed in polar coastal sites during spring and in
                                                                 the free troposphere. In this respect, there is no difference in
We have shown that in the presence of ice, hydrohalite pre-      the interfacial region to liquid embedded in the bulk of snow
cipitates; halite was not observed in this study except when     and ice samples. This implies that when chemical reactiv-
crystal water was removed in vacuum. This agrees with Koop       ity of ice and snow is discussed, knowledge of its thermal
et al. (2000a), who found precipitation of hydrohalite in the    history is essential. From temperature and relative humidity
presence of ice and suggested that heterogenous nucleation at    alone, nucleation or efflorescence cannot be predicted at the
ice surfaces favours nucleation of hydrohalite. Studies with     interface just like in the bulk. We suggest that further stud-
liquid droplets in the absence of ice found both halite and      ies focus on samples with more complex chemical composi-
hydrohalite precipitating in the thermodynamic stability do-     tion to enhance our knowledge of environmental multiphase
main of the hydrohalite (Wagner et al., 2011; Wise et al.,       chemistry. For example, organic compounds are a common
2012; Peckhaus et al., 2016). The transition between crystal-    constituent of sea-salt aerosols (O’Dowd et al., 2004). Kir-
lization of halite and hydrohalite at between 253 and 241 K      pes et al. (2019) and Edebeli et al. (2019) have shown how
was explained based on nucleation theory and the deviating       the presence of organics impacts the microphysics of salt
trend of the nucleation rate of both species with temperature    particles and thus their reactivity towards ozone. Further,
(Peckhaus et al., 2016). That hydrohalite crystallizes in the    Chakraborty and Kahan (2020) have shown a depression in
absence of ice in our study shows that gold surfaces, of the     hydrohalite precipitation temperature in humic acid–sodium
sample holder, also serve as good nucleation support for hy-     chloride mixtures.
drohalite. It appears that any specific properties of the ice       We suggest that the brine observed by Cho et al. (2002) is
surface, as compared to gold, are of minor importance. In        a consequence of the presence of very small pockets holding
agreement, Wagner et al. (2015) showed efficient nucleation      the brine. Because pockets only tend to be small enough to
of hydrohalite in droplets containing solid oxalic acid and      establish a significant depression in the freezing point when
halite precipitated in the absence of oxalic acid at the same    solutions with low concentration are freezing and because
temperature and relative humidity.                               aerosols at typical relative humidity that prevail in cold parts
                                                                 of the atmosphere are highly concentrated, we suggest that
                                                                 such nano-pockets at the air–ice interface are of small rele-
4     Summary and atmospheric implication                        vance to the environment.
                                                                    The appearance of hydrohalite at air–ice interfaces might
The upper few nanometres (mean electron escape depth of          also be of interest to sea ice research, because precipitation of
6 nm) of the interfacial region of a sodium chloride–ice bi-     hydrohalite increases the albedo of sea ice. During the snow-
nary system was investigated in this study at various posi-      ball Earth period, 700 million years before present, climatic
tions in the phase diagram. The sample was always in equi-       conditions may have favoured the existence of hydrohalite
librium with gas-phase water which makes cooling condi-          with its climatic feedback (Light et al., 2009). For modern
tions identical and the concentration of brine similar to that   Earth, precipitation of brine constituents in sea ice is relevant
of aerosol particles embedded in snow or in the troposphere.     for ion mobility and might result in ion fractionation during
The inherent sensitivity to the interfacial region comes from    washout events (Maus et al., 2008; Obbard et al., 2009; Maus
using partial Auger–Meitner electron yield NEXAFS spec-          et al., 2011) and possibly brine migration upwards through
troscopy and the limited pathlength of electrons travelling in   the snow (Dominé et al., 2004).
matter. With a mean electron escape depth of 6 nm, the inter-       Precipitation of sodium chloride in sea spray aerosols in
facial region is probed spanning the upper molecular layers      the troposphere, not embedded in snow or sea ice, is of fur-

The Cryosphere, 15, 2001–2020, 2021                                                  https://doi.org/10.5194/tc-15-2001-2021
You can also read