Craving Communities UOL SUSTAINABILITY REPORT 2018

Page created by Ralph Gilbert
 
CONTINUE READING
Craving Communities UOL SUSTAINABILITY REPORT 2018
Craving
Communities
 UOL SUSTAINABILITY REPORT 2018
Craving Communities UOL SUSTAINABILITY REPORT 2018
Contents                                          References                                                                                         UOL SUSTAINABILITY REPORT 2018   02

02      About Us                                  38   Appendix A:
03      About This Report                              Supplementary
                                                       Sustainability Data
04      Our Sustainability Commitment
                                                  48   Appendix B:
05      Sustainable Development Goals
07      2018 Highlights
                                                       Notes for Sustainability
                                                       Performance Data
                                                                                                                                VISION
09      Group Chief Executive Statement                                                               A robust property and hospitality group dedicated to
                                                  52   Appendix C:
12      Five-Year Performance Overview                 Restatements                                              creating value, shaping future
13      Economic Performance                      57   Appendix D:
                                                       GRI Content Index
Closer to Nature                                  67   Independent Limited Assurance Report                                   MISSION
16      Product and Service Quality
                                                                                                              Driving Inspirations, Fulfilling Aspirations
19      Environment

Connecting Communities                                                                                                    CORE VALUES
                                                                                                                        Passion Drives Us
26      Health and Safety
                                                                                                                      Innovation Defines Us
29      People
                                                                                                                      Enterprise Propels Us
32      Community
                                                                                                             Corporate Social Responsibility Shapes Us
36      Awards and Accolades
                                                                                                                    People, Our Leading Asset

                                                                                                                             ABOUT US
                                                                                              UOL Group Limited (UOL) is one of Singapore’s leading public-listed property
                                                                                              companies with total assets of about $20 billion. We have a diversified portfolio
                                                                                              of development and investment properties, hotels and serviced suites in Asia,
                                                                                              Oceania and North America.

                                                                                              With a track record of over 50 years, UOL strongly believes in delivering product
                                                                                              excellence and quality service in all its business ventures. Our unwavering
                                                                                              commitment to architectural and quality excellence is reflected in all our
                                                                                              developments, winning us prestigious prizes such as the FIABCI Prix d’Excellence
                                                                                              Award, Aga Khan Award for Architecture, Urban Land Institute Awards for
                                                                                              Excellence and President’s Design Award.

                                                                                              UOL, through hotel subsidiary Pan Pacific Hotels Group Limited (PPHG), owns two
                                                                                              acclaimed brands namely “Pan Pacific” and PARKROYAL. PPHG currently owns and/
                                                                                              or manages over 30 hotels in Asia, Oceania and North America with over 10,000
                                                                                              rooms. Our Singapore-listed property subsidiary, United Industrial Corporation
                                                                                              Limited (UIC), owns an extensive portfolio of prime commercial assets and hotels
                                                                                              in Singapore.

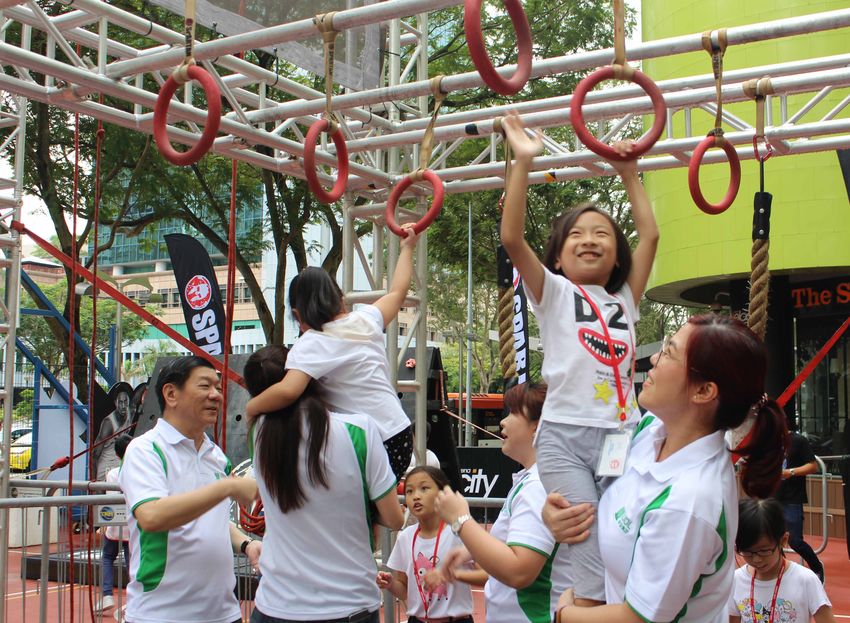
Instagram-worthy spot at KINEX.                                                               UOL values and recognises our people as the leading asset. The culture of
                                                                                              competitiveness, commitment, competency, creativity, collaboration and caring,
                                                                                              shapes our people and drives the company forward.
Cover: Wall climbing at Velocity@Novena Square.
Craving Communities UOL SUSTAINABILITY REPORT 2018
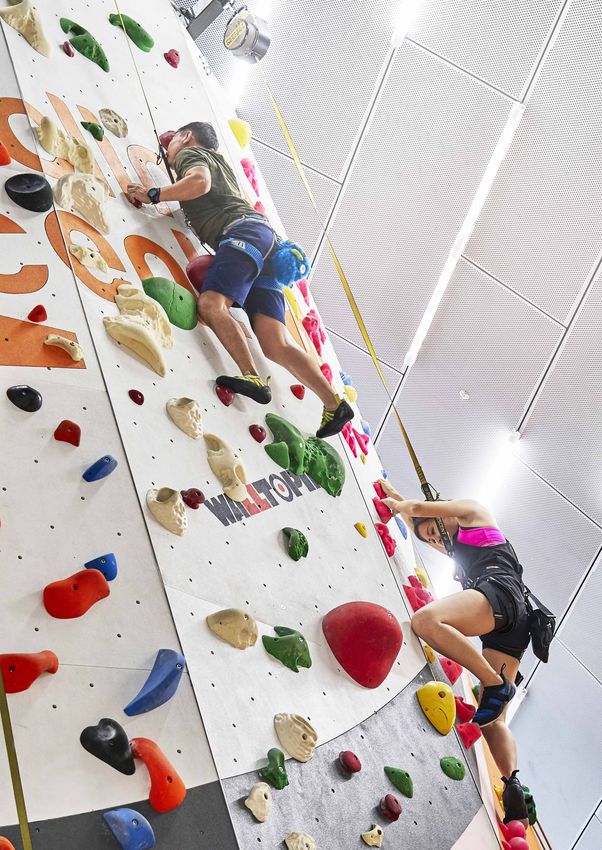
03   UOL SUSTAINABILITY REPORT 2018                                                                                                                 UOL SUSTAINABILITY REPORT 2018   04

     ABOUT THIS REPORT                                                                     OUR SUSTAINABILITY COMMITMENT

     This report communicates performance data and related information for our             BOARD STATEMENT
     material environmental, social and governance (ESG) issues for the period 1 January
     to 31 December 2018 (FY2018). This is our sixth annual sustainability report.         UOL is committed to our vision of creating value, shaping future by conducting
                                                                                           our business operations in a manner that practises high standards of corporate
     For more information on our approach to sustainability, visit our website             governance, and considers the environmental and social impact to sustain
     www.uol.com.sg.                                                                       profitable growth.

     This report has been prepared in accordance with the GRI Standards: Core              The principal responsibilities of the Board include reviewing UOL’s strategic
     option, and includes consideration of the GRI Construction and Real Estate            business plans, taking into account the environmental, social and governance
     Sector Disclosures. The report also complies with requirements of the Singapore       issues which could impact the business. Since 2016, the Board oversees the
     Exchange Securities Trading Limited (SGX-ST) Listing Rules Practice Note 7.6          monitoring and management of material sustainability issues and their performance
     Sustainability Reporting Guide. Definitions and source of data measurements           indicators. The Board also approves the annual sustainability report.
     are indicated in Appendix B.

     The report covers our property development, property investments and hotel            SUSTAINABILITY GOVERNANCE STRUCTURE
     operations in Singapore, excluding those of listed United Industrial Corporation
                                                                                           The Board is supported by the Sustainability Steering Committee and
     (“UIC”) but including the common associated and joint venture companies
                                                                                           Sustainability Coordinating Committee. The steering committee comprises
     of UOL Group and UIC. Assets and revenue from operations covered in the
                                                                                           the Group Chief Executive, Chief Executive Officer (Hotels) and other
     report comprise approximately 54% of the Group’s total assets and 52%
                                                                                           members of the Senior Management team. It makes key decisions, including
     of the Group’s total revenue respectively as at 31 December 20181. We intend
                                                                                           materiality assessment.
     to expand the scope of reporting to include our overseas operations when such
     operation significantly contributes to our assets or profit i.e. more than 10%.
                                                                                           The steering committee is supported by two working committees, representing
                                                                                           the property business and hospitality arm respectively. They include
     UIC publishes its own sustainability report, which is available on its
                                                                                           representatives across departments including Corporate Communications &
     corporate website.
                                                                                           Investor Relations, Finance, Human Resource, Investment, Legal & Secretariat,
                                                                                           Marketing, Project Development, Property & Engineering and Hotel Operations.
     Our sustainability report continues to be externally assured to ensure the accuracy
                                                                                           Each business has the autonomy to develop targets and plans, with due
     and reliability of the contents. For FY2018, KPMG was engaged to provide
                                                                                           consideration to each unique operating environment. Industry benchmarking
     limited assurance using SSAE 3000 to ensure alignment of the report with SGX
                                                                                           of environmental and social performance is conducted at least annually.
     Sustainability Reporting requirements under Listing Rules 711A and 711B. The
                                                                                           The governance structure of sustainability permeates functions and seniority,
     assurance statement can be found on page 67 of this report.
                                                                                           ensuring that sustainability is integrated both at strategic and operational levels.
     We welcome your feedback to help us improve our performance in sustainability
     and meet stakeholder expectations. If you have comments, please send them to
     sustainability@uol.com.sg.

     No hard copies of this report have been printed as part of our efforts to promote
     resource conservation.

     1
         GRI 102-45
Craving Communities UOL SUSTAINABILITY REPORT 2018
05   UOL SUSTAINABILITY REPORT 2018                                                                                                                        UOL SUSTAINABILITY REPORT 2018   06

                                                                                                                We actively consider sustainable design in all our properties. We
     SUSTAINABLE DEVELOPMENT GOALS                                                                              explore ways to preserve the environment’s inherent character and
                                                                                                                cultural heritage wherever we operate.
                                                                                                                • We support knowledge-sharing on innovation in the industry
     In 2015, all 193 member states of the United Nations (including Singapore)                                   through events such as the biennial World Cities Summit.
     adopted the Sustainable Development Goals (SDGs). The 17 SDGs set out a                                    • We incorporated biophilic design and conserved existing raintrees
     path to ‘end extreme poverty, fight inequality and injustice, and protect our planet’                        for our residential project The Tre Ver, and included green features
     by 2030. The private sector will play an important role in delivering the SDGs,                              for Pan Pacific Orchard that we are redeveloping.
     through doing business responsibly, innovation and collaboration. We align our
     sustainability efforts to the following SDGs.

                                                                                                                We engage our key stakeholders on sustainable consumption and
                                   As a provider of living, working and leisure spaces, promoting good          production to positively impact the construction and hospitality industry
                                   health and well-being of our workforce, customers and guests is our          value chain.
                                   responsibility. We also focus on occupational health and safety.             • For property development, all our main contractors are OHSAS
                                   • We actively consider users’ needs in all our properties.                     18001 and ISO 14001 certified.
                                   • All main contractors engaged in our development projects are
                                     OHSAS 18001 certified.

                                                                                                                We are committed to combating climate change and its impact by
                                   Gender diversity is important to us in attracting and retaining talent. We   regulating our GHG emissions through the reduction of energy and
                                   also recognise our shared responsibility in fostering a more productive      water usage.
                                   and equal society.                                                           • We have set targets for energy reduction across all our properties
                                   • We recruit, develop and reward our employees in a fair and                   in Singapore.
                                     inclusive manner.                                                          • We adopt environmental management system practices to regularly
                                                                                                                  measure, monitor and review performance.

                                   We recognise that People are our leading asset. Developing our
                                   employees’ capabilities ensures that we remain competitive.
                                                                                                                We have a zero tolerance stance towards fraud and corruption. We are
                                   • We are committed to developing the full potential of our workforce.
                                                                                                                committed to conducting our business with integrity and in compliance
                                   • We provide flexible work arrangements in the form of part-time             with all applicable laws.
                                     work, based on the needs of the department and individual.
                                                                                                                • Our Code of Business Conduct sets our expectations for
                                                                                                                  our employees.
                                   We are dedicated towards incorporating innovative design and quality         • We respect the rights and interests of our employees, business
                                   excellence in the buildings we develop. We promote sustainable                 partners, customers and the communities where we operate.
                                   practices across our businesses.
                                   • We are one of the early adopters of PPVC2 and advocates for BIM3
                                     in our developments.
                                                                                                                We actively seek to form long lasting and strong partnerships, built on
                                   • Avenue South Residence, our new residential project along Silat            respect, trust and mutual benefit, with our stakeholders.
                                     Avenue, will set a new world record for the tallest reinforced concrete
                                                                                                                • We engage external stakeholders such as the real estate and
                                     structure for residential development using the PPVC method.
                                                                                                                  hospitality industries, government, regulators and our suppliers
                                   • We target to attain BCA Green Mark Gold for new development of               including main contractors, to promote sustainable practices.
                                     our investment properties in Singapore.

     2
         Prefabricated Prefinished Volumetric Construction
     3
         Building Information Modelling
Craving Communities UOL SUSTAINABILITY REPORT 2018
07   UOL SUSTAINABILITY REPORT 2018                                                                                 UOL SUSTAINABILITY REPORT 2018   08

     2018 HIGHLIGHTS                                                                                        Commercial properties
                                                                                                            exceeded target with 18.8%
                                                                                                            reduction of energy intensity
                                                                                                            by GFA5 occupied compared
                                                                                                            with the base year of 2010
                                      UOL remained on the iEdge SG
                                      ESG Indices (formerly known as
                                      the SGX Sustainability Indices)
                                      since its launch in 2016                                         Hospitality business was on track
                                                                                                       in meeting its target by achieving
                                                                                                       a 26.3% reduction of energy
                                                                                                       intensity by guest night compared
                                                                                                       with the base year of 2013
                                                UOL achieved a 6.4%
                                                reduction in total GHG4
                                                emissions (excludes
                                                development projects)
                                                                                                            Novena Square was awarded
                                                year-on-year
                                                                                                            BCA Green Mark GoldPlus
                                                                                                            Award following retrofitting

                                       Hospitality business launched
                                       Food Safety Management System
                                       across hotels and serviced suites
                                                                                                     Hospitality business launched new
                                                                                                     employee training roadmap to cover
                                                                                                     a wider range of modules and skills

                                                Exceeded 2020 water
                                                intensity reduction targets
                                                for both commercial and
                                                hospitality properties,                                     Reported waste for
                                                two years in advance                                        the first time from all
                                                                                                            commercial properties

     4
         Greenhouse gas                                                       5
                                                                                  Gross floor area
Craving Communities UOL SUSTAINABILITY REPORT 2018
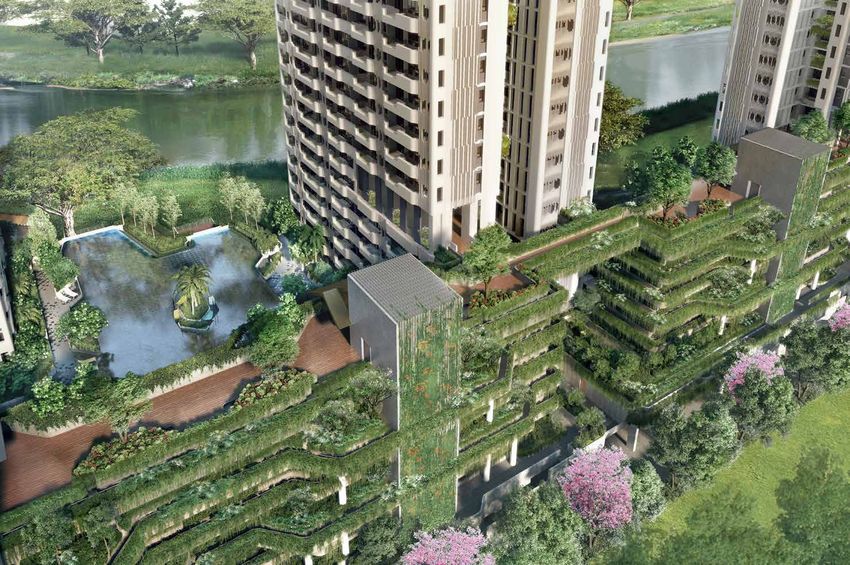
09   UOL SUSTAINABILITY REPORT 2018                                                                                                                 UOL SUSTAINABILITY REPORT 2018   10

     GROUP CHIEF EXECUTIVE STATEMENT

     Dear Stakeholders                                                                   COMMITMENT TO GREEN DEVELOPMENTS AND
                                                                                         INCLUSIVE SPACES
     The government has recently unveiled key plans in creating a more sustainable,
     inclusive and green city with community spaces for all to enjoy under the Draft     We are committed to green design. The Tre Ver is a 729-unit condominium
     Master Plan 2019. Besides rejuvenating familiar places, there will be a focus       facing the Kallang River and built into the surrounding landscape. Pan Pacific Orchard
     on creating capacity for the future. Part of this vision is the push towards a      is a new-built green 350-key hotel featuring three unique levels of experiential
     car-lite nation.                                                                    sky gardens that will redefine the vertical sky-rise typology. A built design that
                                                                                         integrates nature has a positive impact on residents and guests.
     As a leading property developer, UOL plays a crucial role in supporting the
     rejuvenation of Singapore, while considering the different passions of our          Our properties provide spaces for people to come together to work and live a
     communities, the impact on the environment and our contributions to the economy     healthy lifestyle. In 2018, we rebranded our mall located in Paya Lebar as KINEX.
     when we manage our business operations. For this report, we have chosen the         The mall now offers experiential appeal and community-centric activities such as
     theme “Craving Communities” to reflect our continued drive towards a more           free workshops and performances to inject life into the area, which is earmarked
     inclusive and sustainable city.                                                     as one of the commercial hubs to be developed outside the city centre.

                                                                                         We also support social inclusion through our various corporate social responsibility
                                                                                         initiatives with partners like Very Special Arts Singapore.
     SUSTAINABILITY PERFORMANCE IN 2018
     Singapore designated 2018 as the Year of Climate Action. We are pleased
     that our commercial properties and hospitality business achieved some of our
                                                                                         A SUSTAINABLE FUTURE FOR EVERYONE
     environmental targets in 2018.
                                                                                         Supporting and caring for our community is part of our culture and we will continue
     During the year, our commercial properties achieved an 18.8% reduction in           to devote resources in this area. We are pleased to see continued commitment
     building energy intensity by GFA occupied, compared with the base year of 2010.     amongst our employees in volunteering their time to engage the underprivileged
     For reduction in water intensity by GFA occupied, our commercial properties         through the activities that we organised for our community partners.
     achieved and exceeded their target of 10% by 2020 with a 24.1% reduction in
     2018 compared with the base year of 2010.                                           Our employees have always been at the core of our business success. It is our
                                                                                         responsibility to create a conducive, fair and respectful workplace for our employees
     Our hospitality business is on track towards meeting the target of 27% reduction    to feel valued at work. We also embrace diversity and individual differences
     in energy intensity by guest night by 2020 compared with the base year of           to bring forth broader and more enriching perspectives to the workplace.
     2013, having achieved a 26.3% reduction in 2018. Our hospitality business also
     achieved a 29.8% reduction in water intensity by guest night in 2018, compared      At UOL, we believe the journey towards sustainability and the management of
     with the base year of 2013, exceeding our target of 25% reduction by 2020.          environmental, social and governance issues will help foster innovation, make
                                                                                         us more resilient and build value for all our stakeholders. We look forward to
     As most of our development projects are in their peak construction stages, we       your continuous support as we strive towards a sustainable business for current
     recorded an increase of 67.6% in GHG emissions intensity by value of work           and future generations.
     completed and an increase of 65.6% of water intensity by value of work completed
     year-on-year.

     During the year, we recorded an accident frequency rate of 0.8, a slight increase   LIAM WEE SIN
     from 2017 but below the national industry average of 1.5. We will continue to       GROUP CHIEF EXECUTIVE
     work towards a workplace with zero incidences, maintaining focus on high            MAY 2019
     occupational safety standards and engaging our contractors.
Craving Communities UOL SUSTAINABILITY REPORT 2018
Five-Year Performance Overview

11           UOL SUSTAINABILITY REPORT 2018                                                                                                                                                     UOL SUSTAINABILITY REPORT 2018                       12

                                                                                           FIVE-YEAR PERFORMANCE OVERVIEW
                                              Novena Square attained Green Mark GoldPlus       INDICATOR                                                            2018               2017               2016              2015                 2014
                                              conferred by the Building and Construction
                                              Authority in 2018.                               ENVIRONMENT
                                                                                               GFA* (m2)                                                         387,539           402,363            401,975            402,012               373,075
                                                                                               Energy Consumption (MWh)                                          124,480           130,412            134,316            131,607               129,681
                                                                                               Completed     Buildings**                                         114,979           122,880            127,038            124,115               120,840
                                                                                               Development Projects                                                 9,501             7,532              7,278              7,492                8,841
                                                                                               GHG Emissions (tonnes of CO2e)                                     50,686             53,339             55,565            54,330                53,963
                                                                                               Completed Buildings**                                              47,861             51,138             53,416            52,069                51,356
                                                                                               Development Projects                                                 2,825             2,201              2,149              2,261                2,606
                                                                                               Water Consumption (thousand m )       3
                                                                                                                                                                      980             1,060              1,110              1,110                1,078
                                                                                               Completed Buildings**                                                  847                961             1,010              1,002                 941
                                                                                               Development Projects                                                   133                 99               100                108                 137
                                                                                               Building Energy Intensity By GFA (kWh/m )        2
                                                                                                                                                                    296.7             305.4              316.0              308.7                323.9
                                                                                               Building GHG Emissions Intensity By GFA                              123.5             127.1              132.9              129.5                137.7
                                                                                               (kg CO2e/m2)

                                                                                               Building Water Intensity By GFA (m3/m2)                                 2.2                2.4               2.5                2.5                 2.5
                                                                                               WORKPLACE HEALTH & SAFETY
                                                                                               Development Projects
                                                                                               OHSAS 18001 For Main Contractors                                     100%              100%               100%               100%                 100%
                                                                                               Accident Frequency Rate                                                 0.8               0.6                0.5                0.4                 3.8
                                                                                               Accident Severity Rate                                                17.0                5.5               10.1                6.2                66.6
                                                                                               Hospitality
                                                                                               Accident Frequency Rate                                                 6.4              10.8                NA                 NA                  NA
                                                                                               Accident Severity Rate                                               101.0               56.9                NA                 NA                  NA
                                                                                               PEOPLE
                                                                                               Turnover                                                            30.5%              32.0%             32.1%              34.5%                41.4%
                                                                                               Property                                                            13.3%              10.1%             16.1%              15.4%                14.3%
                                                                                               Hospitality                                                         32.1%              33.8%             33.4%              33.4%                40.3%

                                                                                               Average Training Hours Per Employee                                   89.4               85.0               85.1              86.6                 44.3
                                                                                               Property                                                              34.2               24.7               26.7              23.8                 27.8
                                                                                               Hospitality                                                           94.6               90.0               89.5              92.1                 45.7
                                                                                               COMPLIANCE
                                                                                               Number of Significant Fines or                                            0                  0                 0                  0                  0
                                                                                               Non-monetary Sanctions

                                                                                           *  Group GFA changes from time to time as we sell and buy property. The change in 2018 was mainly due to the redevelopment of Pan Pacific Orchard
                                                                                              and the change in GFA reported for serviced suites.
                                                                                           ** Completed buildings refer to completed properties in Singapore, including retail, mixed developments, offices, hotels and serviced suites.
Craving Communities UOL SUSTAINABILITY REPORT 2018
13   UOL SUSTAINABILITY REPORT 2018                                                                                                                                                                                                                                                           UOL SUSTAINABILITY REPORT 2018                                                          14

     ECONOMIC PERFORMANCE
     UOL operates in the economy in a responsible manner, recognising the financial            FIVE-YEAR FINANCIAL
     interconnectivity we have with many different stakeholders. Our value-added               PERFORMANCE FOR                                                                                                                               2017
     statement below was reproduced from UOL Annual Report 2018 and detailed                   THE GROUP                                                                                                        2018                    (restated)                                        2016                              2015                                2014
     our payments to suppliers (as “purchase of materials and services”), employees,           Revenue ($M)                                                                                                 2,397.3                             2,114.4                           1,440.7                               1,278.7                             1,360.7
     governments and providers of capital.                                                     PATMI ($M)                                                                                                       433.7                               880.2                                 287.0                             391.4                               686.0
                                                                                               Gearing Ratio                                                                                                        0.28                                 0.21                                 0.24                              0.27                                 0.34
     For more information on our business performance and plans, please refer to the
     Chairman’s Statement and Operation Highlights sections of our Annual Report               Return On Equity (%)                                                                                                    4.5                               10.0                                  3.5                                 5.0                                   9.0

     on pages 16-17 and pages 26-39 respectively.                                              Total Assets ($M)                                                                                        20,663.7                            19,632.5                             11,558.1                           11,501.3                            11,848.5
                                                                                               Earnings Per Share (Cents)                                                                                           51.5                            107.5                                     35.8                              49.4                                 88.0

      VALUE-ADDED STATEMENT                                            2018           2017
                                                                                 (restated)
                                                                                              For a detailed breakdown of our 2018 financial results, please refer to the following
                                                                      $’000         $’000     sections in the UOL Annual Report 2018:
      Sales of goods and services                                 2,349,130     2,084,603     • Financial Highlights, pages 10-11
      Purchase of materials and services                          (1,398,587)   (1,122,672)   • Five-year Financial Summary, pages 73-74
      Gross value added                                             950,543       961,931     • Segmental Performance Analysis, pages 75-76
      Share of profit of associated companies                         5,442       101,227
      Share of profit of joint venture companies                        125        16,383
                                                                                              SHARE PRICE
      Income from investments and interest                           62,149        37,733
                                                                                              Share Price ($)
      Other (losses)/gains                                          (34,418)      518,149

                                                                                                                                                                                                                                                                                                                    9.490

                                                                                                                                                                                                                                                                                                                                9.380
                                                                                                   9.5

                                                                                                                                                                                                                                                                                                                                    9.130
                                                                                                                                                                                                                                                                                                                9.110
      Fair value gains on investment properties                     149,279        15,593

                                                                                                                                                                                                                                                                                                                                            8.980
                                                                                                                                                                                                                                                                                                                        8.900

                                                                                                                                                                                                                                                                                                                                          8.860
                                                                                                   9.0

                                                                                                                                                                                                                                                                                                                                                8.770
      Currency exchange differences                                    (699)         3,701

                                                                                                                                                                                                                                                                                                                                8.790
                                                                                                   8.5

                                                                                                                                                                                                                                                                                                                                                    8.260
                                                                                                                                                                                                                                                                                                       8.250
                                                                                                                                                                                                                                                                                                            8.230

                                                                                                                                                                                                                                                                                                                                                        8.100
                                                                                                                                                                                                                                                                                               8.100
                                                                                                                                                                           8.100

                                                                                                                                                                                                                                                                                                                    8.550
                                                                                                                                                                                                                                                                                                   8.000
                                                                                                                                                                    8.000

                                                                                                                                                                                7.930

                                                                                                                                                                                                                                                                                                                        8.370
      Total Value Added                                           1,132,421     1,654,717

                                                                                                                                                                        7.910

                                                                                                                                                                                                                                                                                                                                           8.320
                                                                                                   8.0

                                                                                                                                                                                                                                                                                                                                          8.280
                                                                                                                                                                                                                                                                                                                                    8.180

                                                                                                                                                                                                                                                                                                                                                8.120
                                                                                                                                                                                                                                                                                                                8.080
                                                                                                                                                                                                                                                                                                       7.870
                                                                                                                                                                7.500

                                                                                                                                                                                                                                                                                                            7.950

                                                                                                                                                                                                                                                                                                                                                    7.400
      Distribution of Value Added:                                                                 7.5

                                                                                                                                                                                    7.340

                                                                                                                                                                                                                                                                                     7.300
                                                                                                                                                                                                                                                                                          7.280

                                                                                                                                                                                                                                                                                                                                                             7.240
                                                                                                                                                                                                                                                                                  7.140
                                                                                                                                                                            7.570
                                                                                                                                                        7.050

                                                                                                                                                                                        7.060
      To employees and directors

                                                                                                                                                                                                                                                                                                   7.420

                                                                                                                                                                                                                                                                                                                                                                 6.970
                                                                                                                                                                                                                                                                                                                                                                     6.960
                                                                                                                                                                                                    6.950
                                                                                                                                                                                7.350
                                                                                                                                                                        7.350
                                                                                                                            6.840
                                                                                                   7.0

                                                                                                                                6.820

                                                                                                                                                                                                                                                                             6.770
                                                                                                                                                                                                        6.720
                                                                                                                                                                                            6.720
                                                                                                                        6.740

                                                                                                                                                    6.730
                                                                                                                                    6.710

                                                                                                                                                                    7.170
                                                                                                                                        6.680

                                                                                                                                                6.620
                                                                                                                                            6.610

                                                                                                                                                                                                                                                                         6.560

                                                                                                                                                                                                                                                                                               6.980
                                                                                                                                                                                                                                                                                      6.900

                                                                                                                                                                                                                                                                                                                                                                          6.380
                                                                                                                                                                                                                                                                                                                                                                              6.380
         Employees’ salaries, wages and benefits                    291,429       225,687

                                                                                                                                                                                                                                                                                                                                                             6.830
                                                                                                                                                                                    6.800

                                                                                                                                                                                                                                                                                          6.810
                                                                                                   6.5

                                                                                                                    6.290

                                                                                                                                                                                                                               6.290

                                                                                                                                                                                                                                                                 6.280
                                                                                                                                                                                                            6.270
                                                                                                                                                                6.710

                                                                                                                                                                                                6.270

                                                                                                                                                                                                                    6.210
                                                                                                           6.210

                                                                                                                                                                                                                                                                                                                                                                 6.640
                                                                                                                6.150

                                                                                                                                                                                                                            6.140

                                                                                                                                                                                                                                    6.120

                                                                                                                                                                                                                                                                                  6.500

                                                                                                                                                                                                                                                                                                                                                        6.500
                                                                                                                                                                                        6.490

                                                                                                                                                                                                                        6.000

                                                                                                                                                                                                                                                 5.980
                                                                                                                                    6.420

                                                                                                                                                        6.430
                                                                                                                                6.400

                                                                                                                                                                                                                                                     5.940
                                                                                                                                                    6.370
                                                                                                                            6.390

                                                                                                                                                                                                                                                                             6.350
                                                                                                                                                                                                                                                             5.900
                                                                                                                                                                                                                                                         5.890
                                                                                                                                            6.330
                                                                                                                                        6.310

                                                                                                                                                                                                                                            5.850
                                                                      3,364
                                                                                                   6.0
         Directors’ remuneration                                                     3,203

                                                                                                                                                6.190

                                                                                                                                                                                                                                        5.700
                                                                                                                       6.140

                                                                                                                                                                                                                                                                                                                                                                          6.040
                                                                                                                                                                                                        6.020

                                                                                                                                                                                                                                                                         5.990

                                                                                                                                                                                                                                                                                                                                                                     5.980
                                                                                                                                                                                                            5.950
                                                                                                                    5.950

                                                                                                                                                                                                                                                                                                                                                                              5.910
                                                                                                                                                                                                    5.870
                                                                                                                                                                                            5.840

                                                                                                                                                                                                                                                                 5.830
                                                                                                                                                                                                5.820
                                                                                                           5.790
                                                                                                   5.5

                                                                                                                                                                                                                                5.780
                                                                    294,793       228,890

                                                                                                                                                                                                                                                         5.620
                                                                                                                5.610

                                                                                                                                                                                                                            5.560

                                                                                                                                                                                                                                    5.560

                                                                                                                                                                                                                                                             5.560
                                                                                                                                                                                                                                                 5.530
                                                                                                                                                                                                                                                     5.500
                                                                                                                                                                                                                                            5.440
                                                                                                                                                                                                                    5.420
                                                                                                                                                                                                                        5.390
                                                                                                   5.0

                                                                                                                                                                                                                                        5.220
      To government
                                                                                                   4.5

         Corporate and property taxes                               154,608        97,650
                                                                                                   4.0

      To providers of capital                                                                      3.5

         Interest expense                                            97,890        61,859          3.0

         Dividend attributable to non-controlling interests          27,378          3,775         2.5

         Dividend attributable to equity holders of the Company     147,418       120,716          2.0                                                                                                                                                                                            High                      High
                                                                                                                                                                                                                                                                                                           Prices                       2018 Prices
                                                                                                                                                                                                                                                                                                  Low                       Low
                                                                    272,686       186,350          1.5

      Total Value Added Distributed                                 722,087       512,890          1.0
                                                                                                           J F MAM J J A S OND                                   J F MAM J J A S OND                                 J F MAM J J A S OND                                  J F MAM J J A S OND                                    J F MAM J J A S OND
                                                                                                                                2014                                                2015                                                2016                                                  2017                                                  2018
Craving Communities UOL SUSTAINABILITY REPORT 2018
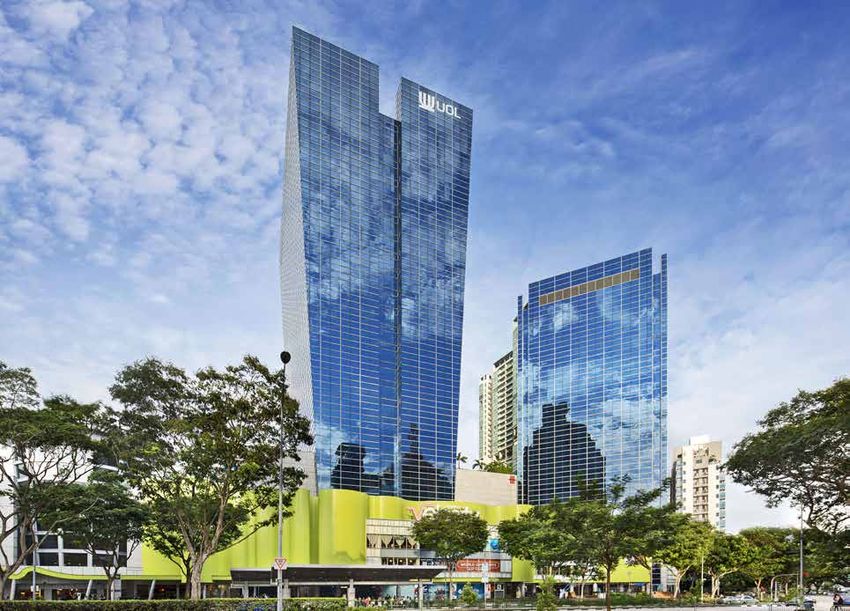
15   UOL SUSTAINABILITY REPORT 2018                                                            UOL SUSTAINABILITY REPORT 2018     16
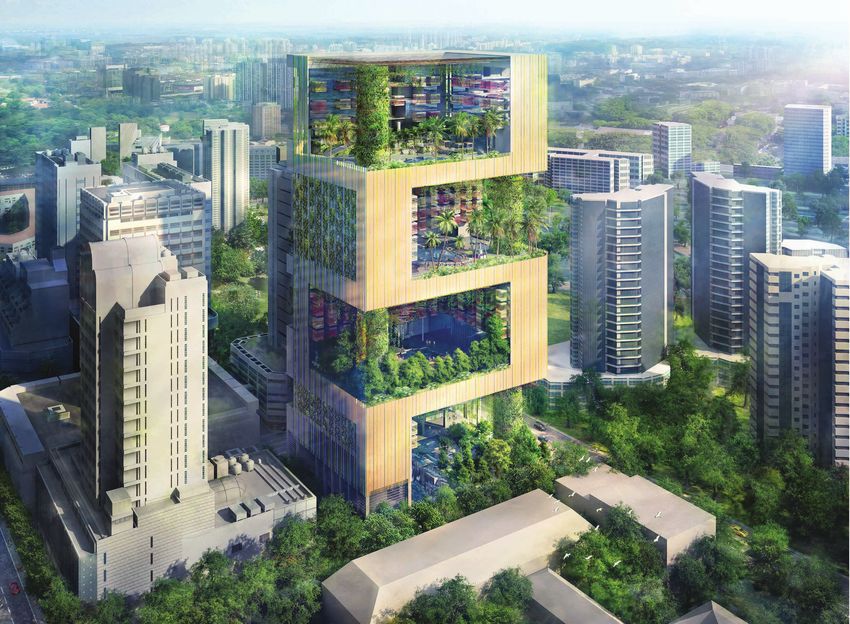
          Closer to Nature
                                      Pan Pacific Orchard (artist's impression)
                                      will be redeveloped into a green hotel.

                                                                                  PRODUCT AND
                                                                                  SERVICE QUALITY

                                                                                  Driven by our passion and commitment to deliver
                                                                                  quality products and services to our stakeholders,
                                                                                  we proac tively integrate innovation and
                                                                                  creativity into the buildings we develop, adopt
                                                                                  sustainable practices and manage our operations
                                                                                  in a customer-focused, resource-efficient manner.

                                                                                  For our property development, we continue to
                                                                                  employ innovative technologies such as PPVC.
                                                                                  Our second PPVC projec t is Avenue South
                                                                                  Residence, a 56-storey twin towers at Silat
                                                                                  Avenue that will set a new world record for
                                                                                  tallest reinforced concrete PPVC residential
                                                                                  development. This will surpass our own record
                                                                                  for The Clement Canopy that was completed in
                                                                                  March 2019. We also adopted biophilic design
                                                                                  by incorporating green elements into buildings,
                                                                                  to suppor t a natural and sustainable living
                                                                                  environment. (See case study on page 17.)

                                                                                  For our hospitality business, we closely monitor
                                                                                  in-house guest satisfaction surveys, and external
                                                                                  reviews on multiple platforms. We continue to
                                                                                  benchmark our performance via an external
                                                                                  Quali t y A s sur ance specialis t . Employee
                                                                                  development and training is a key factor in the
                                                                                  provision of service excellence in hospitality
                                                                                  business. Please refer to the People Development
                                                                                  section for our initiatives on enhancing service
                                                                                  quality.
Craving Communities UOL SUSTAINABILITY REPORT 2018
17      UOL SUSTAINABILITY REPORT 2018                                                                                                                                                          UOL SUSTAINABILITY REPORT 2018      18

                                                                                                                    KINEX offers a new level of experiential shopping after   A permanent pop-up retail concept was introduced to
                                                                                                                    the rebranding.                                           refresh brand and product experiences.

                                                                                                                    REBRANDED MALL TO INJECT MORE
                                                                                                                    EXPERIENTIAL APPEAL AND COMMUNITY
                                                                                                                    ACTIVITIES
                                                                                                                    To keep up with the changing retail landscape, OneKM in Paya Lebar was rebranded
     The Tre Ver’s (artist’s impression) biophilic design can improve the health and well-being of its residents.
                                                                                                                    to KINEX to become an experiential and community-centric mall that promotes social
                                                                                                                    activities and interactions in August 2018.

     INCORPORATING NATURE INTO HOMES                                                                                KINEX’s new tagline, “Let’s Play”, encompasses a variety of lifestyle and community-
                                                                                                                    based facilities, activities and events. A major attraction of KINEX will be the first-of-
     The Tre Ver is a 729-unit residential development at Potong Pasir Avenue 1 overlooking
                                                                                                                    its-kind indoor retail theme park operated by Invade Industry, the company behind
     the Kallang River.
                                                                                                                    co-making space MOX. It offers a wide range of interesting, independent lifestyle
                                                                                                                    brands, trendy workshops, events and a café. The mall also features a permanent
     True to the concept of biophilic design, the development is built into the surrounding
                                                                                                                    pop-up retail concept where products and services are updated regularly. The Green
     natural landscape, with sky terraces for all nine towers and airy living spaces in all
                                                                                                                    Collective SG, Singapore’s first green lifestyle concept store, also opened at KINEX,
     units, including green foyers for some residential units. Twelve existing mature
                                                                                                                    offering eco-friendly products and services as well as experiential workshops.
     raintrees along the river were conserved and integrated with a 200m-long
     recreational deck within the development. A variety of other amenities are set against
                                                                                                                    Ms Jesline Goh, Chief Investment and Asset Officer, said: “The retail landscape is
     the landscaped terraces and water cascades, under the continuous raintree canopy.
                                                                                                                    changing and as a mall owner, we continually look at ways to redefine and rethink
                                                                                                                    the shopper experience to stay relevant. With e-commerce and social media, retail
     The orientation and configuration of the residential blocks are designed to maximise
                                                                                                                    spaces need to evolve to bring about unique experiences that consumers cannot
     space, which enhances the natural lighting and cross-ventilation of the whole
                                                                                                                    find online. KINEX – a combination of kinetics and experience, aims to bring the
     development. Designed by award-winning WOHA Architects, “breathing architecture”
                                                                                                                    community together through creating and collaborating with retailers on fresh
     is integrated within the development, giving residents a good feeling that they are
                                                                                                                    experiential concepts to constantly captivate shoppers.”
     connecting with nature.
                                                                                                                    To better engage and connect with our shoppers, in December 2018, we launched our
     By incorporating these design considerations, The Tre Ver provides a high-rise natural
                                                                                                                    first customer loyalty platform for our three malls – United Square,Velocity@Novena
     home amidst the humid tropical climate of Singapore.
                                                                                                                    Square and KINEX. Known as U-POPP, which stands for UOL’s Power of Purchase
                                                                                                                    Program, members get to redeem rewards and earn loyalty points at our three malls.
                                                                                                                    The initiative allows us to access shoppers' preferences to understand them better
                                                                                                                    and provide better service.
19       UOL SUSTAINABILITY REPORT 2018                                                                                                                                                        UOL SUSTAINABILITY REPORT 2018                20

     ENVIRONMENT
     We recognise that our business operations will have an impact on the environment.                    BUILDING ENERGY AND WATER CONSUMPTION
     Environmental and efficiency considerations are therefore factored in from design, to
     construction and operation. We also monitor the environmental performance of our                         Indicators                  Scope                            Target 6                              Status
     properties and improve the resource-efficiency of our managed buildings through                          Energy Intensity            Commercial Properties            16% reduction of                      TARGET MET
     ongoing maintenance and fit-out.                                                                                                                                      energy intensity by
                                                                                                                                                                           GFA occupied by 2020
                                                                                                                                                                           (Base year: 2010)

                                                                                                              Energy Intensity            Hospitality                      27% reduction of energy               Ongoing
                                                                                                                                                                           intensity by guest night by
                                                                                                                                                                           2020 (Base year: 2013)
                                                                                                                                                                           (long-term target)

                                                                                                                                                                           2% reduction of energy                Target not met
                                                                                                                                                                           intensity by guest night by
                                                                                                                                                                           2018 (Base year: 2017)
                                                                                                                                                                           (short-term target)

                                                                                                          In 2018, our commercial properties achieved an 18.8% reduction of energy intensity by
                                                                                                          GFA occupied compared with the base year of 2010, thus exceeding our target of 16%
                                                                       For its environmentally-friendly   reduction by 2020 by nearly two years in advance. We recorded a reduction of 1.2%
                                                                       features, Novena Square was
                                                                                                          and 16.2% year-on-year in energy intensity by GFA occupied for our offices and mixed
                                                                       conferred the BCA Green Mark
                                                                       GoldPlus award.                    development buildings respectively.

     BECOMING MORE ECO-FRIENDLY                                                                           Our hospitality business is on track towards meeting its target of 27% reduction in energy
                                                                                                          intensity by guest night by 2020 compared with the base year of 2013, having achieved
     Novena Square, comprising two office blocks and a retail mall, was first opened in 2000.             a 26.3% reduction in 2018.

     In our commitment to reducing the environmental impact of existing buildings, in                     In 2018, while our hospitality business achieved a 4.5% reduction in total energy
     2018, Novena Square went through an extensive retrofitting to improve water and                      consumed compared with 2017, the energy intensity by guest night increased by 2.8%
     energy efficiencies. Some new features were also added to encourage shoppers                         compared with 2017. Therefore, we did not meet our year-on-year target of 2% reduction.
     and tenants to reduce their carbon footprint. The initiatives included:                              This was mainly due to the disproportionate decrease in guest nights versus energy use.

     •    retrofitting the chiller plant system for better efficiency
                                                                                                          Overall, the Group’s energy consumption and GHG emissions were 114,979 MWh and
     •    installing motion sensors and energy efficient lighting
                                                                                                          47,861 tonnes of CO2 equivalent respectively in 2018. This was a reduction of 6.4%
     •    using smart metering system to monitor water consumption
                                                                                                          from 2017 in both energy consumption and GHG emissions.
     •    using fit flow regulators in taps to regulate water flow and minimise wastage
     •    building dedicated bicycle lots
                                                                                                          Building energy includes electricity consumption from the grid, cooling consumption,
     •    making priority parking lots available for hybrid or electric vehicles
                                                                                                          piped gas and diesel used onsite. Given the nature of their operations, our hotels have
     •    installing carpark guidance system to direct drivers to the nearest available parking lot
                                                                                                          the highest energy and water consumption, and are the largest contributor to the Group’s
                                                                                                          building energy and water consumption.
     The positive outcome of the retrofitting was seen by the significant increase in our
     resource use efficiency. The energy consumption by GFA occupied of Novena Square
                                                                                                          Our hospitality business continues to focus on initiatives to improve operational efficiency
     reduced by 22.8% in 2018 compared with 2017, while the water consumption per
                                                                                                          across its properties including, for example, installing Building Management Systems
     GFA occupied reduced by 8.8% in 2018 compared with 2017.
                                                                                                          and centralised digital chiller plant systems to improve monitoring of consumption
                                                                                                          and utility data, and upgrading electrical fan motors and switchboards to more energy-
     For its green effort, Novena Square was awarded Green Mark GoldPlus for an Existing
                                                                                                          efficient variants.
     Non-Residential Building by the Building and Construction Authority.

                                                                                                          6
                                                                                                           Given the different nature of our businesses, the normalisation factors used in our energy and water targets for our commercial
                                                                                                          properties and hospitality are GFA occupied and guest nights respectively. The intensity data for the Group is reported on a per
                                                                                                          GFA basis in Appendix A.
21             UOL SUSTAINABILITY REPORT 2018                                                                                                                                                                                              UOL SUSTAINABILITY REPORT 2018                  22

                                                                                                                                              Indicators                       Scope                          Target 7                                    Status
             BUILDING ENERGY CONSUMPTION                                         BUILDING ENERGY INTENSITY
                                                                                      BY GFA OCCUPIED                                         Water Intensity                  Commercial                     10% reduction of water                      TARGET MET
                                                                                                                                                                               Properties                     intensity by GFA occupied
            MWh                                                        kWh/m2                                                                                                                                 by 2020 (Base year: 2010)
         140,000                                                          700

                                                                          600
                                                                                                                                              Water Intensity                  Hospitality                    25% reduction of water intensity            TARGET MET
         120,000                                                                                                             589.9
                                                                                                                                                                                                              by guest night & cubic metres/
         100,000                                                          500                                                                                                                                 guest night by 2020
                                                                                                                                                                                                              (Base year: 2013)
           80,000                                                         400
                                                                                                                                                                                                              (long-term target)
                                                                                                                             328.3
           60,000                                                         300
                                                                                                                             258.9
                                                                                                                                  240.3
                                                                                                                                                                                                              2% reduction of water intensity             TARGET MET
                                                                          200
           40,000
                                                                                                                                                                                                              by guest night by 2018
           20,000                                                         100
                                                                                                                                  146.2                                                                       (Base year: 2017)
                                                                                                                                  139.1                                                                       (short-term target)
               0                                                            0
                    2013      2014     2015    2016    2017   2018               2013       2014   2015    2016    2017    2018

                     Retail              Mixed Developments                       Group              Serviced Suites
                     Offices             Hotels                                   Retail             Mixed Developments
                     Serviced Suites                                              Offices            Hotels
                                                                                                                                          with a water intensity reduction of 7.9% in 2018 compared with 2017. This was a result from
                                                                                                                                          our daily water monitoring and tracking initiatives, installation of constant flow regulators at
                                                                                                                                          the water basins and shower facilities in guest rooms, and usage of harvested rainwater for
                    BUILDING GHG EMISSIONS                               BUILDING GHG EMISSIONS INTENSITY                                 non-potable water consumption.
                                                                                 BY GFA OCCUPIED
      tonnes CO2e
                                                                                                                                          In 2018, the Group’s building water consumption was 846.7 thousand m3. Water used at all our
           60,000
                                                                     kgCO2e/m2
                                                                                                                                          properties is from municipal sources.
                                                                           300
           50,000

                                                                           250                                                244.7
           40,000
                                                                           200

           30,000
                                                                                                                                                     BUILDING WATER CONSUMPTION                                                  BUILDING WATER INTENSITY
                                                                           150                                                                                                                                                       BY GFA OCCUPIED
                                                                                                                              136.7
           20,000                                                                                                              108.5           thousand m3                                                               m3/m2
                                                                           100                                                                       1,200                                                                  5
                                                                                                                                  100.7
                                                                                                                                  61.3
           10,000                                                           50                                                                       1,000
                                                                                                                                  58.3                                                                                      4
                                                                                                                                                                                                                                                                              3.7
               0                                                             0                                                                        800
                    2013      2014     2015    2016    2017   2018                2013      2014   2015    2016     2017   2018                                                                                             3

                     Retail              Mixed Developments                       Group               Serviced Suites                                 600                                                                                                                        2.4
                     Offices             Hotels                                   Retail              Mixed Developments                                                                                                                                                         2.3
                                                                                                                                                                                                                            2                                                    2.2
                     Serviced Suites                                              Offices             Hotels                                          400
                                                                                                                                                                                                                                                                              1.5
                                                                                                                                                                                                                                                                              1.1
                                                                                                                                                                                                                            1
                                                                                                                                                      200

                                                                                                                                                        0                                                                   0
                                                                                                                                                             2013    2014      2015    2016    2017    2018                      2013       2014   2015    2016    2017   2018

     In 2018, our commercial properties achieved a 24.1% reduction in water intensity by GFA                                                                 Retail               Mixed Developments                             Group              Serviced Suites

     occupied, compared with the base year of 2010, thus exceeding our target of 10% reduction                                                               Offices              Hotels                                         Retail
                                                                                                                                                                                                                                 Offices
                                                                                                                                                                                                                                                    Mixed Developments
                                                                                                                                                                                                                                                    Hotels
                                                                                                                                                             Serviced Suites
     by 2020.

     Our hospitality business achieved a 29.8% reduction in water intensity by guest night in 2018,
     compared with the base year of 2013, thus exceeding our target of 25% reduction by 2020.
     We also achieved our year-on-year target of 2% reduction of water intensity by guest night

                                                                                                                                          7
                                                                                                                                           Given the different nature of our businesses, the normalisation factors used in our energy and water targets for our commercial properties
                                                                                                                                          and hospitality are GFA occupied and guest nights respectively. The intensity data for the Group is reported on a per GFA basis in Appendix A.
23       UOL SUSTAINABILITY REPORT 2018                                                                                                                                      UOL SUSTAINABILITY REPORT 2018   24

     ENERGY AND WATER CONSUMPTION                                                                                 Total water consumption from municipal sources was 132.9 thousand m3 in 2018.
     FOR DEVELOPMENT PROJECTS                                                                                     One of our initiatives to reduce water use at our development projects is to use
                                                                                                                  wastewater from construction activities to wash trucks and other vehicles before they
      Indicators               Scope                      Target                         Status                   leave the construction sites. These vehicles are washed to minimise pollution to the
      Carbon Footprint and     Commercial Properties      Green Mark Gold for new        Not applicable;          public road surfaces.
      Water Consumption                                   development of investment      no new developments
                                                          properties in Singapore        in 2018                  All main contractors undertaking our projects in 2018 were certified to ISO 14001 and
                                                                                                                  Green and Gracious Builder.
      Value Chain              Development Projects       All main contractors           TARGET MET
      Impact for Material      in Singapore               certified to ISO 14001                                  Contractors are awarded The Green and Gracious Builder certification by the BCA for
      Environmental Topics                                and Green and Gracious                                  meeting high standards in environmental and social practices including material use,
                                                          Builder                                                 GHG emissions, water use and air quality.

      Development Projects                              2018         2017      2016          2015         2014    ENERGY CONSUMPTION FOR CORPORATE OFFICE
      Electricity Consumption (GJ)                      6,866        4,515     4,888         6,077        5,541
                                                                                                                  Our corporate office is located within one of our commercial properties. In 2018, the
      Diesel consumed (GJ)                             27,336       22,599    21,313        20,893       26,286   corporate office used 331.3 MWh of energy, an increase from 315.7 MWh in 2017.
                                                                                                                  GHG emissions also increased by 4.9% from 132.4 tonnes of CO2 in 2017 to 138.9
      Total Energy consumed (GJ)                       34,202       27,114    26,201        26,970       31,827   tonnes in 2018. The increase in energy consumed was due to the increase in our corporate
      Total GHG emissions (tonnes of CO2e)              2,825        2,201     2,149         2,261        2,606   office headcount.

      GHG Intensity by value of work completed           17.6         10.5         9.2        11.1         13.0
      (kg CO2e/$’000)
                                                                                                                  WASTE AND RESOURCE MANAGEMENT
      Total water consumed (m3)                   132,911           98,866   100,099       107,890      136,880
                                                                                                                  For the first time in 2018, we reported on waste and recycling from all of our commercial
      Water intensity by value of work                    0.8          0.5         0.4            0.5       0.7   properties, hotels and serviced suites.
      completed (m3/$’000)
                                                                                                                  In 2018, the Group recorded 7,629.6 tonnes of waste disposed with a breakdown of
      Value of work completed ($’000)             160,511          209,678   233,943       203,130      201,091
                                                                                                                  3,833.4 tonnes and 3,796.2 tonnes from our commercial properties and hospitality
                                                                                                                  business respectively.

     Energy and water consumption figures per year are highly dependent on the phase of                           Our commercial properties sent 375.9 tonnes of waste for recycling, while our hospitality
     construction. Consumption is typically heaviest during the middle phase of development                       business sent 84.8 tonnes.
     projects. Development projects active during 2018 included The Clement Canopy,
     Principal Garden, The Tre Ver, Botanique at Bartley and Pan Pacific Orchard.

     In 2018, total energy consumed at our development projects was 34,202 GJ (or 34.2
     TJ). Energy consumed mainly comes from electricity and diesel use (the latter when a
     connection to the municipal supply has not yet been established). Total GHG emissions
     was 2,825 tonnes of CO2 equivalent, with a breakdown of 2,026 tonnes and 799 tonnes
     from Scope 1 and Scope 2 respectively. The GHG intensity by tonnes value of work
     completed was 17.6 of CO2 equivalent per thousand dollars.
25    UOL SUSTAINABILITY REPORT 2018                                                              UOL SUSTAINABILITY REPORT 2018            26

     Connecting Communities
                                       Staff volunteering activity organised for
                                              Care Corner Student Care Centre.

                                                                                   HEALTH AND SAFETY

                                                                                   WORKPLACE SAFETY FOR
                                                                                   DEVELOPMENT PROJECTS
                                                                                    Indicators    Scope           Target           Status
                                                                                    Value Chain   Development     All main         TARGET
                                                                                    Impact For    Projects        contractors      MET
                                                                                    Health And                    to be
                                                                                    Safety                        OHSAS
                                                                                                                  18001
                                                                                                                  certified

                                                                                   For all our development projects, we strive for
                                                                                   zero health and safety incidents.

                                                                                   We recorded a slight increase in our accident
                                                                                   frequency rate (AFR), from 0.6 in 2017 to 0.8 in
                                                                                   2018, which is below the national industry average
                                                                                   of 1.5. The accident severity rate (ASR) increased
                                                                                   from 5.5 in 2017 to 17.0 in 2018, while remaining
                                                                                   significantly lower than the national industry
                                                                                   average of 115. Our contractors recorded a total
                                                                                   of four injuries resulting in 88 lost days, with no
                                                                                   injuries involving female staff of contractors
                                                                                   in 2018.
27      UOL SUSTAINABILITY REPORT 2018                                                                                                                                                                                 UOL SUSTAINABILITY REPORT 2018   28

                                                                                                                                                           FOOD SAFETY AND HYGIENE
       ACCIDENT FREQUENCY RATE (AFR)                                                      ACCIDENT SEVERITY RATE (ASR)
          Number of injuries per million                                                      Number of man-days lost                                      Ensuring the safety and security and enhancing the well-being of guests in our hospitality
              man hours worked                                                              per million man hours worked                                   business is a fundamental priority.

        5.0                                                                           300.0                                                                To highlight this commitment, our hospitality business launched a comprehensive Food
              3.8                                                                                                                                          Safety Management System (FSMS) in 2018. The programme includes extensive food
                                                                                                                                                           safety training along with external audits along the entire food chain, from receipt of
                                                                                      200.0

        2.5
                                                                                      100.0   66.6
                                                                                                                                               115         raw produce, preparation to delivery. The programme enhances our existing procedures
                                                                  1.5
                           0.4        0.5          0.6            0.8                                  6.2          10.1       5.5        17.0             and helps cultivate best practice in our food safety culture.
                                                                                         0
         0                                                                                    2014    2015         2016       2017       2018
              2014        2015       2016        2017          2018
                                                                                                                                                           Our hotels maintained our track record for food safety. A marginal number of cases
                    AFR      AFR (National industry average)                                    ASR          ASR (National industry average)
                                                                                                                                                           were reported and thoroughly investigated with laboratory tests, where possible. No
                                                                                                                                                           indications of contamination were found in any of the samples in 2018.

                                                                          Main Contractors                   Sub-contractors                     Total
                                                                            Male          Female             Male          Female
                                                                                                                                                           GUEST SAFETY AND SECURITY
      No. of workplace fatalities                                                 0             0                  0                 0                0
                                                                                                                                                           There were no substantiated issues concerning guest safety and security in 2018.
      No. of non-fatal                                                            2             0                  2                 0                4
      workplace injuries
      No. of occupational diseases                                                0             0                  0                 0                0
      No. of dangerous occurences/near misses                                     0             0                  0                 0                0    INCIDENT REPORTING
      No. of lost days                                                        35                0                 53                 0               88    The number of injuries reported at all buildings was 53 (124 in 2017) in 2018. This
      Total no. of man hours worked                                     1,781,358        213,341      3,178,490              2,070        5,175,259        included guests, tenants and visitors, as well as employees and contractors in our
                                                                                                                                                           commercial properties.

     WORKPLACE SAFETY FOR HOSPITALITY BUSINESS
     In 2017, in order to increase comparability, we aligned our hospitality workplace safety
     reporting with the GRI requirements and the other parts of our business. In 2018,
     there were 24 non-fatal workplace incidents in our hospitality business compared
     with 45 in 2017. As such, the AFR decreased from 10.8 in 2017 to 6.4 in 2018. However,
     the number of lost man days from these incidents was higher than in 2017 and as such
     the ASR increased from 56.9 in 2017 to 101.0 in 2018.

                                                                                  Employees                 Other workers                        Total
                                                                                                         (e.g. contractors)
                                                                          Male            Female             Male          Female
      No. of workplace fatalities                                             0                 0                 0                  0                0
      No. of non-fatal workplace injuries                                    17                 7                 0                  0               24
      No. of occupational diseases                                            0                 0                 0                  0                0
      No. of dangerous occurences/near misses                                 0                 0                 0                  0                0
      No. of lost days                                                      338               41                  0                  0               379
      Total no. of man hours worked                                   1,965,282       1,687,340        52,852               45,177        3,750,651
29         UOL SUSTAINABILITY REPORT 2018                                                                                                                                        UOL SUSTAINABILITY REPORT 2018   30

     PEOPLE
     In 2018, the Group employed 1,827 persons in Singapore, with over 90% employed in                                  DIVERSITY AND INCLUSION
     the hospitality business. In terms of employees leaving the business in 2018, the
     turnover rate of the property business increased from 10.1% in 2017 to 13.3% in 2018,                              We believe a diverse work environment will enrich our perspectives and attract
     while the turnover rate of the hospitality business decreased from 33.8% in 2017                                   high-calibre candidates from the widest talent pool. Our workforce consists of nearly
     to 32.1%. However, over the last five years, the turnover rate for the Group has steadily                          20 nationalities across the Group.
     decreased with turnover rates for the property and hospitality businesses remaining
     below the respective national industry averages every year.                                                        In our property business, 40% of Senior Management were female, while 60% were
                                                                                                                        male (44% female and 56% male in 2017). In our hospitality business, 48% of Senior
     The Group recorded an absentee rate of 2.8% in 2018 (unchanged from 2017), or                                      Management of our various business units were female, while 52% were male (45%
     roughly an average of 7.3 days of sick leave per employee based on a five-day work                                 female and 55% male in 2017).
     week. The absentee rate of our property business was 2.7% while that of the hospitality
     business was 2.8%.                                                                                                 We continue to promote the redeployment of mature workers into the business. As at end
                                                                                                                        December 2018, 22.2% of employees in our property business and 19.8% of employees
                                                                                                                        in our hospitality business were above the age of 50.

                                                                                                                        We also foster a supportive and encouraging environment for our employees with children
                                                           TURNOVER RATE
                                                                                                                        and dependents. The Group offers paternity leave to working fathers whose child is not
                 45%
                                                                                                                        a Singapore citizen, even though paternity leave is only applicable to employees whose
                 40%
                                                                                                                        child is a Singapore citizen under the Ministry of Manpower’s regulation.
                 35%
                 30%
                 25%                                                                                                    We believe in leveraging and developing the skills of the people in our local
                 20%                                                                                                    communities. In 2018, 96.7% of Senior Management and 97.7% of other employees
                 15%                                                                                                    in our property business were Singaporeans or Permanent Residents, while 86.5% of
                 10%                                                                                                    Senior Management and 55.6% of other employees in our hospitality business were
                  5%
                                                                                                                        Singaporeans or Permanent Residents. We align ourselves with Singapore’s national
                  0%
                             2018                 2017                   2016                  2015      2014
                                                                                                                        targets on diversity and inclusion in our workforce.
                                                         Group     Property      Hospitality

                                                                                                                                                     WORKFORCE BY GENDER

                                                            2018                2017            2016   2015     2014              GROUP                       PROPERTY                       HOSPITALITY
     Group                                                 30.5%                32.0%          32.1%   34.5%    41.4%
     Property                                              13.3%                10.1%          16.1%   15.4%    14.3%
     National industry average8                            30.0%                32.4%          34.8%   37.2%    40.8%
     (Real Estate Services)                                                                                                                                            34%
                                                                                                                                                                       34%                  46%
                                                                                                                            48%        52%                                                                54%
     Hospitality                                           32.1%                33.8%          33.4%   33.4%    40.3%       48%                                                             46%
                                                                                                                                       52%                  66%                                           54%
     National industry average8                            39.6%                43.2%          43.2%   48.0%    51.6%                                       66%
     (Accommodation & Food Services)

                                                                                                                              Male   Female                  Male    Female                    Male     Female
                                                                                                                              Male   Female                  Male    Female                    Male     Female

      8
          Source: Ministry of Manpower Singapore, 14 March 2019.
31        UOL SUSTAINABILITY REPORT 2018                                                                                                                                                          UOL SUSTAINABILITY REPORT 2018            32

                                                                                                                        COMMUNITY

     PEOPLE DEVELOPMENT                                                                                                 Our community efforts provide opportunities for us to engage with and give back to the
                                                                                                                        society in which we operate. The initiatives include cash donations, in-kind donations and
                                                                                                                        staff volunteerism to deliver meaningful impact.
                                 AVERAGE TRAINING HOURS PER EMPLOYEE

            100.0
                                                                                                                        UOL supports Care Corner Student Care Centre, which provides before-and-after-
                                                                                                                        school care for students. The programme is also available to underprivileged children.
              80.0                                                                                                      In 2018, UOL sponsored the replacement of ceiling fans in its two centres, so that the
              60.0
                                                                                                                        children can learn and grow in a comfortable environment.

              40.0                                                                                                      For the second year, UOL donated to KK Women’s and Children’s Hospital Health Fund
              20.0
                                                                                                                        to support its Art Therapy Programme to benefit young patients from low-income
                                                                                                                        families. We also continued to support the Riding for the Disabled Association (RDA)
               0.0                                                                                                      Singapore with a sponsorship to help in its mission to provide free horse-riding therapy
                         2018                 2017                  2016                  2015          2014
                                                                                                                        to children and adults with physical and mental disabilities. The horses were also
                                                     Group    Property     Hospitality                                  brought to United Square for our shoppers to interact with the horses and contribute to
                                                                                                                        RDA Singapore’s fundraising effort. During the year, UOL supported Gardens by the Bay
                                                                                                                        by adopting a sculpture, Watching Clouds, for five years.
                                   2018                      2017                2016            2015            2014
                                                                                                                        UOL employees are encouraged to volunteer their time to help the less fortunate
      Group                          89.4                    85.0                  85.1          86.6            44.3   through staff volunteering activities. Two activities were organised during the year for
      Property                       34.2                    24.7                  26.7          23.8            27.8
                                                                                                                        the children from Care Corner Student Care Centre and the elderly from AWWA Senior
                                                                                                                        Community Home.
      Hospitality                    94.6                    90.0                  89.5          92.1            45.7
                                                                                                                        Throughout the year, PPHG continued to further its “Eat Well With Us” initiative, with the
     The Group recorded 89.4 hours of average training hours per employee in 2018,                                      Senior Chefs imparting their culinary skills and recipes to the resident cooks at charity
     an increase from 85.0 hours in 2017.                                                                               homes. A pioneer of inclusive hiring in Singapore’s hospitality sector, PPHG collaborates
                                                                                                                        with community partners such as SG Enable to offer students with special needs
                                                                                                                        internships and employment at its hotels. PPHG also contributed to the welfare of
      Indicators                                      Scope                Target                       Status
                                                                                                                        caregivers by providing design expertise to Enabling Village’s Caregivers Pod, a dedicated
      Talent attraction and retention through         Property             Average training hours       TARGET MET      multi-functional space for caregivers to organise peer support sessions and gatherings.
      people development                                                   per employee: 25 hours
                                                                           per year
                                                                                                                        For its community contributions, PPHG was conferred the People’s Association
                                                                                                                        Community Spirit Award and recognised as Champion of Good by the National
                                                                                                                        Volunteer & Philanthropy Centre for the first time.
     The average training hours per employee for our property business was 34.2 hours,
     exceeding our target of 25 hours.

      Indicators                                      Scope                Target                       Status

      Service quality and talent attraction           Hospitality          Average training hours       TARGET MET
      and retention, through people                                        per employee: 80 hours
      development                                                          per year

     For our hospitality business, the average training hours per employee was 94.6 hours,
     exceeding our target of 80 hours. The increase in training hours could be attributed to the
     new training framework with a refresher focus implemented in 2018, where all employees
                                                                                                                        UOL supported RDA Singapore's mission to provide free   UOL volunteers brought Christmas cheer to 40 elderly from
     in our hospitality business received training on a range of courses. Topics such as service                        horse-riding therapy to people with disabilities.       AWWA Senior Community Home by lunching and shopping
     skills, service mindset and service culture were included in the 2018 training modules.                            (Credit: RDA Singapore)                                 with them at Velocity@Novena Square.
33     UOL SUSTAINABILITY REPORT 2018                                                                                                                           UOL SUSTAINABILITY REPORT 2018   34

                                                                                          CREATING VIBRANT SPACES FOR
                                                                                          COMMUNITIES TO CONNECT AND THRIVE
                                                                                          As one of the largest property developers in Singapore, UOL supports the nation’s
                                                                                          vision for a more liveable and sustainable Singapore. Besides building quality
                                                                                          homes and giving back to society, UOL is committed to building a more vibrant and
                                                                                          inclusive society where people can connect and foster a strong community spirit.

                                                                                          In June 2018, we organised our first community festival, Craving Communities,
                                                                                          at a large open field in Bishan to engage our local community. The two-day event
                                                                                          featured a line-up of local gourmet food, free craft workshops, a flea market, games,
                                                                                          live band performances, as well as an open-air movie screening in the evening. VSA
                                                                                          was also offered a space to raise funds through the sale of its paintings. There was
                                                                                          a strong turnout from members of the public, and even Member of Parliament for
                                                                                          Bishan-Toa Payoh GRC Chong Kee Hiong came to visit.

                                                                                          Mr Liam Wee Sin, Group Chief Executive, said: “The idea is we create spaces for
                                                                                          communities and they must be inclusive. At the same time, we satisfy the cravings
     UOL has been purchasing VSA paintings for its residential showflats.                 that Singaporeans have, which include a love for good food, a healthy lifestyle and of
                                                                                          course, a quality home.”

     SUSTAINABLE EFFORT TO BRING ARTS                                                     In September 2018, a month-long Craving Communities event was organised at
                                                                                          KINEX, which focuses on creating experiential appeal and community activities
     TO OUR SPACES                                                                        after the mall's rebranding. The outdoor plaza was transformed into a lively
     UOL acknowledges the close relationship between art and design. Since 2014, UOL      carnival, featuring popular street food from around the world, live music, band
     has been supporting Very Special Arts (VSA) Singapore, which aims to help artists    performances, and a flea market. There was also a series of free craft workshops for
     with disabilities to integrate into the society.                                     children and adults, making sure there was something for everyone.

     UOL regularly purchases paintings from VSA to support its artists and help           Craving Communities has since become a signature UOL event at our malls and
     them to engage with a wider social community. To date, we have purchased             property launches as a form of greater community engagement.
     over 30 VSA paintings for display in our residential showflats. In 2017, PPHG
     also collaborated with VSA to produce a rendered drawing based on an aerial
     photo of Kampong Glam, which is in the vicinity of PARKROYAL on Beach Road.
     Today, the artwork occupies a place at the Front Desk in the hotel lobby.

     Wherever possible, we also provide opportunities for VSA artists to showcase their
     works. In June 2018, we dedicated a space for VSA when we held our first community
     event in Bishan. In support of the charity’s fundraising efforts, our management
     took the lead and purchased some of their paintings. PPHG was also a venue sponsor
     for VSA to hold its art exhibitions at Pan Pacific Singapore in 2017 and 2018.

                                                                                          The first Craving Communities event by   A series of craft workshops was organised by KINEX.
                                                                                          UOL was held in Bishan to engage the
                                                                                          community with food and entertainment.
35     UOL SUSTAINABILITY REPORT 2018                                                                                                                                UOL SUSTAINABILITY REPORT 2018   36

                                                                                                             AWARDS AND ACCOLADES
                                                                                                             A complete list of awards won by the Group can be found on
                                                                                                             https://www.uol.com.sg/about-uol/awards/

                                                                                                                                                  CORPORATE

                                                                                                             UOL GROUP LIMITED
                                                                                                             Brand Finance
                                                                                                             • Top 100 Singapore Brands 2018 (#32)

                                                                                                             PAN PACIFIC HOTELS GROUP LIMITED
     PPHG volunteers were happy that they brought smiles to the beneficiaries at Gardens by the Bay.         Travel Weekly Asia Readers’ Choice        National Volunteer & Philanthropy Centre
                                                                                                             Awards 2018                               • Champions of Good 2018

     A COURSE FOR A CAUSE                                                                                    • Best Regional Hotel Chain

     Between July and August 2018, a record $75,000 was collected by PPHG, together                          TTG Travel Awards 2018
     with its payment partner Mastercard, towards a good cause.                                              • Best Regional Hotel Chain

     A percentage of the dining bills at eight restaurants within our hotels in Singapore was
     donated to six Day Activity Centres (DACs) operated by Autism Association Singapore,
     Cerebral Palsy Alliance Singapore, Metta Welfare Association, and St Andrew’s
     Autism Centre. These centres help adults with disabilities maximise their independence                                           CONTRACTORS’ SAFETY AWARDS
     and provide welcome respite to caregivers.
                                                                                                             SEVENTY SAINT PATRICK’S                   THOMSON THREE
     To celebrate the achievement,                                                                           • BCA Construction Excellence Award -     • BCA Construction Excellence Award -
     PPHG collaborated with Singapore’s                                                                        Award                                     Merit
     eco-artist Didier Ng to create an art
     installation at Gardens by the Bay.
     Under Didier’s guidance, PPHG
     volunteers and the beneficiaries from
                                                                                                                          PRODUCT, DESIGN AND ARCHITECTURAL EXCELLENCE
     the DACs co-created a snowman-
     themed artwork using waste plastic
     bottles and discarded fabrics. In                                                                       AMBER45                                   RIVERBANK@FERNVALE
     addition, PPHG hosted a Christmas                                                                       PropertyGuru Asia Property Awards         FIABCI Singapore Property Awards 2018
     outing for 150 beneficiaries to view                                                                    (Singapore) 2018                          • Winner - Residential (Mid-rise)
     their artwork and spend meaningful                                                                      • Winner - Best Luxury Condo
     time with their families.                             The snowmen installation was a team effort from     Interior Design
                                                           the beneficiaries and PPHG volunteers.
                                                                                                             • Highly Commended - Best Luxury
                                                                                                               Condo Development
37      UOL SUSTAINABILITY REPORT 2018                                                                                                                          UOL SUSTAINABILITY REPORT 2018         38

                                                                                           APPENDIX A: SUPPLEMENTARY SUSTAINABILITY DATA
                                                                                           Numbers may not add up due to decimal rounding.
                    PRODUCT, DESIGN AND ARCHITECTURAL EXCELLENCE
                                                                                           A1: ENERGY & GHG EMISSIONS
     THE CLEMENT CANOPY                           THE TRE VER
                                                                                            Building Energy Consumption (MWh)                       2018      2017        2016         2015        2014
     Singapore Excellence Awards 2018             International Property Awards (Asia
                                                  Pacific) 2018                             GROUP                                              114,979      122,880    127,038      124,115      120,840
     • Top Development Award
       (Uncompleted - Non-Central)                • Winner - Residential High-rise          Commercial Properties                                  30,183    34,093     35,813        35,256      30,103

     • Landscape Excellence Award                   Architecture, Singapore                    Retail                                               5,859     6,430       6,958        7,006         NA
       (Uncompleted - Non-Central)                • Winner - Residential High-rise             Mixed Developments                                  20,230    23,546     24,501        23,773      25,630
                                                    Development, Singapore                     Offices                                              4,093     4,118       4,354        4,477       4,473
                                                                                            Hospitality                                            84,796    88,787     91,225        88,859      90,737
     NOVENA SQUARE                                PropertyGuru Asia Property Awards
     BCA Green Mark Awards 2018                                                                Hotels                                              78,220    81,941     83,897        81,374      83,351
                                                  (Singapore) 2018
     • Green Mark GoldPlus                                                                     Serviced Suites                                      6,576     6,846       7,328        7,485       7,386
                                                  • Highly Commended - Best Private
                                                    Condo Landscape Architectural Design    Building Energy Intensity By GFA (kWh/m2)

                                                  • Highly Commended - Best Private         GROUP                                                   296.7     305.4       316.0        308.7       323.9
     PAN PACIFIC ORCHARD                            Condo Interior Design                   Commercial Properties                                   149.9     169.3       177.9        175.1       174.6
     International Property Awards
                                                  • Highly Commended - Best Private            Retail                                               202.5     222.2       240.5        242.1         NA
     (Asia Pacific) 2018
                                                    Condo Architectural Design                 Mixed Developments                                   141.8     165.0       171.7        166.6       179.7
     • 5-star - Best New Hotel Construction
                                                  • Highly Commended - Best Private            Offices                                              137.6     138.4       146.3        150.3       150.1
       & Design Singapore
                                                    Condo Development
     • 5-star - Best Hotel Architecture                                                     Hospitality                                             455.4     441.7       454.7        442.9       452.3
       Singapore                                                                               Hotels                                               501.5     479.7       492.3        477.5       489.1
                                                                                               Serviced Suites                                      217.7     226.7       242.6        247.8       244.5
                                                                                            Building Energy Intensity By GFA Occupied (kWh/m ) 2

                                                                                            GROUP                                                   328.3     338.2       354.6        352.6       364.2
                                         SERVICE EXCELLENCE
                                                                                            Commercial Properties                                   157.1     178.0       188.2        189.7       181.3
     PAN PACIFIC                                  PARKROYAL ON PICKERING                       Retail                                               240.3     235.4       249.6        255.6         NA
     SERVICED SUITES                              World Travel Awards 2018                     Mixed Developments                                   146.2     174.5       183.6        182.7       186.5
     DestinAsian Readers’ Choice                  • The World’s Leading Green City Hotel       Offices                                              139.1     140.9       150.5        158.2       156.4
     Awards 2018
                                                  • Asia’s Leading Green Hotel              Hospitality                                             536.7     516.8       542.9        534.6       547.6
     • Top 5 Serviced Residence Brands
                                                                                               Hotels                                               589.9     557.0       589.7        582.2       595.7
                                                                                               Serviced Suites                                      258.9     277.1       284.6        283.2       286.7
                                                                                            Building Energy Intensity By Guest Night (kWh/guest night) (Hospitality only)
                                                                                            Hospitality                                              53.6      52.1         58.8        60.1        63.1
                                                                                               Hotels                                                57.8      55.3         63.0        64.2        67.3
                                                                                               Serviced Suites                                       28.8      30.8         33.2        35.5        37.2
39             UOL SUSTAINABILITY REPORT 2018                                                                                                                                 UOL SUSTAINABILITY REPORT 2018      40

                                                                                                         A2: WATER

 Building GHG Emissions (tonnes of CO2e)              2018        2017       2016       2015     2014    Building Water Consumption (Thousand m3)              2018        2017         2016         2015      2014
 GROUP                                               47,861      51,138     53,416     52,069   51,356   GROUP                                                   847        961         1,010        1,002      941
 Commercial Properties                               12,653      14,292     15,174     14,892   12,875   Commercial Properties                                   299        320           362          355      314
     Retail                                           2,456       2,696      2,948      2,959      NA       Retail                                                55          65           67            74     NA
     Mixed Developments                               8,481       9,870     10,381     10,042   10,962      Mixed Developments                                   211        221           264          249      276
     Offices                                          1,716       1,726      1,845      1,891    1,913      Offices                                               34          34           31            33      39
 Hospitality                                         35,208      36,847     38,242     37,177   38,481   Hospitality                                             548        640           648          647      627
     Hotels                                          32,452      33,981     35,142     34,018   35,322      Hotels                                               490        579           577          579      567
     Serviced Suites                                  2,756       2,866      3,100      3,158    3,159      Serviced Suites                                       58          61           71            68      59
 Building GHG Emissions Intensity By GFA (kg of CO2e/m2)                                                 Building Water Intensity By GFA (m3/m2)
 GROUP                                                123.5       127.1      132.9      129.5    137.7   GROUP                                                    2.2        2.4           2.5          2.5     2.5
 Commercial Properties                                  62.8       71.0       75.4       73.9     74.7   Commercial Properties                                    1.5        1.6           1.8          1.8     1.8
     Retail                                             84.9       93.2      101.9      102.3      NA       Retail                                                1.9        2.3           2.3          2.5     NA
     Mixed Developments                                 59.4       69.2       72.8       70.4     76.8      Mixed Developments                                    1.5        1.5           1.9          1.7     1.9
     Offices                                            57.7       58.0       62.0       63.5     64.2      Offices                                               1.1        1.1           1.0          1.1     1.3
 Hospitality                                          189.1       183.3      190.6      185.3    191.8   Hospitality                                              2.9        3.2           3.2          3.2     3.1
     Hotels                                           208.0       198.9      206.2      199.6    207.3      Hotels                                                3.1        3.4           3.4          3.4     3.3
     Serviced Suites                                    91.2       94.9      102.7      104.6    104.6      Serviced Suites                                       1.9        2.0           2.3          2.3     2.0
 Building GHG Emissions Intensity By GFA Occupied (kg of CO2e/m2)                                        Building Water Intensity By GFA Occupied (m3/m2)
 GROUP                                                136.7       140.8      149.1      147.9    154.8   GROUP                                                    2.4        2.6           2.8          2.8     2.8
 Commercial Properties                                  65.8       74.6       79.8       80.1     77.5   Commercial Properties                                    1.6        1.7           1.9          1.9     1.9
     Retail                                           100.7        98.7      105.7      108.0      NA       Retail                                                2.2        2.4           2.4          2.7     NA
     Mixed Developments                                 61.3       73.1       77.8       77.2     79.8      Mixed Developments                                    1.5        1.6           2.0          1.9     2.0
     Offices                                            58.3       59.0       63.8       66.8     66.9      Offices                                               1.1        1.2           1.1          1.2     1.3
 Hospitality                                          222.8       214.5      227.6      223.7    232.2   Hospitality                                              3.5        3.7           3.9          3.9     3.8
     Hotels                                           244.7       231.0      247.0      243.4    252.4      Hotels                                                3.7        3.9           4.1          4.1     4.1
     Serviced Suites                                  108.5       116.0      120.4      119.5    122.6      Serviced Suites                                       2.3        2.5           2.7          2.6     2.3
 Building GHG Emissions Intensity By Guest Night (m3/guest night) (Hospitality only)                     Building Water Intensity By Guest Night (m3/guest night) (Hospitality only)
 Hospitality                                            22.3       21.6       24.6       25.2     26.8   Hospitality                                              0.3        0.4           0.4          0.4     0.4
     Hotels                                             24.0       22.9       26.4       26.8     28.5      Hotels                                                0.4        0.4           0.4          0.5     0.5
     Serviced Suites                                    12.1       12.9       14.1       15.0     15.9      Serviced Suites                                       0.3        0.3           0.3          0.3     0.3
You can also read