Kawasaki Environmental Report 2020

Page created by Tyrone Mcguire
 
CONTINUE READING
Kawasaki Environmental Report 2020
Kawasaki
Environmental
Report 2020
Kawasaki Environmental Report 2020

Scope                                                                                                                                      Promoting Environmental Management.................................................... 1
Kawasaki Heavy Industries, Ltd.                                                                                                               P Message from the Chief Environmental Officer
However, where the Kawasaki Group (or “the Group”) is described, the scope of reference includes subsidiar-                                   PG
                                                                                                                                                lobal Environmental Vision 2050 and the Three-Year 10th
ies (listed on page 34) that are subject to environmental management criteria.                                                                 Environmental Management Activities Plan (FY2019–FY2021)
                                                                                                                                              P Kawasaki’s Business Processes: Green Value Chains
Period                                                                                                                                        P Risks and Opportunities Related to Climate Change
The report covers fiscal 2019 (from April 1, 2019 to March 31, 2020). However, some activities from out-                                      P Summary of Business Activities in Fiscal 2019
side this period are also included. For overseas subsidiaries, the dates of the fiscal year and the period cov-
ered by statistics may differ depending on their location.                                                                                 Fiscal 2019 Business Activity Report.......................................................... 9

Guidelines                                                                                                                                 CO2 FREE
In preparing the report, the editorial office referred to the Environmental Reporting Guidelines (2018
                                                                                                                                            Key Strategies and Targets under
Edition) issued by the Ministry of the Environment of Japan as well as the Global Reporting Initiative (GRI)
                                                                                                                                            the 10th Environmental Management Activities Plan.................... 10
Standards.
                                                                                                                                              P Reducing CO2 Emissions from Production Activities
The Kawasaki Group’s Information Disclosure                                                                                                   P Estimating Supply Chain CO2 Emissions
                                                                                                                                              P Reduction of CO2 Emissions in Logistics Processes
                                                                                                                                              P Utilizing Renewable Energy
         Information on how the Kawasaki Group creates value
                                                                        Publication of detailed information and the latest information        P Energy-Saving Promotion Activities
                   and achieves sustainable growth
                                                                                                                                              P Reducing CO2 Emissions through Product-Based Contributions

                                                                              Corporate Website https://global.kawasaki.com/en/
            Kawasaki Report                                                                                                                Waste FREE
                                                                     Mobility   Energy   Industrial Equipment   Leisure   Corporate Info
                                                                                                                                            Key Strategies and Targets under
                                                                                                                                            the 10th Environmental Management Activities Plan.................... 17
                                                  Information for various stakeholders
                                                                                                                                              P Waste Sorting and Recycling
                                                                                                                                              P Water Resource Conservation and Recycling

                                                                                                                                           Harm FREE

        Securities Report   Corporate Governance Report       Kawasaki                    Kawasaki                 ESG Data Book            Key Strategies and Targets under
         (Japanese only)          (Japanese only)          Technical Review         Environmental Report                                    the 10th Environmental Management Activities Plan.................... 19
    Financial information                                                                                     Non-financial information       P Chemical Substances
                                                                                                                                              P Forest Conservation Activities
                                                                                                                                              P Biodiversity
Disclaimer
This report not only describes actual past and present conditions at the Kawasaki Group but also includes                                  Other Reporting/ Environmental Data/
                                                                                                                                           The Kawasaki Group Environmental
forward-looking statements based on plans, forecasts, business plans, and management policy as of the
                                                                                                                                           Management Promotion Structure............................................................ 22
publication date. These represent suppositions and judgments based on information available at the time.
Due to changes in circumstances, the results and features of future business operations may differ from the
                                                                                                                                           Third-Party Verification of
content of such statements.                                                                                                                Greenhouse Gas Emissions............................................................................ 35
Issued                                        Edited and issued by                             Editorial responsibility
October 2020                                  General Administration Division                  Senior Manager, Environmental
                                              Environmental Affairs Department                 Affairs Department
Kawasaki Environmental Report 2020
Promoting Environmental Management                                                                                                                   Kawasaki Environmental Report 2020         1

Message from the Chief Environmental Officer

                                                                         across the Group along with action guidelines to steer each     outstanding environmental performance, and work to pro-
                                                                         individual in their daily work. The Group implements environ-   vide lower-carbon, higher-efficiency products, including
                                                                         mental management, the combination of business manage-          those that utilize hydrogen.
                                                                         ment and environmental conservation, including efforts to          Regarding hydrogen utilization, in 2019 we held a
                                                                         prevent global warming, take action against climate change,     launching ceremony for the world’s first liquified hydrogen
                                                                         reduce environmental impact, and conserve biodiversity.         carrier ship, and in 2020 we began sales of hydrogen lique-
                                                                         Long-term Environmental Vision                                  faction systems, a first among Japanese manufacturers.
                                                                         In 2017, the Kawasaki Group drew up the Kawasaki Global         Through these and other efforts, we continue to contribute to
                                                                         Environmental Vision 2050, a long-term environmental            the spread of technologies for a hydrogen-powered society.
                                                                         vision formulated as a roadmap for drafting specific mea-       Disclosure in Line with the TCFD Recommendations
                                                                         sures to address the immediate as well as the medium- and       In addition to continuing to advance concrete initiatives, in
                                                                         long-term issues the Group faces. This long-term vision des-    September 2019 we officially endorsed the recommenda-
Sukeyuki Namiki                                                          ignated the three goals of being “CO2 FREE,” “Waste FREE,”      tions of the Task Force on Climate-related Financial
Chief Environmental Officer                                              and “Harm FREE.”                                                Disclosures (TCFD). Going forward, we will further enhance
(Representative Director, Vice President and Senior Executive Officer)
                                                                         Three-year Environmental Management Plans                       disclosure to stakeholders, including disclosure of the
                                                                         Working to achieve the long-term environmental vision, we       risks and opportunities related to climate change in
Increasingly Frequent Natural Disasters                                  formulate three-year medium-term environmental manage-          Kawasaki’s businesses.
and the Growing Climate Crisis                                           ment plans to address concrete issues and implement initia-
Around the world, risks created by climate change (such as               tives accordingly. Under the 10th Environmental                 Initiatives in Fiscal 2019
the occurrence of major typhoons and hurricanes, forest                  Management Activities Plan (fiscal 2019–2021), we are           The plan for fiscal 2019, the first year of the 10th
collapse or flooding) are growing. Japan’s Annual Report on              focusing on being “CO2 FREE.” Purchased electricity accounts    Environmental Management Activities Plan (fiscal 2019–
the Environment, the Sound Material-Cycle Society and                    for a great deal of the energy used in the Group’s business     2021), was implemented smoothly. In fiscal 2020, we will
Biodiversity 2020 (published by the Ministry of the                      activities. As such, we are unlikely to achieve our vision      continue to advance initiatives based on the ISO and other
Environment, June 2020) addressed increasingly frequent                  merely by continuing the kinds of initiatives we have imple-    environmental management systems we have built at all
natural disasters, using the expression “climate crisis” for             mented in the past, which focus mainly on saving energy.        our production sites.
the first time. Going forward, needs related to realizing a              We are therefore also working to transition to cleaner forms
sustainable society are only expected to grow. The                       of energy, including renewable solar power and low-carbon       Environmental Report 2020
Kawasaki Group has been engaged in transport, energy,                    energy from onsite LNG power generation facilities that can     Through environmentally harmonious business activities
environmental and other industrial machinery-related busi-               be fueled by hydrogen.                                          and environmentally conscious Kawasaki-brand products
nesses for more than 120 years, and I believe that its accu-                In addition to reducing CO2 emissions from business          and services, the Kawasaki Group works with a wide range
mulated technologies can contribute greatly to meeting                   activities, we are working to shrink emissions from product     of stakeholders to conserve and improve the natural envi-
these needs.                                                             use. In this report, we included new information on green       ronment and to contribute to the realization of sustainable
                                                                         value chains, showing the connections between energy            society. I hope that the information contained in this report
Facing the Climate Crisis                                                resources, products, and environmental burden (including        will provide readers with a deeper understanding of the
The Kawasaki Group is systematically implementing environ-               CO2 emissions) throughout the life cycles of our products.      environment-oriented management practices of the
mental management aimed at realizing a sustainable society.              Emissions during use account for most of the CO2 released       Kawasaki Group.
Environmental Policy                                                     over the life cycles of our products. Addressing this issue,
The Kawasaki Group’s Environmental Charter lays out envi-                we use Kawasaki-brand Green Products, a system created in
ronmental management values and principles to be shared                  2014, to evaluate and register products with particularly
Kawasaki Environmental Report 2020
Promoting Environmental Management                                                                                                                                                                       Kawasaki Environmental Report 2020                  2

Global Environmental Vision 2050 and the Three-Year 10th Environmental Management
Activities Plan (FY2019–FY2021)
                                                                                                                                                                                                                                   Kawasaki Global
A more advanced version of the Ninth Environmental Management                                                                                                                                                                 Environmental Vision 2050
Activities Plan (FY2016–FY2018), which concluded in fiscal 2018,                                                                                                                                                                    (Established in 2017)
                                                                                                                                                                                                                                         PC  O2 FREE
the new plan is aimed at ambitiously taking on the Kawasaki                                                                                                                                                                              P Waste FREE
Global Environmental Vision 2050’s goals of being “CO2 FREE,”                                                                                                                                                                            P Harm FREE

“Waste FREE,” and “Harm FREE.”

  Kawasaki Global Environmental Vision 2050
                                                                                                                                                                                                     2030 Targets
In 1994, Kawasaki formulated the First Environmental Management                                                                                                                                PR
                                                                                                                                                                                                 educe CO2 emissions by 26%
                                                                                                                                                                                                (Compared to fiscal 2013 level)
Activities Plan, and the entire Company began work on environ-
mental conservation activities. Since then, we have promoted vari-
                                                                                                                                                                           Environmental
ous environmental initiatives, including the establishment of the
                                                                                                                                                                            Vision 2020
Environmental Charter in 1999 to demonstrate our commitment to                                                                                                             (Established in 2010)
the environment both inside and outside the Company and, looking                                                                                                     PR  ealization of a low-carbon society
                                                                                                                                                                     P Realization of a recycling-oriented society
to the long term, the formulation of the Environmental Vision 2010                                                                                                   P Realization of a society coexisting with
in 2003 and the Environmental Vision 2020 in 2010.                                                                                                                      nature
                                                                                                                                                                     P Establishment of environmental manage-
  In 2017, we formulated the new Kawasaki Global Environmental                                                                                                          ment systems

Vision 2050 with the aim of taking on higher targets for 2050 while
                                                                                                                                                 Environmental
basically maintaining the focal points of Environmental Vision 2020.                                                                              Vision 2010
Having adopted the CO2 emissions reduction targets set by the                                                                                    (Established in 2003)
Japanese government for 2030 as our medium-term targets, we will                                                                            P   Environmental philosophy
                                                                                                                                            P    Environmental management
tackle our major goals of achieving “CO2 FREE,” “Waste FREE,” and                                                                           P     Environmentally conscious products
“Harm FREE.” We aim to achieve these goals through the implemen-                                                                            P      Environmentally conscious manufacturing
                                                                                                                                            P       Environmentally conscious communication
tation of our Environmental Management Activities Plan, which is
reformulated every three years based on a comprehensive review                                                          Environmental
                                                                                                                           Charter
of changes in social conditions and environmental technologies.
                                                                                                                        (Established in 1999/
                                                                                                                          Revised in 2010)
                                                                                                       1994-                                                                  2019-
                                                                                                             First to Ninth Environmental Management
                                                                                                                                                                              10th Environmental Management Activities Plan
                                                                                                                           Activities Plans

                                                                                                          1990                  2000                      2010                      2020                     2030                 2040                   2050

                                                                                                  • ISO 14001 issued   • Stockholm             • COP10 Nagoya Protocol adopted (2010)            • Japanese Government Target for 2030      •J
                                                                                                                                                                                                                                                  apanese Govern-
                                                                                                     (1996)                Convention            •J
                                                                                                                                                   apanese Version of the Stewardship Code           Reduce CO2 emissions by 26% (Compared      ment Target for
                    •A  im for zero CO2 emissions in business activities
                    • Provide products and services that greatly curb CO2 emissions              •C
                                                                                                    OP3 Kyoto             adopted (2001)         (2014)                                              to fiscal 2013 level)                      2050
                                                                                                   Protocol adopted     •P
                                                                                                                          rinciples for         • COP21 Paris Agreement adopted (2015)                                                         Reduce CO2
                    •A  im for zero waste emissions in business activities
                    • Thoroughly enforce conservation and the recycling of water resources        (1997)                Responsible                                                                                                             emissions by 80%
                                                                                                                                                 •S
                                                                                                                                                   ustainable Development Goals adopted
                                                                                                                         Investment (PRI)                                                                                                        (Compared to fiscal
                    • Aim for zero harmful chemical substance emissions in business activities                                                   (2015)
                                                                                                                         (2006)                                                                                                                  2013 level)
                    • Develop business with respect for biodiversity                                                                            • Corporate Governance Code (2015)
                                                                                                                                                 • TCFD Final Report published (2017)
Kawasaki Environmental Report 2020
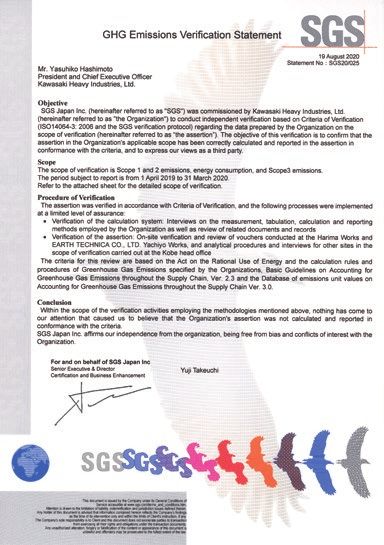
10th Environmental Management Activities Plan: Key Strategies
   Three-Year 10th Environmental Management Activities Plan
                                                                                                                                                                     10th Plan Target:
                                                                                                                                                (1) CO2 FREE         Reduce fiscal 2021 CO2 emissions per unit of net sales by 20% from the fiscal 2013
Policy for Initiatives
                                                                                                                                                                     level (non-consolidated).
Based on the environmental policy laid out in the Group Environmental Charter,1 the Group
Mission,2 and assessments of the Ninth Environmental Management Activities Plan,3 the                                                                                Proactive use of onsite power generation facilities
                                                                                                                                                                     Consider energy supply and demand for each plant and draft concrete plans to
Kawasaki Group has established key strategies to help meet society’s needs (namely, those for                                                                        adopt onsite power generation facilities. Consider both purchasing such facilities as
ESG investment and information disclosure), realize both environmental conservation and                                                                              internal capital expenditure and selling products for such facilities to energy supply
                                                                                                                                                                     companies and then using their power generation services.
business growth, and achieve the Kawasaki Global Environmental Vision 2050 goals of “CO2                                                        Realization of a     Utilize renewable energy
FREE,” “Waste FREE,” and “Harm FREE.”                                                                                                           low-carbon society   Purchase electricity from solar power generation facilities on the roofs of our plants
  To realize a low-carbon society (CO2 FREE), we will work to significantly cut CO2 emissions                                                                        Energy-saving activities
by weighing the impact of related risks and opportunities4 for our businesses to expand the                                                                          Promote energy saving by utilizing energy visualization systems and replacing
                                                                                                                                                                     aging equipment
provision of low-CO2 products and further reduce CO2 emissions from business processes. To
                                                                                                                                                                     Expand the CO2-reducing effects of Kawasaki-brand Green Products and other products
realize a recycling-oriented society (Waste FREE) and a society coexisting with nature (Harm
FREE), we will raise the level of management not just of the Company, but of the entire Group,                                                                       10th Plan Target:
work to further reduce environmental risk, and restore natural environments damaged by the                                                      (2) Waste FREE       Maintain ratio of direct-to-landfill waste to total waste generation at less than 1%
                                                                                                                                                                     (non-consolidated)
construction of our plants.
  At the same time, to help achieve the Sustainable Development Goals (SDGs), we will work                                                                           Further enforce waste sorting and recycling
                                                                                                                                                Realization of a     Improve Group-wide management
mainly through the energy and environmental businesses to solve social issues from long-                                                        recycling-oriented
                                                                                                                                                society              Precisely understand water uses and usage volumes
term perspective.                                                                                                                                                    Confirm water resource risks
1.	Please refer to p.33, “Environmental Charter.”
2.	The Group Mission of “Kawasaki, working as one for the good of the planet.”                                                                                      10th Plan Target:
                                                                                                                                                (3) Harm FREE
3.	Please refer to Kawasaki Environmental Report 2019.                                                                                                              Reduce environmental risk while operating factories with respect for biodiversity
    https://global.kawasaki.com/en/corp/sustainability/environment/19_houkokusyo.pdf
4.	Risks:          •S tricter CO2 emission regulations, higher electricity costs, and increased pressure to transition to renewable energy                         Properly manage harmful chemical substances and consider alternatives (Reduce
		                  • Power outages due to natural disasters
                                                                                                                                                Realization of a     Group-wide environmental risk)
                                                                                                                                                society coexisting
    Opportunities: • G  reen energy generation using Kawasaki-brand products (onsite generation/intra-Group consignment) and                                        Identify the types of trees on factory grounds and, where appropriate, replace with
                       hydrogen
                                                                                                                                                with nature
                                                                                                                                                                     native species while continuing Company-wide forest conservation activities
		                  •G  rowing demand for power generation and dispersed power sources as means of business continuity planning

                                            This long-term vision also aligns with the material issues the Kawasaki Group has designated in its business activities.
                                              For more information about the Group’s process of identifying material issues, please refer to the webpage below.

                                                                               https://global.kawasaki.com/en/corp/sustainability/

      The Kawasaki Group’s Material Issues
Kawasaki Environmental Report 2020
Promoting Environmental Management                                                                                                                                           Kawasaki Environmental Report 2020                  4

Kawasaki’s Business Processes: Green Value Chains                                                                                   O Transport: Ships, rolling stock, aerospace
                                                                                                                                    O Energy: Cogeneration, energy plants, gas turbines, gas engines
Kawasaki is a comprehensive heavy industry manufacturer that contributes                                            Products
                                                                                                                   by Category      O Industrial equipment: Hydraulic machinery, industrial robots, industrial plants,
to the maintenance and development of environmental sustainability                                                                     environmental/recycling plants
through its advanced technological prowess.                                                                                         O Leisure: Motorcycles, off-road utility vehicles, JET SKI® personal watercraft (PWC)

                                                                 Environmental                                                                                        SDGs                       Impact of Business Activities
                                                                                                                          Risks and                                                              on the Environment during
       Green value chains                                            effects:                                                                                   GRI standards                            Fiscal 2019
                                                                                                                        Opportunities
                                                                Aspect and impact                                                                                 (see p. 5)

                                                                                                                                                                                                              INPUT
                                                            Aspect                    Impact                    Risks               Opportunities
                                                                                                                                                                                                 Energy consumption
                                                                                                                                                                                                 (Year-on-year change)
                                                     Manufacturing                                      OH
                                                                                                          alt of operations     OS
                                                                                                                                   upply chain
   Raw material procurement

                                                                                                                                                                                          Total energy
                                                     processes                                           or production            diversification                                         (heat conversion)             6,348 TJ (+1%)
                                                     OA
                                                       ir: Emissions of      OA
                                                                                ir: Global warming,     adjustments at
                                                      CO2, soot, SOx and       atmospheric               suppliers due to                                                                 Fuel                          2,346 TJ (+1%)
                                                      NOx                      pollution                 accidents
                              O Steel                                                                                                                                                    Purchased electricity        408 GWh (±0%)
                                                     OW
                                                       ater: Discharge of    OW
                                                                                ater: Water            O Increases in steel
                              ON
                                on-ferrous metals                                                         prices
                               (copper, aluminum,     industrial water         pollution                                                                                                  Renewable energy              1.5 GWh (-6%)
                               nickel, etc.)         OS
                                                       oil: Use of harmful   OS
                                                                                oil: Soil pollution,
                                                      chemical substances      groundwater                                                                             301                       Main materials (steel)
                                                                               pollution                                                                                                         (Year-on-year change)
                                                                                                                                                                                          Amount purchased as
                                                                                                                                                                                          steel material                110,000 t (0%)

                                                                                                                                                                                                 Water (Year-on-year change)

                                                     Transport processes                                OT
                                                                                                          ransport route        O Modal shifts                                                                    5,980,000 m3 (-8%)
                                                     OA
                                                       ir: Emissions of      OA
                                                                                ir: Global warming,     disruptions due to      OT
                                                                                                                                   ransport route
   Transport (upstream)

                              O Land transport       CO2, soot, SOx and       atmospheric pollu-        extreme weather          diversification
                              O Marine transport     NOx                      tion

                              O Air transport       OW
                                                       ater: Discharge of    OW
                                                                                ater: Water
                                                      ballast water, use of    pollution, spread of
                                                      scrubbers (exhaust       invasive species
                                                      gas cleaning sys-                                                                                                                            Business activities
                                                      tems)
                                                                                                                                                                       305
                              OS
                                cope 3 emissions                                                                                                                                         Key domestic factories:              10 sites
                               (supply chain
                               emissions):                                                                                                                                                Net sales
                                                                                                                                                                                          (non-consolidated):          ¥1,250.3 billion
                               121,280,377 t-CO2
Kawasaki Environmental Report 2020
OF
                           actories and other
                          production facilities       Manufacturing                                      OC
                                                                                                           limate risks         OU
                                                                                                                                   se of Kawasaki-
                         OE
                           nergy and water           processes                                           (p. 6-7)                brand products
                          consumption                 OA
                                                        ir: Emissions of      OA
                                                                                 ir: Global warming,    OH
                                                                                                           alt of operations    ON
                                                                                                                                   ew market
Manufacturing            OG
                           reenhouse gases            CO2, soot, SOx and       atmospheric               or loss of trust due    development
                          (GHGs)                       NOx                      pollution                 to accidents           O Increasing value
                                                                                                                                                                                      OUTPUT
                                                      OW
                                                        ater: Discharge of    OW
                                                                                 ater: Water                                       added
                                                       industrial water (use    pollution (water                                                                           Air (Year-on-year change)
                         OS  cope 1 emissions
                            (direct emissions):
                                                       of groundwater, etc.)    resource depletion,
                                                      OS
                                                        oil: Use of harmful    etc.)                                                                   301 / 302
                            127,189 t-CO2                                                                                                                            Greenhouse gases        285,000 t-CO2 (-5%)
                         O Scope 2 emissions          chemical substances     OS
                                                                                 oil: Soil pollution,                                                  303 / 305
                            (indirect emissions                                 groundwater                                                                          SOx                               4t (+100%) *
                                                                                pollution
                                                                                                                                                          306
                            from energy):
                            157,934 t-CO2
                                                                                                                                                                     NOx                               129t (-23%)

                                                                                                                                                                           Waste (Year-on-year change)
Transport (downstream)

                                                      Transport processes                                OT
                                                                                                           ransport route       O Modal shifts                     Total waste                    50,200 t (-4%)
                         O Land transport            OA
                                                        ir: Emissions of      OA
                                                                                 ir: Global warming,     disruptions due to     OT
                                                                                                                                   ransport route
                                                       CO2, soot, SOx and       atmospheric pollu-        extreme weather         diversification                    Recycled                       48,900 t (-5%)
                         O Marine transport
                                                       NOx                      tion
                         O Air transport                                                                                                                            Others                          1,200 t (±0%)
                                                      OW
                                                        ater: Discharge of    OW
                                                                                 ater: Water
                                                       ballast water, use of    pollution, spread of
                                                       scrubbers (exhaust       invasive species                                                                           Water (Year-on-year change)
                         OS
                           cope 3 emissions           gas cleaning sys-                                                                                  305
                          (supply chain                tems)
                          emissions):                                                                                                                                Total wastewater         4,500,000 m3 (-2%)
                          121,280,377 t-CO2                                                                                                                          * Due to increased test operation of ship engines

                         OS  hips and specialty
                            vessels                   Product use                                        OC
                                                                                                           laims on manu-       OS
                                                                                                                                   hift from one-
                         O Commercial vessels        OA
                                                        ir: Emissions of      OA
                                                                                 ir: Global warming,     facturer’s liability    time sale business-
                         O Rolling stock              CO2, soot, SOx and       atmospheric pollu-                                es to maintenance
                         O Airplanes                  NOx                      tion                                              and other recur-
                                                                                                                                  ring revenue
                         O Jet engines               OW
                                                        ater: Discharge of    OW
                                                                                 ater: Water                                     businesses
                         O Energy equipment           ballast water, use of    pollution
                         O Plant facilities           cooling water           O Soil: Soil pollution
                         O Marine propulsion
                            machinery
                         O Motorcycles
Use

                         O Utility vehicles and
                            personal watercraft
                         O General-purpose
                            engines                                                                                                                       305
                         O Precision machinery
                         O Robots
                         O Greenhouse gases
                            (GHGs)

                         OS
                           cope 3 emissions
                          (supply chain emissions):
                          121,280,377 t-CO2

                                                                                                                                                                    Areas covered by GRI standards
                                                      Disassembly and                                                            O Increase practice
                                                                                                                                                                    301 : Materials 302 : Energy
Disposal

                                                      breakdown                                                                     of the 3Rs
                                                                                                                                                                    303 : Water and Effluents 305 : Emissions
                         O Scrap                     OA
                                                        ir: Emissions of      OA
                                                                                 ir: Global warming,             —                                                 306 : Effluents and Waste
                                                       CO2 and soot             atmospheric pollu-
                                                                                tion
Kawasaki Environmental Report 2020
Promoting Environmental Management                                                                                                                                                                     Kawasaki Environmental Report 2020                         6

Risks and Opportunities Related to                                                                    What Are Climate
                                                                                                    Change-Related Risks?
                                                                                                                                       Climate change-related risks are broadly divided into (1) transition risks, related to the transition to a low-carbon economy,
                                                                                                                                       and (2) physical risks, related to physical changes due to climate change.

Climate Change                                                                                       Type                     Definition                              Type                                             Main Examples
                                                                                                                                                                                      Tightening of greenhouse gas emissions regulations, enhanced emissions
Kawasaki endorsed the recommendations of the Task Force on                                                                                                    Policy and legal risk
                                                                                                                                                                                      reporting obligations
Climate-related Financial Disclosures (TCFD) in September 2019.                                                                                                                       Substitution of existing products with lower emissions options, unsuccessful
                                                                                                                        Risks related to the                    Technology risk
The TCFD recommends the disclosure of climate change-related                                      Transition                                                                          investment in new technologies
                                                                                                                     transition to a low-carbon
                                                                                                     risks                                                                            Changing customer behavior, uncertainty in market signals, increased cost of
information, such as that outlined in the table at right.                                                                      society                            Market risk
                                                                                                                                                                                      raw materials
   This section lays out Kawasaki’s analysis of its risks and oppor-
                                                                                                                                                                                      Shifts in consumer preferences, stigmatization of sector, increased stake-
                                                                                                                                                                Reputation risk
tunities related to climate change based on the disclosure provid-                                                                                                                    holder concern or negative stakeholder feedback
ed in response to the CDP climate change 2019 questionnaire.*
                                                                                                                      Risks related to physical                    Acute risk         Increased severity of extreme weather events such as cyclones and floods
*The 2019 edition of a survey of corporate initiatives related to realizing a low-carbon          Physical
                                                                                                                       changes due to climate
  society (from both risk and business opportunity perspectives).                                   risks                                                         Chronic risk        Changes in precipitation patterns, rising mean temperatures, rising sea levels
                                                                                                                               change

                                                                                               Source: Prepared by the Ministry of the Environment based on the “Recommendations of the Task Force on Climate-related Financial Disclosures” (final report) from the TCFD.

Climate Change-related Risks: Transition Risks

                      Risk Type                           Risk                                          Description                                                Financial Impact                                        Risk Management Methods

                                                                                    Carbon pricing, carbon trading and other                    Such regulations would apply to almost all of                 Assuming carbon pricing, carbon trading and
                                                                                    regulations (particularly regarding the use of              the Company’s products and therefore greatly                  other regulations, we are focusing efforts on
                           Policy                 Carbon pricing
                                                                                    the Company’s products after their sale) may                impact net sales.                                             energy transition, which includes renewable
                                                                                    be put into place.                                                                                                        energy, mainly hydrogen.

                                                                                    Costs related to responding to the tightening of            Kawasaki manufactures products with signifi-                  We are developing products and technologies
                                                                                    regulations, such as Japan’s Act on Promotion               cant CO2 emissions, such as transportation                    to reduce CO2 emissions ahead of the strength-
                                          Act on Promotion of Global                of Global Warming Countermeasures and,                      equipment and large engines, and any strength-                ening of laws and regulations.
                           Legal
                                          Warming Countermeasures                   overseas, European emissions standards (Euro                ening of current regulations would apply to
                                                                                    4), and ship emissions regulations (the Energy              almost all its products and therefore greatly
                                                                                    Efficiency Design Index, or EEDI), may emerge.              impact net sales.

                                                                                    Realizing a carbon-powered society is part of               If commercializing hydrogen energy proves                     To realize a society that makes full use of
                                                                                    Japan’s national energy strategy, but in the                impossible, there is a risk that R&D expenses                 hydrogen, as specified in Japan’s Strategic
                                             Transition to hydrogen                 process of realizing such a society, technologi-            made thus far will go to waste. Kawasaki                      Energy Plan, we are working with Japanese
   Transition risks

                        Technology
                                                     energy                         cal development costs will impact business.                 invests approximately ¥50 billion in R&D                      and Australian governmental authorities and
                                                                                                                                                annually. The portion of this related to hydro-               related companies to quickly build a hydrogen
                                                                                                                                                gen energy is undisclosed.                                    supply chain.

                                                                                    Electricity costs may rise due to the strength-             Currently, purchased electricity accounts for a               Kawasaki’s Head Office coordinates internal
                                                                                    ening of CO2 emissions regulations, and pres-               large portion of Kawasaki’s energy use and                    energy procurement, and the Company gathers
                                                                                    sure to transition to renewables may arise in               procurement costs of approximately ¥10 billion                information and formulates policy and counter-
                                                                                    connection with the government’s strategic                  per year.                                                     measure proposals under the direction of the
                                            Pressure to transition to
                          Market                                                    framework for hydrogen.                                     Assuming that adopting an energy mix that                     Head Office.
                                               renewable energy                                                                                 includes 26% renewable energy (government
                                                                                                                                                target) would result in an extra cost of 15%, the
                                                                                                                                                annual cost impact on the Company would be
                                                                                                                                                around ¥0.3–0.5 billion.

                                                                                    Kawasaki will contribute to the market by                   If efforts to address climate change are not well             We are working to eliminate any gaps between
                                           Gap between Kawasaki’s                   providing products and services that help                   received and external evaluations decline, this               our actual initiatives and external evaluations
                                           stance on environmental                  reduce environmental burden, but inadequate                 could lead to divestment from the Company or                  by honestly answering climate change-related
                        Reputation
                                            initiatives and external                disclosure could create the risk of a gap                   removal from related stock indices.                           surveys, including that of the CDP, and carrying
                                                   evaluations                      between this stance and external evaluations                                                                              out appropriate disclosure.
                                                                                    (such as the CDP evaluation).
Kawasaki Environmental Report 2020
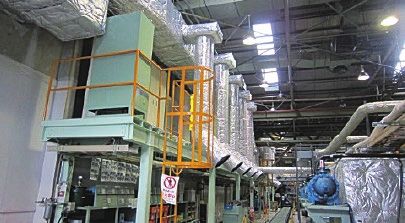
Climate Change-related Risks: Physical Risks

                      Risk Type                       Risk                                  Description                                      Financial Impact                              Risk Management Methods

                                                                          As Kawasaki’s shipbuilding and large structure     In the event of power outage due to facility        Kawasaki has formulated business continuity
                                                                          manufacturing sites are located in coastal         damage from a super hurricane, storm surge, or      plans (BCPs), established emergency contact
                                         Loss of power due to facility    areas, they are at risk of losing power due to     other such event, the Company’s operations or       systems, and carries out regular inspections
                       Acute physical
                                              damage from super           facility damage from super hurricanes, storm       supply chains could be halted, greatly impact-      and drills, among other measures, in order to
                            risk                                          surges, etc.                                       ing net sales.                                      minimize the damage caused by major disas-
                                         hurricanes, storm surges, etc.
  Physical risks

                                                                                                                                                                                 ters, such as typhoons, earthquakes, floods,
                                                                                                                                                                                 and pandemics.

                                                                          Kawasaki’s shipbuilding and large structure        The need for additional measures to ensure the      In line with business sites’ safety management
                                                                          manufacturing involve outdoor work, neces-         safety of employees, declines in labor produc-      rules and systems, we implement a variety of
                                                                          sitating adequate precautions for work in          tivity, or halts in operations due to prolonged     countermeasures, including promoting aware-
                      Chronic physical   Prolonged extremely high or      high or low temperatures. If such weather          extremely high or low temperatures could            ness of heat stroke prevention measures,
                            risk              low temperatures            conditions become more prolonged, it could         greatly impact net sales.                           posting and sending out information on daily
                                                                          require additional measures to ensure the                                                              heat stroke risk levels, encouraging employees
                                                                          safety of employees or lead to declines in                                                             to intake adequate water and salt, and using
                                                                          labor productivity.                                                                                    spot coolers.

Climate Change-related Opportunities

                   Opportunity Type               Opportunity                               Description                                      Financial Impact                           Opportunity Realization Strategy

                                                                          We aim to create clean energy, including           Under Kawasaki’s hydrogen business strategy,        To realize a society that makes full use of
                                                                          hydrogen, with Kawasaki-brand products. We         through new business commercialization, the         hydrogen, as targeted in Japan’s Strategic
                                         Creating green energy, includ-
                                                                          see opportunities in all sectors, such as energy   hydrogen business is planned to account for 5%      Energy Plan, we are working with Japanese
                       Opportunity 1           ing hydrogen, with
                                                                          and infrastructure, related to replacing fossil    (¥150.0 billion) of the ¥3 trillion net sales       and Australian governmental authorities and
  Opportunities

                                           Kawasaki-brand products        fuels with hydrogen.                               target for fiscal 2030.                             related companies to quickly build a hydrogen
                                                                                                                                                                                 supply chain.

                                                                          In preparation for power outages and supply        Under Kawasaki’s business strategy, energy          In the energy system and plant engineering
                                         Growing demand for power         chain interruptions due to super hurricanes and    system & plant engineering businesses are           businesses, we are advancing improvements to
                                          generation and distributed      other natural disasters caused by climate          planned to account for 20% (¥600.0 billion) of      power generation equipment, such as gas
                       Opportunity 2
                                          power sources as means of       change, demand for distributed power sources       the ¥3 trillion net sales target for fiscal 2030.   turbines, combined generation equipment, and
                                         business continuity planning     is expected to increase, creating opportunities.                                                       gas engines, to increase efficiency and decrease
                                                                                                                                                                                 environmental burden.
Kawasaki Environmental Report 2020
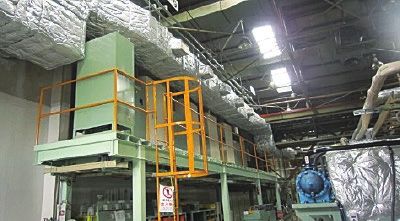
Promoting Environmental Management                                                                                                                                                          Kawasaki Environmental Report 2020         8

Summary of Business Activities in Fiscal 2019

       Key Strategies                       10th Environmental Management Activities Plan (FY2019–FY2021)                                                                      Fiscal 2019 Results                               Page Number
                                               Reduce fiscal 2021 CO2 emissions per unit of net sales by 20% from the                  228t-CO2/billion yen (down 21.6% from the fiscal 2013 level)
         CO2 FREE                  Target
                                               fiscal 2013 level (non-consolidated)                                                    On-pace to meet the fiscal 2021 target
                                                     Proactive use of onsite power generation facilities
                                               Consider energy supply and demand for each plant and draft concrete
                                                                                                                                       Began working group activities at the Gifu, Kobe, and Akashi plants, where onsite
                                               plans to adopt onsite power generation facilities. Consider both purchas-
                                                                                                                                       power generation are in use
                                 Initiatives   ing such facilities as internal capital expenditure and selling products for
                                                                                                                                       Identified current problems and issues and considered ways to improve existing
                                               such facilities to energy supply companies and then using their power
                                                                                                                                       facilities in terms of system configuration, economic efficiency, and CO2 reduction
                                               generation services.
                                                                    Utilize renewable energy
        Realization of a                                                                                                                                                                                                           p. 10-16
          low-carbon                           Purchase electricity from solar power generation facilities on the roofs of             Established guidelines to promote the adoption of renewable energy (to enter effect
                                 Initiatives
            society                            our plants                                                                              from fiscal 2020)
                                                                    Energy-saving activities
                                               Promote energy saving by utilizing energy visualization systems and
                                 Initiatives                                                                                           Established guidelines to promote energy saving (to enter effect from fiscal 2020)
                                               replacing aging equipment
                                  Expand the CO2-reducing effects of Kawasaki-brand Green Products and other products
                                               Help reduce CO2 emissions during product use by putting high-efficiency                 Emission reduction effect on CO2 from product use of 23,140 kt-CO2 (products sold in
                                 Initiatives
                                               products out into society                                                               fiscal 2019)

                                               Maintain ratio of direct-to-landfill waste to total waste generation at less
        Waste FREE                 Target                                                                                              Landfill disposal rate of 0.2% (target achieved)
                                               than 1% (non-consolidated)
                                                         Further enforce waste sorting and recycling
                                                                                                                                       Gathered, organized, and shared on-site confirmation information on legally designat-
       Realization of a          Initiatives   Improve Group-wide management
                                                                                                                                       ed waste processing contractors
                                                                                                                                                                                                                                   p. 17-18
      recycling-oriented
                                                    Precisely understand water uses and usage volumes
           society
                                                                                                                                       Carried out detailed surveys of water uses and usage volumes (Company-wide aver-
                                 Initiatives   Confirm water resource risks
                                                                                                                                       age data availability: 15%)

                                               Reduce environmental risk while operating factories with respect for
        Harm FREE                  Target                                                                                              No problems occurred
                                               biodiversity
                                            Properly manage harmful chemical substances and consider alternatives
                                                          (Reduce Group-wide environmental risk)
                                               Maintain proper management of dichloromethane, hexavalent chromium,                     Maintained proper management of dichloromethane, hexavalent chromium, and major VOCs
                                 Initiatives   and major VOCs                                                                          Usage volumes were unchanged or almost unchanged year on year
                                               Continue to consider alternatives that can help discontinue use                         So far no prospect of using alternatives to discontinue use
       Realization of a             Identify the types of trees on factory grounds and, where appropriate, replace with
                                                                                                                                                                                                                                   p. 19-21
      society coexisting               native species while continuing Company-wide forest conservation activities
         with nature                           Properly manage green spaces at plants
                                                                                                                                       Continued proper management of green spaces at plants
                                               Use off-site Company-wide forest conversation activities to make up for
                                                                                                                                       Carried out forest conversation activities in Taka, Hyogo Prefecture, and Niyodogawa,
                                               shortcomings as measured against the Company’s voluntary indicator for
                                 Initiatives                                                                                           Kochi Prefecture,* to make up for shortcomings as measured against the Company’s
                                               green space land area*
                                                                                                                                       voluntary indicator for green space land area (did not reach the indicator)
                                               *Calculated by directly applying the green space ratio specified in the Factory Location
                                                                                                                                         *Not included in Company-wide activities
                                                 Act, not taking into account regulatory easing provisions, etc.

Notes: 1. Per unit of net sales figures are calculated based on non-consolidated net sales.
       2. Major VOCs: For the Kawasaki Group, the major VOCs are toluene, xylene, and ethylbenzene. VOCs: Volatile Organic Compounds.
Fiscal 2019 Business Activity Report                                                                                            Kawasaki Environmental Report 2020   9

Fiscal 2019 Business Activity Report
The pages that follow offer a report on business activi-
ties in 2019 conducted in line with the key strategies
of the 10th Environmental Management Activities Plan
(FY2019–FY2021).
                                                                                CO2
                                                                               FREE
                                                                                 Plan target

                                                                        Reduce fiscal 2021 CO2 emis-
                                                                        sions per unit of net sales by
                                                                        20% from the fiscal 2013 level
                                                                        (non-consolidated)

                                                                             10th
                                                                        Environmental
                                                                         Management
                                             Waste                      Activities Plan                       Harm
                                             FREE                                                             FREE
                                                 Plan target                                                      Plan target

                                        Maintain ratio of direct-to-                                     Reduce environmental risk
                                        landfill waste to total waste                                    while operating factories
                                        generation at less than 1%                                       with respect for biodiversity
                                        (non-consolidated)
CO2
                                                              FREE

CO2 FREE                                              Waste
                                                      FREE
                                                                       Harm
                                                                       FREE

Various global initiatives aimed at controlling global warming are
accelerating, including the Paris Agreement reached at the United
Nations Framework Convention on Climate Change (with the
target of holding the increase in the global average temperature
to well below 2°C above pre-industrial levels).
  Kawasaki is contributing to the prevention of global warming
through products and manufacturing that efficiently use energy.

                           10th Plan Target

  Reduce fiscal 2021 CO2 emissions per unit of net sales by
  20% from the fiscal 2013 level (non-consolidated).

                Realization of a Low-Carbon Society

  Proactive use of onsite power generation facilities
  Consider energy supply and demand for each plant and draft concrete
  plans to adopt onsite power generation facilities. Consider both
  purchasing such facilities as internal capital expenditure and selling
  products for such facilities to energy supply companies and then
  using their power generation services.

  Utilize renewable energy
  Purchase electricity from solar power generation facilities on the
  roofs of our plants

  Energy-saving activities
  Promote energy saving by utilizing energy visualization systems and
  replacing aging equipment

  Expand the CO2-reducing effects of Kawasaki-brand Green
  Products and other products
CO2
Key Strategies        CO2 FREE         FREE                                                                                                                                           Kawasaki Environmental Report 2020                                11

                                                                                                                          図●●:生産活動におけるCO₂排出量
Reducing CO2 Emissions

Reducing CO2 Emissions from Production Activities
Kawasaki has designated the target of reducing fiscal 2021 CO2 emissions from production                                    CO2 emissions (left axis)     CO2 per unit of net sales (right axis)
                                                                                                                            Target CO2 per unit of net sales (right axis)
activities per unit of net sales by 20% from the fiscal 2013 level. To achieve this target, we                            (kt-CO2)                                                                                                             (t-CO2 ⁄ billion yen)
are advancing the key strategies of proactively utilizing onsite power generation facilities and                          800                                                                                                                                400
utilizing renewable energy while continuing to implement ongoing energy-saving activities.                                                 291         290
                                                                                                                          600                                    280        274           270                                                                300
  In fiscal 2019, CO2 emissions per unit of net sales came to 228 t-CO2/billion yen, down                                                                                                              252      228                      233
21.6% from the fiscal 2013 level and on-pace to meet our target for fiscal 2021 (Figure 1).                               400                                                                                                                                200
                                                                                                                                           294         319       325        321           328          301      285
The main factors behind this decrease in per-unit CO2 emissions were restrained energy                                    200                                                                                                                                100
consumption thanks to energy saving activities and decreases in CO2 emission factors for
purchased electricity.                                                                                                        0                                                                                                                                  0
                                                                                                                                          2013        2014      2015       2016       2017             2018    2019                    2021                    (FY)

                                                                                                                          Figure 1: CO2 Emissions from Production Activities
                                                                                                                          Notes: 1. Per unit of net sales figures are obtained by dividing CO2 emissions by net sales.
                                                                                                                                 2. T
                                                                                                                                     he fuel and heat CO2 emission factors used are values published by the Agency for Natural Resources and Energy.
                                                                                                                          図7:生産活動におけるCO₂排出量
                                                                                                                                 3. The electricity CO2 emission factors used are values published by Japan’s Ministry of the Environment for each
                                                                                                                                     power provider in each fiscal year.

Estimating Supply Chain CO2 Emissions
The Kawasaki Group’s CO2 emissions and energy consumption attributable to production                                        Kawasaki Heavy Industries        Domestic subsidiaries                Scope 1      Scope 2
                                                                                                                            Overseas subsidiaries
activities are shown in Figures 2, 3 and 4. The Group’s supply chain CO2 emissions* are                                   (kt-CO2)                                                              (kt-CO2)

shown in Tables 1 and 2. The scope that Kawasaki is required to cover in tracking CO2                                     600                                                                   500
                                                                                                                                                                                                               326       313     326
emissions is expanding toward the inclusion of not only its own operations but also those                                                                                                                                                 311        290
                                                                                                                                         134     133     138      137
of its supply chain. Within the entire supply chain, the greenhouse gas (GHG) effect accom-                               400                                             138
                                                                                                                                         41      38      36       36                            250
panying the use of Kawasaki-sold products is extremely high. We have been making prog-                                                                                    35
ress in reducing CO2 emissions through product-based contributions, but, going forward,                                   200
                                                                                                                                         325     321     328      301     285
we will take an even more proactive approach.                                                                                                                                                                  176       179     176      162        169
*T
  he standards for calculating emissions along our supply chain include the Corporate Value Chain (Scope 3) Accounting
                                                                                                                              0                                                                        0
 and Reporting Standard, established by the Greenhouse Gas Protocol, an internationally accepted set of greenhouse gas               2015 2016 2017 2018 2019                      (FY)                      2015 2016 2017 2018 2019                           (FY)
 (GHG) calculation and reporting guidelines. In Japan, the Basic Guidelines on Accounting for Greenhouse Gas Emissions
 Throughout the Supply Chain—a Japanese version of Scope 3—were prepared by the Research/Study Committee on               Figure 2: CO2 Emissions from Production                              Figure 3: CO2 Emissions from Production
 Standards for Accounting and Reporting Organizations’ GHG Emissions throughout the Supply Chain, established jointly                Activities (by Company)                                               Activities (Scopes 1 and 2)
 by the Ministry of Economy, Trade and Industry and the Ministry of the Environment. Using these basic guidelines,        Notes: 1. The CO2 emission factors are the figures
 Kawasaki calculates CO2 emissions along its supply chain.                                                                           published by Japan’s Ministry of the Environ-
                                                                                                                                                                                                  Kawasaki Heavy Industries        Domestic subsidiaries
                                                                                                                                     ment for each power provider in each fiscal year.
                                                                                                                                                                                                  Overseas subsidiaries
                                                                                                                                 2. For overseas sites, the CO2 emission factors               (TJ)
                                                                                                                                     are the figures published by the Greenhouse
                                                                                                                                     Gas Protocol.
                                                                                                                                                                                                9,000
                                                                                                                                                                                                               2,160     2,120   2,210    2,190      2,230

                                                                                                                                                                                                6,000          770       740     710      720        700

                                                                                                                                                                                                3,000          6,210     6,130   6,400    6,290      6,410

                                                                                                                                                                                                       0
                                                                                                                                                                                                             2015 2016 2017 2018 2019                           (FY)

                                                                                                                                                                                                Figure 4: Energy Consumption in Production
                                                                                                                                                                                                           Activities (by Company)
CO2
Key Strategies         CO2 FREE     FREE                                                                                                                                                      Kawasaki Environmental Report 2020                  12

   Table 1: Fiscal 2019—the Kawasaki Group’s Scope 1 and Scope 2                 Table 2: Fiscal 2019—Kawasaki’s Scope 3 Calculation Results
             Calculation Results                                                                                                                                                                                                 Calculation Results
                                                                                               Category                                                           Calculation Targets
                                                            Calculation Results                                                                                                                                                     (kt-CO2/year)
             Category               Calculation Targets
                                                               (kt-CO2/year)      Scope 3 (Other indirect emissions): Upstream
    Scope1                                                                                                             Emissions associated with activities up to production of raw materials, parts, purchased goods, and
                                                                                  1. Purchased goods and services                                                                                                                  1,940(1.6%)
                                  Direct emissions                                                                     sales-related materials
                                  through use of fuel at                          2. Capital goods                    Emissions from construction and production of Kawasaki’s capital goods                                       238(0.2%)
    Direct emissions                                               169
                                  Kawasaki and associat-                          3. F
                                                                                      uel- and energy-related
                                  ed industrial processes                                                              Emissions associated with procurement of fuel from other providers and procurement of fuel
                                                                                     activities not included under                                                                                                                   37(0.0%)
                                                                                                                       required to generate power, such as electricity and heat
    Scope2                                                                           Scope 1 or Scope 2
                                  Indirect emissions                              4. U
                                                                                      pstream transportation and      Emissions associated with logistics of raw materials, parts, purchased goods, and sales-related
    Indirect emissions from the                                                                                                                                                                                                       8(0.0%)
                                  accompanying use of                                distribution                      materials up to delivery to Kawasaki
    generation of purchased                                        290
                                  electricity and heat                            5. Waste generated in operations    Emissions associated with transportation and processing of waste generated by Kawasaki                        12(0.0%)
    energy
                                  purchased by Kawasaki
                                                                                  6. Business travel                  Emissions associated with business travel by employees                                                        13(0.0%)
                                                                                  7. Employee commuting               Emissions associated with transportation of employees between their homes and their worksites                  7(0.0%)
                                                                                                                       Emissions associated with operation of assets leased by Kawasaki (excluding those included in
                                                                                  8. Upstream leased assets                                                                                                                          0(0.0%)
                                                                                                                       Scope 1 or Scope 2 calculations)
                                                                                  Scope 3 (Other indirect emissions): Downstream
                                                                                  9. D
                                                                                      ownstream transportation
                                                                                                                       Emissions associated with transportation, storage, cargo handling, and retail sales of products                0(0.0%)
                                                                                     and distribution
                                                                                  10. P
                                                                                       rocessing of sold products     Emissions associated with processing of intermediate products by companies                                    Excluded1
                                                                                  11. Use of sold products            Emissions associated with use of products by consumers and companies                                             (98.0%)
                                                                                                                                                                                                                                  118,550
                                                                                  12. E
                                                                                       nd-of-life treatment of sold   Emissions associated with transportation and treatment of products upon disposal by consumers
                                                                                                                                                                                                                                     Excluded1
                                                                                      products                         and companies
                                                                                  13. Downstream leased assets        Emissions associated with operation of assets leased to other companies                                       Excluded2
                                                                                  14. Franchises                      Emissions by franchisees                                                                                      Excluded2
                                                                                  15. Investments                     Emissions related to operation of investments                                                                 173(0.1%)
                                                                                  1. Excluded from calculation target because Kawasaki is unable to confirm reference data at this time.
                                                                                                                              図10
                                                                                  2. Excluded from calculation target because it     :物流過程におけるCO₂排出量と原単位
                                                                                                                                 is outside of the scope of our business.                          図11:物流過程におけるエネルギー使用量

Reduction of CO2 Emissions in Logistics Processes
Kawasaki takes steps to pinpoint CO2 emissions and promote energy-saving activities in its                                       CO2 emissions (left axis)                                           Energy consumption
                                                                                                                                  CO2 per unit of net sales (right axis)
logistics processes, which cover some of its supply chain (Scope 3, Category 4 “Upstream                                      (kt-CO2)                                     (t-CO2 ⁄ billion yen)   (TJ)

transportation and distribution”), to realize continuous reduction in CO2 emissions.                                             9                                                           6      80
  In fiscal 2019, CO2 emissions decreased by 4% year on year, to approximately 4,100 tons
                                                                                                                                                                                                                   62.1            62.4    60.4
(with energy consumption at approximately 60,000 GJ), due to a decrease in long-distance                                                                                                            60                    59.2
                                                                                                                                 6                                                           4              55.4
cargo transport by ship. Amounts for the past five years are shown in Figure 5 and Figure 6.                                                      3.60             3.54
                                                                                                                                          3.25             3.32            3.26
                                                                                                                                                                                                    40

                                                                                                                                 3                4.22             4.23                      2
                                                                                                                                          3.77             4.03            4.08
                                                                                                                                                                                                    20

                                                                                                                                 0                                                           0       0
                                                                                                                                         2015 2016 2017 2018 2019                          (FY)             2015 2016 2017 2018 2019                   (FY)

                                                                                                                              Figure 5: CO2 Emissions from Logistics Processes                    Figure 6: Energy Consumption in
                                                                                                                                         and CO2 Emissions Per Unit of Net Sales                              Logistics Processes
                                                                                                                              Notes: 1. Per unit of net sales figures are obtained by
                                                                                                                                         dividing CO2 emissions by net sales.
                                                                                                                                     2. The CO2 emissions factors used are values published
                                                                                                                                         by the Agency for Natural Resources and Energy.
CO2
Key Strategies         CO2 FREE          FREE                                                                                                                                   Kawasaki Environmental Report 2020              13

Onsite Power Generation

Onsite Power Generation
Kawasaki utilizes gas turbine and gas engine onsite power generation facilities as part of                              generated by boilers. Once we have finished these basic considerations, we will formulate
efforts to efficiently use energy at its plants (Figures 7 and 8). Under the 10th                                       concrete plans for specific facility configurations and installation methods and put them
Environmental Management Activities Plan, we have begun considering the implementa-                                     into action.
tion of high-efficiency gas turbines and gas engines as well as ways to make greater use of                               In addition, Kawasaki has designated the target of reducing 2030 CO2 emissions by 26%
waste heat in order to further reduce CO2 emissions.                                                                    from the fiscal 2013 level. As greater CO2 emissions reductions will be required to achieve
   In fiscal 2019, focusing mainly on plants where onsite power generation facilities are in                            this target, we are consider-
operation, we identified current issues and began looking into replacing or newly installing                            ing the implementation of
such facilities. Taking into account the demand for electricity and heat at each plant, eco-                            onsite power generation
nomic efficiency, and the current issues identified, we are advancing basic considerations                              facilities that use hydrogen
of the power generation output and facility configurations that would best enable efficient                             fuel and thus emit no CO2
energy use when optimally combined and balanced with purchased electricity and heat                                     during use.
                                                                                                                                          Figure 7: Onsite power genera-                           Figure 8: Onsite power genera-
                                                                                                                                                     tion facilities at Akashi                                 tion facilities at Kobe
                                                                                                                        図12:太陽光発電量
                                                                                                                                 (FITによる販売量を含む)      Works (gas turbine)                                       Works (gas engine)
Renewable Energy

Utilizing Renewable Energy
The Kawasaki Group is making its production and other equipment more energy efficient                                    Photovoltaic output (including power sold via FIT)

and advancing the use of renewable energy to reduce the CO2 emissions from its plants.                                  (MWh)
We are installing solar power generating systems at our plants, and currently have a total                              6,000
solar power generation capacity of 4,178 kW (Table 3).                                                                          5,007 5,019 5,236
                                                                                                                                                        4,749 4,883
   In fiscal 2019, these systems generated 4,883 MWh (Figure 9), of which 1,526 MWh                                     4,500
was used in-house.*
*Equivalent to 0.3% of Kawasaki’s total energy consumption.                                                             3,000

Table 3: The Kawasaki Group’s Solar Power Generation Capacity
                                                                                                                        1,500
                         Name                                      Power Usage               Generation Capacity (kW)
Iwaoka Photovoltaic Power Generation Station1                      Sold via FIT2                       1,505
                                                                                                                            0
Nagoya Works                                                       Used in-house                         750
                                                                                                                                2015 2016 2017 2018 2019                      (FY)
Seishin Photovoltaic Power Generation Station   1
                                                                   Sold via FIT                          701
Nishi-Kobe Works                                                   Used in-house                         505            Figure 9: Photovoltaic Output (Including Power
                                                                                                                                   Sold via FIT)
Nishi-Kobe Photovoltaic Power Generation Station1                  Sold via FIT                          422
Akashi Works                                                       Used in-house                         140
Sakaide Works                                                      Used in-house                          50
Kakogawa Photovoltaic Power Generation Station1                    Sold via FIT                           48
Hyogo Works                                                        Used in-house                          25
Kobe Works                                                         Used in-house                          20
Kawasaki Thermal Engineering Co., Ltd.                             Used in-house                          6.6
Harima Works                                                       Used in-house                           5
Total                                                                                                  4,178

1. Power generation facility operated by Kawasaki Trading Co., Ltd.                                                     Figure 10: Nagoya Works 1: 750-kW power                     Figure 11: Nishi-Kobe Works: 927-kW power
2. FIT: Feed-in tariff; a program in which renewable energy is bought back at a fixed rate
                                                                                                                                    generation facility                                          generation facility (of which 422 kW
                                                                                                                                                                                                 is sold via FIT)
CO2
Key Strategies   CO2 FREE     FREE                                                                                                         Kawasaki Environmental Report 2020        14

Energy-Saving Promotion Activities

Energy-Saving Promotion Activities
The Company has established an energy-saving promotion structure for each business seg-        energy-saving initiatives. This award praised multiple improvements that realized significant
ment and implements various Company-wide energy-conservation initiatives.                      energy-saving effects without requiring large capital expenditure thanks to creative efforts
  In fiscal 2019, Kawasaki awarded the Plant Energy-saving Grand Award to the Nishi-           at manufacturing worksites. One such improvement is highlighted below.
Kobe Works, part of the Precision Machinery Business Division, for its heat source

                                                                                                                                              Cool air replaces the hot
                                                                                                                                              air in the work area.

                                        Cool air                       Heat                                                                                           Heat

                                                             Heat
                                                                     Testing                                                                                        Testing
                             Work area                              equipment                                                                                      equipment
                                                                                                                                           Cool air

                                                                                                             The temperature in
              Cool air from the air conditioners did not reach the work area,
                                                                                                             the work area was
              which was made too hot by heat from the testing equipment.
                                                                                                             reduced approxi-                         Work area
                                                                                                             mately 2°C.

         Figure 12: Work Area Before Improvements                                                       Figure 13: Work Area After Improvements

In a large building where products are tested prior to shipping, the heat generated by test-   cool air from the existing units. By changing the position and angle of the cool air vents,
ing equipment made the adjacent work area too hot (Figure 12).                                 they were able to effectively replace hot air in the work area with cool air, solving the
  The plant’s employees considered the problem and realized that they could address it         problem (Figure 13).
without installing additional air conditioning units, simply by more effectively using the
CO2
Key Strategies        CO2 FREE         FREE                                                                                                                                        Kawasaki Environmental Report 2020              15

Reducing CO2 Emissions through Product-Based Contributions

Reducing CO2 Emissions through Product-Based Contributions
More than 90% of CO2 emitted during the life cycles of our products is released during the                                       through product-based contributions in order to better quantify the contributions of such
period of their use after they are sold. Therefore, the Company seeks to realize a low-                                          products to the mitigation of global warming.
carbon society by providing products that produce only low CO2 emissions during their use.                                         Calculations based on these rules showed that the CO2 emissions reduction through
  To reduce products’ post-sale CO2 emissions, in addition to increasing product energy                                          products we sold in fiscal 2019 was about 23.1 million tons. Large contributions were
efficiency, we are advancing electrification and modal shifts when replacing existing prod-                                      made mainly by the M7A Series gas turbines for power generation, Kawasaki-brand Green
ucts in our product lineup and expanding our lineup of products that utilize exhaust heat,                                       Products boasting excellent reliability, economy, and environmental friendliness, and the
waste, and renewable energy. Key products that help reduce CO2 emissions are listed in                                           M7V Series motors for HSTs,1 which boast world-leading output control.
Figure 14. In fiscal 2017, we revised our rules for calculating CO2 emissions reductions

                       Aerospace Systems                                  Energy System & Plant Engineering                           Precision Machinery & Robot                                    Transportation

       Airplanes and Space                                          Energy System                                                Precision Machinery                                  Ship & Offshore Structure
     O Boeing 787 (component production)                           OG
                                                                     as engines for power generation, including              O Hydraulic systems for construction and              OL
                                                                                                                                                                                       NG carriers, LPG carriers, car carriers
     O BK117 helicopters                                            the M1, M5, and M7 series industrial-use gas                 industrial machinery(K8V Series pumps               OS
                                                                                                                                                                                       hip operation support system (SOPass8)
       Jet Engines                                                  turbines                                                     for HSTs, M7V Series motors for HSTs, etc.)          Rolling Stock
     O Trent 1000 for the Boeing 787                               OH
                                                                     eated boilers (U-KACC,2 ICFB3), non-heated              O High-pressure hydrogen regulators for fuel          OS
                                                                                                                                                                                       tandard railcars (efACE9)
     O Trent XWB for the Airbus A350 XWB                            boilers (plant waste heat, waste incineration                cell vehicles                                       OA
                                                                                                                                                                                       ctive suspension system, track material
                                                                    waste heat), floating plants (FLNG4)                         Robot                                                monitoring device
                                                                    Plant Engineering                                         O duAro dual-arm SCARA robot, NT420                    Motorcycle & Engine
                                                                   OC
                                                                     hemical plants (GTG5), LNG tanks                           general-purpose clean robot                         ON
                                                                                                                                                                                       inja 250, Ninja ZX-6R, Ninja H2
                                                                   OS
                                                                     hield machines and crushing machine plant               O BX200L spot welding robot, KJ264/314                OV
                                                                                                                                                                                       ersys 650, Versys 1000
                                                                    (CK Mill6)                                                   large painting robots
                                                                    Marine Propulsion
                                                                   OM
                                                                     arine propulsion systems (E-series Rexpeller7)

Figure 14: Key Products That Contribute to Reducing CO2 Emissions During Use (by Segment)
1.	HST: Hydrostatic transmission: A non-stage transmission comprising a hydraulic pump and hydraulic motors.               Calculation Rules
2.	U-KACC: Upgrade Kawasaki Advanced Clean Combustion (boiler fueled by combustion-resistant petroleum residues).          OP
                                                                                                                              roducts to be assessed: Kawasaki-brand Green Products, products that use waste, waste heat, and
3.	ICFB: Internal Circulation Fluidized Bed Boiler (boiler fueled by underutilized biomass).                                renewable energy, as well as cogeneration systems and rolling stock pertaining to modal shifts, etc.,
4.	FLNG: Floating Liquefied Natural Gas facilities.
                                                                                                                             were selected for assessment.
5.	GTG: Gas To Gasoline plant (a plant that synthesizes gasoline from methanol synthesized from natural gas).
6.	CK Mill: Named after the companies that jointly developed it, Chichibu Cement Co., Ltd. (now Taiheiyo Cement Corpora-   OP
                                                                                                                              eriod of assessment: Until fiscal 2016, we used a one-year period of assessment. However, in line with
    tion) and Kawasaki.                                                                                                      the revision of the calculation rules, since fiscal 2017, we have adopted a flow-based approach10 in
7.	Developed with a focus on three Es: energy saving, easy maintenance, and environmentally friendly.
                                                                                                                              which the period of assessment is the estimated useful life of products sold in the fiscal year, because
8.	SOPass: Ship Operation and Performance analysis support system.
                                                                                                                              the estimated useful lives of our products are long. This allows us to better calculate the difference in
9.	efACE: Environmentally Friendly Advanced Commuter & Express train.
10.	Please refer to the “Guideline for Quantifying Greenhouse Gas Emission Reduction Contribution” (Ministry of Economy,     CO2 emissions between our products and industry standard class products over the entire period of use.
    Trade and Industry, March 2018).
CO2
Key Strategies     CO2 FREE      FREE                                                                                                                                       Kawasaki Environmental Report 2020            16
                                                                                                                図15:製品貢献によるCO₂排出量の削減効果

In order to quantify the contributions of highly energy efficient products to the mitigation                      CO₂ emission reduction through product-based contributions

of global warming, products included in the calculation of CO2 emissions reduction through                      (kt-CO2)

product-based contributions include power generated through waste heat, waste, renewable                        30,000
                                                                                                                                                   29,130
energy, and so forth. As a result, some of the products included differ from those included
in the calculation of Scope 3, Category 11, which covers only energy-derived CO2 emissions.                     25,000
                                                                                                                                          22,920            23,140
  CO2 emission reductions for the past five years are shown in Figure 15. Particularly
notable products that have had a large cumulative effect are shown in Figure 16.                                20,000

                                                                                                                  1,000    750     900
                                                                                                                      0
                                                                                                                           2015 2016 2017 2018 2019                     (FY)

                                                                                                                Figure 15: CO2 Emission Reduction through
                                                                                                                            Product-Based Contributions
                                                                                                                Notes: 1. K awasaki uses CO2 emissions factors provided
                                                                                                                           in the list of calculation methods and emis-
                                                                                                                           sions factors published by Japan’s Ministry of
                                                                                                                           the Environment.
                                                                                                                       2. The CO2 emission reduction effect through
                                                                                                                           product-based contributions achieved through
                                                                                                                           the higher energy efficiency of products is
                                                                                                                           based on a comparison using industry
                                                                                                                           standard products.
                                                                                                                       3. The application of waste heat, waste, and
                                                                                                                           renewable energy is counted toward the CO₂
                                                                                                                           emissions reduction effect through prod-
                                                                                                                           uct-based contributions.

    M7V Series motors for HSTs               Industrial-use gas turbines               Cement plant waste heat boilers           Kawasaki Green Gas Engine                           Commercial vessels (bulk carriers)
                                             (M7A Series, etc.)

Figure 16: Particularly Notable Products That Contribute to Reducing CO2 Emissions During Use
You can also read