A trickle, not a flood: environmental watering in the Murray-Darling Basin, Australia
←
→
Page content transcription
If your browser does not render page correctly, please read the page content below
CSIRO PUBLISHING

Marine and Freshwater Research, 2021, 72, 601–619
https://doi.org/10.1071/MF20172

     A trickle, not a flood: environmental watering in
     the Murray–Darling Basin, Australia

                          A ,B
     Yiwen Chen                  , Matthew J. Colloff A, Anna Lukasiewicz A and Jamie Pittock A
     A
       Fenner School of Environment and Society, The Australian National University, Building 141,
       Linnaeus Way, Canberra, ACT 2601, Australia.
     B
       Corresponding author. Email: evechen1996@gmail.com

     Abstract. Environmental flows are an integral component for the conservation and management of rivers, flood plains
     and other wetlands in the Murray–Darling Basin. Under the Basin Plan, environmental water is managed by the
     Commonwealth Environmental Water Office (CEWO) and the states. We assessed CEWO environmental flows (2014–15
     to 2018–19), compared our findings with expected outcomes for vegetation in the Basin-wide Environmental Watering
     Strategy (EWS) and interviewed water managers about the efficacy of environmental watering. Some 21% of CEWO
     water was delivered as flood events, to 9 of 19 river valleys, inundating 7% of wetland area in those valleys annually and
     0.8% of major Basin wetlands. A consistent pattern was the watering of many small wetlands on the South Australian
     Murray with small volumes (median area 43 ha, volume 125 ML). Just 12% of the area of river red gum subject to EWS
     expected outcomes was flooded, and half these events were likely suboptimal to achieve ecological benefits. Wetlands
     have not received the water they need and vegetation outcomes cannot be met by completion of the Plan in 2024. Rules that
     constrain flooding of private land must be relaxed if the Plan is to achieve its statutory requirement of wetland
     conservation.

     Keywords: adaptive management, environmental flows, environmental water accounting, floods, mixed methods,
     Murray–Darling Basin Plan, triage, water policy, wetlands.

     Received 1 June 2020, accepted 22 October 2020, published online 19 November 2020

Introduction                                                          irrigation water diversions, which increased sharply between
The Murray–Darling Basin (hereafter, the Basin) covers                1950 and 1990 (Kingsford 2000; Colloff et al. 2015). River
1.06  106 km2 of south-eastern Australia and contains ,30 000        flows were further reduced by extended drought (van Dijk et al.
wetlands of 25 000 km2 in area, including 6363 km2 of some 16         2013), climate change (Cai and Cowan 2008), flood plain
Ramsar wetlands (Murray–Darling Basin Authority 2010a, p. 59).        harvesting (i.e. interception and storage on-farm of overland
Over 100 wetlands are of national importance (Environment             flows; Steinfeld and Kingsford 2013) and recent increases in
Australia 2001), but only 10% of the area of the Basin, is desig-     irrigation water use, including illegal, unlicensed and unregu-
nated for conservation; the rest is mostly dryland pasture (69%)      lated diversions (Wheeler et al. 2020).
and arable land (12%). Irrigated agriculture accounts for ,3% of          The climate of the Basin is mostly arid to semi-arid, with
the area (Australian Bureau of Statistics, Australian Bureau of       mean annual rainfall ,500 mm and major droughts at median
Agricultural and Resource Economics, and Bureau of Rural Sci-         intervals of 9 years since 1800 (Colloff 2014, fig. 8.1 therein).
ences 2009), but 46% of the surface water available (the remaining    Strong gradients of rainfall (east–west) and evapotranspiration
54% being river outflows, transmission losses and urban water         (north–south) occur, with rainfall mostly in summer in the
use; CSIRO 2008, p. 32). Many irrigation districts are close to       northern Basin and during winter and early spring in the south
major wetlands (Fig. 1). The high level of surface water use          (Chiew et al. 2008), the seasons in which river discharge was
highlights the contestation between water for irrigation and the      naturally highest and natural floods occurred before river
environment, an issue that is central to an understanding of the      regulation and water resource development. Releases of irriga-
Basin as a social–ecological system and to past and current efforts   tion water from headwater dams during summer have reversed
in water reform policy and management (Connell and Grafton            the seasonal pattern of high flows in southern Basin rivers and
2011; Wentworth Group 2017; Grafton 2019; Grafton et al. 2020).       maximum discharge has been considerably reduced (CSIRO
   Rivers and other wetlands of the Basin were heavily modified       2008, p. 54), resulting in fewer, shorter, less frequent and
during the 19th century. Major stressors included grazing,            extensive floods.
timber harvesting and land clearing (Colloff 2014; Colloff                Altered flow and flood regimes vary spatially across the
et al. 2015). Subsequent stressors were river regulation and          Basin, with greatest changes in the southern Basin, which has a

Journal compilation Ó CSIRO 2021 Open Access CC BY                                                    www.publish.csiro.au/journals/mfr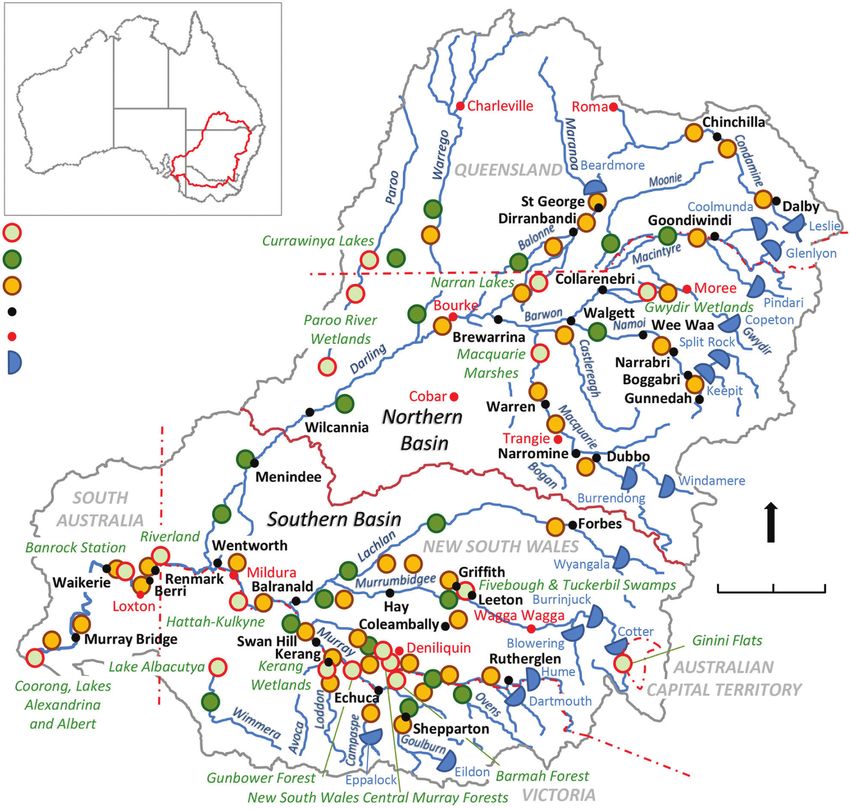
602     Marine and Freshwater Research                                                                                                   Y. Chen et al.

              Ramsar wetland
               Major wetland or floodplain
              Irrigation district
              Irrigation town
              Weather station (evaporation)
               Major headwater dam

                                                                                                                              N

                                                                                                                      0      100     200 km

         Fig. 1. The Murray–Darling Basin showing the proximity between major wetlands or floodplains and irrigation districts. Note the major
         headwater dams on most rivers that supply irrigation water and environmental flows, but that many wetlands are some distance
         downstream, constraining water delivery without flooding private land.

far longer history of regulation and irrigation water use than the            statutory instrument under the Water Act for returning water to
north (Sims et al. 2012). This variation is reflected in the                  the environment by reducing the amount taken by irrigators.
condition of river valleys, determined by the Sustainable Rivers                  The environmental objectives of the Plan are to protect and
Audit (Davies et al. 2010, 2012). For the assessment period                   restore flow-, flood- and groundwater-dependent ecosystems (or
2004–07, in the northern Basin, only the unregulated Paroo                    ‘water-dependent ecosystems’ in the Plan; i.e. rivers, lakes,
River valley was ranked in good health; four valleys were                     flood plains and other wetlands) and ensure they are resilient to
ranked as moderate, and four as poor or very poor. In the                     climate change and other threats (Commonwealth of Australia
southern Basin, one valley was ranked as in moderate health                   2012, p. 25). The Plan sets out a process to identify the
and thirteen as poor or very poor health (Davies et al. 2010).                environmentally sustainable level of take (ESLT) by setting a
    In response to the overallocation of water for irrigation and             sustainable diversion limit (SDL) for the Basin. This process
the poor condition of flow-dependent ecosystems, the Austra-                  involves assessing the water requirements of 124 ‘hydrologic
lian Government initiated a series of water reforms to balance                indicator sites’ (Murray–Darling Basin Authority 2012a) in
water use for irrigation and the environment and to promote                   order to determine the environmental water requirements to
sustainable water management by the National Water Initiative                 conserve ecosystems as required under the Water Act (Murray–
(National Water Commission 2004). These reforms are under-                    Darling Basin Authority 2010b, p. 487; Commonwealth of
pinned by the Commonwealth Water Act (2007). The Basin Plan                   Australia 2012, S6.01, S6.03; Walker 2019, pp. 201–204). Flows
(Commonwealth of Australia 2012; hereafter, ‘the Plan’) is a                  at these sites are assumed to represent the environmental water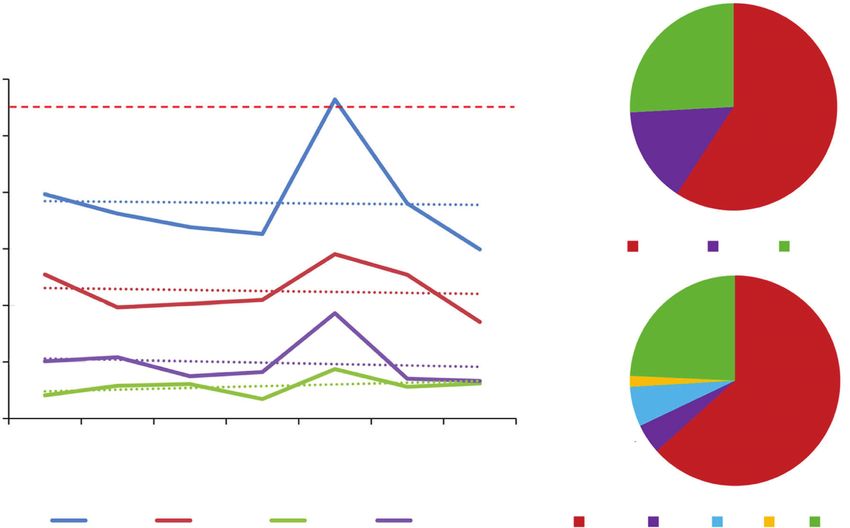
A trickle not a flood: environmental watering                                                  Marine and Freshwater Research        603

needs of rivers and other wetlands more broadly across the Basin.   contributions in the Campaspe and Loddon. In South Australia,
However, this assumption was part of the planning process and       most pooled releases are for the Riverland–Chowilla Floodplain
has not been corroborated empirically.                              and Lindsay–Walpolla. The end-of-system Coorong and Lower
    The Commonwealth Department of Agriculture is responsi-         lakes receive contributions of environmental water from
ble for recovering water from irrigators and the Murray–Darling     CEWO, three states and TLM (Table S2).
Basin Authority (MDBA) is responsible for the Plan, including           The plethora of environmental watering arrangements has
setting SDLs. The SDLs are implemented by water resource            led to a complex, rules-based culture of decision making,
plans administered by the states. Under the SDLs, an average of     monitoring and reporting. The Plan has been presented as an
2750 GL year 1 is intended to be reallocated from irrigators to     exercise in adaptive management (Murray–Darling Basin
the environment, with a further 450 GL year 1 to be recovered       Authority 2017; Watts et al. 2020; Gawne et al. 2020). But it
through improved irrigation water use efficiency. The Com-          remains unclear how lessons learned can be integrated into the
monwealth Environmental Water Office (CEWO) manages                 Plan outside its rigid rules and timelines: the Plan is subject to 5-
environmental water recovered from irrigators (Docker and           yearly review and is due to be fully operational in 2024. In an
Robinson 2014). These arrangements, together with the wide          example of maladaptive decision making, it was recommended
range of water users and stakeholders in the Basin with differing   that accounting for effects of climate change, not included in the
interests, perspective and values, create a complex and contested   setting of the SDLs, should only be considered when the plan is
social and political context for the delivery and use of environ-   due for review in 2026 (Vertessy et al. 2019, p. 14), despite
mental water (Colloff and Pittock 2019; Grafton et al. 2020).       record temperatures in 2017, 2018 and 2019 during the worst
    Environmental objectives include maintaining river connec-      drought in recent history and the acknowledgement by the
tivity and native vegetation and increasing populations of          Murray–Darling Basin Authority (2019b, p. 3) of the need to
waterbirds and native fish, as well as conserving Ramsar sites      adapt to a future with less water than was planned in 2012.
and other ecologically important wetlands (Murray–Darling               Many uncertainties remain over how environmental objec-
Basin Authority 2019a). Environmental water to achieve these        tives will be achieved (King et al. 2015; Thompson et al. 2019)
objectives is partitioned among jurisdictions and includes water    and there is as yet no synthesis of outcomes at Basin scale that
held by the Commonwealth (CEWO), New South Wales                    collates site-based monitoring data. Site-specific benefits have
(NSW), Victoria and South Australia and jointly with the            been reported, including improved vegetation condition (Capon
MDBA under the Living Murray program (TLM; Murray–                  and Campbell 2017) and fish breeding (NSW Office of Envi-
Darling Basin Authority 2011), as well as volumes for specified     ronment and Heritage 2017, p. 27) but these have tended to be
purposes under various water sharing agreements, such as the        small scale and short term (Colloff and Pittock 2019; Moxham
Barmah-Millewa environmental water allowance, established in        et al. 2019).
1993 by the Murray–Darling Basin Ministerial Council                    Reporting of environmental watering is fragmented, in
(Schofield et al. 2003, p. 24). In Queensland, environmental        annual reports by CEWO, state agencies and others, with
water is protected in water resource plans for each river valley    duplication of locations, events, water sources and volumes,
by rules on access to water, rather than by specific allocations.   as well as inconsistencies in data and reporting regions. To
    The CEWO partners with states and other water holders in        assess watering in the Basin for 2016–17, one has to consult
sharing contributions to environmental water for release in most    seven reports: NSW Office of Environment and Heritage
river valleys (see Table S1 in the Supplementary material to this   (2017); Department of Environment, Water and Natural
paper, for relative contributions by valley and Murray–Darling      Resources (2017); Victorian Environmental Water Holder
Basin Authority (2019a, pp. 74–79) and Commonwealth Envi-           (2017a, 2017b); Hale et al. (2018), Murray–Darling Basin
ronmental Water Office (2013, pp. 8–10, 19–21) for operational      Authority (2018b) and Commonwealth Environmental Water
details). Annual environmental watering priorities are set by the   Office (2020a). A confounding issue in monitoring and report-
MDBA at the beginning of each water year (e.g. Murray–              ing is the difficulty in apportioning outcomes achieved from
Darling Basin Authority 2018a). The priorities (which are           Commonwealth environmental water from that of other water
essentially objectives) are intended to support the expected        holdings released concurrently, as well as from natural, or
environmental outcomes detailed in the Basin-wide Environ-          unregulated, river flows.
mental Watering Strategy (EWS; Murray–Darling Basin                     The multiple agencies involved in monitoring and reporting
Authority 2019a) and hence the ecological objectives and            create additional uncertainty and inconsistency at Basin scale.
expected outcomes in the Plan. Environmental outcomes are           Annual reports may provide some detail for a few major water-
monitored by the states and on behalf of CEWO, which forms a        ing events, but tend only to specify the volume delivered to
basis for implementation of adaptive management (Murray–            particular rivers and other wetlands and lack basic data, includ-
Darling Basin Authority 2017).                                      ing areas of wetlands inundated, depth and duration of flood
    In NSW, most shared environmental water releases that           events (including peak discharge, rates and duration of rise and
involved flood events are for major wetlands, particularly          recession) and whether objectives were met. It is challenging
Gwydir and Mallowa wetlands, Macquarie Marshes, Great               and time-consuming to determine who did what, where, when
Cumbung, Booligal and Lachlan swamps, the mid- and lower-           and how, the sources of water involved and what happened.
Murrumbidgee wetlands and Central Murray forests, with con-         Thus, it is not clear that best practice monitoring is being done,
tributions from TLM to the latter (Table S2). In Victoria, most     particularly the use of underpinning conceptual ecosystem
shared releases by valley are in the Central Murray and Goul-       models, the setting of good questions, hypotheses and objectives
burn–Broken, as well as for Hattah Lakes, with small shared         and specific monitoring and reporting on these (Lindenmayer
604     Marine and Freshwater Research                                                                                   Y. Chen et al.

and Likens 2018, pp. 60–66). Accordingly, there is growing           Environmental water releases
concern whether environmental flows released to date are             We collated data on the volume of environmental water released
sufficient to achieve planned ecological outcomes at Basin scale     by the Commonwealth and states in each river valley in the
(Colloff and Pittock 2019).                                          Basin between 2012–13 and 2018–19, covering the first 7 years
   Our aims in this study were to assess how and where               of the Plan. Data were sourced from CEWO and state annual
environmental water has been used by federal and state govern-       reports (see sources of data used in Table S1). We assessed the
ment agencies and their partners for the period 2012–13 to           volume attributed to the Commonwealth Environmental Water
2018–19 (i.e. from the commencement of the implementation of         Holder (CEWH), States (NSW, South Australia and Victoria)
the Plan). We also assessed the nature and extent of environ-        and other sources, including TLM, environmental water allo-
mental watering by CEWO of floodplain wetlands and of                cations (EWA) under water sharing plans in NSW and water
wetland woody vegetation communities that are the subject of         from the Snowy Scheme (‘River Murray increased flows’). We
targets for the maintenance of their extent and condition under      note that total volumes of environmental water delivered in the
the Basin-wide EWS (Murray–Darling Basin Authority 2019a).           Basin by CEWO 2012–13 to 2018–19, as reported by the
We focussed on wetland woody vegetation communities                  Department of Agriculture, Water and the Environment (2020),
because of their important role in primary productivity, carbon      are lower than the sum of the volumes in the CEWO long-term
and nutrient cycling and habitat provision in many wetlands and      intervention monitoring (LTIM) reports (e.g. Gawne et al. 2016;
because their nature and extent are defining features of the         Hale et al. 2020, appendix A). The former are net total use (i.e.
ecological character of wetlands listed under the Ramsar Con-        the volumes of environmental water actually released), whereas
vention (Murray–Darling Basin Authority 2019a, p. 33). An            the LTIM volumes include return flows from River Murray
important requirement of the Ramsar Convention is that the           tributaries that are available for reuse after they enter the Mur-
ecological character of all wetlands should be maintained, not       ray. We used net total use to avoid double counting and in order
just that of Ramsar sites (Pittock et al. 2010, p. 403). The Water   to assess the overall contribution from each jurisdiction. Data on
Act represents a law, and the Plan a legal instrument, that          net total use is not broken down by river valley, so we used
implements Commonwealth obligations with respect to external         LTIM figures for valleys (Table S1), noting that the risk of
affairs under international environmental treaties, including the    double counting due to return flows is lower in other valleys than
Ramsar Convention (Walker 2019, p. 107).                             in the Murray.
   We used data for the water years from 2014–15 to 2018–19,             Our intent in this assessment was to determine the contribu-
coinciding with improved reporting of individual watering            tion from each jurisdiction and the volume released down each
events by CEWO. This is also the period when Commonwealth            river valley and compare events in the southern Basin with those
environmental water entitlements reached 2100 GL year 1,             in the northern Basin. The reasons for the latter comparison are
close to the maximum likely to be acquired for the foreseeable       because of major differences in patterns of water recovery for
future because of political compromises on approaches to water       the environment, irrigation water use and diversions, state water
recovery. We assessed the watering of floodplain wetlands            planning arrangements, the history of water resources develop-
rather than in-channel flows because of the many nationally          ment, river hydrology, climate and the ecological character of
and internationally significant wetlands in the Basin. Also, the     wetlands (Chiew et al. 2008; Murray–Darling Basin Authority
flooding of wetlands generates bioavailable carbon and nutri-        2010a, 2010b; Davies et al. 2010; Prosser et al. 2012). To assess
ents that return to the river channel downstream and drive           the relationship between the volume of environmental water
within-channel aquatic food webs (Rees et al. 2020). We              releases and occurrence of drought, we compared the volumes
evaluated whether environmental water could be considered to         delivered between 2012–13 and 2018–19 with the annual
have been delivered efficiently and effectively by conducting        difference from the long-term mean annual rainfall for the
interviews with staff from government agencies who are               Basin.
involved in policy and management of environmental flows.
                                                                     Environmental water for floodplain wetlands
Materials and methods                                                Environmental water may be released as in-channel flows or
We used a mixed-methods approach, involving both quantita-           floods of wetlands, achieved naturally, as overbank flows, or
tive and qualitative data (Harwell 2011). We collated data on        artificially. Here, we use ‘wetlands’ to include flood plains,
environmental flow events across the Basin, which then               according to the definition of the Ramsar Convention on Wet-
informed our formulation of questions for interviews with            lands (Ramsar Convention Secretariat 2016, p. 47). Australian
environmental water managers. Qualitative semistructured             Governments have used the term ‘wetlands’ more narrowly than
interviews were used to cross-reference quantitative findings        the Ramsar Convention definition to exclude river channels and
with professionals with experience in water management and           flood plains. Water is delivered as flood events to many wet-
policy, including the clarification of problems and dis-             lands in the Murray valley by pumping from the main channel
crepancies, and provided important insights into constraints and     rather than by overbank flows. In other wetlands (e.g. Barmah
risks in policy and management of environmental flows. We            Forest), water from the main channel floods the wetland via
considered that cross-referencing of quantitative findings to        regulated distributary channels (Murray–Darling Basin
inform questions asked during interviews would enable a deeper       Authority 2012b, p. 13). In rivers with terminal wetlands
understanding of environmental water issues than from a              (Macquarie Marshes, Narran Lakes, Great Cumbung Swamp
quantitative analysis alone.                                         and Booligal Wetlands), almost all in-channel inflows result in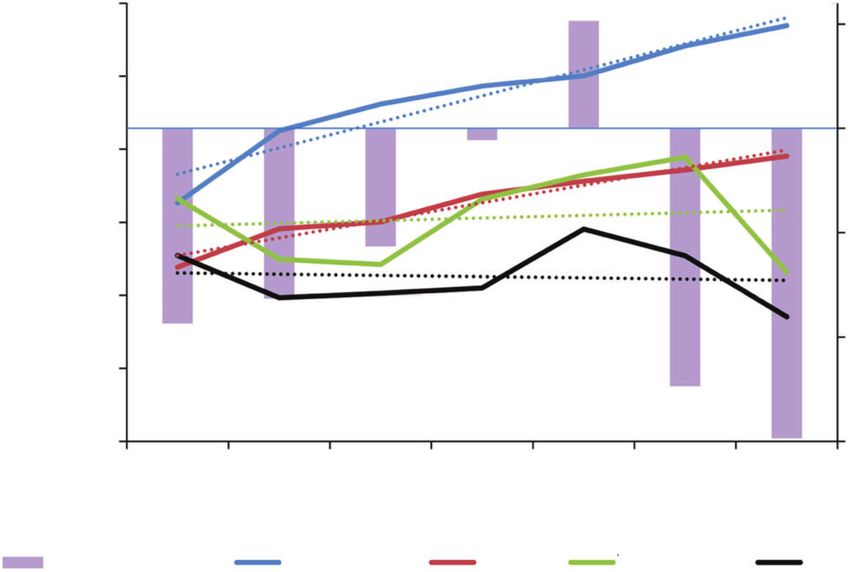
A trickle not a flood: environmental watering                                                                                 Marine and Freshwater Research         605

                                                   (a)                                                            (b)

                                            3000                                                                                  26%
                                                                                                    2750 GL
       Environmental water delivered (GL)

                                            2500                                                                                15%             59%

                                            2000

                                            1500                                                                              CEWO      State     Others

                                            1000
                                                                                                                  (c)
                                                                                                                                  24%
                                             500
                                                                                                                        2%
                                                                                                                        6%                      63%
                                               0
                                                    2012–13 2013–14 2014–15 2015–16 2016–17 2017–18 2018–19              5%
                                                                          Water year

                                                            Total       CEWO           State    Others               CEWH       NSW     Vic.    SA    Jointly held

       Fig. 2. (a) Volumes of environmental water delivered between 2012–13 and 2018–19 by the Commonwealth Environmental Water Holder
       (CEWO), the states (New South Wales (NSW), South Australia (SA) and Victoria (Vic.)) and from other sources, with lines of best fit, in
       relation to the 2750 GL of water intended to be returned annually to the environment under the Basin Plan. (See Table S1 for details: total
       volume is calculated using CEWO net total use.) (b) Volumes of environmental water delivered, expressed as percentages, for the entire period.
       (c) Volumes of environmental water held in the southern Basin in 2018–19 (Southern Connected Basin Environmental Watering Committee
       2019, p. 30).

wetland flooding. We use the terms ‘flood’ and ‘inundation’                                       releases because they account for only a small proportion of the
interchangeably (they are synonymous in common usage),                                            total volume (Fig. 2) and are not reported consistently by
regardless of their means of delivery.                                                            individual event, date, duration and flow component.
   To determine the volume of environmental water released to                                        Data on flood extent per wetland is not reported by CEWO,
wetlands as floods, we used CEWO data from 2014–15 to 2018–                                       but aggregated to river valley, based on inundation mapping
19 (Gawne et al. 2016, 2017; Hale et al. 2018, 2019, 2020),                                       (Brooks 2016, 2017, table 1 therein; Hale et al. 2018, 2019,
covering the 5 years of the CEWO LTIM project. We counted                                         2020, table 3). However, inundation mapping cannot differenti-
the flow components of ‘overbank’ and ‘wetland’ as flood                                          ate the contribution of CEWO environmental water from other
events for wetlands, following the categorisation used by                                         sources of environmental water or inflows due to high rainfall.
CEWO and state agencies for their individual flow events.                                         Accordingly, we used areas of wetlands from published sources
Flood plain hydrogeomorphology is complex and may include                                         or by estimating them using the polygon function of Google
main river channels, anabranches, tributary and distributary                                      Earth Pro (Table S3) and applying the concept of an ‘ecolog-
creeks, palaeochannels, billabongs, lakes and wetlands at vari-                                   ically effective flood’ (for all ecological components, including
ous elevations on the flood plain, from low to high. Accordingly,                                 nesting waterbirds), with a minimum depth of 0.5 m (thus, 1 ML
a flow categorised by government agencies as ‘fresh’ may                                          covers 0.2 ha) to derive an estimate of area flooded. Minimum
inundate modest areas of low-lying wetlands beyond the main                                       flood depth is specified in some environmental watering plans,
river channel (e.g. billabongs). In the absence of publicly                                       including 1 m for mixed marsh grassland at Macquarie Marshes
available inundation mapping data, we have applied the govern-                                    (NSW Office of Environment and Heritage 2012, p. 53) and
ments’ categorisation of their flows as the most reliable record                                  0.5 m at Barmah–Millewa Forest (Murray–Darling Basin
of whether the intention was to improve environmental health                                      Authority 2012b). Below this latter depth, breeding waterbirds
‘in-channel’ versus broader areas of ‘wetland’ and ‘overbank’                                     are vulnerable to nest predation. The mean depth of 10 flood
watering. For the terminal wetlands listed above, we counted in-                                  events at major Basin wetlands (from 2014–15 to 2018–19) was
channel flows as wetland flows. We focussed on CEWO water                                         calculated as 0.82 m (Table S4), indicating floods of depth
released during this period because CEWO is responsible for                                       .0.5 m are achieved regularly, although on relatively small
most of the environmental water released (Fig. 2) and events are                                  proportions of the total area of each wetland. Our method does
reported under the LTIM program individually by date, duration                                    not account for wetland margins where depth is ,0.5 m.
and flow component (‘baseflow’, ‘fresh’, ‘overbank’ and                                           However, estimates of flood extent are sufficient to compare
‘wetland’). Prior to 2014–15, CEWO reporting did not include                                      with the total area of wetlands that received Commonwealth
dates and flow components. We did not include state water                                         water as overbank or wetland flows. We also compared our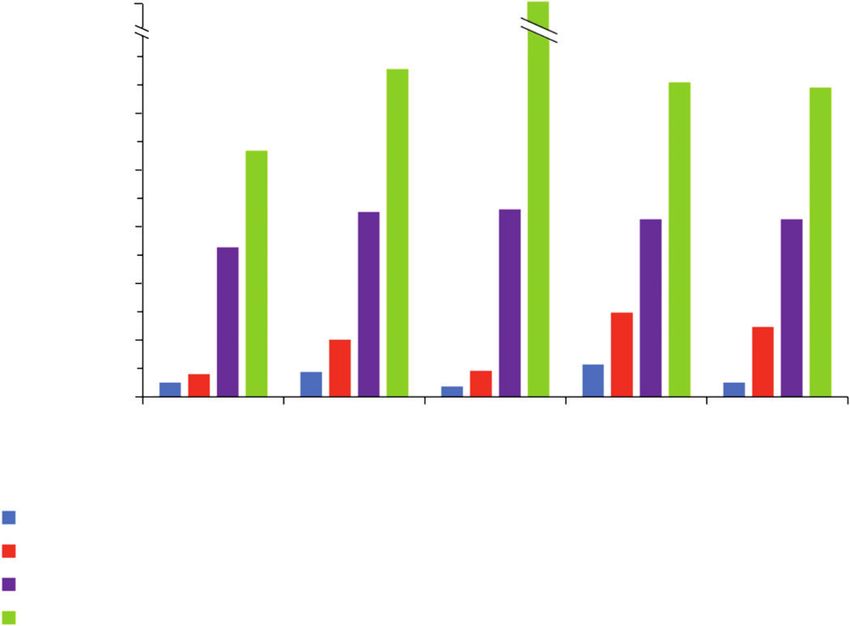
606     Marine and Freshwater Research                                                                                    Y. Chen et al.

estimates of flood extent with ‘measured and predicted 1-year         agency (Anon.). The interview protocol was approved by The
outcomes’ of areas watered by CEWO (Gawne et al. 2016, p. 30,         Australian National University Human Research Ethics Com-
2017, p. 33; Hale et al. 2018, p. 36, 2019, p. 31, 2020, p. 17) and   mittee. Open questions were used to guide the conversation,
with the area of major wetlands in each river valley (detailed in     intended to address three issues: (1) hydrological and ecological
Table S2).                                                            outcomes of environmental watering; (2) constraints and con-
                                                                      flicts; and (3) potential impacts of climate change (see the
Wetland vegetation communities                                        ‘Questions used in semi-structured interviews’ section in the
                                                                      Supplementary material). Interview data were coded using
We collated data on areas of flood-dependent woody vegetation
                                                                      thematic analysis (Braun and Clarke 2006, p. 79). Interviews
that received Commonwealth environmental water from 2014–
                                                                      took between 30 min and 2 h and five were conducted face to
15 to 2018–19 (Brooks 2016, 2017, 2018, 2019, appendices B
                                                                      face and eight by phone or video link. Interviews were tran-
and C therein, 2020, appendices 3 and 4 therein). These CEWO
                                                                      scribed and transcripts were reviewed by authors or participants.
reports use the interim Australian National Aquatic Ecosystem
                                                                      Any unclear information in the transcripts was clarified by
(ANAE) classification (Brooks et al. 2014), which includes 19
                                                                      participants. Primary themes were identified and coded using
ecosystem types for dominant wetland tree and shrub commu-
                                                                      NVivo software (QSR International, Melbourne, Vic.,
nities. We reclassified these types into five categories as follows
                                                                      Australia).
(ANAE codes in parentheses): river red gum Eucalyptus
camaldulensis forest (F1.1, 1.2, Pt1.1.1, 1.1.2) and woodland
(F1.3, 1.4), black box Eucalyptus largiflorens woodland (F1.5–        Results
1.8, Pt1.2.1, 1.2.2), coolibah Eucalyptus coolabah woodland           Environmental water releases
(F1.9, 1.10, Pt1.3.1, 1.3.2) and lignum Duma florulenta shrub-
                                                                      There was no overall change in the volume of environmental
land (F2.1, 2.2, Pt 7.1). We chose these communities because
                                                                      flows released between 2012–13 and 2018–19 based on the line
they are the subject of expected outcomes in the Basin-wide
                                                                      of best fit, averaging 1905 GL year 1. A peak of 2820 GL in
EWS (Murray–Darling Basin Authority 2019a, Appendix 2).
                                                                      2016–17 (Fig. 2a), a wet year, was mostly due to a high volume
The strategy covers what is referred to as ‘the managed flood
                                                                      of water (1250 GL) released down the central Murray, Mur-
plain’ (i.e. the area where floodplain vegetation can be actively
                                                                      rumbidgee and Goulburn rivers from May to December
managed with environmental water allocated under the Plan;
                                                                      (Table S1), which was followed by a marked decline in releases
Murray–Darling Basin Authority 2019a, p. 26).
                                                                      in 2017–18 and 2018–19. The mean total annual volume is well
    We could not use the ‘ecologically effective flood’ method to
                                                                      below the 2750 GL benchmark, the volume intended to be
calculate the proportion of each vegetation community flooded
                                                                      returned to the environment under the Plan (Commonwealth of
because data on areas of each community in each wetland are not
                                                                      Australia 2012, p. 43). For Commonwealth and state water
publicly available in CEWO reports. Accordingly, we had to use
                                                                      released, as well as water from other sources, there was no
CEWO data on areas of each vegetation community flooded in
                                                                      change in the volume of environmental water released during
each river valley. A complicating factor with these data is that
                                                                      the first 7 years of the Plan. The pattern of net Commonwealth
CEWO reporting distinguishes ‘floodplain’ areas that were
                                                                      environmental water releases (mean 1128 GL year 1) is well
‘inundated’ from ‘wetland’ areas that were ‘influenced’ by
                                                                      below the long-term average annual yields for Commonwealth
Commonwealth environmental water (i.e. the total wetland
                                                                      environmental water entitlements, which increased by 722 GL
areas that received water, even if only part of the wetland was
                                                                      over the 7 years, although the net volume of Commonwealth
flooded). In the absence of other available data, we treated ‘area
                                                                      water released actually declined slightly (based on line of best
influenced’ for each vegetation community as a proxy measure
                                                                      fit; Fig. 3).
for actual area flooded, recognising it will be an overestimate.
                                                                          There was no correlation between Commonwealth water
    We assessed the duration of delivery and seasonal occurrence
                                                                      releases and drought. Mean annual rainfall from 2012–13 and
of each flood event for which vegetation outcomes was listed as
                                                                      2018–19 varied between 310 and 514 mm, against a long-term
an objective (Gawne et al. 2016, 2017; Hale et al. 2018, 2019,
                                                                      average of 469 mm (1900–2015), with 1 year above average, an
appendix A therein) to assess whether these variables matched
                                                                      average year, 2 years ,20% below average and 2 years .25%
known water requirements of river red gum, black box, coolibah
                                                                      below average (Fig. 3). The highest and second-highest annual
and lignum (Roberts and Marston 2011) and whether water was
                                                                      volumes of Commonwealth water were released in the wettest
delivered at a time of year whereby evaporative loss would be
                                                                      (2016–17) and second driest (2017–18) years respectively, and
minimised, thus prolonging the duration of the flood.
                                                                      the lowest was released in the driest year (2018–19), only
                                                                      slightly lower than the volumes delivered in the 2 years of
Semistructured interviews                                             ,20% below-average rainfall.
Semi-structured interviews (Drever 1995) were conducted from              From 2012–13 to 2018–19, a net total of 7893 GL was
May to August 2019 with 13 staff from Commonwealth and                delivered by CEWO; 59% of the total environmental water
state agencies responsible for policy or management of envi-          from all sources (Fig. 2b). The average amount of all environ-
ronmental water in the Basin, or both. Respondents were               mental water released in the northern Basin over this period was
recruited using snowball sampling (Biernacki and Waldorf              11% of the total (all sources) and 7% of total CEWO water. Of
1981). Seven respondents were from federal agencies (identified       total CEWO water, 71% was released down two river valleys:
in results as ‘Fed.’), two were from Victorian agencies (Vic.),       the Murrumbidgee and the Murray. The Goulburn–Broken
one from Queensland (Qld) and three chose not to identify by          accounted for a further 11% with the Macquarie–Castlereagh,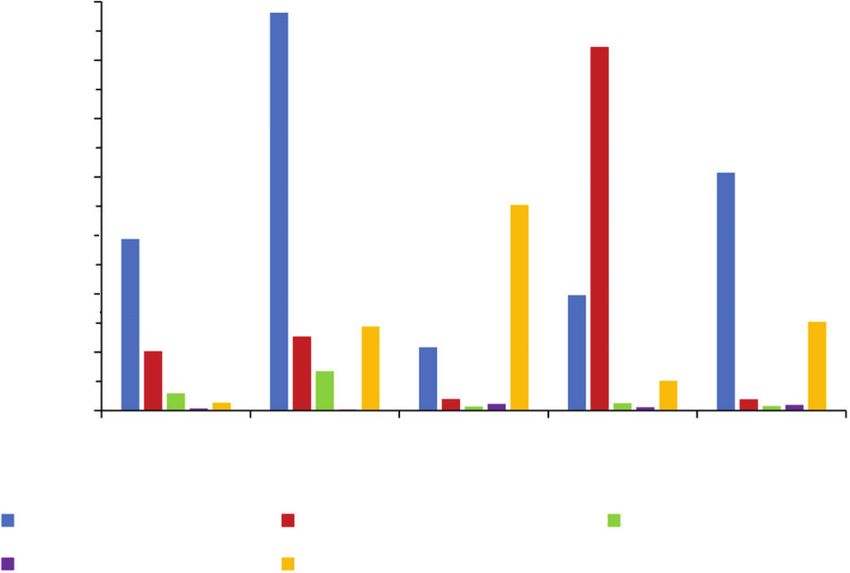
A trickle not a flood: environmental watering Marine and Freshwater Research 607
3000
Mean annual rainfall anomaly (mm)
50 environmental water as floods (Table 1). The total area of
wetlands of which parts thereof received some CEWO water
Environmental water (GL)
2500
0 was 687 268 ha, or 21% of the total area of major wetlands in the
2000
nine valleys (3 234 367 ha). However, the estimated maximum
1500 area flooded (based on a flood of a minimum depth of 0.5 m)
–50
over the 5 years was 208 455 ha, giving an average of 41 691 ha
1000 year 1 or 23% of the ‘measured and predicted area watered’ by
–100 CEWO (182 500-ha annual average), 7% of the area of wetlands
500
of which some parts received some CEWO water (616 420-ha
0 –150 annual average) and 2.6% of the total area of major wetlands in
2012–13 2013–14 2014–15 2015–16 2016–17 2017–18 2018–19 those valleys that received some CEWO water (1 587 031-ha
Water year annual average; Fig. 5). The maximum area flooded to 0.5 m
Rainfall anomaly Entitlements LTAAY Total (LTIM) Net total use over 5 years represents 3.8% of the area of all major wetlands in
valleys in the Basin where environmental flows can be deliv-
Fig. 3. Volume of Commonwealth environmental water delivered (from
ered, equivalent to 0.8% year 1.
Table S1), compared with volume held as entitlements and the long-term
The consistent pattern over the 5 years was the watering of a
average annual yield (LTAAY) of those entitlements at the close of each
water year, from 2012–13 to 2018–19, with lines of best fit for amount large number of very small wetlands with a small volume of
delivered and yield (primary y-axis), compared with annual difference from water in the lower Murray of South Australia (median area of
long-term mean annual rainfall (1900 to year of record) in the Murray– wetlands 43 ha, median volume of water 125 ML; derived from
Darling Basin (secondary y-axis). The Commonwealth Environmental data in Table S3; cf. also Fig. 4). Of the large Ramsar wetlands,
Water Holder (CEWO) has accumulated a range of diverse entitlements Macquarie Marshes and Gwydir Wetlands received flood
with differing water yields, including substantial amounts of low-yielding events in all years, whereas Narran Lakes received water only
entitlements (Wentworth Group 2017, appendix 1 therein). The LTAAY in 2016–17 (Hale et al. 2020, table 5 therein), although most of
represents the mean volume of these entitlements. Data on releases are from the wetland was inundated in April 2020 (Commonwealth
Table S2; entitlements and LTAAY are from the Department of Agriculture,
Environmental Water Office 2020b). Only six wetlands in
Water and the Environment (2020). Note, figures for water delivered by
the northern Basin were watered (Western [Toorale] Flood-
CEWO 2012–13 to 2018–19, reported by the Department of Agriculture,
Water and the Environment (2020), represent net total use and are lower than plain, Narran Lakes, Macquarie Marshes, Gwydir and Mallowa
those reported as the CEWO total in the Long-term Intervention Monitoring Wetlands and Ballin Boora Creek; Table S3). Ramsar wetlands
(LTIM) program reports (by an average of 26%; range 16–37%) because the on the Murray and in Victoria received flood events from
former represents the volume of environmental water actually released, several water sources, including Commonwealth water, the
whereas the LTIM figures include return flows from River Murray tributar- states and TLM.
ies that are available for reuse after they enter the Murray. The extent of flooding we estimated (Fig. 5) was consider-
ably less than the area of CEWO ‘measured and predicted 1-year
outcomes’ (Gawne et al. 2016, p. 30; 2017, p. 33; Hale et al.
Gwydir and Lachlan accounting for 2.6, 2 and 1.8% 2018, p. 36, 2019, p. 31). For example, for 2017–18, Hale et al.
respectively. (2019) reported over 296 000 ha of wetland and flood plain
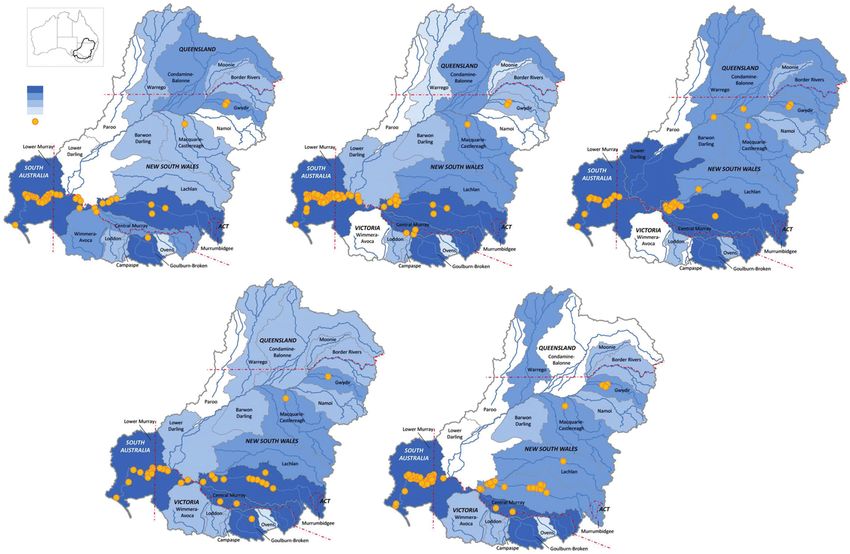
The distribution and magnitude of Commonwealth environ- inundated across the Basin, but the actual volume delivered was
mental water releases shows a similar pattern annually. For in- sufficient to flood only an estimated 113 886 ha (based on a
channel flows, most water was released in the southern Basin: in minimum depth for an ecologically effective flood of 0.5 m).
the Murray, Murrumbidgee and Goulburn–Broken valleys, The mean depth of the flooding claimed by Hale et al. (2019)
accounting for 82% of the total (Fig. 4; Table S1). This pattern would have been only 19 cm, more where environmental water
relates broadly to the relative magnitude of river discharge (high releases were ‘piggy-backed’ on natural flows but lower if
in the south, lower in the north). The Paroo is an unregulated conveyancing losses due to evaporation, evapotranspiration
river and receives no managed environmental water. The and seepage were taken into account.
Moonie, Border Rivers and Namoi valleys in the north and the
Wimmera, Lodden, Campaspe and Ovens in the south contain Wetland vegetation communities
small areas of important wetlands (Table S2) and received only a We compared the LTIM-estimated annual flood extent for each
small amount of environmental water. vegetation community with expected vegetation outcomes, by
river valley, required to meet targets in the Basin-wide EWS
Environmental water for floodplain wetlands (Murray–Darling Basin Authority 2019a, appendix 2 therein).
Some 21% of the total volume of Commonwealth environ- We found significant shortfalls in the extent of flooding
mental water was delivered as overbank and wetland flows achieved to date and the areas stipulated in the expected out-
(including in-channel flows to terminal wetlands) from 2014–15 comes for the maintenance of extent and condition of vegetation
to 2018–19, accounting for 1687 GL (Table S5). There were communities. River red gum forests and woodlands were floo-
271 wetland and overbank flood events over the 5 years, of ded to the greatest extent (mean 45 210 ha year 1; Table 2). A
which 247 were in the southern Basin, particularly the lower small proportion of each vegetation community was flooded
Murray and lower Murrumbidgee valleys (Fig. 4; see Table S3, annually, based on a comparison with the total extent for each
which lists 119 wetlands in these valleys from a total of 125). vegetation community assessed using the ANAE classification,
Wetlands in nine of the 19 river valleys we assessed received with a mean of 4.9% of red gum forest, 3.3% of red gum608 Marine and Freshwater Research Y. Chen et al.
2014–15 2015–16 2016–17
Volume of environmental
water delivered (ML year–1)
>100 000
1000–100 000
1000–10 000Table 1. Volume of Commonwealth water used to flood wetlands in the Murray–Darling Basin from 2014–15 to 2018–19, estimated extent of floods as a percentage of the total area of wetlands
that received some Commonwealth water on one or more occasions over the 5 years and the total area of major wetlands in each river valley
The estimated maximum area flooded is the area covered by a flood of 0.5 m in depth (where 1 ML covers 0.2 ha). To avoid multiple counting of areas flooded more than once, the final column is the sum of the
maximum flooded area of each wetland in any year, rather than the sum of all flooded areas over 5 years. For major wetlands in each valley see Table S2 and for wetland areas and water volumes, see Table S3.
The total area of major wetlands is 5 827 360 ha, but only 5 499 713 ha is in valleys, or parts thereof, where environmental flows can be delivered. CEWO, Commonwealth Environmental Water Office;
e-flows, environmental flows
River valley Total Area of CEWO- 2014–15 2015–16 2016–17 2017–18 2018–19 2014–19
area of wetlands watered wet- Volume Area Volume Area Volume (ML) Area flooded Volume (ML) Area flooded Volume (ML) Area flooded Estimated maxi-
major that land area (ML) flooded (ML) flooded (percentage (percentage (percentage mum area floo-
wetlands received (percentage of (percentage (percentage of CEWO- of CEWO- of CEWO- ded (ha)
A trickle not a flood: environmental watering
(ha) some area of major of CEWO- of CEWO- watered wet- watered wet- watered wet-
CEWO wetlands) watered watered land area) land area) land area)
water wetland wetland
area) area)
Paroo 289 604 0 0 0 0 0 0 0 0 0 0 0 0 0
Warrego 46 500 8800 18.9 0 0 0 0 9702 22.1 0 0 0 0 1940
Condamine– 2 014 480 26 480 1.3 0 0 0 0 18 000 13.6 0 0 0 0 1500
Balonne
Moonie 200 0 0 0 0 0 0 0 0 0 0 0 0 0
Border Rivers 5460 0 0 0 0 0 0 0 0 0 0 0 0 0
Gwydir 109 163 109 163 100 39 667 7.3 4836 0.9 16 496 3 4000 0.7 46 950 8.6 8053
Namoi 17 517 0 0 0 0 0 0 0 0 0 0 0 0 0
Macquarie– 200 000 200 000 100 10 000 1 14 239 0.1 24 289 2.4 48 421 4.8 45 052 4.5 10 150
Castlereagh
Barwon– 170 000 0 0 0 0 0 0 0 0 0 0 0 0 0
Darling
Lower Darling 2 075 000 0 0 0 0 0 0 0 0 0 0 0 0 0
Lachlan 64 940 26 351 40.6 0 0 2584 2 1324 1 0 0 0 0 6233
Murrumbidgee 314 878 196 044 62.3 152 558 15.6 95 252 9.7 42 939 4.4 177 511 18.1 57 493 5.9 88 347
Central 240 425 98 137 40.8 0 0 276 465 56.3 39 170 8 293 052 59.7 80 511 16.4 79 094
Murray
Ovens 7195 0 0 0 0 0 0 0 0 0 0 0 0 0
Goulburn– 18 050 182 1 250 27.5 0 0 0 0 498 54.7 0 0 100
Broken
Campaspe 1700 0 0 0 0 0 0 0 0 0 0 0 0 0
Loddon 4280 0 0 0 0 0 0 0 0 0 0 0 0 0
Wimmera– 22 037 0 0 0 0 0 0 0 0 0 0 0 0 0
Avoca
Lower Murray 225 931 22 151 9.8 45 737 41.3 19 311 17.4 2603 2.4 45 950 41.5 12 664 11.4 13 040
Total that can 5 499 713 687 268 12.5 248 204 7.2 436 545 12.7 182 685 5.3 569 432 16.6 250 004 7.3 208 455
receive e-
flows
Marine and Freshwater Research
609610 Marine and Freshwater Research Y. Chen et al.
3 200 000
realised in the northern Basin: two of three respondents who
1 200 000 work there thought there were major biophysical, social and
1 000 000 institutional constraints to releasing environmental water out
Extent (ha)
800 000
of the channel (Fed. 2, Qld 1), including very limited delivery
of medium-to-high flows; apart from Macquarie Marshes and
600 000 Gwydir Wetlands, most environmental water is confined to in-
400 000 channel flows.
Half the respondents reported that pumping is the main
200 000
technique to deliver environmental water to targeted sites.
0 One respondent believed pumping can efficiently conserve
2014–15 2015–16 2016–17 2017–18 2018–19
wetlands as well as prevent the flooding of private properties
Water year
(Qld 1). Few respondents raised concerns about suboptimal
Estimated area flooded (depth 0.5 m)
watering events (Fed. 7) and potential water loss from evapo-
CEWO ‘measured and predicted area watered’
Total area of wetlands of which parts received some CEWO water as floods
ration (Vic. 1). Respondents held positive attitudes about the
Total area of wetlands in valleys that received some CEWO water as floods flooding of wetland vegetation, but they claimed that the Plan
is ‘at an early stage’ (even though it is due to be fully
Fig. 5. Total area flooded in the Murray–Darling Basin (based on area operational in 2024) and it is difficult to monitor responses
covered by an ecologically effective flood with a minimum depth of 0.5 m) of vegetation to watering. Respondents showed either no
by Commonwealth environmental water, delivered as overbank and wetland understanding or limited appreciation of the actual extent of
flows from 2014–15 to 2018–19, compared with the area watered, assessed environmental watering outcomes for wetland vegetation
by the Commonwealth Environmental Water Holder (CEWO) as ‘measured
across the Basin.
and predicted 1-year outcomes’, the area of wetlands that received at least
some CEWO water on part of them and the total area of major wetlands in
those river valleys that received some CEWO water as floods (data from Constraints on management
Tables S3 and S5; Gawne et al. (2016, 2017) and Hale et al. (2018, 2019, Eleven of 13 respondents identified constraints as significant
2020). issues impeding environmental watering. These were mainly
physical constraints, such as channel capacity and infrastruc-
during initial years (Fed. 3); and (5) irrigation water use is likely ture, and operational constraints of river regulation, competition
to remain over-allocated (Anon. 1). In particular, respondents with other water users in delivering environmental flows and
highlighted the limited control over water releases that water flooding of private property. Although water users may differ in
managers have in the northern Basin. Of the respondents who their seasonal requirements for water releases, government
thought the Plan was efficient and sufficient, one believed it was agencies have to make trade-offs, or find synergies, between
because it is an effective compromise between agriculture and releasing water for irrigation and the environment (Fed. 2).
environment (Fed. 1). Others mentioned positive environmental Concern was expressed that the season of environmental water
outcomes: delivery may not follow the natural life cycle for species to
achieve the optimal ecological benefits (Fed. 7, Vic. 1).
ythere’s been very good results, especially in some of the Half the respondents mentioned social constraints regarding
icon sites, especially Barmah-Millewa Forest, watering public acceptance of inundation of flood plains and the risk of
Moira grass and ecological outcomes there; Gunbower economic losses. Political constraints included difficulties in
Forest, Hattah Lakes, Lindsay, Mulcra, Wallpolla Wetlands, adapting current rules and achieving system-wide outcomes
and environmental water across the South Australian border across multiple jurisdictions.
that helps the Lower Lakes and the Coorong, and all the way
out to the sea [Fed. 6].
Meeting objectives and targets
Respondents agreed there was room for improvement, but did There was a divergence of views among the respondents
not specify what needed to be improved. about whether the objectives of the Plan can be met over the long
term. Those who thought so focused on the legal requirements
Evaluation of outcomes for them to do so, despite constraints:
In providing examples of successful outcomes, many
Watering strategy targets aren’t randomly selected, they
respondents mentioned in-channel benefits, including aquatic
were developed by the Murray–Darling Basin Authority as
vegetation, fish and in-stream functions. Fish featured strongly
a reflection of the amount of water and the constraints in the
(eight respondents), including golden perch spawning in the
system. So theoretically we should be able, over decades, to
Goulburn River (Fed. 4), Murray cod breeding in the Darling
deliver those outcomes, even though you’ve got constraints
and Murray (Fed. 3, Fed. 5) and the shepherding of the northern
in the system [Fed. 3].
fish flow (Fed. 2; Qld 1). Respondents also mentioned wetland
benefits to waterbirds and some specific cases of vegetation Several respondents claimed targets were unrealistic because
outcomes, including red gum forests at Barmah-Millewa, flow regimes are now very different from the past. Half the
Hattah and Chowilla (Fed. 3, Fed. 5). However, some respon- respondents raised concerns that targets in the Basin-wide
dents believed the extent of inundation is inadequate to support watering strategy are too ambitious, described as ‘naı̈ve’,
wetlands (Fed. 7, Fed. 2, Qld 1). Few floodplain benefits were ‘innocent’ and ‘a sign of inexperience’ and ‘perhaps [we] lostA trickle not a flood: environmental watering Marine and Freshwater Research 611
Table 2. Comparison between mean areas of wetland woody vegetation communities flooded annually with Commonwealth water between 2014–15
and 2018–19 and the areas of each vegetation community subject to expected outcomes under the Basin Plan for maintaining vegetation extent and
condition, as detailed in the Basin-wide Environmental Watering Strategy (EWS; Murray–Darling Basin Authority 2019a, appendix 2 therein)
Expected outcomes for lignum do not specify areas. Data on areas flooded and areas of each vegetation community from Brooks (2016, 2017, 2018, 2019,
appendices C and D therein, Brooks 2020, appendices 3 and 4 therein). NA, vegetation community not subject to objectives; Yes, subject to expected outcomes
but area unspecified (however, estimates of areas of lignum are specified in various reports; cf. below)
River red gum forest and Black box woodland Coolibah woodland Lignum shrubland
woodland
EWS expected Mean annual EWS Expec- Mean annual EWS Expec- Mean annual EWS Expec- Mean annual
area (ha) area (ha) ted area (ha) area (ha) ted area (ha) area (ha) ted area (ha) area (ha)
Paroo 2300 0 38 300 0 22 800 0 NA 0
Warrego 7300 0 80 400 0 121 400 0 NA 0
Condamine–Balonne 11 700 0 64 900 0 78 300 0 Yes 2339
(including Nebine)
Border Rivers (including 12 900 9 6300 0 43 100 0 Yes 0
Moonie)
Gwydir 4500 223 600 1 6500 1031 Yes 11
Namoi 6100 0 800 0 4200 0 NA 0
Macquarie–Castlereagh 58 200 6956 57 100 146 32 200 265 Yes 35
Barwon–Darling 7800 0 11 700 0 14 900 0 NA 0
Lower Darling 10 300 8 38 600 1 600 0 Yes 0
Lachlan 41 300 2439 58 000 608 NA 0 Yes 1252
Murrumbidgee 68 300 13 539 38 900 881 NA 0 Yes 727
Murray (including Eastern 90 700 19 355 41 800 1016 NA 0 Yes 562
Mt Lofty Ranges)
Ovens 10 200 0 ,100 0 NA 0 NA 0
Goulburn–Broken 19 800 0 500 0 NA 0 NA 0
Campaspe 1900 0 ,100 0 NA 0 NA 0
Loddon 2200 0 700 0 NA 0 NA 0
Wimmera–Avoca 6500 0 3100 29 NA 0 NA 0
Total 362 000 42 528 441 700 2682 324 000 1296 215 143A 5771
A
Based on mean of the following estimates for Murray–Darling Basin: 254 551 ha (Prosser et al. 2012, p. 38); 193 842 ha (Brooks 2020, pp. 13, 14); 197 037 ha,
based on sum for the following river valleys: Condamine Balonne: Narran Lakes 8970 ha (estimated from Fig. 33 of Butcher et al. 2011); Lower Balonne
Floodplain 45 234 ha (Sims 2004, p. 96). Border Rivers: Queensland Border Rivers, including Moonie 100 ha (Queensland Government Department of
Environment and Science 2019, p. 31). Gwydir: Lower Gwydir and Gingham Channel 3207 ha; Mallowa Creek 1642 ha (Bowen and Simpson 2009, pp. 7, 8).
Macquarie–Castlereagh: Macquarie Marshes 364 ha (2008; 3178 ha in 1991; Bowen and Simpson 2010, p. 18). Lower Darling: Wilcannia to Menindee
36 977 ha (estimated from fig. 8 of NSW Department of Planning, Industry and Environment 2019). Lachlan: Lachlan Swamp 9220 ha (Murray–Darling Basin
Authority 2012c). Murrumbidgee: Yanga National Park 23 282 ha (Wen et al. 2011). Murray: 68 041 ha (Prosser et al. 2012, p. 39).
14.0
Percentage of total area flooded
sight of what was possible’ (Fed. 7). They also worried about
12.0 suboptimal events, because many wetlands were not flooded for
10.0
long enough (Fed. 5), and that targets were set with a limited
understanding of the practicalities of real-world water
8.0 management.
6.0 Evaluation of objectives and targets involves defining areas
that can be watered, but the amount of water required to protect
4.0 wetlands cannot be estimated accurately (Qld 1, Fed. 7). It is
2.0 arguable whether environmental benefits can be achieved sim-
ply by watering more areas to achieve targets for particular
0 ecological components. For example:
2014–15 2015–16 2016–17 2017–18 2018–19
Water year There are some frogs in this wetland or there’s some water
River red gum forest River red gum woodland Black box woodland birds here, but the system, in my view, the basin-wide system
Coolibah woodland Lignum shrubland or the valley-wide ecosystems, their resilience is declining
[Fed. 7].
Fig. 6. Area flooded of each wetland woody vegetation community that
received Commonwealth environmental water from 2014–15 to 2018–19, Respondents were unsure whether targets could be met under
expressed as a proportion of the total area of each community in those river climate change (Fed. 5, Qld 1). Targets can be met during a wet
valleys that received overbank and wetland flows. Data from Brooks (2016, period but, as dry periods become more frequent, only some
2017, 2018, 2019, 2020). wetlands can be maintained.612 Marine and Freshwater Research Y. Chen et al.
Table 3. Assessment of flood events with Commonwealth water intended to achieve vegetation objectives, according to seasonal occurrence and
whether events are likely to meet the ecological requirements for wetland woody vegetation communities
Numbers are indicative; determination of suboptimal conditions would require empirical validation of change in vegetation condition
Number of potential Percentage of potential Number of events Number of events .3 Total number of
sub-optimal flood events sub-optimal flood events seasons flood events
Too short Too long Spring– Autumn– assessed
(,2 months) (.7 months) summer winter
2014–15 10 6 47 23 5 6 34
2015–16 27 7 54 47 10 6 63
2016–17 12 3 50 17 11 2 30
2017–18 21 2 51 24 18 3 45
2018–19 27 5 46 51 16 3 70
Total 97 23 50 162 60 20 242
Discussion effectively stalled since 2013–14 (Wentworth Group 2017;
Our review of Commonwealth environmental water delivery Grafton et al. 2020, fig. 4 therein). The Wentworth Group
found: (1) only 20% of water releases provided flood events to (2020) found that despite an estimated 2100 GL of water having
floodplain wetlands and 80% of water was delivered as in- been recovered for the environment, between 2012–13 and
channel flows; (2) an estimated 12% of the wetland area subject 2018–19 observed river flows in the Basin were markedly lower
to EWS expected outcomes received enough environmental than expected, even after accounting for dry conditions. This
water to constitute an ecologically effective flood, 1% of the finding indicates there has been no improvement, or even
area of all major wetlands in the Basin; (3) over 80% of Com- declines, in flows since the Plan was implemented. Environ-
monwealth environmental water was delivered to just three river mental flow targets set by the MDBA have not been achieved.
valleys in the southern Basin, which accords with the large water The standard response from government agencies to such
holdings in these valleys (Commonwealth Environmental Water findings is that the Plan is not due to be implemented in full
Office 2020c); (4) the extent of flooding of wetland woody until 2024 and it would be entirely expected that the objectives
vegetation communities is likely to be inadequate to meet their would not yet be fully achieved. This position beggars the
ecological requirements for the maintenance of extent and question of how the substantial shortfall in environmental water
condition in most cases; and (5) almost 300 GL was delivered delivery, well below the statutory baseline of 2750 GL year 1,
during the hottest half of the year, when evaporative loss is will be achieved in the remaining one-third of the implementa-
highest, thus effectively shortening the duration of flood events. tion period when there has been no increase in the previous two-
thirds. It also ignores the setting of flow targets as indicators of
Environmental water releases progress towards outcomes by the MDBA.
Losses of surface water from evaporation, transpiration and
The Plan is two-thirds through its first implementation period, seepage to groundwater during the conveyance of flows from
with over A$8.5 billion in public expenditure (Productivity headwater dams to sites of end use appear to have increased
Commission 2018, p. 4), but there is still no official report of (Murray–Darling Basin Authority 2019c, fig. 7 therein),
whether the 2750 GL of additional environmental water com- accounting for 620 GL in conveyance loss for the River Murray
mitted to by the Australian Parliament in 2012 has resulted in in 2018–19 (1 June 2018–31 January 2019), the second hottest
increased environmental flows in the Basin. Accordingly, there year on record after 2019–20. Conveyance losses were
is no objective measure of whether water reform has been suc- accounted for in the Plan as part of river operations and are
cessful. Meeting the environmental objectives of the Plan with not attributed to environmental water holder accounts. How-
the limited volume of water available is a complex and difficult ever, losses will continue to increase under a drying climate,
task. Accordingly, public reporting of the outcomes in ways that reducing the proportion of environmental flows that reaches
are comprehensive, clear and understandable is a major logis- wetlands and requiring a greater volume of water recovery to
tical and communications challenge. In this regard, we meet the environmental objectives of the Plan.
acknowledge the new CEWO website (https://flow-mer.org.au/,
accessed 17 October 2020), which explains the monitoring, Environmental water for floodplain wetlands
evaluation and research of water use for the environment. Environmental flows were never intended to support the total
We found no change in the volume of environmental water area of wetlands in the Basin. Indeed, the Plan states:
released between 2012–13 and 2018–19, by either the Com-
The fact that water storages and properties (including
monwealth or the states. This finding appears to reflect the slow
floodplains) are under the control of various persons currently
progress in accumulation of Commonwealth water holdings
restricts the capacity to actively manage all water-dependent
during this period. CEWO net total annual releases are well
ecosystems [Commonwealth of Australia 2012, p. 56].
below the long-term average annual yield of Commonwealth
entitlements, which showed only a small increase during the first However, we found the volume of environmental water used to
7 years of the Plan. Water recovery by the Commonwealth has flood wetlands was unlikely to meet the requirements forYou can also read