MEDLOW BATH - SOCIO-ECONOMIC IMPACT ASSESSMENT
←
→
Page content transcription
If your browser does not render page correctly, please read the page content below
MEDLOW BATH - SOCIO-ECONOMIC IMPACT
ASSESSMENT

                                        AU212001198
                                                 Final
                                          7 July 2021

                                      rpsgroup.com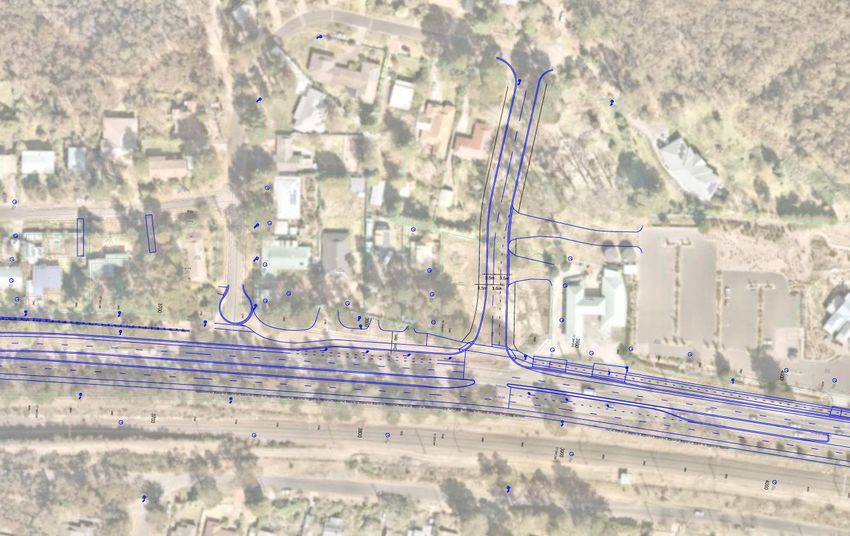
REPORT

Document status

Version      Purpose of document               Authored by                 Reviewed by        Approved by      Review date

             Draft SEIA for review and
0.1                                            Anthony Keramianakis        Brent Winter       Brent Winter     7 April 2021
             comment
             Draft SEIA for review and
0.2                                            Anthony Keramianakis        Kapil Kulkarni     Kapil Kulkarni   25 May 2021
             comment

1.0          Final                             Anthony Keramianakis        Kapil Kulkarni     Kapil Kulkarni   7 July 2021

Approval for issue

This report was prepared by RPS within the terms of RPS’ engagement with its client and in direct response to a scope
of services. This report is supplied for the sole and specific purpose for use by RPS’ client. The report does not account
for any changes relating the subject matter of the report, or any legislative or regulatory changes that have occurred
since the report was produced and that may affect the report. RPS does not accept any responsibility or liability for loss
whatsoever to any third party caused by, related to or arising out of any use or reliance on the report.

 Prepared by:                                                          Prepared for:

 RPS                                                                   Transport for NSW

 Brent Winter                                                          Pete Styles
 Associate Director                                                    Project Development Manager

 Level 13, 255 Pitt Street                                             71-79 Pyrmont Bridge Road
 Sydney NSW 2000                                                       Pyrmont NSW 2009

 T     +61 2 8099 3200                                                 T    +61 409 449 258
 E     brent.winter@rpsgroup.com.au                                    E    pete.styles@transport.nsw.gov.au

AU212001198 | Medlow Bath - Socio-Economic Impact Assessment | Final | 7 July 2021
rpsgroup.com                                                                                                           Page i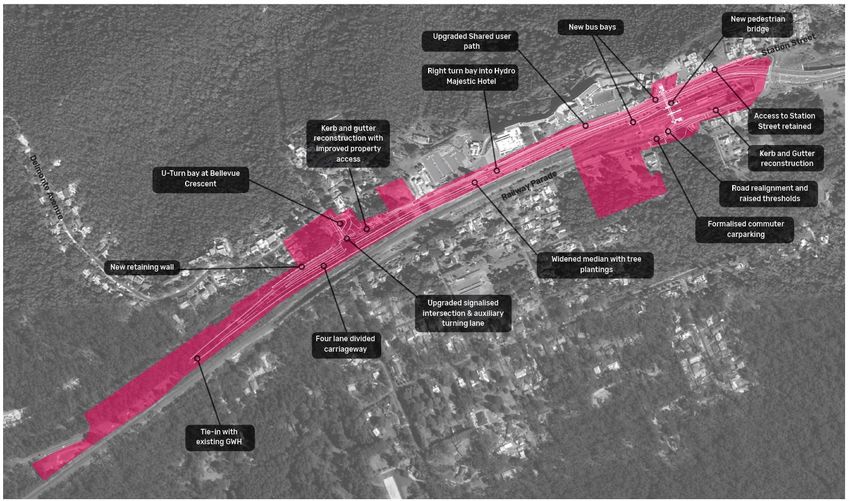
REPORT

Contents
EXECUTIVE SUMMARY ....................................................................................................................................1
1       INTRODUCTION ......................................................................................................................................3
        1.1 Background ....................................................................................................................................3
        1.2 Description of the Proposal ............................................................................................................3
             1.2.1 Alternative Design for Bellevue Crescent .........................................................................5
        1.3 Purpose of this Document ..............................................................................................................6
2       METHODOLOGY .....................................................................................................................................7
        2.1 Study Methodology ........................................................................................................................7
        2.2 Study Area and Proposal Corridor .................................................................................................7
        2.3 Data Sources .................................................................................................................................9
        2.4 Consultation ...................................................................................................................................9
3       STRATEGIC CONTEXT ........................................................................................................................10
        3.1 Western City District Plan ............................................................................................................10
        3.2 Greater Sydney Services and Infrastructure Plan .......................................................................10
        3.3 Blue Mountains Community Strategic Plan 2035 ........................................................................11
4       SOCIO-ECONOMIC CONTEXT.............................................................................................................12
        4.1 Regional Overview .......................................................................................................................12
        4.2 Community Profile ........................................................................................................................12
        4.3 Economic Profile ..........................................................................................................................14
            4.3.1 Local Business and Industry ...........................................................................................16
            4.3.2 Tourism ...........................................................................................................................17
        4.4 Site Context ..................................................................................................................................17
            4.4.1 Roadways .......................................................................................................................17
            4.4.2 Public Transport ..............................................................................................................20
            4.4.3 Active Transport ..............................................................................................................20
            4.4.4 Geology, hydrology, and contamination .........................................................................21
        4.5 Social Infrastructure and Community Facilities ............................................................................23
            4.5.1 Shops and Services in the Study Area ...........................................................................23
            4.5.2 Social Infrastructure within in the Project Corridor .........................................................24
            4.5.3 Shops and Services Near the Proposal ..........................................................................24
        4.6 Community Values .......................................................................................................................25
            4.6.1 Landscape, Amenity, and Biodiversity ............................................................................25
            4.6.2 Aboriginal and Natural Heritage......................................................................................29
            4.6.3 Non-Aboriginal Heritage .................................................................................................30
5       IMPACT ASSESSMENT ........................................................................................................................32
        5.1 Access and Connectivity Impacts ................................................................................................32
            5.1.1 Construction Impacts ......................................................................................................32
            5.1.2 Operational Impacts ........................................................................................................32
        5.2 Social Infrastructure Impacts........................................................................................................35
        5.3 Community Values and Amenity Impacts ....................................................................................36
            5.3.1 Construction Impacts ......................................................................................................36
            5.3.2 Operational Impacts ........................................................................................................37
        5.4 Business Impacts .........................................................................................................................38
        5.5 Property Impacts ..........................................................................................................................38
            5.5.1 Construction Impacts ......................................................................................................38
            5.5.2 Operational Impacts ........................................................................................................41
6       MANAGEMENT AND MITIGATION STRATEGIES ..............................................................................44
        6.1 Access and Connectivity Mitigations ............................................................................................44
        6.2 Social Infrastructure Mitigations ...................................................................................................44

AU212001198 | Medlow Bath - Socio-Economic Impact Assessment | Final | 7 July 2021
rpsgroup.com                                                                                                                                        Page ii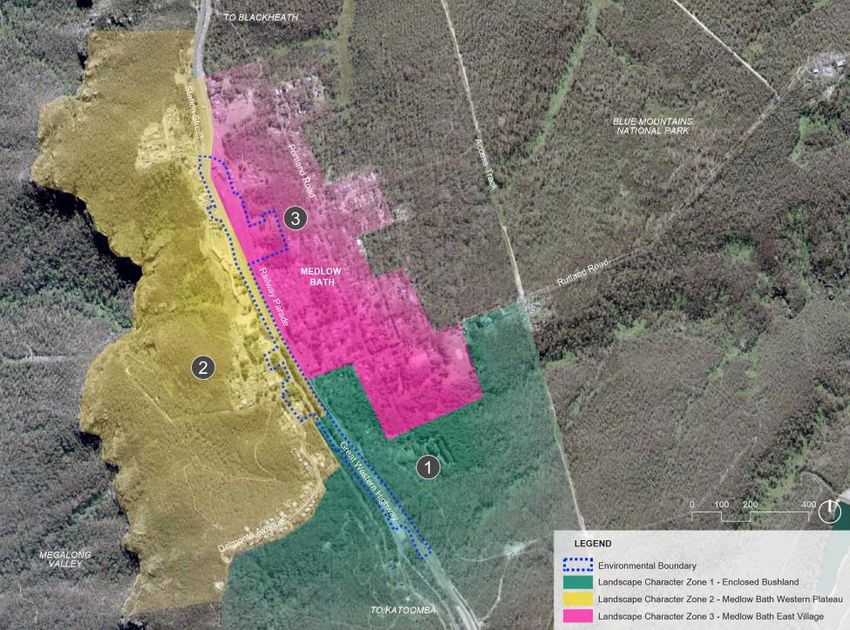
REPORT

         6.3      Landscape, Amenity, and Biodiversity Mitigations .......................................................................45
         6.4      Property Mitigations .....................................................................................................................45
7        CONCLUSIONS .....................................................................................................................................48
         7.1 Key Impact Summary ...................................................................................................................48
         7.2 Negative Impact and Mitigation Assessment Summary ..............................................................49

Tables
Table 1: Summary Population, by Sex .............................................................................................................12
Table 2: Summary Population, by Age .............................................................................................................13
Table 3: Summary Population, by Education Attainment .................................................................................13
Table 4: Summary Selected Cultural Attributes ...............................................................................................13
Table 5: Summary Selected Dwelling Attributes ..............................................................................................14
Table 6: Summary Selected Household Composition Attributes .....................................................................14
Table 7: Summary Work Force Attributes ........................................................................................................15
Table 8: Summary Labour Force, Top 5 Key Industries...................................................................................15
Table 9: Summary Labour Force, Top 5 Key Occupations ..............................................................................15
Table 10: Summary Selected Income Attributes ..............................................................................................15
Table 11: Summary Selected Travel Attributes ................................................................................................16
Table 12: Tourism Summary, International and Domestic Visitors ..................................................................17
Table 13: Existing 2020 Intersection Performance...........................................................................................18
Table 14: Train Frequencies at Medlow Bath Station ......................................................................................20
Table 15: Businesses in the Study Area...........................................................................................................23
Table 16: Social Infrastructure, Nature and Recreation Facilities ....................................................................24
Table 17: Public Services .................................................................................................................................24
Table 18: Summary Key Shops and Services Near the Proposal ....................................................................25
Table 19: Comparison of Intersection Performance (Without and With Proposal) ..........................................32
Table 20: Modelled Intersection Performance (Weekday), 2036 Baseline Scenario (without Proposal) .........33
Table 21: Modelled Intersection Performance (Weekday), 2036 Project Scenario (with Proposal) ................33
Table 22: Modelled Intersection Performance (Weekend), 2036 Project Scenario (with Proposal) ................34
Table 23: Heritage structures potentially affected by vibration ........................................................................36
Table 24: Property Acquisition Summary .........................................................................................................39
Table 25: Standard work hours construction noise impacts .............................................................................40
Table 26: Ambient noise measurement results ................................................................................................41
Table 27: Road traffic noise measurement results ...........................................................................................41
Table 28: Noise levels for receivers exceeding the NSW Road Noise Policy (RNP) and Noise Criteria
             Guideline (NCG) – Modelled for year 2036..................................................................................42
Table 29: Properties nominated for architectural treatment .............................................................................42
Table 30: Summary Main Proposal Impacts, No Mitigation .............................................................................49
Table 31: Summary of Proposal Impacts, Incorporating Mitigation Measures .................................................49

Figures
Figure 1: Key Features of the Proposal ..............................................................................................................4
Figure 2: Proposed alternative intersection at Bellevue Crescent .....................................................................5
Figure 3: Alternative design for Bellevue Crescent ............................................................................................6
Figure 4: Study Area and Proposal Corridor Extent ...........................................................................................8
Figure 5: Study Area Regional Context ..............................................................................................................8
Figure 6: Summary of Employment, by Industry Sector ...................................................................................16
Figure 7: GWH and Bellevue Crescent (Left) – GWH and Station Street (Right) ............................................18
Figure 8: Estimated Daily Traffic Volume on the GWH (Without Proposal) .....................................................19

AU212001198 | Medlow Bath - Socio-Economic Impact Assessment | Final | 7 July 2021
rpsgroup.com                                                                                                                                         Page iii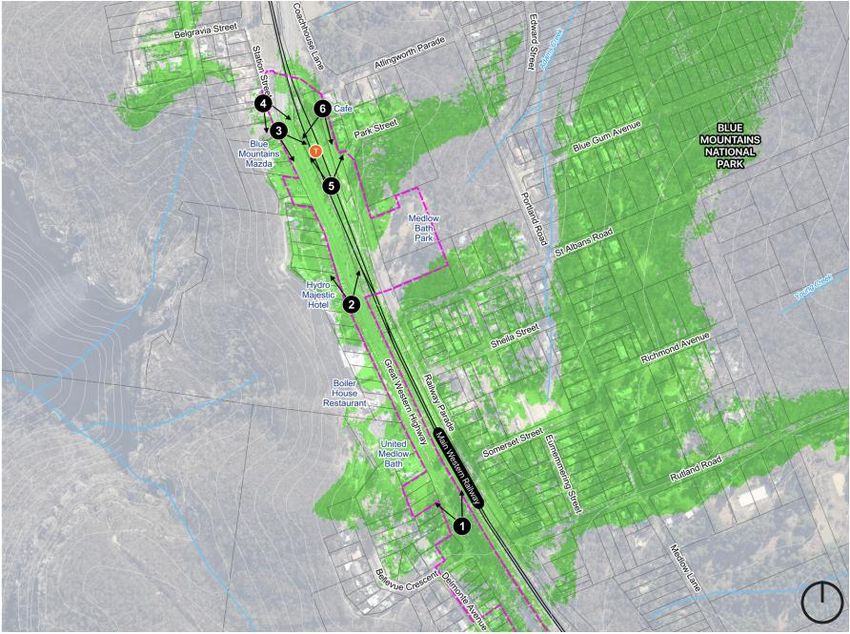
REPORT

Figure 9: Cycle Routes (Left) – STRAVA Heatmap of Pedestrian Activity (Right) ...........................................21
Figure 10: Site inspection areas of potential contamination risks ....................................................................23
Figure 11: Proposal Corridor Landscape Overview .........................................................................................26
Figure 12: Enclosed Bushland Landscape and Amenity ..................................................................................26
Figure 13: Medlow Bath Plateau Landscapes and Amenity .............................................................................27
Figure 14: Medlow Bath East Village................................................................................................................28
Figure 15: Visual Impact Assessment viewpoint locations ...............................................................................29

Appendices
Appendix A: References

AU212001198 | Medlow Bath - Socio-Economic Impact Assessment | Final | 7 July 2021
rpsgroup.com                                                                                                                                 Page iv
REPORT

EXECUTIVE SUMMARY
Transport for NSW (TfNSW) proposes to upgrade approximately 1.2km of Medlow Bath between Railway
Parade and approximately 330 metres south of Bellevue Crescent West (“the proposal”). The proposal will
provide a safer and more efficient link between Central West NSW and the Sydney Motorway Network for
freight, tourist, and general traffic and improve active transport links and public transport accessibility.
This socio-economic impact assessment report was prepared to support a Review of Environmental Factors
(REF) of the proposal. It provides an overview of the broad objectives for the management of socio-
economic impacts and mitigation measures for those impacts. The objectives of the proposal for managing
potential socio-economic impacts during construction and operation are:
•     Avoid or minimise impacts on amenity, health and well-being, and access and connectivity for local and
      regional communities
•     Avoid or minimise impacts on social infrastructure, local businesses, and industry
•     Ensure local communities, including residents, business owners and managers of community facilities
      are informed about the Proposal’s construction and operation.
The following positive socio-economic impacts are anticipated because of the proposed road upgrade within
the study area:
•     Improved accessibility to the area, resulting in time and operational cost savings for business and
      individuals
•     Addition of pedestrian connections to the station from residential and recreational land
•     Removal of the pedestrian crossing at the railway line and the addition of an overhead pedestrian bridge
      which will improve safety and amenity in the area
•     New indented bus bays on both sides of the highway as well as shared pedestrian/cyclist paths
      adjacent to the westbound carriageway corridor
•     Tree and vegetation planting along the road and on the median, which will enhance the overall amenity
      of the area
•     Overall, the proposal will improve road, pedestrian and cycling infrastructure which will result in safety,
      access, and amenity benefits for the Medlow Baths area.
Additionally, the following negative socio-economic impacts are anticipated in the study area:
•     Three full property acquisitions and two partial property acquisitions will be undertaken for the location
      of new infrastructure
•     A temporary increase in noise for some receivers:
      ‒     Architectural treatment will be implemented when required to minimise any potential negative noise
            impacts.
•     Construction activities may temporarily reduce available parking and impact active transport connectivity
      impacting residents and businesses
      ‒     Specifically, this could impact operations of the Hydro Majestic Hotel, which directly abuts the
            Great Western Highway (GWH)
      ‒     These impacts can be minimised through consultation with the hotel and implementation of the
            traffic management plan
•     Removal of established trees within construction areas will impact on visual amenity and rural nature of
      the local landscape:
      ‒     Tree planting and roadside median planting will offset the removal of vegetation during construction

AU212001198 | Medlow Bath - Socio-Economic Impact Assessment | Final | 7 July 2021
rpsgroup.com                                                                                                   Page 1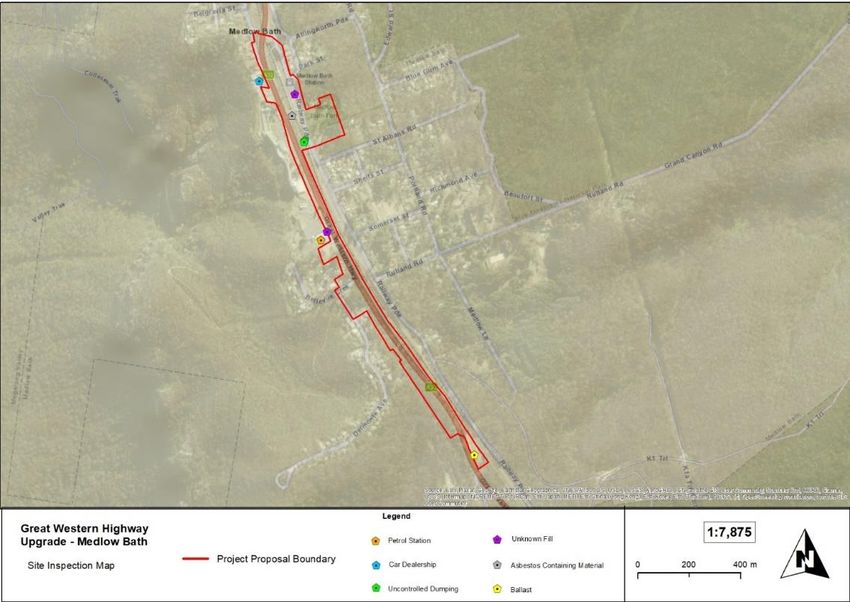
REPORT

      ‒     Most of the above impacts will be temporary and given the rural nature of the works, the impact to
            community values and amenity will be minimal.

•     An alternative design for Bellevue Crescent is being considered. The impacts of this alternative design
      would include noise and vibration, property acquisition (two full acquisitions and one partial acquisition)
      and slightly greater traffic movements for some residents than the preferred design. Overall, the impacts
      of the alternative design are similar to the impacts for the current preferred design for Bellevue
      Crescent.

AU212001198 | Medlow Bath - Socio-Economic Impact Assessment | Final | 7 July 2021
rpsgroup.com                                                                                               Page 2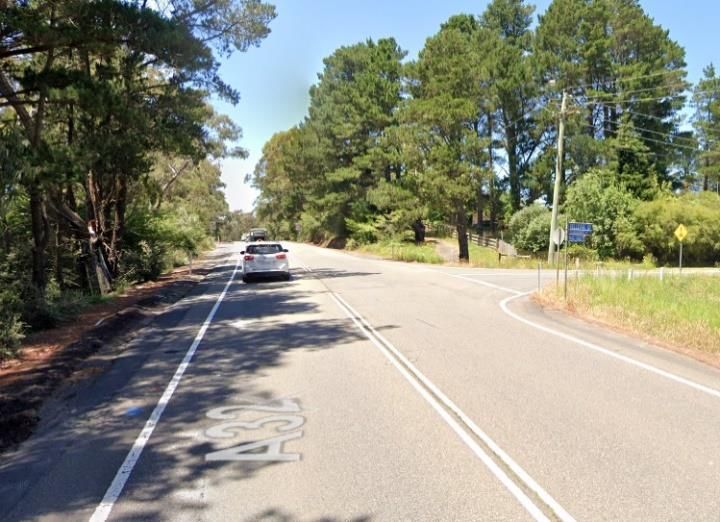
REPORT

1            INTRODUCTION
1.1          Background
The Great Western Highway (GWH) is a 201-kilometre highway crossing of the Great Dividing Range
through the World Heritage listed Blue Mountains. It connects Bathurst and the surrounding Central West
and Orana regions to Sydney.
The GWH crosses the Great Dividing Range and follows a narrow and difficult alignment, which is
constrained by the Blue Mountains National Park, steep topography, a critical rail line that runs parallel to the
highway, and proximity to existing towns for which that highway acts as a sort of main street.
The GWH crosses landscapes that have rich natural, cultural, scenic, and historical value. Urban
developments along the Highway are located along the ridgeline above the highway, are discrete in nature,
and separated by natural bushland.
Within Medlow Bath Village, the GWH acts as a major thoroughfare with several established existing
businesses situated along the route, including, Blue Mountains Mazda dealership, the Hydro Majestic Hotel,
the Boiler House Restaurant, and a United Petrol Station.
Within the Medlow Bath Village and to the east of the railway line, there is one public open space facility at
Medlow Bath Park, adjacent to the Rural Fire Brigade station which provides public amenity in the form of a
playground, picnic tables and landscaped gardens. Additionally, there are several popular bushwalking
tracks that provide valuable recreational facilities for locals and tourists, as well as regional and local cycle
routes that link to the Blue Mountains Trail and Mountain Bike Trails to Point Pilcher.
The highway’s topography and constrained two lane carriageway design (which in places is almost
200 years old) results in the following constraints:
     •    Reduces freight efficiency by limiting access for safer and more sustainable high productivity
          vehicles
     •    Limits access during incidents and natural disasters
     •    Slows travel speeds with limited overtaking opportunities and steep gradients (more than double the
          recommended maximum level)
     •    Causes delays of up to 80 minutes in peak times
     •    Has higher than state average crash rates
     •    Impairs amenity for local communities with high through traffic volumes and congestion.
The proposal will help to alleviate several of these issues including:
     •    Improve ability to drive regional economic development and freight productivity
     •    Provide a dependable and adaptable transport network that enables continuity of transport and
          essential services
     •    Provide suitable capacity to reduce congestion during peak periods through Medlow Bath
     •    Reduce actual and perceived safety risks
     •    Maintain and enhance local amenity and character and protect environmental and cultural assets.

1.2          Description of the Proposal
Transport for NSW (TfNSW) proposes to upgrade approximately 1.2 kilometres of the Great Western
Highway at Medlow Bath between Railway Parade and approximately 330 metres south of Bellevue
Crescent (“the proposal”). This upgrade is part of the GWH Duplication project between Katoomba and
Lithgow which to provide a safer and more efficient link between Central West NSW and the Sydney
Motorway Network for freight, tourist, and general traffic. In additional the road modifications, the proposal
will also improve active transport links and public transport accessibility.

AU212001198 | Medlow Bath - Socio-Economic Impact Assessment | Final | 7 July 2021
rpsgroup.com                                                                                                Page 3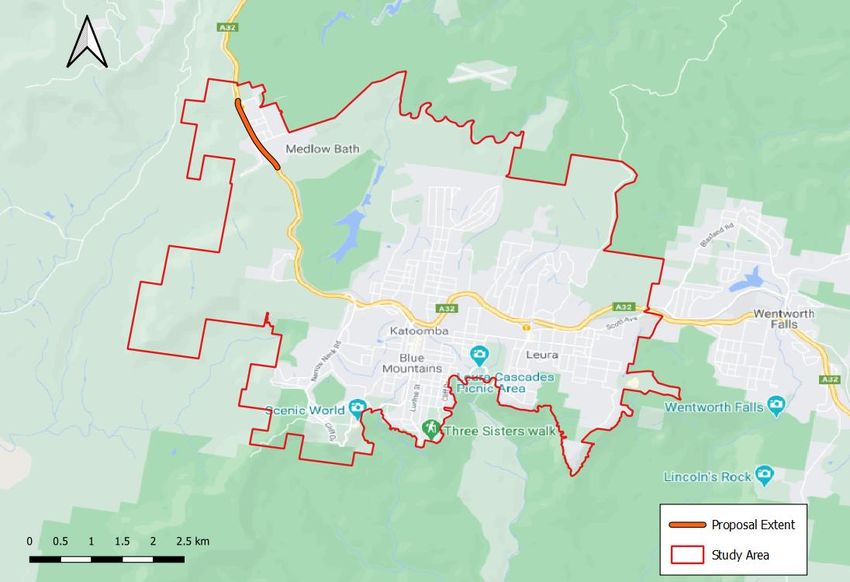
REPORT

Key features of the proposal would include:
     •    Upgrade of the existing highway to a four-lane divided carriageway allowing for two lanes of traffic in
          each direction, either side of a central median with planted trees
     •    Upgrade of the Bellevue Crescent intersection with new turning lanes, U-turn bay and traffic signals
     •    A new right turn lane providing access to the Hydro Majestic Hotel
     •    Improvements on Railway Parade to formalise parking provisions, U-turns and rail customer parking
     •    New indented bus bays on both sides of the highway close to Medlow Bath Station
     •    Construction of a new pedestrian bridge, stairs and lifts to provide an accessible path of travel
          between the bus bays, the Medlow Bath Station platforms and Railway Parade
     •    New shared path for pedestrians and cyclists on the western side of the highway
     •    Ancillary works such as the replacement of road surfaces, reconstruction works associated with local
          roads, driveways, footpaths, kerbs, gutters and retaining walls, drainage works and relocation of
          services.
Figure 1 provides an overview of the study area and key features of the proposal.

Figure 1: Key Features of the Proposal
Source: Spackman Mossop Michaels, 2021

AU212001198 | Medlow Bath - Socio-Economic Impact Assessment | Final | 7 July 2021
rpsgroup.com                                                                                                  Page 4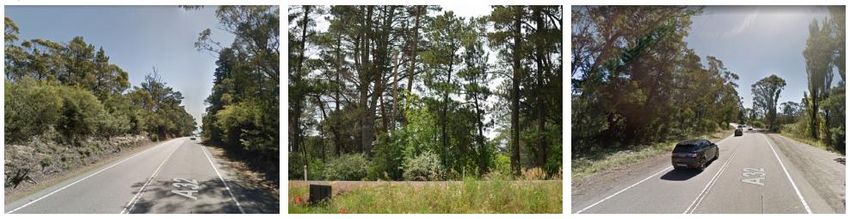
REPORT

1.2.1        Alternative Design for Bellevue Crescent
As part of the design for the proposal, a new alternative signalised intersection is being considered to the
Great Western Highway with a new road through vacant Lots to connect to the existing Bellevue Crescent
and approximately 25 metres south of the United Petrol Station (refer to Figure 2).

Figure 2: Proposed alternative intersection at Bellevue Crescent

Key features of this design are as follows:
     •    A signalised intersection will be built along the southern perimeter of the United Petrol Station in
          Medlow Bath utilising a corridor (anticipated to be 20 metres) through vacant Lots
     •    Closing the existing Bellevue Crescent and Great Western Highway intersection (indicated by the
          red line marking in Figure 3 below) but still maintaining a service road/shared zone for the properties
          fronting the highway
     •    Creating new access options from Bellevue Crescent to the petrol station and Hydro Majestic
          Pavilion
     •    Allows left and right turns out of Bellevue Crescent on to the Great Western Highway (enabling west
          and east bound movement) and left turn into new Bellevue Crescent from Great Western Highway
          westbound.

AU212001198 | Medlow Bath - Socio-Economic Impact Assessment | Final | 7 July 2021
rpsgroup.com                                                                                                 Page 5
REPORT
Figure 3: Alternative design for Bellevue Crescent
1.3 Purpose of this Document
This report has been prepared to support the Review of Environmental Factors (REF) for the proposal. It
provides an assessment of potential socio-economic benefits and impacts of the proposal, including:
• An outline of the existing socio-economic characteristics, values, and conditions of local and regional
communities near the proposal
• An assessment of potential impacts on local and regional communities from the construction and
operation of the proposal
• Measures for managing or mitigating identified socio-economic impacts.
AU212001198 | Medlow Bath - Socio-Economic Impact Assessment | Final | 7 July 2021
rpsgroup.com Page 6REPORT
2 METHODOLOGY
2.1 Study Methodology
This assessment of socio-economic impacts was completed with reference to the SEIA Practice Note
Guidelines (January 2020) and Assessing significance: socio-economic impacts (RMS January 2019). The
proposal was assessed as requiring a ‘Moderate’ level of assessment.
Key steps in this assessment included:
• Determining the study area based on the likely geographical extent of the impacts during both
construction and operation
• Reviewing the existing conditions including demographics, socio-economic status, income,
employment, land use, business activity and social infrastructure using publicly available sources
such as data from the Australian Bureau of Statistics (ABS), and relevant planning and policy
documents
• Assessing the likely social and economic impacts during construction, which may include but not be
limited to, property acquisition, amenity impacts and disruption to trade
• Assessing the level of significance of potential impacts by considering the sensitivity of receptors and
the magnitude of the proposed work
• Consideration of cumulative social or economic impacts by considering other existing or planned
proposals likely to interact with the proposal. For example, cumulative impacts related to nearby
projects/proposals such as the Richmond Road Upgrade, Bandon Road Upgrade, etc.
• Identifying recommended mitigation measures to manage the extent of impacts.
An evaluation matrix was used to evaluate the significance of potential socio-economic impacts associated
with the construction and operation of the proposal. This is based on the framework outlined in the SEIA
Practice Note Guidelines (January 2020). The significance of identified impacts was determined with
consideration of:
• The sensitivity of receptors, that is, environmental characteristics, communities, businesses,
business clusters, social infrastructure, residences, and
• Magnitude of the proposed works.
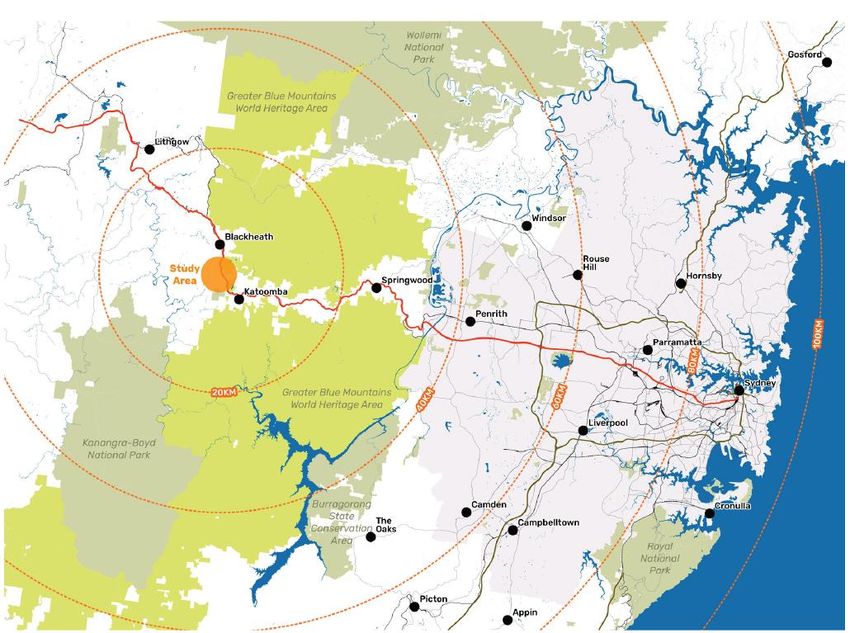
2.2 Study Area and Proposal Corridor
The study area for the assessment is shown in Figure 4. It comprises the Katoomba – Leura Statistical Area
Level 2 (SA2 #124011452, 2016). The study area was chosen because it comprises areas that are most
likely to be directly impacted during both construction and operation of the proposal.
AU212001198 | Medlow Bath - Socio-Economic Impact Assessment | Final | 7 July 2021
rpsgroup.com Page 7REPORT Figure 4: Study Area and Proposal Corridor Extent Source: Google Maps, 2021 Figure 5: Study Area Regional Context Source: Spackman Mossop Michaels, 2020 AU212001198 | Medlow Bath - Socio-Economic Impact Assessment | Final | 7 July 2021 rpsgroup.com Page 8
REPORT

2.3          Data Sources
Socio-economic data presented in this assessment principally draws on information from the ABS Census of
Population and Housing 2016. Data is presented for both the primary and secondary study area. This is
supplemented with data and information from:
     •    Australian Bureau of Statistics (ABS)
     •    NSW Department of Planning, Industry and Environment (DPIE)
     •    Blue Mountains City Council (BMCC) publications, reports, guidelines, and websites
     •    Specialist reports commissioned in support of the proposal and associated Review of Environmental
          Factors (REF), and
     •    Other public websites and reports.

2.4          Consultation
TfNSW has encouraged community feedback to the proposal through a combination of notifications and
consultations with government stakeholders including the NSW Department of Planning Industry and
Environment, NSW Environment Protection Authority, utilities such as major telecommunications, power and
water utilities in the area, residents and businesses impacted by the proposal, business chambers and
groups, active transport users, road users, community, sporting, action and environmental groups. Further
information on consultation undertaken for the proposal is outlined in Chapter 5 of the REF.

AU212001198 | Medlow Bath - Socio-Economic Impact Assessment | Final | 7 July 2021
rpsgroup.com                                                                                          Page 9
REPORT
3 STRATEGIC CONTEXT
3.1 Western City District Plan
The proposal is in the Blue Mountains LGA, which is in the Western City District. The Western City District
covers several additional LGAs including Camden, Campbelltown, Fairfield, Hawkesbury, Liverpool, Penrith,
and Wollondilly.
The Western City District Plan (the Plan) is the long-term vision for a large central portion of Greater Sydney.
The vision is to transform the Western City District into an area that has quicker and easier access to a wider
range of jobs, housing types, and activities.
The Western City District is anticipated to grow substantially, capitalising on its location close to the
geographic centre of Greater Sydney. Public and private investment is contributing to new transport and
other infrastructure projects that will support major transformations.
The Plan informs planning statements, local environmental plans, the assessment of planning proposals,
and community strategic plans and policies. It also emphasises the alignment of local environmental plans,
transport programs, and other agency programs.
This Plan responds to major transport, health and education investments either committed or planned across
the Western District, including the Western Sydney Airport and aligns with Future Transport 2056. The
Western Sydney Deal will drive innovative planning for future infrastructure needs.
For the Western City District, this means the following Planning Priorities:
• W1. Planning for a city supported by infrastructure
• W2. Working through collaboration.
The proposal will support the growth of the study area by providing an east-west linkage between western
Sydney, the Blue Mountains, and regional centres like Bathurst, Orange and Mudgee, thereby
accommodating future growth and facilitating the flow of people and commerce.
3.2 Greater Sydney Services and Infrastructure Plan
Greater Sydney Services and Infrastructure Plan (GSSIP) is the NSW Government’s 40-year plan for
transport in Sydney. It builds on the state-wide transport outcomes identified in the Future Transport Strategy
2056 and establishes specific outcomes that transport customers can expect. It also identifies the policy,
service, and infrastructure initiatives that will help achieve higher capacity public transport and improved road
links.
Among the many initiatives outlined in the GSSIP, Connecting Greater Sydney and the Blue Mountains is
cited as a specific area of focus. The GWH, in conjunction with the Main Western Rail Line, are two key
infrastructure assets that connect the Western Parkland City and Western Sydney Airport to the Central
West and Orana Region. This corridor also provides freight connections to Port Botany, Port Kembla, and
Newcastle port, and will provide access to the new Western Sydney Airport and the Western Parkland City.
The GSSIP outlines several initiatives that are designed to work collectively to enhance transport
infrastructure within the Study Area and the region more generally:
• Ongoing improvements to assets like Bells Line of Road and Great Western Highway
• Strategic examination of options to improve connectivity for freight from inland NSW to Sydney,
including consideration of existing roads such as Great Western Highway and nearby Bells Line
Road
• Ongoing improvements to Main Western Line (as a rail alternative to the GWH), and
• Potential electrification of the intercity network to Bathurst.
The proposal will thus not only resolve specific challenges within the Study Area at Medlow Bath, but it also
indirectly support nearby transport assets and provides for future capacity and redundancy in the broader
region.
AU212001198 | Medlow Bath - Socio-Economic Impact Assessment | Final | 7 July 2021
rpsgroup.com Page 10REPORT
3.3 Blue Mountains Community Strategic Plan 2035
The Blue Mountains Community Strategic Plan 2035 (Plan 2035) outlines how Blue Mountains City Council
(BMCC) will work with residents, ratepayers, businesses, and the NSW Government. Plan 2035 outlines that
appropriate infrastructure enhances quality of life, supports population growth, and allows the development
of a diverse economy.
Plan 2035 identifies several issues with respect to the GWH and the need to maintain the quality of urban
amenity along the GWH given its role as a major regional route connecting to Sydney. Specifically, it notes
several direct and supporting strategies that both BMCC and the NSW Government will jointly implement:
• Complete the upgrade and widening of the GWH west of Katoomba so that it delivers improved
safety, accessibility, and amenity
• Develop transport links between towns and villages for vehicles (including emergency vehicles),
cyclists and pedestrians other than the GWH, and
• Plan, provide, and advocate the development and implementation of a town centre, transport and
public access infrastructure related projects.
The proposal is therefore an important State project that supports regional residents, businesses, and
tourism at Medlow Bath. It is also an important interface with local road and transport assets that contribute
to local amenity and wellbeing.
AU212001198 | Medlow Bath - Socio-Economic Impact Assessment | Final | 7 July 2021
rpsgroup.com Page 11REPORT
4 SOCIO-ECONOMIC CONTEXT
4.1 Regional Overview
The proposal is situated within the Blue Mountains LGA. The Blue Mountains are in the Western City District,
approximately 60 kilometres to the west from the Sydney CBD and encompasses a total land area of about
1,430 square kilometres bounded by:
• Hawkesbury City in the north-east
• City of Lithgow in the north-west
• Penrith in the east
• Wollondilly Council area in the south
• Oberon Council area in the west.
Approximately 70% of the Blue Mountains area is World Heritage listed (World Heritage Blue Mountains
National Park), and approximately 11% of total land area is privately owned. The Blue Mountains LGA is one
of the top three tourist destinations in Australia, visited by approximately 4 million people each year.
4.2 Community Profile
Table 1 through Table 6 provide detailed information about the study area, Blue Mountains LGA, and the
Western City District region. In general, the study area can be characterised by the following demographic
features:
• A population of 13,222 residents
• A gender and age distribution that is broadly similar across the study area, Blue Mountains LGA, and
Western City District (refer to Table 1 and Table 2)
• A greater number of Australian born and English-speaking households in the study area and Blue
Mountains LGA than in Western City District (refer to Table 4)
• A greater proportion of separate detached dwellings than in the Blue Mountains LGA or Western City
District, reflecting an older established community (refer to Table 5)
• A similar distribution of single families (characterised as couples with children) across the study area,
Blue Mountains LGA, and Western City District (refer to Table 6), and
• Consistency in the top 5 key industries and occupations in the study area, Blue Mountains LGA, and
the Western City District (refer to Table 8).
Table 1: Summary Population, by Sex
Population Katoomba- Blue Western City Katoomba- Blue Western City
Leura SA2 Mountains District (#) Leura SA2 Mountains District (%)
(#) LGA (#) (%) LGA (%)
Male 6,305 37,123 504,749 48% 48% 49%
Female 6,915 39,779 519,690 52% 52% 51%
Total 13,222 76,902 1,024,444 100% 100% 100%
Source: 2016 Census of Population and Housing
AU212001198 | Medlow Bath - Socio-Economic Impact Assessment | Final | 7 July 2021
rpsgroup.com Page 12REPORT
Table 2: Summary Population, by Age
Katoomba- Blue Katoomba- Blue
Western City Western City
Age Leura SA2 Mountains Leura SA2 Mountains
District (#) District (%)
(#) LGA (#) (%) LGA (%)
Total 0-14 1,888 14,072 169,405 14% 18% 21%
Total 15-64 8,260 47,812 542,893 62% 62% 66%
Total 65+ 3,072 15,020 107,835 23% 20% 13%
13,222 76,902 820,115 100% 100% 100%
Total
Source: 2016 Census of Population and Housing
Table 3: Summary Population, by Education Attainment
Western
Katoomba- Blue Western Katoomba- Blue
City
Education Leura SA2 Mountains City Leura SA2 Mountains
District
(#) LGA (#) District (#) (%) LGA (%)
(%)
Postgraduate Degree Level 789 4,194 24,831 6% 5% 2%
Graduate Diploma and
331 2,035 89,72 3% 3% 1%
Graduate Certificate Level
Bachelor’s degree Level 1,918 11,043 87,391 15% 14% 9%
Advanced Diploma and
1,297 7,364 70,976 10% 10% 7%
Diploma Level
Certificate III & IV Level 1,597 10,638 134,463 12% 14% 13%
Secondary Education -
2,916 16,596 28,4743 22% 22% 28%
Years 10 and above
Certificate I & II Level 12 45 888 0% 0% 0%
Secondary Education -
651 3,561 81,159 5% 5% 8%
Years 9 and below
Supplementary Codes 453 2,404 40,670 3% 3% 4%
Not Stated 1,377 4,944 74,643 10% 6% 7%
Not Applicable 1,886 14,071 215,705 14% 18% 21%
Total 13,222 76,902 1,024,444 100% 100% 100%
Source: 2016 Census of Population and Housing
Table 4: Summary Selected Cultural Attributes
Language Blue Mountains Western City
Katoomba-Leura SA2
LGA District
Born in Australia (%) 72% 78% 62%
English Primary Spoken at Home 84% 91% 60%
Speaks English Very Well / Well 90% 91% 79%
Does not Speak English Well / Not at All 10% 9% 21%
Source: 2016 Census of Population and Housing
AU212001198 | Medlow Bath - Socio-Economic Impact Assessment | Final | 7 July 2021
rpsgroup.com Page 13REPORT
Table 5: Summary Selected Dwelling Attributes
Dwellings Katoomba-Leura SA2 Blue Mountains LGA Western City District
Total Dwellings 7,472 34,306 356,529
Occupied Private 79% 87% 94%
Dwellings
Separate House 83% 91% 80%
Owned Outright / 50% 66% 61%
Mortgage
Rented 21% 15% 24%
Source: 2016 Census of Population and Housing
Table 6: Summary Selected Household Composition Attributes
Household Composition Blue Mountains Western City
Katoomba-Leura SA2
LGA District
One Family, Couple No Children 30% 33% 26%
One Family, Couple with Children 23% 37% 51%
Lone Person Household 46% 31% 23%
Source: 2016 Census of Population and Housing
4.3 Economic Profile
Table 7 through Table 12 and Figure 6 provide detailed economic information about the study area, Blue
Mountains LGA, and the Western Sydney District. In general, the study area can be characterised by the
following economic features:
• A labour force of 10,551 persons as of the 2016 census (refer to Table 7)
• Labour force participation and unemployment rates broadly consistent across the study area, Blue
Mountains LGA, and Western Sydney District, with the study area demonstrating marginally higher
workforce participation and employment (refer to Table 7)
• Health Care and Social Assistance was the largest employer for the study area, Blue Mountains LGA
and the Western City District (refer to Table 8).
• Accommodation and food services and retail trade are also some of the key industries contributing to
employment in the study area, Blue Mountains LGA and Western City District. These sectors would
contribute to local tourism which is the second largest industry overall for the area (refer to Figure 6)
• A median weekly income (and the proportion of low and high-income households) that is broadly
consistent across the study area, Blue Mountains LGA, and Western Sydney District (refer to Table
10)
• An increase in international and domestic visitors to the Blue Mountains of approximately 10%
between 2018 and 2019:
‒ These comprise of both overnight stay and day trips largely due to increased international
tourist visits and domestic day trips
‒ Between 2018 and 2019, overnight tourism expenditure has increased by more than 10%,
reflecting the significant contribution tourism has in the area (refer to Table 12).
AU212001198 | Medlow Bath - Socio-Economic Impact Assessment | Final | 7 July 2021
rpsgroup.com Page 14REPORT
Table 7: Summary Work Force Attributes
Katoomba-Leura SA2 Blue Mountains LGA Western City District
Labour force 10,551 59,929 762,562
Participation rate (%) 56% 63% 64%
Unemployed persons 398 1,784 32,762
Unemployment rate (%) 7% 5% 7%
Source: 2016 Census of Population and Housing
Table 8: Summary Labour Force, Top 5 Key Industries
Industry Katoomba-Leura SA2 Blue Mountains LGA Western City District
Health Care and Social Health Care and Social Assistance Health Care and Social
Assistance – 20% – 17% Assistance – 13%
Accommodation and Food Accommodation and Food Services
Retail Trade – 11%
Services – 19% – 14%
Industry Retail Trade – 13% Education and Training – 12% Education and Training – 10%
Public Administration and Safety
Retail Trade – 11% Manufacturing – 10%
– 9%
Public Administration and Safety –7%
Education and Training – 6% Construction – 9%
Construction – 7%
Source: 2016 Census of Population and Housing
Table 9: Summary Labour Force, Top 5 Key Occupations
Occupation Katoomba-Leura SA2 Blue Mountains LGA Western City District
Professionals – 20% Professionals – 23% Professionals
Community and Personal Service Community and Personal Service
Technicians and Trades Workers
Workers – 18% Workers – 17%
Technicians and Trades Workers Technicians and Trades Workers Clerical and Administrative
Occupation
– 12% – 13% Workers
Clerical and Administrative Community and Personal Service
Managers – 11%
Workers – 12% Workers
Clerical and Administrative
Managers – 11% Managers – 11%
Workers – 11%
Source: 2016 Census of Population and Housing
Table 10: Summary Selected Income Attributes
Katoomba-Leura Blue Mountains Western City
Income
SA2 LGA District
Median weekly household income ($) $883.33 $1,000.24 $897.79
Low-income households (less than $650 gross
51% 43% 45%
weekly income) (%)
High income households (more than $3,000 gross
3% 3% 2%
weekly income) (%)
Source: 2016 Census of Population and Housing
AU212001198 | Medlow Bath - Socio-Economic Impact Assessment | Final | 7 July 2021
rpsgroup.com Page 15REPORT Table 11: Summary Selected Travel Attributes Travel Katoomba-Leura SA2 Blue Mountains LGA Western City District Train (%) 13 14 13 Bus (%) 1 1 1 Car, as driver (%) 66 75 75 Car, as passenger (%) 5 4 6 Truck (%) 1 1 2 Motorbike / Scooter (%) 1 1 - Bicycle (%) - - - Walking (%) 10 3 2 Other (%) 1 1 - Source: 2016 Census of Population and Housing 4.3.1 Local Business and Industry The Blue Mountains LGA is geographically located west of Sydney’s CBD. Health Care & Social Assistance is the largest sector in the Blue Mountains LGA, accounting for 3,442 jobs and 17.6% of total employment (refer to Figure 6). Tourism is the second largest sector in the Blue Mountains LGA, accounting for 2,430 jobs and 12.5% of total employment in the region. Comparatively, approximately 4.2% of jobs in Greater Western Sydney, 6.1% in NSW and 6.3% in Australia more broadly are supported by tourism, demonstrating the importance of this sector for the Blue Mountains LGA in supporting jobs. Other key industries for the Blue Mountains LGA include, education and training, retail trade and construction services. Figure 6: Summary of Employment, by Industry Sector Source: Remplan website as referenced from ABS 2016 Census Place of Work Employment (Scaled), ABS 2017 / 2018 National Input Output Tables, ABS June 2019 Gross State Product, and ABS 2018 / 2019 Tourism Satellite Account AU212001198 | Medlow Bath - Socio-Economic Impact Assessment | Final | 7 July 2021 rpsgroup.com Page 16
REPORT

4.3.2          Tourism
The Blue Mountains is one of only two cities in the world that are classified as a World Heritage National
Park. It is a region rich in natural flora and fauna, culture, and heritage. There are many tourist attractions
and tourism related accommodation in the Blue Mountains LGA. There is a tourism information centre
located in Echo Point. Key attractions for the Blue Mountains LGA include the Three Sisters, Jenolan Caves,
Blackheath Gardens, Blue Mountains Explorer Bus, Blue Mountains Cultural Centre, Scenic World and
various restaurants, waterfalls, scenic bushwalking tracks, museums, and wineries.

Table 12: Tourism Summary, International and Domestic Visitors
                                                            YE Dec       YE Dec       YE Dec       YE Dec       YE Dec      % change YE Dec19
    Tourism
                                                             2015         2016         2017         2018         2019          vs. YE Dec18
    Grant Total – overnight & daytrip
    Visitors (‘000)                                          3,727        4,082        4,234        4,206        4,633               10.2%
    Nights (‘000)                                            2,603        2,868        3,155        3,167        3,515               11.0%
    Expenditure ($ million)                                  $619         $685         $681         $775         $796                 2.8%
    Overnight – Int’l & domestic
    Visitors (‘000)                                           985         1,073        1,210        1,276        1,434               12.3%
    Nights (‘000)                                            2,603        2,868        3,155        3,167        3,515               11.0%
    Expenditure ($ million)                                  $422         $433         $449         $456         $503                10.4%
    Domestic – Overnight & daytrip
    Visitors (‘000)                                          3,629        3,977        4,109        4,085        4,518               10.6%
    Nights (‘000)                                            2,086        2,260        2,452        2,594        2,946               13.6%
    Expenditure ($ million)                                  $558         $632         $622         $729         $737                 1.1%

Source: NSW Government, Destination NSW Website as referenced from Tourism Research Australia, National and International Visitor Surveys

4.4            Site Context
The Great Western Highway and the Main Western Railway Line are two important transport infrastructure
assets that pass-through Medlow Bath.1 This road and rail corridor not only links the local and regional
centres but provides access to Sydney and the Orana regions. As a result, it plays a critical role in
supporting the livelihood of the community.

4.4.1          Roadways
The GWH Medlow Bath corridor extends 1.2 kilometres from Station Street and Railway Parade north to just
south of the intersection with Bellevue Crescent. This section of the GWH is a two-lane single carriageway
with a posted speed limits ranging from 60 km/h to 70 km/h.
On average, the proposal corridor experiences the following traffic volumes:
        •    Average weekday traffic volumes are around 20,000 vehicles in both directions with daily westbound
             flows very slightly higher than daily eastbound flows
        •    Average weekend traffic volumes are around 21,000 vehicles in both directions with eastbound flows
             very slightly higher than westbound flows
        •    Heavy vehicles make up around 24% of total traffic on an average weekday

1
    Spackman Mossop Michaels, “Great Western Highway: Medlow Bath Urban Design Concept, Landscape, Character, and Visual
    Impact Assessment Report”, July 2021

AU212001198 | Medlow Bath - Socio-Economic Impact Assessment | Final | 7 July 2021
rpsgroup.com                                                                                                                                Page 17
REPORT
• On a weekend, they make up around 12% of total traffic. Most of the traffic is light vehicles, although
this does vary between weekdays and weekends.2
The proposal corridor is accessible via two intersections: one at Bellevue Crescent and another at Railway
Parade westbound. The corridor provides access to a service station, Hydro Majestic Pavilion and Hotel, a
Mazda Dealership, and Medlow Bath Station. Figure 7 illustrates the eastbound approaches to both
intersections noted above.
Figure 7: GWH and Bellevue Crescent (Left) – GWH and Station Street (Right)
Source: Google Street View, 2020
As outlined in the Traffic and Transport Assessment Report, traffic volumes, delays, and level of service vary
between both sections of the proposal corridor. While the conditions at the intersection at Station Street and
GWH are generally good, the intersection at Bellevue Crescent is moderate owing to the lack of a controlled
intersection. The Blue Mountains and the Medlow Bath area attracts significant weekend traffic. It is a
popular tourism destination for weekend travellers attracting 20% more on weekends than on weekdays.
Table 13: Existing 2020 Intersection Performance
Traffic Average Level of Degree of 95 Percentile
Existing
Intersection Peak Hour Volume Vehicle Delay Service Saturation Queue
Control
(veh/h) (secs) (LOS)3 (DOS)4 Lengths (m)
Great Western
Highway & 54 (West
Signalised AM 1,441 6 A 0.3
Railway Approach)
Parade
54 (West
PM 1,482 6 A 0.3
Approach)
Great Western
Highway & Stop 26 (North B (North 2 (North
AM 1,434 0.49
Bellevue (unsignalised) Approach) Approach) Approach)
Crescent
31 (North C (North 2 (North
PM 1,476 0.48
Approach) Approach) Approach)
2
Mott McDonald, “Traffic and Transport Report: Great Western Highway Upgrade Program - Medlow Bath Preferred Concept Design,
Detailed Design and REF”, May 2021.
3
Level of Service ranking criteria factors in average vehicle delay, traffic signal, roundabout, give-way and stop signs and how this
contributes to vehicle movements and safety. Refer to the Traffic and Transport Report for the detailed criteria matrix.
4
Degree of Saturation is the ratio of traffic volumes and road capacity of a particular road segment. Refer to the Traffic and Transport
Report for further details.
AU212001198 | Medlow Bath - Socio-Economic Impact Assessment | Final | 7 July 2021
rpsgroup.com Page 18REPORT
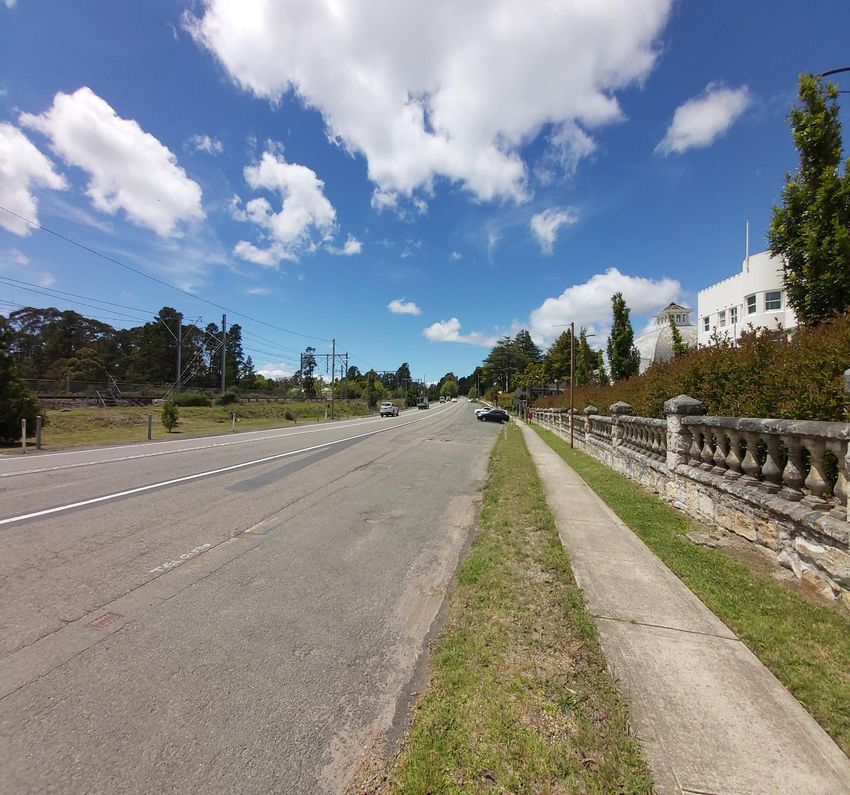
Going forward, traffic modelling suggests the traffic is anticipated to grow as follows:5
• Light Vehicles – 0.53%
• Rigid Vehicles – 1.84%
• Articulated – 1.26%.
Figure 8 demonstrates the total daily traffic volume on the GWH, applying a linear growth rate through to
2036.
22500
20000
17500
15000
No. of Vehicles
12500
10000
7500
5000
2500
0
2020 2022 2024 2026 2028 2030 2032 2034 2036
Year
Light Vehicles Rigid Vehicles Articulated Vehicles
Figure 8: Estimated Daily Traffic Volume on the GWH (Without Proposal)
A review of crash data within the Medlow Bath alignment over a five-year period ending in 20196:
• Nine crashes recorded along the Medlow Bath corridor
• Nil fatality crashes
• One serious injury crash, at the dividing road westbound
• Five moderate injury crashes
• Three non-casualty towaway crashes.
5
Mott MacDonald, “Traffic and Transport Report: Great Western Highway Upgrade Program - Medlow Bath Preferred Concept Design,
Detailed Design and REF”, May 2021, Chapter 4.
6
Mott MacDonald, “Traffic and Transport Report: Great Western Highway Upgrade Program - Medlow Bath Preferred Concept Design,
Detailed Design and REF”, May 2021, Chapter 2.6 (page 20).
AU212001198 | Medlow Bath - Socio-Economic Impact Assessment | Final | 7 July 2021
rpsgroup.com Page 19REPORT
Spatial grouping of crashes illustrates that there is a safety concern at the Bellevue Crescent intersection
where 44% of total vehicle crashes occurred at this location.
4.4.2 Public Transport
The Medlow Bath is served by a rail station located at the northern extent of the study area at the
intersection of Station Street, Railway Avenue, and the Great Western Highway. The station is serviced by
The Blue Mountains Line (BMT), running dual directions between Central Station and Bathurst. Table 14
summarises the train service times and frequencies.
Table 14: Train Frequencies at Medlow Bath Station
Direction Time Monday to Friday Weekends and Public
Holidays
Central to Bathurst 6am-7pm 13 16
Bathurst to Central 6am-7pm 13 18
The station is accessed by two entrances: a refuge crossing to the south (leading north to an existing
pedestrian bridge) and a level crossing at the intersection of Station Street, Great Western Highway, and
Railway Avenue. The northern entry is accessed by two routes. One route is the level crossing connecting to
the intersection north west of the station. The second point is an existing pedestrian bridge that links the
station to a footpath that runs parallel to the Great Western Highway and the south western side of the
highway via a refuge crossing.
The southern entry exits to a level crossing that provides a non-compliant accessible route to the rail
platform but also provides links to Medlow Bath Park, Public Parking along Railway Parade, existing school
Bus drop offs, an informal ‘kiss and ride’, and the residences toward the south-east of Medlow Bath.
Additionally, the proposal corridor is served by bus routes that connect the Blue Mountains villages along the
GWH. Currently there is one westbound and eastbound bus stop location in Medlow Bath in proximity to the
school bus facilities located on Railway Parade. The Medlow Bath corridor is serviced by the following bus
routes:
• 698 – Katoomba to Blackheath (Loop Service) runs across the entire length of the proposal
• 698V – Katoomba to Mt Victoria (Loop Service) runs across the entire length of the proposal
• 8718 – Blue Mountains Christian School to Hazelbrook Station. This is a school bus that only runs
eastbound.
4.4.3 Active Transport
The existing pedestrian connections with the proposal corridor are minimal. The footpaths along the GWH
are visually exposed with little to no shade or protection from noise and high levels of traffic along the
highway.
Pedestrian access to the existing commuter car park, bus stop and kiss and ride is via Railway Parade,
however, there are non-compliant footpaths onto the station platform and no footpaths between the northern
access and the accessible entry in the south along Railway Parade.
Existing cycling and pedestrian links are located along the corridor in the form of the Blue Mountains Trail,
which provides recreational links to the Greater Mountains Area. Although pedestrian access is well
patronised in the form of bushwalkers and recreational walkers, safe pedestrian amenity is lacking around
Railway Parade and local roads to the east; with accessible links to the existing Medlow Bath Train platform
only exist via a level crossing at the southern end of the platform. Some of the key active transport features
include:
• A push button activated pedestrian crossing on the westbound approach of the GWH / Railway
Parade intersection
AU212001198 | Medlow Bath - Socio-Economic Impact Assessment | Final | 7 July 2021
rpsgroup.com Page 20You can also read