Understanding the Origins of Populist Political Parties and the Role of External Shocks - Eugenio Levi, Isabelle Sin, Steven Stillman August 2021
←
→
Page content transcription
If your browser does not render page correctly, please read the page content below
Motu Working Paper 21-09

Understanding the Origins of
Populist Political Parties and
the Role of External Shocks

Eugenio Levi, Isabelle Sin, Steven Stillman
August 2021
Understanding the Origins of Populist Political Parties and the Role of External Shocks

Document information
Author contact details
Eugenio Levi
Masaryk University
Faculty of Economics and Administration
eugenio.levi@econ.muni.cz

Isabelle Sin
Senior Fellow, Motu Economic and Public Policy Research
izi.sin@motu.org.nz

Steven Stillman
Free University of Bozen-Bolzano
Steven.Stillman@unibz.it

Acknowledgements
This research was funded by an internal grant from the Free University of Bozen-Bolzano. We thank Massimo
Morelli, Federico Boffa, Andreas Steinmayr, Helmut Rainer, Panu Poutvaara, Jack Vowles, as well as seminar
participants at CESifo and at the University of Modena and Reggio Emilia and conference participants at the
Alpine-Population Workshop, ZEW Workshop on Immigration, Integration and Attitudes, the 10th Annual
Conference on Immigration in OECD Countries and the SKILS conference. Stillman also thanks CESifo for hosting
him as a visiting fellow.

Disclaimer
The anonymized census data used in this study was provided by Statistics New Zealand. Access to the data used
in this study was provided by Stats NZ under conditions designed to give effect to the security and
confidentiality provisions of the Statistics Act 1975. The results presented in this study are the work of the
authors, not Stats NZ or individual data suppliers.

Motu Economic and Public Policy Research
PO Box 24390 info@motu.org.nz +64 4 9394250
Wellington www.motu.org.nz
New Zealand

© 2021 Motu Economic and Public Policy Research Trust and the authors. Short extracts, not exceeding two
paragraphs, may be quoted provided clear attribution is given. Motu Working Papers are research materials
circulated by their authors for purposes of information and discussion. They have not necessarily undergone
formal peer review or editorial treatment. ISSN 1176-2667 (Print), ISSN 1177-9047 (Online).

 i
Understanding the Origins of Populist Political Parties and the Role of External Shocks

Abstract
We use electoral survey data to examine the impact that two large external shocks had on the
development of New Zealand First (NZF), one of the oldest populist parties in the OECD. We
find that structural reforms, which led to large negative impacts on particular locations, and
immigration reforms, which led to large spatially concentrated increases in skilled migration,
both increased voting for NZF in its first years of existence. These shocks led to changes in
political attitudes and policy preferences and had persistent effects on voting for NZF even
twenty years later. Overall, they play an important role in explaining the rise of populism in
NZ. Understanding how these shocks led to the development of NZF is particularly relevant
for thinking about how populism has been extending its reach in the 2010s.

JEL codes
D72; P16; H40

Keywords
Populism; political parties; trade; immigration; shocks.

 ii
Understanding the Origins of Populist Political Parties and the Role of External Shocks*
 Eugenio Levi, Masaryk University
 Isabelle Sin, Motu Economic and Public Policy Research
 Steven Stillman, Free University of Bozen-Bolzano, CESifo, IZA

 July 2021

Abstract

We use electoral survey data to examine the impact that two large external shocks had on the
development of New Zealand First (NZF), one of the oldest populist parties in the OECD. We
find that structural reforms, which led to large negative impacts on particular locations, and
immigration reforms, which led to large spatially concentrated increases in skilled migration,
both increased voting for NZF in its first years of existence. These shocks led to changes in
political attitudes and policy preferences and had persistent effects on voting for NZF even
twenty years later. Overall, they play an important role in explaining the rise of populism in
NZ. Understanding how these shocks led to the development of NZF is particularly relevant
for thinking about how populism has been extending its reach in the 2010s.

JEL Codes: D72; P16; H40
Keywords: populism; political parties; trade; structural reforms; immigration; shocks

*Contact author: steven.stillman@unibz.it. This research was funded by an internal grant from the Free University
of Bozen-Bolzano. We thank Massimo Morelli, Federico Boffa, Andreas Steinmayr, Helmut Rainer, Panu
Poutvaara, Jack Vowles, as well as seminar participants at CESifo and at the University of Modena and Reggio
Emilia and conference participants at the Alpine-Population Workshop, ZEW Workshop on Immigration,
Integration and Attitudes, the 10th Annual Conference on Immigration in OECD Countries and the SKILS
conference. Stillman also thanks CESifo for hosting him as a visiting fellow. The anonymized census data used
in this study was provided by Statistics New Zealand. Access to the data used in this study was provided by Stats
NZ under conditions designed to give effect to the security and confidentiality provisions of the Statistics Act
1975. The results presented in this study are the work of the authors, not Stats NZ or individual data suppliers.
1. Introduction

There are many explanations for the success of populist political parties (see Margalit 2019;
and Guriev and Papaioannou 2020, for recent reviews). But why have they emerged in the first
place? Most populist parties, e.g., UKIP in UK, the Five-Star Movement in Italy, AfD in
Germany, and Podemos in Spain, appear almost overnight and then a moment later they are
changing the political landscape and obliging mainstream parties to adapt to their rhetoric and
priorities (Mudde, 2019).1 As populist parties are primarily defined by their anti-elitism,
distributional issues are often seen as an important driver of their development (Rodrik 2018).
However, it is difficult to escape the feeling that economic and political crises also help explain
their emergence.2 Moreover, research on populists’ communication style point out that crises
are a specific and recurring feature of the populist discourse (Moffitt 2016).

There is little empirical evidence on what drives the birth of populist parties, and specifically
the role of economic and political shocks in this process. To fill this gap, we examine the impact
that two large external shocks had on the initial development of New Zealand First (NZF), a
populist and nationalist anti-immigration party with an otherwise centrist agenda founded in
1993, making it one of the oldest populist parties in the OECD.3 In the early 1980s, New
Zealand (NZ) experienced a large economic crisis, mostly caused by external forces, that led
to structural reforms and the opening of free trade. These changes had large negative impacts
on particular industries, many of which were geographically concentrated. Later, as part of a
gradual shift away from an immigration system based on country-of-origin quotas, the
Immigration Reform Act of 1987 was passed, which led to the development of a skilled
migration system and large changes in the composition of migrant inflows.

We use electoral survey data to examine the impact that these two shocks had: i) on voting for
NZF in its first years of existence; ii) on individual beliefs and political preferences including
the supply of and demand for political change; iii) on long-run persistence in voting for NZF;
and iv) relative to other factors that encouraged people to vote for NZF. Our use of an electoral
survey, as opposed to voting data, allows us to examine the pathways through which these

1 Populism in many ways feels like a contagious disease the ends up causing a pandemic.
2 This partly comes for observation. Most populist political parties, especially in the Western world, have emerged
after an economic shock: in Europe, a big burst of both left-wing and right-wing populist parties followed the
2008 economic downturn, while a specific role seems to have been played also by the large migration shocks
following the 2004 enlargement round of the European Union and the 2015 refugee crisis (Guriev and
Papaioannou 2020).
3 As discussed in more detail below, NZF has more in common with right-wing populist parties in Europe than
left-wing parties but espouses a relatively soft authoritarian populism (Vowles and Curtin 2020).

 2
shocks affect voting behaviors and heterogeneity in their impacts, as well as to compare their
importance to other channels that have been shown to influence populist voting.4

Importantly, this survey data contains very localized geographic identifiers that allow us to
combine it with five-yearly census data to measure the two shocks, as well as to control for
socioeconomic characteristics of each local area. Specifically, we measure the two shocks as:
i) the percentage loss in income between 1986 and 1991 in a local area (which we call the
“structural reform shock” from now on) and ii) the share of the local population that has
immigrated to NZ in the previous five years (“immigration shock”).5 We also use these data to
build instruments to account for any potential endogeneity of these shocks. For the impact of
structural reforms, we use the distribution of 265 industries in an area in 1986 combined with
the change in incomes in these industries between 1986 and 1991. And for the impact of
immigration, we use detailed information on the country of birth (124 CoBs) of recent
immigrants in 1993 and 1996 combined with the distribution of immigrants by CoB in local
areas before the reform of the immigration system in 1986. We show below that our
instruments are uncorrelated with voting patterns in 1984 prior to the shocks being experienced.

We find that these shocks are positively related with votes for NZF already in 1993 at the
electoral district level and that these effects become statistically significant in 1996 after NZ
switched its electoral system from First Past the Post (FPP) to Mixed-Member Proportional
(MMP) and NZF experienced a doubling in vote share.6 If we instead focus on a more natural
geography of local labor market areas, which we can do only starting in 1996, we find stronger
impacts of the shocks. In our preferred specification using the instruments described above, we
find that a 1 percentage-point increase in recent arrivals increases the NZF vote share by 4.8
percentage points and the same size reduction in income caused by structural reforms increases
it by 1.3 percentage points relative to an actual vote share of 11 percent. The impact of the
immigration shock is found to be entirely driven by increased immigration from Asia and there

4 As shown in Figure 1, responses in the survey closely mirror actual voting behavior and we find similar results
when we use official data to measure voting outcomes (available from the authors on request).
5 We measure the structural reform shock between 1986 and 1991 because previous work has shown that this is
when the largest industry specific shocks were experienced (Stillman et al. 2010). This paper also shows that
findings are similar when 1981 census data is used to measure the baseline situation, but there are several
comparability issues when using this older data, in particular, a completely different industry classification is used.
6 As discussed in Riambau et al. (2021), the electoral system was switched because of the results from a binding
referendum. We show below that experiencing shocks, in particular the immigration shock, also led to a significant
increase in individuals voting to change the electoral system.

 3
is no impact of these shocks on turnout or voting for other political parties, indicating that there
is a specific link between these shocks and populist voting.

To better understand why these shocks led to an increase in populist voting, we next examine
their impact on people’s political opinions, beliefs, and policy preferences. Consistent with our
findings on voting, we find no impact of these shocks on an individual’s political position but
experiencing either shock leads to an increase in populist attitudes, such as mistrust of the
mainstream political parties and preferences for a strong leader. We also find that increased
immigration makes people more hostile to immigration and more likely to consider security
issues as important. On the other hand, individuals who experience a larger structural reform
shock have increased preferences for redistribution, have increased feelings that the economy
has been badly managed, and feel that unemployment is a more relevant policy issue. These
changes in preferences and beliefs explain around 30 percent of the overall impact of each
shock on voting for NZF.

We also provide supporting evidence on whether these shocks led to increased support for
populism by changing the attitudes and desires of the voters or by changing the ‘supply’ of
populism via the creation of NZF (Guiso et al. 2017). Consistent with demand side being more
important, we find a strong significant impact of having experienced an immigration shock on
individual’s voting to change the political system in the 1993 referendum that switched the
electoral system from FPP to MMP. On the other hand, we do not find an impact of
experiencing these shocks on whether NZF was more likely to field candidates in a particular
electorate in 1993.

Given that we find these shocks lead to changes in individual preferences and the demand for
populism, and that previous work has found that the structural reform shock persists at the local
level (Stillman et al. 2010), we examine whether the shocks continue to have an impact on
voting for NZF into the future. Importantly, persistent effects on shocks could explain why
populist parties survive for long periods and become an embedded part of the political
landscape. Examining the impact of these shocks on voting for NZF in the six elections from
1999 to 2014, we find that they continue to influence voting, particular when NZF is in
opposition and also when the economy is doing well. We suspect that the latter occurs because
NZF does not focus on economic policy and the rhetoric around immigration in NZ is more
about the negative impact of inflows on house prices and local amenities rather than on labor
markets and hence tends to be more in focus when the economy is doing well (Vowles and
Curtin 2020). Overall, the shocks we examine have some long-term memory in them.

 4
We next examine heterogeneity in the impact of these shocks to better understand the channels
underlying the short-run effects. In general, the impact of both shocks is homogeneous across
sociodemographic characteristics, suggesting that competition effects do not drive our results.
Consistent with previous research that has focused solely on the impact of immigration shocks,
we find larger impacts of recent immigration on populist voting in less densely populated
places and areas that have less immigration prior to the policy change (Dustmann et al. 2019).
Structural reform shocks also have smaller effects in more densely populated areas. This is
consistent with urban populations being more flexible and less resistant to change, and also to
cultural concerns being more important in rural areas (Di Tella and Rotemberg 2018).

We also examine whether the impact of shocks varies with the preferences and beliefs of
individuals. This analysis is merely suggestive as we find that shocks also directly impact these
variables. In general, the impact of the immigration shock does not depend on individual
preferences and beliefs, but the structural reform shock has a larger impact on individuals with
negative views about immigration, preferences for more redistribution, negative feelings about
the quality of recent policies, mistrust towards political parties, and positive feelings about
Winston Peters, the founder and leader of NZF. These results suggest that the large decline in
incomes caused by structural reforms at the end of the ‘80s translated into the emergence of
NZF through its impact on and interaction with anti-immigration and anti-elite attitudes.

Finally, we examine the relevance of different explanations for populism by calculating the
partial R-squared associated with different groups of variables that are included in our
regressions. In our main model, variation in shocks explains almost 10 percent of the variation
in voting for NZF, which is of a similar relevance to the combined effect of individual
demographic, social, and economic characteristics. However, in our extended model, it is clear
that differences in preferences, beliefs, and opinions are even more important for explaining
the variation in populist voting. Overall, we find an important role for shocks in explaining the
rise of populism in NZ, and the impact of these shocks both amplify and are amplified by
differences in political beliefs and opinions.

Our paper makes a number of important contributions:

First, we bring together two separate strands of an expanding political economy literature on
populism. One focuses on the impact of economic shocks on populist voting. Papers have
examined the role of globalization, in particular trade with China (Becker et al. 2017; Dippel
et al. 2017; Colantone and Stanig 2018a; 2018b; 2019; Alabrese et al. 2019; Dorn et al. 2020),

 5
macroeconomic shocks (Algan et al. 2017; Dal Bό et al. 2021), and the recent rise in automation
(Im et al., 2019, Anelli et al., 2019). The second focuses on the impact of immigration on
populist voting (Barone et al. 2016; Halla et al. 2017; Edo et al. 2019; Dustmann et al. 2019;
Levi et al. 2020). None of these papers study the joint role of economic and immigration shocks
where both come from exogenous sources. This literature has divergent views on whether
globalization alone is responsible for the rise of populism in Europe and the US or whether
institutional rigidities and a lack of trust are necessary contributors (Guiso et al. 2017; Guiso
et al. 2019). Our findings that structural reforms were a key ingredient in the development of
NZF along with changes in the immigration system and that experiencing these shocks also led
to decreased trust and a desire to change the political system is consistent with the idea that
globalization alone is not responsible for rising populism and that political dissatisfaction is
also a necessary condition.

Second, we show that immigration and structural reform shocks impact political preferences,
beliefs, and opinions, that these political variables are important for explaining populist voting
and that having particular preferences, beliefs, and opinions amplify the impact of experiencing
shocks. Almost all previous papers take an epidemiological approach and relate geographical
patterns in voting to quasi-experimental variation in the spatial distribution of shocks.7 This
makes it difficult to evaluate the channels through which the shocks impact populist voting. By
using electoral survey data combined with spatially distributed shocks, we are able to examine
the pathways through which shocks impact voting as well as heterogeneity in impacts. Our
results support previous arguments that labor market competition is not the main pathway
through which immigration shocks lead to populist voting (e.g., Card et al. 2012; Hainmueller
and Hopkins 2014; Margalit 2019). The same appears to be true of shocks driven by structural
reforms and increased trade exposure which has not been shown yet in the literature.

Third, a unique aspect of our paper is the focus on the initial years of development of an ‘old’
populist party. This allows us to examine the persistence of the impact of economic and
immigration shocks and understand under what circumstances these shocks have long-run
impacts on support for populism. This is particularly important for understanding what we
should expect to happen in the future in European countries and the US where the political
expression of populism is a more recent phenomenon. Our evidence suggests that while support

7 Exceptions include Burgoon et al. (2019) and Guiso et al. (2017), which both use European Social Survey data
to investigate the relation between economic insecurity and votes for populist parties at an individual level, and
Moriconi et al. (2019) who use the same data to study the impact of immigration on nationalistic voting.

 6
for populism fluctuates with both political and economic conditions, it never goes away entirely
and under the right combination of conditions tends to reappear in the same locations as in the
past. In the end, we find that voters dissatisfied with mainstream parties are still around in the
same places even 30 years after the initial events that caused their dissatisfaction.

Fourth, we contribute to a large literature in political science by also evaluating the role of
political preferences, beliefs, and opinions on populist voting and how these interact with the
economic shocks. In particular, a number of papers show the importance of ‘cultural backlash’
in explaining populist voting (Norris and Inglehart 2019; Cramer 2016; Hochschild 2016; Gest
2016; Eribon 2018) while others examine the importance of populist attitudes, such as
disenchantment with traditional parties and democracy (Mudde 2007; Akkermann et al. 2014;
Spruyt et al. 2016). We show that these explanations are indeed relevant for understanding the
origins of NZF and that economic and political explanations for populism appear, in fact, to be
highly intertwined.8

While NZ is a small country at the end of the world, it is a forerunner to many of the current
trends affecting OECD countries. In the 1980s, NZ experienced a deep economic crisis that led
to structural reform process which significantly decreased government support and increased
competition within certain industries. The shock was similar in many ways to the impact that
China joining the WTO and now expanding automation had on the rest of the developed world
in the 2000/2010s. Similarly, NZ was at the forefront in developing a skilled migration system
that had no restrictions on country of origin and led to large inflows of immigrants from
culturally distant countries.

The country’s populist party, NZF, was formed just before the 1993 election and, by the next
in 1996, it acquired a remarkable 13 percent of the vote. Even though it has a fairly centrist
policy platform, we show below that it attracts very similar voters in terms of observable
characteristics as current populist parties in Europe. Focusing on this case study allows us to
investigate the origins of a populist party without confounding effects from the recent global
emergence of populism – Trump, Brexit, etc. – and, given that NZF has been part of NZ politics
for almost 30 years, to understand why populist parties survive in the face of the general
incompetence of their personnel (Funke et al. 2020).

8 Our work is also related to a small literature examining how economic shocks impact political opinions, beliefs,
and policy preferences (for example, Ahlquist et al. 2020) as well as that on the political impacts of structural
reforms (for example, Alesina et al. 2020).

 7
2. Background
2.1. New Zealand First

NZF is in many ways, consistent with its populist traits, the story of Winston Peters, its ongoing
leader from its foundation in 1993. Peters was first elected to Parliament in 1978 as a member
of the mainstream center-right National party. Like many recent populist leaders, such as
Salvini, Farage, Le Pen, Mélenchon, Lafontaine, etc. he has a long-term involvement with
politics. From the end of the ‘80s, he started criticizing National leadership in public on a
variety of issues without any clear ideology. His focus on anti-corruption and political
accountability rocketed his popularity with polls indicating that over a quarter of NZers were
ready to vote for a Winston Peters party. In 1992, he was expelled from the Cabinet and told
that he could not stand again as National candidate in his electoral district. In July 1993, only
five months before the new general elections, he launched NZF.

As Boston and McLeay (1997) put it, “the party quickly developed an image as being strongly
nationalistic, anti-establishment, populist, and mildly protectionist. Its most publicised policy
commitments emphasised the need to stop the sale of state assets, limit the sale of NZ land and
resources to overseas investors, restrict immigration, protect local industry, and hold
politicians more accountable”. Because of an anti-elite stance fueled by disgruntlement toward
traditional politics and of the identification of the party with its leader, NZF can clearly be
categorized as a populist party. However, unlike most European populist parties that clearly
belong to either the left or the right, NZF promotes a mixture of (far-) right and (far-) left
policies. It is against big business, unions, and big government, critical of the ‘80s pro-market
reforms and wants NZ to go back to a “golden age” where the country was more isolated from
the rest of the world. The organization of the party, as it is typical of populist parties, is very
loose and all decisions are left to the central direction of the party.

In 1993, NZF received 8.4% of the total votes cast and won two seats (out of 99) in NZ’s
unicameral parliament, which at that point used a first-past-the-post (FPP) electoral system as
in the US and UK. In the same election, a binding referendum was held that somewhat
surprisingly led to a change in the electoral system from FPP to MMP (mixed-member
proportional, see Riambau et al. (2021) for more details). In this new system, political
representation is based on the national percentage of the vote received by each party, provided

 8
that the party reaches a 5 percent threshold.9 As the 1996 election approached, NZF increased
its anti-immigration stance, with Peters blaming immigrants for ‘placing a significant strain on
education and health services’ and ‘causing high home mortgage rates’. It ended up getting
13.5% of the party vote and a corresponding 17 MPs. In a very controversial move, the party
decided to use its pivotal role in the Parliament to become part of a government with the
National party with Peters taking for himself the role of Minister of Treasury.

In Table 1, we show for which parties the initial supporters of NZF previously voted in 1990
(using the electoral survey data described in detail below). The party built up a support base of
its own rather than relying on exit flows from a specific mainstream party. While a slight
majority of voters in 1996 previously voted for the National party (36%), many other supporters
previously voted for the Labour Party (28%). If we instead look at the share of individuals who
previously voted for other parties in 1990 who then voted for NZF, this picture becomes even
clearer. More or less 10% of the voters of each party in 1990, from the right-wing National to
the far-left Alliance switched to voting for NZF in 1996 election. Interestingly, this is true even
though Peters was previously a leading member of the National party.

After 1996, NZF never reached the same percentage of votes, ranging from a high of 10.4% in
2002 to a low of 2.6% in last election in 2020 (Figure 1). In 2008 and 2020, the party also failed
to win a directly elected seat and hence fell out of Parliament entirely. However, thanks to its
pivotal role in some years, it succeeded in becoming part of the government again in 2005 and
2017, both times in coalition with the center-left Labour Party. Hence, even though it is in
many ways a marginal party in NZ, it has played an important role in helping to set the policy
agenda, in particular on immigration policy and on support for older individuals and rural
interests.

We show in Appendix 1 Table that similar individuals in terms of observable characteristics
voted for NZF in 1996 as for populist parties in Europe in the 2000s.10 Both attract votes from
older individuals, those with lower level of education and lower incomes, and those living in
rural areas. To sum up, NZF positioned itself not far from the political space that other

9 In practice, everyone has two votes, one for a local FPP election and the other a party vote. In 1996, sixty-five
MPs were chosen based on the first vote while the other 55 were selected from a national list with the total elected
(in the local elections and from the list) for each party reflecting only the proportion of party votes received.
10 We use the European Social Survey data for this comparison and define a political party as populist if it scored
higher than 7 on the average between the two questions on populism in the 2014 and 2019 waves of the Chapel
Hill Expert Survey (see the footnote of the Appendix 1 Table for more details).

 9
European populist parties would later occupy. Not only this is consistent with well-established
evidence on who votes for populist parties in Europe and in the US (Norris and Inglehart,
2019), but it also strengthens the argument that investigating NZF is particularly relevant for
thinking about how populism has been extending its reach in the 2010s in other Western
countries.

2.2. Brief Economic History of New Zealand

Up to 1984, NZ had a highly regulated economy, with subsidies for agriculture, protection for
industry and a closed capital account. By that time, the country was facing unsustainable fiscal
and current account deficits, runaway inflation, and a foreign exchange crisis. This led to
widespread recognition that macroeconomic reforms were needed to correct imbalances and
reduce inflation, and microeconomic reforms were needed to improve productivity (McMillan
1998). A vast program of reforms later labelled “Rogernomics”, after the Labour Finance
Minister Roger Douglas who enacted most of them, was implemented.

From 1984 to 1987, the Labour government increasingly deregulated the economy, opened the
capital account, and eliminated subsidies to agriculture. Under a re-elected Labour government,
between 1987 and 1990 most major publicly owned companies were privatized. In the 1990
election, the National party won on the promise to slow down the pace of the reforms and to
steer away from “Rogernomics”. However, the party’s liberal wing took control after the
election and pushed through large reforms to the welfare system and labour market policy.
Welfare was scaled back from universal provision to a tightly targeted welfare system (Boston
et al. 1999) while labour market regulations, among other things, decentralized the employer–
employee bargaining process (Evans et al. 1996).

From 1986 and 1991, real per capita GDP growth averaged -0.83% and unemployment rose
from 5% in 1984 to almost 11% in 1992. Mean real household income dropped by 4.7%
between 1986 and 1991. The reform process had a particularly strong impact on the
manufacturing sector with employment falling by 30% between 1987 and 1995 (Gibson and
Harris 1996). There were also strong negative impacts on employment in the agriculture sector.
Stillman et al. (2010) show that the negative impact of these reforms was strongly spatially
concentrated because of the geographical distribution of industries and that the reforms had
long-run impacts on the labor market in particular communities. We take advantage of the
spatial aspect of the impact of these reforms to examine their impact on voting for NZF.

 10
2.3. Immigration in New Zealand

NZ is historically a high immigration country with most migrants settling in the larger cities of
Auckland, Wellington, and Christchurch (Maré et al. 2007). In 1986, 15% of the population
was already foreign-born, but immigrants were mostly of European descent (49% of them were
British compared with 6% Asian) as migration up to that point was mainly allowed from
traditional source countries along with some low-skill migration from the Pacific Islands.
Independent of the economic reforms discussed above, an Immigration Policy Review was held
in 1986. This review aimed to develop new policy initiatives that would “enrich the
multicultural fabric of New Zealand society through the selection of new settlers principally
on the strength of their personal contribution to the future well-being of New Zealand” (Burke,
1986: 10). The ensuing Immigration Act 1987 removed the traditional source country
preference for European or Anglo-Saxon countries. The Immigration Amendment Act 1991
then replaced the previous ‘occupational priority list’ system with a point system.

These Acts combined inverted a previous trend in net migration by increasing arrivals. While
between 1980 and 1989 NZ lost a net 122,500 migrants, mainly because of unfavorable
economic conditions, from 1990 net migration turned positive even though the economy was
still struggling. In 1995, a peak net inflow of 28,500 was reached and by 1996 immigrants were
21% of the total population. More importantly, there was a large change in the composition of
the immigrant population. Specifically, 15% of the immigrant population was now of Asian
descent, with the number of Chinese-born in NZ increasing between 1986 and 1996 from 4,900
to 19,500, Hong Kong-born from 1,881 to 11,760, Korean-born from 390 to 12,183 and
Taiwan-born from 165 to 10,930.

3. Data and Empirical Strategy
3.1. Data

To assess the impact of economic and migration shocks on the emergence of populism, we use
data from the New Zealand Election Study (NZES). NZES is a telephone survey that is
designed to be representative of the voting population and has been fielded by the University
of Auckland since 1990 immediately after each general election. It collects extensive data on
opinions about political parties, own politics and voting behaviors, as well as individual and
household characteristics. In particular, individuals are asked whether they voted in the election
that just occurred, and if yes, for which candidate and party they voted. They are also asked
who they voted for in the two previous elections. Whether an individual voted or not is later

 11
certified by the Electoral Committee and self-reported party votes closely match actual voting
patterns in aggregate data (refer to Figure 1). In 1993, 2,232 individuals were surveyed,
increasing to 4,113 individuals in 1996.

The main advantage of using the NZES as opposed to using official election data is that it
collects a wide range of information on individual characteristics, political opinions, political
behaviors, and policy concerns that allow us to examine the channels through which shocks
influence voting behavior and examine the importance of other factors that lead individuals to
vote for NZF. Importantly, starting in 1996, an individual’s place of residence is geocoded to
their census meshblock, which is the smallest geographic area defined by Statistics NZ and
contain, on average, 150 individuals. We exploit this information to both measure the
characteristics of the local area (at the area unit – AU – level which is equivalent to an urban
suburb or rural town) and to link individuals to their local labor market area (LMA or
commuting zone), which is the natural geography for assessing the political impact of the
shocks borne by local communities. Unfortunately, in 1993, we can link individuals only to
their electoral district (ED), which reduces the precision of our estimates of the impact of
localized shocks.11

3.2. Defining Shocks

We define two shocks related to the economic history of NZ using the universe of individual-
level observations from the 1986, 1991, and 1996 census. Beyond having access to data on the
full population, we also know the meshblock of each household and hence can match
individuals perfectly to AUs, LMAs, and EDs. This allows us to measure shocks and local area
characteristics with minimal measurement error.

We define the ‘structural reform shock’ experienced by an individual living in a particular
LMA or ED, as the change in average log real income between 1986 and 1991 in that location.
We focus on the difference in this five-year period because previous work has shown that this
is when the largest industry-specific shocks were experienced (Stillman et al. 2010). Similarly,
we define the ‘immigration shock’ experienced by an individual living in a particular LMA or
ED as the inflow of new migrants in the five years prior to the election being examined as a

11 Papps and Newell (2002) use travel-to-work data from the 1991 census data to define 140 LMAs that are self-
contained commuting zones. In urban areas, LMAs generally encompass the main urban area and an extensive
catchment area. In rural areas, LMAs tend to consist of numerous small areas, each centred on a minor service
centre. Electoral districts (ED) are updated after each census by a special commission and designed to contain the
same number of individuals with only a 5% permitted variation. Hence, in urban areas they tend to be quite small,
while they can be very large in sparsely populated rural areas.

 12
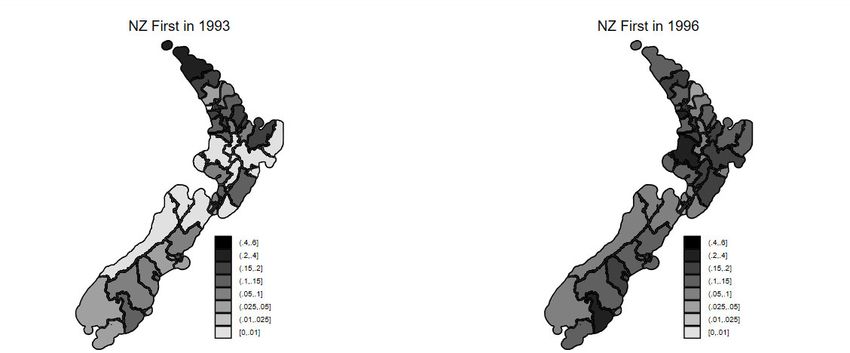
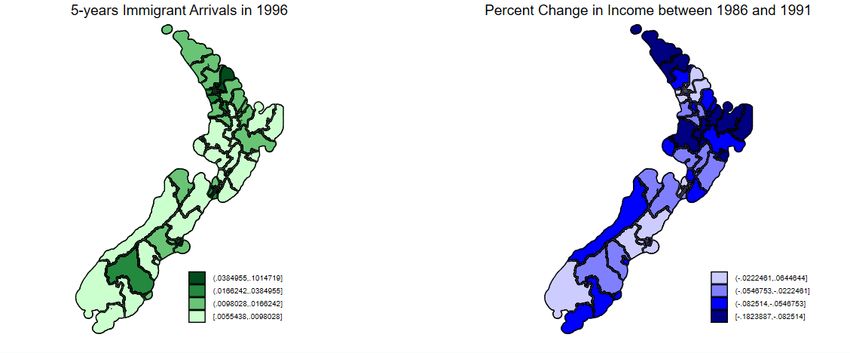
percentage of the local population at the start of the period (so the 1988-1993 period for the
1993 elections and the 1991-1996 period for the 1996 elections).12 As discussed above, during
this period the migration inflow was historically large and the ethnic composition of the inflow
was a radical departure from previous migration waves (Statistics New Zealand, 2010).

As we assign individuals based on their current location, this will introduce measurement error
bias leading towards finding smaller impacts of the economic shocks. The NZES asks
individuals how long they have lived in their current community and, in 1996, 70.7% report
living in the same community as ten years earlier when the shocks occurred. Our main results
are unaffected if we restrict our analysis to this selected subsample.

Figure 2 shows the spatial distribution of the shocks as well as vote shares for NZF across
electoral districts. There appears to be a strong correlation between local areas experiencing a
larger structural reform shock and a higher local vote share for NZF. There is less evidence of
a relationship between immigrant inflows and voting for NZF. This is unsurprising as
immigration is highest in the big cities where voting for NZF is less prevalent.

3.3. Empirical Strategy

We start by examining the relationship between the income and immigration shock experienced
by an individual and whether they cast their party vote for NZF in the 1993 and 1996 elections.
Specifically, we estimate the following regression model by OLS separately using the 1993
and 1996 waves of the NZES linked to the appropriate census data:

 ImmSh ℎ

where VoteNZFij is an indicator for whether individual i living in community j voted for NZF,
ImmShj is the share of recent immigrants in that community, IncShj is the mean (log) decline
in income experienced between 1986 and 1991 in that community and X is a vector of control
variables that varies across specifications with all regressions including controls for gender,
age-group, ethnicity, immigration status, education, employment status, (log) household
income, religiousness, and place of residence among big cities (Auckland, Wellington,
Christchurch), cities, towns and rural areas.13

12 New migrants include all foreign-born individuals who arrived in NZ in the previous five years. As 1993 is not
a census year, we use the self-reported number of years spent in NZ for immigrants in the 1996 census to calculate
the inflow between 1988 and 1993.
13 We categorize as religious any individual who attends a religious service at least 2 times a month. Household
income is categorical; we impute a continuous measure using the mid-point of each category.

 13
We begin by focusing on electoral districts (EDs) as our measure of community as this is the
most disaggregated geographical information available in the 1993 data. However, the majority
of our analysis focuses on the impact of shocks on local labor market areas (LMAs) because,
as discussed above, these are a more relevant geographical unit for thinking about how
individuals living in an area experience the two shocks we measure. As shocks vary only at the
ED or LMA level, standard errors in all models are clustered at the appropriate geographical
level.

Beyond LMAs being a more relevant geography, starting in 1996, when we focus on variation
at the LMA level, we can also further control for characteristics of the local area (suburb or
rural town) where an individual lives. Specifically, we control for the total population, the
unemployment and employment rate, the average (log) individual income, the Gini index, and
the percentage of people with different qualifications, in different age groups, who are female,
and who are Maori.14 In these models, we also control for the ED in which a person resides. In
urban areas, LMAs include many EDs, while in rural areas, EDs always overlap with multiple
LMAs. Hence, we can always separately identify the impact of being in a particular ED. This
is potential important as it controls for any localized political responses to having experienced
particular shocks.

Table 2 provides summary statistics for the 1993 and 1996 NZES, as well as our measures of
shocks and local area characteristics. We present these for the full samples and for the samples
we use in our analysis. In 1993, we drop from our analysis sample 7 people because they are
missing gender and 14 because they did not provide information on their electorate. In 1996,
we drop from our analysis sample 18 people because they are missing gender and 622 because
they did not provide enough information for their address to be matched to a census meshblock.
For all other independent variables in our regression, we include dummies for individuals
missing the information so they can be included in the analysis. Fortunately, as can be seen in
Table 2, the characteristics of the individuals missing locational information are quite similar
in general to the overall sample, hence we do not expect this to impact the external validity of
our findings even in 1996. Supporting this, we are able to include most of these individuals in
our ED level analysis for 1996, and this has little qualitative impact on our results.

14 When we examine the impact on voting in later elections, we interpolate these socio-economic characteristics
from the closest censuses: given that in New Zealand there are elections every 3 years and censuses collection
every 5 years, there is no election that is far more than 2 years from the census.

 14
The average individual in the NZES in both 1993 and 1996 lives in an area where nearly 3
percent of the population are immigrants who have arrived in the previous five years. On
average, almost half of these new arrivals are from Asia. The average individual also lives in a
community which experienced around a 5 percent income decline between 1986 and 1991.
Comparing individual to local characteristics in 1996 makes apparent that participants in the
NZES are, on average, older and more educated than the general population.15 This is typically
found in electoral surveys. As discussed later in the paper, we find very little heterogeneity in
the impact of shocks by sociodemographic characteristics, suggesting that this skewness is not
important for interpreting out results.

A concern with the regression model outlined above is that shocks could be endogenously
determined with voting behavior. For example, immigrants might avoid moving to areas with
anti-immigrant sentiments and instead locate in more open-minded areas where populism tends
to be less attractive. This endogenous sorting would lead us to underestimate the impact of
immigration on populist voting. Similar issues exist when examining the impact of structural
reforms. For example, if workers most affected by structural reforms are both more likely to
leave a community and to vote for a populist party, this sorting would lead to a downward bias
in estimated impact of the structural reform shock. It is also possible that biases could work in
the other direction, for example, if factors influencing the severity of the impact of the structural
reforms also directly influenced voting preferences a decade later.

In order to address these endogeneity concerns and produce consistent estimates of the impact
of immigration and structural reform shocks on voting for NZF, we use an instrumental variable
approach. As is well known, new migrants tend to settle in locations where co-nationals from
earlier immigration waves already live (Bartel 1989). Hence, we follow the approach originally
proposed in Altonji and Card (1991), and used in many subsequent papers, and predict the
number of migrants who would move to a local community only because of network effects.
Specifically, we calculate

 ^
 ℎ ∑ (2)

 ^
where ℎ is the predicted share of recent immigrants in location at time t and is equal
to the number of immigrants originating from country in the five years prior to time t at the

15 This is the case even after using the provided weights that are designed to increase the representativeness of
the survey. We use these weights throughout our analyses. The NZES collects household income and the census
individual income so these cannot be directly compared.

 15
national level multiplied by the county of birth distribution in each location in 1986. As we
have access to the full population census data, we are able to examine networks at an extremely
disaggregated level aggregating over 124 countries of origins.

While this instrument has been used in thousands of past papers, recent work has argued that,
if the spatial distribution of immigrant inflows is stable over time, the instrument is likely to be
correlated with previous location decisions leading to mis-estimation of the causal impact of
recent migration (Jaeger et al. 2018). In our context, the large reform of the immigration system
that started in 1987 reduces concerns that new immigrants are drawn to the same areas as past
immigrants because of economic fundamentals. Furthermore, prior to the reform, the political
debate around immigration in NZ was drastically different, as outflows were larger than
inflows and migration was mainly from European countries.

We use a similar approach to derive an instrument for the size of the structural reform shock
experienced by each community. As discussed earlier, the impact of the structural reform
process varied a great deal across industries with manufacturing and agriculture strongly
impacted by the opening of free trade and removal of subsidies. Hence, we use the industry
distribution in different locations to predict the spatial distribution of the structural reforms.

Specifically, we calculate
 ^
 ℎ ∑ ℎ (3)

 ^ is the predicted income loss in location and is equal to the distribution of
where ℎ
employment in 265 4-digit industries in each location j in 1986 multiplied by the loss in income
at the national level in each of these industries between 1986 and 1991. We also treat non-
employment as an industry in order to capture the impact of the large changes in the welfare
system that accompanied the reforms. The industry distribution in 1986 was primarily driven
by long-term comparative advantage and the incentives of the pre-structural reform period,
hence the distribution of shocks should be exogenous relative to prior economic and political
outcomes.

To assess the validity of our instruments, in Table 3, we present results from regressions of the
two instruments on voting in the 1984 election, which was prior to the start of the structural
reform process and change in the immigration system. Here, we use official polling data at the
area unit level and also include controls for AU characteristics. We find no relationship
between either predicted migration flows or structural reform shocks and whether individuals
voted in 1984 for the traditional parties of Labour and National as opposed to a precursor

 16
protest party called Social Credit, which received 7.6 percent of the vote in that election. The
effect sizes for both variables are small and we fail to reject that they are jointly unrelated to
voting patterns with a p-value greater than 0.70.

Figure 3 plots predicted versus actual shocks across the 140 LMAs in 1996 with the size of
each point reflecting the population of the LMA. Each graph also shows the fitted linear
relationship between predicated and actual shocks where LMAs are weighted by their
population. This is a graphical representation of the two first-stages of our regression model.16
A one percentage-point change in the predicted migration (structural reform) shock is
correlated with a 0.95 (2.41) percentage-point change in the actual migration (structural
reform) shock, which is significant at the 0.01 (0.001) percent level. This shows that both of
our instruments have good predictive power. We discuss the first-stage regressions in more
detail below.

4. Results
4.1. Main Results

In Table 4, we report results from estimating various specifications of regression model (1).
The first four columns present the OLS results from 1993 and 1996 elections at ED level.
Shocks are positively correlated with voting for NZF in both years, although only the
coefficient for the immigration shock in the 1996 elections is (weakly) significant. If we instead
estimate the model for 1996 using LMA level variation, but otherwise keep the same control
variables, we find similar point estimates for our shock variables, and both are now statistically
significant at the 5 percent level. Here, a one percentage-point increase in recent arrivals is
associated with a 0.82 percentage-point increase in the share of votes for NZF and a one
percentage-point increase in income loss is associated with a 0.53 percentage-point increase.
Including additional controls for local area characteristics and electoral district fixed effects
has a small impact on the point estimates, although now the impact of the immigration shock
is no longer significant.

As discussed above, one might be concerned about the endogeneity of shocks, particularly in
regard to the sorting of immigrants and natives across locations. The next four columns of
Table 4 present the results for the same models but using the instrumental variables described
above. Appendix Table 2 presents the two first-stage regressions corresponding to each of these

16 This is only true in a simplified sense because in the actual instrumental variables model both instruments are
included as regressors in each first-stage along with all the other included control variables.

 17
specifications. As hinted at in Figure 3, the instruments are generally strong, particularly in our
preferred specification that focuses on LMAs and controls for local area characteristics and ED
fixed effects (here, the F-stat is 20.0 for the immigration shock and 38.7 for the structural
reform shock, and the joint significance F-stat is 847). In each specification, we can rule out
that the model is underidentified. While the estimates for 1993 are still imprecise, all
specifications for 1996 find a significant effect of the immigration and structural reform shocks
on voting for NZF.

In our preferred specification with the most complete set of controls, we find that a one
percentage-point increase in recent arrivals causes a 4.78 percentage-point increase in the NZF
vote share while a one percentage-point greater income loss causes a 1.32 percentage-point
increase in vote share relative to a mean vote share of 10.7 percent for NZF. The increased size
of the coefficients with respect to the OLS estimates likely indicates that immigrants do indeed
avoid moving to locations that are receptive to populist voting and that individuals most
negatively impacted by economic reforms and likely to vote for NZF are more likely to have
moved away from impacted locations.

In Figure 4, we illustrate the size of these impacts by predicting the vote share for NZF in 1996
across the quantile distribution of each shock variable, holding all other variables constant.
This is done using the preferred IV specification with the most complete set of controls. In
LMAs where recent arrivals are in the first quartile, NZF is predicted to get slightly more than
4 percent of the votes, while if the arrivals are in the highest quartile, the votes share for NZF
would instead be 25.8 percent. For the structural reform shock, the vote share for NZF increases
from 5.7 percent in LMAs in the first quartile of the structural reform shock distribution to 19.8
percent in the highest quartile. It is clear from this figure that the size of the shocks experienced
by an individual are important for explaining whether they voted for NZF in 1996.

In column 9 of Table 4, we examine whether the source of recent immigration matters. We do
this by splitting the immigration shock variable into additive “Asian” and “Non-Asian”
components. Recalling that most Asian immigration is new to NZ since the change in the
immigration system, our instrument for Asian immigration is unsurprisingly weaker than for
non-Asian immigration. However, we find a large statistically significant impact of Asian
immigration and a negative but very imprecisely estimated impact of non-Asian immigration.
While we need more precision to say anything definitive here, there is strong suggestive
evidence that the changing composition of migration to NZ was an important component
leading to the development of NZF. We also examined whether there was an interaction

 18
between the immigration and structural reform shock and, perhaps surprisingly, found the
impacts are essentially orthogonal.

In our final specification, we add controls for a wide range of political opinions, beliefs, and
policy preferences. Specifically, we include variables for own ideological position, own
opinion on the position of NZF, trust in the Labour and National parties, mistrust toward
mainstream parties, opinions about main party leaders, opinions about the country’s financial
situation, immigration, taxes, redistribution and social conservatism, and previous voting in
1990. The variables are clearly along the causal chain when evaluating the impact of the shocks
on voting for NZF; we also consider them as outcomes in later analysis. Including them here
allows us to estimate how much of the effect of shocks on voting for NZF occurs via changes
in these characteristics. The estimated coefficients on both shock variables decrease in this
specification by 29%, so nearly one-third of the impact of shocks on voting for NZF occurs
because of the impact of these shocks on political opinions, beliefs, and policy preferences.

In Table 5, we use our preferred IV specification to estimate the impact of shocks on voting for
other political parties and whether people vote.17 We do not find any significant impact of the
shocks on the other political parties or turnout. Votes for Labour move in the same direction as
those for NZF, while votes for National and Alliance move in the opposite direction, but all
point estimates have very high standard errors compared with the size of the coefficients.
Labour and National could well have been considered by the electorate as responsible for the
effect of the reforms that followed the economic crisis and for opening up NZ to new migration
in the same respect, but Alliance was never in government and was a left-wing party whose
policy platform focused on mitigating the impact of the economic shocks causes by the
structural reform process. Hence, the results here are consistent with shocks pushing people
towards populism as opposed to towards parties with particular policy platforms.

4.2. Impact on Beliefs and Political Preferences

In this section, we examine the impact of shocks on beliefs and political preferences. We do
this to better understand how the impact of the shocks translated into the emergence of
populism. We estimate the same model as in the previous section focusing on the instrumental
variable specification that includes controls for area characteristics as well as ED fixed effects,

17 Guiso et al. (2017) finds that populist parties impact turnout in Europe and that this is an important component
of how they gain votes.

 19
but now we examine the impact on a wide range of outcome variables that measure beliefs and
political preferences in 1996.

Table 6 presents the results of this analysis: each line corresponds to a separate regression run
for a different dependent variable with only the coefficients on the shock variables and their
associated standard errors presented in the columns next to them. Shocks do not impact own
left/right ideology or an index of self-reported social conservatism. On the other hand, we find
impacts on particular policy preferences with the two shocks working through quite distinct
channels. Experiencing a larger immigration shock causes individuals to report themselves as
being more hostile to immigration and that defense and law and order should be more important
policy areas. Experiencing a larger income loss from structural reforms causes individuals to
report themselves as being more in favor of redistribution, that they believe recent policies
were bad for the country, and that unemployment should be a larger and economic growth a
smaller policy concern.18 In both cases, the results are consistent with how one would imagine
these particular shocks impacting individuals.

We next examine whether shocks impacted populist beliefs, in particular whether people
believe that a strong leader is needed and if they mistrust both traditional political parties. Here,
we assign the value 1 if the subject trusts neither the Labour nor the National party and 0 if
they trust both parties. When they express a positive judgment only on one of them, the variable
is coded as 0.5. A majority of individuals (50%) aspires for a strong leader, while only 27%
are against a strong leader, and 15% of individuals mistrust both traditional parties in
comparison to 10% who trust both. We find that experiencing a larger size of either shock
causes people to think that a strong leader is needed and increases their mistrust of traditional
parties. The magnitudes of the effects are similar in size to the impacts that the shocks have on
voting for NZF.

A strand of the political science literature emphasizes the role of leaders in explaining the
emergence of populism (Weyland 2001; Laclau 2005). For this reason, we also test whether
experiencing shocks affects how individuals feel about the leaders of the main political parties,
namely Winston Peters for NZF, Jim Bolger for National, and Helen Clark for Labour. These
variables are coded as 1 if an individual says they trust the specific politician. We find some

18 These variables are generally yes/no questions where individuals can also choose “indifferent or undecided”.
We code these variables as 0 for no, 1 for yes and 0.5 for neither yes nor no. The results are generally insensitive
to instead dropping undecided people. We have included here the full set of policy areas that individuals were
asked about in the survey.

 20
You can also read