THE OVERALL CO2 IMPACT FOR DRIVE TECHNOLOGIES IN INDIVIDUAL TRANSPORT TODAY AND IN THE FUTURE - LIFE CYCLE ANALYSES AS THE BASIS FOR TARGETED ...
←
→
Page content transcription
If your browser does not render page correctly, please read the page content below
THE OVERALL CO2 IMPACT FOR
DRIVE TECHNOLOGIES IN
INDIVIDUAL TRANSPORT TODAY
AND IN THE FUTURE
LIFE CYCLE ANALYSES AS THE BASIS FOR
TARGETED CLIMATE POLICY AND
REGULATION
November 2019
Study commissioned by:

UNITI Bundesverband mittelständischer Mineralölunternehmen e. V.
Jägerstr. 6
10117 Berlin
www.uniti.de
   030 755 414 300

Contacts
Dirk Arne Kuhrt
    kuhrt@uniti.de

Elmar Kühn
    kuehn@uniti.de

Adem Ates
    ates@uniti.de

Jens Perner                                                           Theresa Steinfort
      +49 221 337 13 102                                                     +49 221 337 13 139
      jens.perner@frontier-economics.com                                     theresa.steinfort@frontier-economics.com

Frontier Economics Ltd is a member of the Frontier Economics network, which consists of two separate companies based in Europe (Frontier
Economics Ltd) and Australia (Frontier Economics Pty Ltd). Both companies are independently owned, and legal commitments entered into by
one company do not impose any obligations on the other company in the network. All views expressed in this document are the views of Frontier
Economics Ltd.
THE OVERALL CO2 IMPACT FOR DRIVE TECHNOLOGIES IN Individual
TRANSPORT TODAY AND IN THE FUTURE
CONTENTS
Summary 4
1. Purpose and background to the study 10
2. The public view of solutions for reducing CO2 in road transport is still limited 13
2.1 Achievement of the climate protection goals requires massive reductions in CO 2 emissions, including
in road transport 13
2.2 The current car fleet with its modern drive technologies primarily uses liquid fuels 15
2.3 CO2 savings in transport can be achieved in a variety of ways and make sense 16
2.4 Technological diversity meets narrow political regulations 17
3. The change from the ground-up to the bird's eye perspective has been started and is
making progress 20
3.1 A comprehensive life cycle analysis forms the basis for robust strategies and sustainable concepts 20
3.2 This year, the focus of public debate has already been expanded 23
3.3 Our study is designed to encourage higher transparency and fact-finding 24
4. A bird's eye perspective already reveals new findings 26
4.1 From a comprehensive perspective, CO2 emissions are unexpectedly high in battery electric cars 26
4.2 The advantage of BEV over ICEV varies significantly from case to case 28
4.3 Many influencing factors determine the overall CO2 impact of the drive technologies in individual
cases 37
5. In future, with ICEV and BEV, there will be at least two technology options for
sustainably reducing CO2 41
5.1 In the future, ICEV CO2 reductions are possible through the blend-in of e-fuels 41
5.2 By blending in e-fuels, also in the future the overall CO2 impact of the ICEV and BEV will remain at
the same level 44
5.3 As renewable energy shares increase, targeted technology options will be available with ICEV and
BEV 45
6. From a regulatory and climate policy perspective, a move towards technological open-
mindedness is required 48
6.1 E-fuels must be promoted on an equal footing alongside electromobility for climate policy reasons 48
6.2 Costs and customer needs also favour an equal-status technology mix 49
6.3 The next steps are crucial 56
Annex A Directory of Abbreviations ...................................................................................... 59
Annex B Analytical Methods ................................................................................................. 60
Annex C Limitations of our analysis at the various stages of the added value chain ............ 64
frontier economicsTHE OVERALL CO2 IMPACT FOR DRIVE TECHNOLOGIES IN Individual
TRANSPORT TODAY AND IN THE FUTURE
SUMMARY
In the context of the Paris Climate Agreement, Germany and the
European Union have set themselves ambitious goals for reducing
greenhouse gas emissions ("GHG emissions") by 2050. This goal
requires ambitious CO2 reduction strategies in all sectors that
consume energy. This includes the road transport sector, whose
GHG emissions have recently attracted much political attention.
Despite increasingly efficient vehicles, growing demand for mobility
has meant that it has not been possible to reduce GHG emissions
in the transport sector since 1990. Against this backdrop, a fierce
debate around energy policy has begun with respect to which
concepts and technologies can be used in road transport to achieve
a massive and long-term reduction in CO2 emissions.
This study aims to investigate the climate impact of various types of
drive over the entire lifespan of the vehicles, with a focus on battery
electric vehicles and vehicles with combustion engines (using
modern-day fuels and the inclusion of "green" e-fuels). At the centre
of this is a comparison between the two options of "renewably
generated charging current" and "renewably generated liquid fuels".
In this context, we will look at the current situation as well as future
scenarios in which the provision of drive energy will become
increasingly green, both on the side of electricity and on the side of
liquid fuels.
The study and the associated calculation tool (Excel model)
highlight cause-and-effect relationships and results that are
intended to add transparency and comparability of technological
approaches to reducing life-cycle CO2 emissions. This provides a
basis for easier development of technologically sound and robust
strategies.
The results can be summarised as follows:
CO2 savings in transport can be achieved in various ways
One lever is the conversion of vehicles to fuel-efficient drives such
as battery electric vehicles (BEV) or highly efficient combustion
engines (ICEV - internal combustion engine vehicles). Another lever
is the switch from fossil to climate-neutral drive energies such as
green electricity for charging or liquid fuels (e-fuels) generated from
renewable energies.
frontier economics 4THE OVERALL CO2 IMPACT FOR DRIVE TECHNOLOGIES IN Individual
TRANSPORT TODAY AND IN THE FUTURE
However, a narrow perspective (a focus on direct rather than
system wide-emissions) and political regulations pose
Figure 1. Comprehensive LCA challenges for technological diversity
considers all life
In some areas of policy, especially surrounding passenger transport
cycle stages
(passenger cars), BEVs are regarded as the technological solution
Vehicle
Cradle-to-Gate
of choice for reducing CO2 emissions. In the current public debate,
production battery electric vehicles are regarded as emission-free since no CO2
emissions are produced directly from using the vehicle. In contrast
to this, vehicles with a combustion engine (ICEV) always produce
CO2 emissions when used. Where this system or accounting limit,
that looks only at directly use-related emissions (tank-to-wheel), is
applied, a battery electric drive has a clear advantage over a
combustion engine drive in terms of the CO2 impact. As a result,
Life cycle assessment: Cradle-to-Grave
various climate policy decisions both in Germany and at EU level
Fuel production are currently one-sidedly orientated towards battery electric
Well-to-Tank
vehicles.
A comprehensive life cycle analysis forms the basis of robust
strategies and sustainable concepts
In the restricted tank-to-wheel scenario outlined above, only one
In focus of recent section of the life cycle – the use of the vehicles – is considered. To
legislation consider and evaluate technology options as comprehensively as
Tank-to-Wheel
Use phase possible in terms of their effects on the climate, however, the
perspective needs to be extended towards a comprehensive
(cradle-to-grave) life cycle analysis (Figure 1). In this case, the
generation of drive energy and the disposal or recycling of the
vehicle are taken into account alongside the mere use phase.
Further, not only emissions associated with the production of a
vehicle in Germany or the EU are considered, but also in supplying
countries such as China. In our study, we calculate life cycle
emissions exemplary for four segments of vehicles – three car
End-of-life/ segments (compact, medium-sized and SUV) and the lightweight
End-of-Life
recycling commercial vehicle segment (LCVs).
A bird's eye view already reveals new findings
Taking into account all life cycle stages, the CO2 emissions of a BEV
are unexpectedly high. Mostly, the very energy-intensive production
Source: Frontier Economics of batteries is responsible for the CO2 emissions, but so is the
generation of electricity for charging , that is produced with a high
share of fossil fuels in many places. Adding to this is the fact that
CO2 emissions are nowadays to a considerable degree "exported"
from Germany and the EU to third-party states. The production of
batteries for medium-sized vehicles generates GHG emissions of
more than 9 t of CO2 when the batteries are produced in China, for
example. With these emissions alone – before a BEV has even
been driven a single mile – medium-sized vehicles with diesel drive
can travel around 56,000 km using today's fossil fuels.
frontier economics 5THE OVERALL CO2 IMPACT FOR DRIVE TECHNOLOGIES IN Individual
TRANSPORT TODAY AND IN THE FUTURE
Figure 2 Many influencing A comparison of the climate impact of BEVs and ICEVs over the
factors determine the entire life cycle reveals that the differences are relatively small in
overall CO2 impact in many cases and that, in fact, no one technology is superior. Instead,
individual cases many different factors can determine the overall CO2 impact in each
Vehicle type
case. The most important factors, alongside the electricity and
energy mix of the manufacturing and operating countries, are, for
Year of acquisition example, a vehicle’s size, its range and its lifetime mileage(Figure
2). The following trends can be observed with respect to the climate
Operating lifetime in years
impact:
Annual driving distance, km
ICEVs have an advantage for larger vehicles and over longer
Battery capacity, kWh (tank size) ranges: as a result of the energy-intensive battery production
process, the BEV starts out with a heavier "CO2 burden" than
Fuel
the ICEV. As the size of the vehicle and its range increase, so
Progression of electricity mix too does the size of the required battery, with corresponding
impacts on the CO2 emissions during battery production.
Operating country
BEVs have an advantage under longer lifetime mileages: The
Electricity mix in operating country production of electricity for charging for BEV operation is
currently – and for the foreseeable future – associated almost all
Production country of battery
over the world with CO2 emissions. In many cases, however,
Electricity mix in production country of battery battery electricity emissions are overall lower than the emissions
that are produced from the use of fossil fuels in an ICEV. In these
Source: Frontier Economics
cases, a BEV can compensate for the higher manufacturing
Note: The cause-and-effect relationships of
these and other influencing factors can emissions compared to an ICEV when driven up to a high
be analysed in the calculation tool. mileage during the use phase.
In the future, too, both ICEVs and BEVs are technology
options for sustainably reducing CO2
In future, both BEV and ICEV have the potential to contribute
towards achieving climate targets. Not only does the increasingly
renewable energy-based production of vehicles play a decisive role
here, but so too does the provision of renewable energy-based drive
energy. The CO2 footprint of ...
... BEVs can be reduced in the future if electricity from renewable
energies is used for battery production and the CO2 intensity of
the electricity for charging is reduced.
... ICEVs can be significantly reduced in the future by using more
bio-fuels and especially synthetic fuels, made from renewable
energies and therefore climate-neutral (e-fuels), instead of the
fossil fuels (with small amounts of bio-fuels added) used
currently.
Blending-in e-fuels (for ICEV) and the increasing generation of
production and battery charging electricity from renewable energies
(for BEV) are therefore both options for reducing CO2 in the
transport sector. Maintaining a wide variety of vehicle types and
drive technologies also offers the potential to meet the various
mobility requirements in the future without compromising climate
frontier economics 6THE OVERALL CO2 IMPACT FOR DRIVE TECHNOLOGIES IN Individual
TRANSPORT TODAY AND IN THE FUTURE
protection targets or practical reliability. The respective areas of
application are diverse:
BEVs offer a good prospect for lighter passenger cars on shorter
distances in regions with an easily expandable charging
infrastructure (e.g. also for light commercial vehicles used over
short distances).
ICEVs, with the growing use of e-fuels, are ideal for cars with
high performance requirements (such as from the medium-sized
class upwards) or in the case of LCVs with higher technical
demands (range, cargo).
Figure 3 shows how the use of a variety of technology options can
also make sense from the perspective of climate policy. The figure
shows the average CO2 emissions (g (CO2)/km) over the life cycle
of various vehicle types with various sizes, ranges, lifetime
mileages, production and operating countries for 2020 and 2040.
For the longer term, we have assumed both a greener electricity mix
for the electricity for charging used in BEVs (average CO2 intensity
between 2040 and 2050 at 82% in the reference case in the EU, for
example) and an increasing blending share of e-fuels (average 70%
in the period from 2040 to 2050). Points above the red line indicate
advantages of ICEVs regarding the climate impact, while points
below the line indicate advantages of BEVs.
So, comparing the climate impact between BEVs and ICEVs, it is
apparent that differences are relatively small in many cases, and
that the overall CO2 impact varies from case to case.
frontier economics 7THE OVERALL CO2 IMPACT FOR DRIVE TECHNOLOGIES IN Individual
TRANSPORT TODAY AND IN THE FUTURE
Figure 3. Climate impact advantages of ICEVs and BEVs vary between application cases in the
short and long term as electricity and fuel mix become "greener"
350
ICEV advantageous
300
250
BEV 200
advantageous
BEV
150
100
Line of indifference
Neutralitätslinie
50
2020
2040
0
350 300 250 200 150 100 50 0 g(CO2)/km
ICEV
Source: Frontier Economics
Note: The figure compares the emissions of otherwise structurally identical vehicles with battery drive and combustion engine drive for
various analysis sensitivities. The vehicle type, the duration of use and the annual performance, the country of operation and
production, as well as the assumptions regarding the future development of the electricity and energy mix, were all varied.
"Green" synthetic fuels are also suitable as a medium-term measure
since they can be used without technical modifications to the vehicle
fleet both in Europe and in parts of the world where the
comprehensive use of BEVs is still a long way off due to a lack of
infrastructure. The handling and use of e-fuels are relatively simple,
and their use will become virtually indispensable from today’s
perspective for some applications that are outside the scope of the
areas covered by this study (such as aviation).
From the point of view of climate policy and regulation, a
move towards technological open-mindedness is required
The examined climate impacts of drive technologies in the field of
cars and LCVs have shown that a mix of technologies is preferable
to a limited choice of technologies that is determined from the
outset. To reduce CO2 emissions in the long term, a sensible and
recommendable move would be to design the regulatory
frontier economics 8THE OVERALL CO2 IMPACT FOR DRIVE TECHNOLOGIES IN Individual
TRANSPORT TODAY AND IN THE FUTURE
frameworks such that not only battery electric drives but also drives
based on e-fuels (ICEV) are promoted on an equal footing. The
following steps are required for this (see Figure 4):
Figure 4. The next steps are crucial
Technologies have to be consequently viewed from a bird‘s eye, not from a
Bird's eye view worm‘s eye
Abstain from focus on specific technologies – climate policies must enable and
Technology mix promote a technology mix that is in line with the objective
Fair and technology-open regulatory frameworks have to be implemented as soon
Fair regulations as possible.
e-fuel support National support programs are to be opened for e-fuel initiatives
Innovations on drivetrain technologies and fuels need to be imbedded into an
Overall strategy overall strategy of transport–related policies
Global climate
Transport and climate policies have to be thought of from a global perspective
change
Source: Frontier Economics
frontier economics 9THE OVERALL CO2 IMPACT FOR DRIVE TECHNOLOGIES IN Individual
TRANSPORT TODAY AND IN THE FUTURE
1. PURPOSE AND BACKGROUND TO THE STUDY
Background: The Paris Climate Agreement defines global
greenhouse gas neutrality after 2050 – with a massive
80-95% reduction in GHG also required in the transport sector.
With the Paris Climate Agreement, the global community has set
reduction in CO2 itself the goal of achieving GHG neutrality over the course of the
second half of this century. The European Union is striving to
emissions compared achieve GHG neutrality by as early as 2050. With its 2050 Climate
Protection Plan,1 Germany has set itself the goal of reducing
to 1990 by 2050 greenhouse gas emissions by 80% to 95% compared to 1990 by
is the ambitious goal of the 2050. These goals require ambitious CO2 reduction strategies in all
2050 climate protection sectors that consume energy, including the transport sector.
GHG emissions in road transport in particular have recently drawn
plan in Germany which
political attention. Despite more efficient vehicles, CO2 emissions
requires CO2 reductions in from road transport continue to remain at a similar level to 1990 in
all sectors – including road Germany. At EU level, emissions from the transport sector have
transport actually risen. The reasons for this are primarily the increased
amount of traffic in the freight transport sector and a constantly
growing demand for individual mobility.
Against this backdrop, a fierce debate around energy policy has
sparked regarding concepts and technologies in road transport that
can achieve a massive and long-term reduction of fossil fuels and
therefore CO2 emissions.
0 g (CO2) Battery electric vehicles (BEVs) are regarded in some areas of
policy as the technological solution of choice for reducing CO2
emissions, especially for passenger transport (cars). In the general
per km travelled: current debate, battery electric vehicles are regarded as free of CO2
BEVs are only emission- emissions. This widely held view is based on the fact that there are
no directly use-related CO2 emissions, i.e. at the point at which final
free nowadays from a
energy (electrical energy) is converted into useful energy
limited perspective (mechanical movement).
1
2050 Climate Protection Plan – Climate protection policy principles and targets of the
federal government,
https://www.bmu.de/fileadmin/Daten_BMU/Download_PDF/Klimaschutz/klimaschutzpla
n_2050_bf.pdf
frontier economics 10THE OVERALL CO2 IMPACT FOR DRIVE TECHNOLOGIES IN Individual
TRANSPORT TODAY AND IN THE FUTURE
In contrast, vehicles with a combustion engine (ICEVs) always
produce CO2 emissions in this energy conversion stage. IHere the
liquid fuel available in the fuel tank represents the final energy,
which is then converted into useful energy (mechanical movement).
Where this system or accounting limit (tank-to-wheel) is applied
directly to the vehicle, the battery electric drive always has a clear
advantage over the combustion engine drive in terms of the CO2
impact.
In our study we examine to which extend this narrow system limit
on directly use-related emissions is effective and which emissions
LCA result from an approach that considers all life cycle stages of a
vehicle.
Life cycle assessment Objective: Analysis of the CO2 impact of various vehicle
drive systems over the entire life cycle (LCA – life cycle
provides information on the assessment) today and in the future
overall CO2 impact of drive Against this backdrop, the UNITI Bundesverband mittelständischer
technologies. Mineralölunternehmen e. V. has asked Frontier Economics to
examine the climate impact of various types of drive technologies
over the vehicles' entire life cycle. This study and the associated
calculation tool (Excel model) highlights cause-and-effect
relationships and results that are intended to add transparency and
comparability of possible technological solutions concerning CO2
emissions over the life cycle. Developing technically sound and
robust strategies is easier on this basis.
This study report focuses on the following areas of content:
Section 2 illustrates fundamental solutions for sustainably
reducing CO2 in road transport, the current status of the energy
policy discussions and particularly highlights the limits of the key
analytical and regulatory approaches that are currently used.
Section 3 explains the principle of life cycle assessments (LCA)
which – at least among experts – are being used more and more
(from the tank-to-wheel towards the cradle-to-grave
perspective).
With the aid of selected practical case studies, Section 4
explains that, based on LCA already today and for the
foreseeable future, no drive technologies are generally dominant
over other technologies in terms of CO2 emissions; this is also
true for battery electric vehicles versus combustion
technologies. Much rather, the advantage of technologies
regarding CO2 emissions depends on a range of factors, and
therefore on the individual application case.
Section 5 considers drive technologies given the growing use of
renewable energies both for e.g. the production of electricity and
frontier economics 11THE OVERALL CO2 IMPACT FOR DRIVE TECHNOLOGIES IN Individual
TRANSPORT TODAY AND IN THE FUTURE
of batteries and for the provision of liquid fuels through the blend-
in of green, synthetic gasoline and diesel.
Section 6 summarises the conclusions derived from this study
and sets the results in a wider energy policy context that extends
beyond the accounting of CO2 emissions.
On the basis of the findings of the LCA this study formulates
recommendations for political action . The study therefore intends
to promote the debate regarding future solutions for reducing CO2
emissions in the transport sector.
The study is supplemented by a calculation tool that enables the
user to determine the CO2 impact of vehicles based on assumptions
for all influencing parameters and scenarios. The model can also be
used for a sensitivity analysis of various parameters, i.e. for an
analysis on how parameter variations affect the vehicles' CO2
impact over the whole life cycle as well as in the separate life cycle
stages.
frontier economics 12THE OVERALL CO2 IMPACT FOR DRIVE TECHNOLOGIES IN Individual
TRANSPORT TODAY AND IN THE FUTURE
2. THE PUBLIC VIEW OF SOLUTIONS FOR
REDUCING CO2 IN ROAD TRANSPORT IS STILL
LIMITED
To achieve the climate goals, sustainable solutions for reducing CO2
in road traffic are essential. This section explores the current
situation in the transport sector regarding CO2 emissions, as well as
the challenges around climate policy. We examine different possible
solutions and regulations to assess whether they allow the various
technologies to contribute to CO2--avoidance.
2.1 Achievement of the climate
protection goals requires massive
reductions in CO2 emissions, including in
road transport
The transformation of the energy system in Germany requires a
massive medium-term to long-term reduction in greenhouse gas
emissions in all sectors that consume energy.
This requirement also includes road transport which, like the entire
mobility sector, has seen stagnating emissions in Germany over
recent decades and even rising emissions in Europe since 1990 (cf.
Figure 5).
frontier economics 13THE OVERALL CO2 IMPACT FOR DRIVE TECHNOLOGIES IN Individual
TRANSPORT TODAY AND IN THE FUTURE
Figure 5. In the European mobility sector, reductions in CO2 emissions need to be accelerated
in order to achieve the 2050 climate protection goals
Greenhouse gas emissions in the European Union (base year 1990 = 100)
140
120
100
80
60
40
20
0
1990 2017 2030 2050
Transport Energy industries
Manufacturing industries and construction Agriculture
Industrial processes and product use Households and services
Source: Frontier Economics based on Eurostat, Greenhouse gas emissions by source sector.
Note: Baseline year 1990 = 100.
This rise is primarily due to the increased demand for individual
mobility and the increasing transport of goods by road within the
domestic EU market. Despite this, efforts to reduce CO 2 in the
transport sector were considerable: Between 2000 and 2017, the
31% average CO2 emissions per kilometre of a purchased new car in the
EU were reduced by 31%2 thanks to efficiency improvements.
These efficiency improvements, however, have been more than
lower = CO2 offset by the overall rise in traffic volume.
emissions per km Against this backdrop, a fierce energy policy debate has sparked on
which road transport concepts and technologies can and should
driven contribute to reducing CO2 emissions in Europe and Germany.
today compared to 2000
however at the same time with
a significant rise in traffic
2
Cf. https://www.eea.europa.eu/data-and-maps/daviz/average-emissions-for-new-cars-
4#tab-chart_1
frontier economics 14THE OVERALL CO2 IMPACT FOR DRIVE TECHNOLOGIES IN Individual
TRANSPORT TODAY AND IN THE FUTURE
2.2 The current car fleet with its modern
drive technologies primarily uses liquid
fuels
Concepts and technologies for reducing CO2 emissions in road
transport are not planned and implemented on a "green field", but
instead are faced with the current vehicle fleet and existing transport
infrastructures. As such, it makes sense in terms of future strategies
99.7% for passenger transport to consider the current situation in the
transport sector.
of cars The current technology mix for the car sector in Germany consists
today in Germany are of... 3
equipped with combustion ... 99% vehicles with an internal combustion engine (ICEV).
engines Liquid fossil fuels such as diesel and gasoline based on mineral
oil are mostly used nowadays for drive energy.4
... 0.2% battery electric vehicles (BEV) . Their batteries are
charged with electricity and the BEV is driven by an electric
motor. The charging current is at present mostly generated from
fossil-based energy. In Germany, renewable energies account
for around 38% of the energy mix in generation.5
... less than 0.1% fuel cell electric vehicles (FCEV). FCEVs
are electrically powered vehicles whose drive energy is
generated in a fuel cell from the chemical reaction between
hydrogen and an oxidising agent. The hydrogen used nowadays
is primarily obtained from natural gas and is therefore not
climate-neutral (hence the term grey hydrogen).
…and 0.7% other forms of drives such as hybrid variants of
the drives mentioned above or vehicles with other or gas drive
technologies (CNG, LNG).
The current dominance of liquid fuels both in Germany and
internationally is due to their technical and chemico-physical
properties. Due to the high energy density relative to their volume,
compared to all other energy sources available today liquid fuels
offer:
a high degree of flexibility in use – in all vehicle classes from cars
to heavy goods vehicles.
3
The figures are based on data from the Federal Motor Transport Authority as of 1
January 2019, see
https://www.kba.de/DE/Statistik/Fahrzeuge/Bestand/bestand_node.html
4
Gaseous fuels such as natural gas and hydrogen – currently mainly produced through
fossil natural gas ("grey" hydrogen) – can also be used in combustion engines.
5
Cf. Federal Environment Agency,
https://www.umweltbundesamt.de/presse/pressemitteilungen/bilanz-2018-anteil-
erneuerbarer-energien-steigt-auf.
frontier economics 15THE OVERALL CO2 IMPACT FOR DRIVE TECHNOLOGIES IN Individual
TRANSPORT TODAY AND IN THE FUTURE
excellent transportability – especially where there are long
distances between generation and final use.
good storage capability with a high energy storage capacity.
simple and virtually hazard-free handling at atmospheric
Liquid ambient temperatures and pressures without cumbersome
process technology.
fuels These aspects, however, are offset by the carbon dioxide content of
the waste gases produced during combustion. Based on this
situation, from a climate policy perspective the question arises how
have strengths in
the mobility sector can be designed in a way that enables the
application technology due achievement of the climate goals – ideally without restricting the
to their high energy density increasing mobility demanded by the population and business.
and easy handling
2.3 CO2 savings in transport can be
achieved in a variety of ways and make
sense
Against this backdrop, there are various technical options available
for reducing CO2 emissions to the required extend:
Switch to vehicles with fuel-efficient drives: All things being
equal, more efficient drives save CO2 emissions through the
more efficient use of a fuel. This includes a) highly efficient
combustion engines, b) electric engines and c) fuel cells.
Switch from fossil to climate-neutral drive energies: These
include:
□ Renewably produced electricity for charging: This can be
used in battery electric vehicles.
□ Renewably produced liquid fuels: Conventional diesel and
gasoline fuels can be replaced gradually with bio or e-fuels.
While bio-fuels are based purely on the conversion of
biomass6, e-fuels are synthetic fuels that are produced from
water and carbon by using electricity. If only regeneratively
generated electricity is used, however, and the carbon has
previously been extracted from the atmosphere, for example,
e-fuels are classified as completely climate-neutral7 fuels.
□ Renewably produced "green" hydrogen: While "grey"
hydrogen is produced from a steam reforming process
involving natural gas and therefore causes emissions during
6
The cultivation of plants solely for energy production is however controversial in many
respects. The argument that "energy plants" compete with the cultivation of food is
generally put forward first by critics.
7
From an overall balance perspective, synthetic fuels and combustibles can be produced
in a climate-neutral manner and burned again: although the end use generates CO2
emissions, this CO2 is taken out of the environment during production. The climate
impact is therefore in equilibrium and harmful environmental effects are reduced to
virtually nil.
frontier economics 16THE OVERALL CO2 IMPACT FOR DRIVE TECHNOLOGIES IN Individual
TRANSPORT TODAY AND IN THE FUTURE
production, hydrogen can also be produced in a climate-
neutral way. Green or renewable hydrogen is produced using
renewable electricity and the electrolysis method.
□ Renewably produced methane (through the methanisation
of renewably produced hydrogen and carbon).
In our study, we contrast the options of "renewably generated
electricity for charging" and "renewably generated liquid fuels". We
therefore in particular contrast the CO2 emissions along the life
cycle of battery electric vehicles, which are currently often the
subject of political debate, with those of vehicles driven by
combustion engines that run on liquid fuels. The latter offer the
advantage of being able to build on existing supply infrastructures
and not requiring any changes in use.8
In this context, we look at the current situation as well as future
scenarios in which the provision of drive energy will become
increasingly greener, both on the electricity side and on the side of
liquid fuels, in accordance with the strategies outlined above.
2.4 Technological diversity meets
narrow political regulations
Despite the variety of Despite the diverse technological approaches for implementing the
ambitious climate and CO2 reduction goals in the transport sector, it
potential solutions for
is primarily the battery electric vehicle - especially for passenger
reducing CO2, the political transport (usually cars) but in some cases also for buses and heavy
regulations currently focus goods transport - that is in political circles widely regarded as the
virtually entirely on BEVs only technological solution for reducing greenhouse gas emissions.
Other options, such as switching from renewable energies to
synthetically produced fuels, have so far been dealt with as
subordinate in discussions.
One reason for the political focus on BEVs as the solution of choice
could be that BEVs, unlike ICEVs, are generally perceived by
politicians to be free of CO2 emissions. This can be seen in various
policy announcements and regulatory frameworks, both at
European and national level:
Among the EU emission reduction targets for passenger
cars and light commercial vehicles, the target of an average
maximum of 95 g (CO2)/km per vehicle within a car
manufacturer's vehicle fleet will apply from 2021 (EU fleet
targets9). Among the measurement targets, BEVs are
recognised as emission-free, while for many ICEVs it is
practically impossible to achieve these targets. This is especially
8
For hydrogen and methane too, the transport sector still needs substantial infrastructure
to be built, which is why we are focusing in this study on liquid fuels as an alternative to
battery electric vehicles.
9
Cf. https://ec.europa.eu/clima/policies/transport/vehicles/cars_en
frontier economics 17THE OVERALL CO2 IMPACT FOR DRIVE TECHNOLOGIES IN Individual
TRANSPORT TODAY AND IN THE FUTURE
also true since the use of bio-fuels and synthetic fuels produced
from renewable energies cannot be counted towards the quotas,
or only insufficiently so.
The coalition agreement10 between the CDU, CSU and SPD
primarily makes mention of support for electromobility and the
establishment of an electricity charging infrastructure in the
context of solutions for the mobility sector. A test route for battery
electric trucks in combination with overhead electricity lines on
the A5 motorway has already been set up, for example, and one
on the A1 is in preparation. Without doubt the establishment and
expansion of the charging infrastructure and the promotion of
electromobility can make a contribution towards reducing CO2
emissions in the transport sector, however alternative
technologies are often overlooked. The unilateral focus on
electromobility is therefore being amplified by the current
Pioneering regulations and coalition agreement.
political announcements in Some European countries currently call new ICEV
the EU today are centred registrations into question in the medium- to long-term, such
around just one as in Norway, Ireland or Denmark. Norway aims to have a fleet
technology. of new cars without a single combustion engine from 2025
onwards. Ireland, Denmark and Sweden pursue this goal for
2030, while the UK and France aim for 2040. Financial
incentives are also set to encourage people to buy BEVs.
The reasons why the regulations and political announcements at
European level focus on the supposedly emission-free BEV (cf.
Figure 6) could be these:
the widely held belief that BEVs are emission-free is based on
the fact that there are no drect use-related CO2 emissions,
namelyat the point at which the final energy (electrical energy)
is converted into useful energy (mechanical movement and
other consuming units).
In contrast to this, combustion engines always produce CO2
emissions during this energy conversion stage. Here, the liquid
fuel available in the fuel tank represents the final energy which
is then converted into useful energy (mechanical movement and
other consuming units).
10
Cf. coalition agreement between the CDU, CSU and SPD, 19th parliamentary term
(2018), p.14
https://www.bundesregierung.de/resource/blob/975226/847984/5b8bc23590d4cb2892b
31c987ad672b7/2018-03-14-koalitionsvertrag-data.pdf?download=1
frontier economics 18THE OVERALL CO2 IMPACT FOR DRIVE TECHNOLOGIES IN Individual
TRANSPORT TODAY AND IN THE FUTURE
Figure 6. European policy and regulatory frameworks currently focus on tank-to-wheel
emissions impacts
+ Fahrzeug-
Recent legislation is focused on tank-to-wheel emissions
Kraftstoff- Use phase End-of-Life/
herstellung herstellung Recycling
cradle-to-gate well-to-tank (WtT) tank-to-wheel (TtW) end-of-life
Source: Frontier Economics
Consequently, when defining the narrower "tank-to-wheel" system
limit, battery-electric drive always has a clear advantage over the
internal combustion engine in terms of CO2 emissions. This
definition has so far failed to take into account the following
circumstances, however:
if the entire life cycle (cradle-to-grave) is considered, then
significant amounts of greenhouse gas emissions are produced
even by BEV, especially during the battery production process
and the and generation of electricity for charging.
The questions around raw materials and disposal of components
(e.g. batteries) have still not been fully explored. Energy-
intensive battery recycling could become increasingly
necessary.
The CO2 impact of an ICEV could be improved significantly, for
example with the use of synthetic fuels.
Therefore a wider perspective on technology options that are
generally available on the way towards greenhouse gas neutrality
seems necessary.
frontier economics 19THE OVERALL CO2 IMPACT FOR DRIVE TECHNOLOGIES IN Individual
TRANSPORT TODAY AND IN THE FUTURE
3. THE CHANGE FROM THE GROUND-UP TO THE
BIRD'S EYE PERSPECTIVE HAS BEEN
STARTED AND IS MAKING PROGRESS
In the previous section, we explored the various options for avoiding
CO2 emissions in road transport, whereby transport policy strategies
for climate protection are focusing heavily on the electrification of
transport. We have also found that the rationale for focusing on
electrification is based on a very limited view on CO2 emissions
caused by vehicles or drive technologies, namely directly use-
related emissions from the vehicle’s tailpipe itself.
In this section, we will widen our perspective and take a more
comprehensive view with the concept of the life cycle analysis. On
this basis, the risk of one-sided strategic mistakes and misdirection
in the transport sector, which are usually associated with very costly
corrections, can be reduced. This type of comprehensive approach
is also recommended for the strategic orientation of the transport
sector in the context of the defined GHG reduction targets.
3.1 A comprehensive life cycle analysis
forms the basis for robust strategies and
sustainable concepts
The aim of a comprehensive technology analysis is to consider and
evaluate technology options in as complete a manner as possible in
terms of their impacts on climate and the environment. A
comprehensive life cycle analysis considers the following areas:
Life cycle stages: All of a vehicle's life cycle stages are included
(Figure 7). Not only are the CO2 emissions that are generated
by combusting fuel while driving on the road taken into account,
but so are the emissions produced while generating the drive
energy, for example.
Time component: Aspects that vary with time must also be
measured in a variable way. The CO2 intensity of the energy
sources, for example, changes over the years of use depending
on the proportion of energy produced from renewable sources.
Geographies: Individual life cycle stages for the vehicle in
question (especially production and use phase) can occur in
different geographical regions with different compositions of the
electricity and energy mix. A comprehensive approach includes
CO2 emissions across national and regional borders. Batteriy
production is currently very energy-intensive, and therefore high
frontier economics 20THE OVERALL CO2 IMPACT FOR DRIVE TECHNOLOGIES IN Individual
TRANSPORT TODAY AND IN THE FUTURE
CO2 emissions, outside of Europe and then exported to Europe
(see below). The emissions are then accounted to the supplying
country outside Europe, while the product – the batteries – are
used by consumers in Europe. This "export" of CO2 emissions
to other regions of the world makes Europe's CO2 footprint look
better, but it is counter-productive for climate protection. Life
cycle analyses consider these effects.
Figure 7. Comprehensive analysis approach factoring all of a vehicle's life cycle stages into
the CO2 impact
- Life cycle analysis also includes regularly neglected sources of emissions
LCA: cradle-to-grave
Vehicle Fuel production Use phase End-of-life/
production recycling
cradle-to-gate well-to-tank (WtT) tank-to-wheel (TtW) end-of-life
Source: Frontier Economics
With the LCA approach for vehicles (in this study passenger cars
and light commercial vehicles), the use phase limited accounting is
extended by the following, system-inherent life cycle stages (see
Figure 8):
Vehicle production (cradle-to-gate): In our analysis we focus
on the CO2 emissions generated by producing the components
of the various drive systems and bodywork, as well as
generalised other vehicle components such as vehicle fittings.
Regarding BEVs, the production of the battery in particular
generates CO2 emissions due to the
□ relatively energy-intensive battery production process and
□ the use of electricity from renewable, but also fossil-based,
sources. Today, battery production takes place mainly in
frontier economics 21THE OVERALL CO2 IMPACT FOR DRIVE TECHNOLOGIES IN Individual
TRANSPORT TODAY AND IN THE FUTURE
Asia (approx. 85% of production capacity is based in China,
Japan and South Korea11).
Generation of drive energy (well-to-tank): The production of
486 g (CO2)/kWh
the required fuel or electricity for charging. In this case, the
electricity mix available in the region in which the vehicle is
operated needs to be taken into account. For Germany for
was the average CO2 example, 486 g( CO2) are emitted per kilowatt hour of produced
emission-intensity of the electricity.
electricity mix in Germany Disposal / recycling (end-of-life): So far there has been little
in 201712 empirical evidence regarding the efficiency of recycling or
disposal processes for BEV batteries. Experience comes
primarily from hybrid vehicles, whose batteries are generally 20
to 40 times smaller than the battery of a purely battery electric
vehicle and usually made from different materials. It is likely that
this step of the life cycle is significantly more energy-intensive
than with an ICEV, since the battery module of an electric car
has a complex structure and is very difficult to break down into
its individual components – and it requires a lot of energy to do
so.
It is expected that, considering all life cycle stages, the technology
analysis and evaluation will result in different outcomes and findings
than with a single focus on the vehicle's use phase (tank-to-wheel).
11
See https://boerse.ard.de/anlagestrategie/branchen/zweites-grossprojekt-fuer-
batteriezellfertigung-in-europa100.html
12
Cf. Federal Environment Agency (2019). However, in contrast to our model values, the
CO2 emissions caused by the construction of renewable energy plants such as solar or
wind power plants are not yet taken into account.
frontier economics 22THE OVERALL CO2 IMPACT FOR DRIVE TECHNOLOGIES IN Individual
TRANSPORT TODAY AND IN THE FUTURE
Figure 8. LCAs provide information about real CO2 footprints and allow system comparisons
Vehicle Fuel production Use phase End-of-life/
production recycling
cradle-to-gate well-to-tank (WtT) tank-to-wheel (TtW) end-of-life
CO2-
schematic LCA: cradle-to-grave
BEV
ICEV
Recent legislation Whole spectrum of emissions
Source: Frontier Economics
Note: This is a schematic representation.
3.2 This year, the focus of public debate
has already been expanded
While the regulatory frameworks and political debates currently
focus heavily on supposedly emission-free BEVs, as described in
Section 2.4, the public, scientific and media debate is
steadilymoving towards a broader system view. Experts are
therefore increasingly focusing on comprehensive analytical
approaches to determine climate impacts in the field of drive
technologies used in the transport sector:
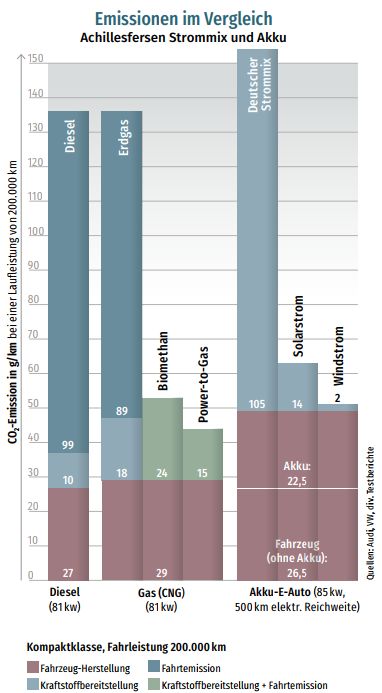
Figure 9. Emissions compared
frontier economics 23THE OVERALL CO2 IMPACT FOR DRIVE TECHNOLOGIES IN Individual
TRANSPORT TODAY AND IN THE FUTURE
Scientific literature has long since used LCAs in the analysis
of greenhouse gas emissions from the various drive types. Just
one example of many is the publication by Ellingsen, Singh and
Stromman (2016), which shows that electric drives are not more
climate-friendly per se than combustion engines, but instead that
the greenhouse gas footprint depends on various assumptions,
including the vehicle class, the battery size and the lifetime
mileage.
The subject is also gaining attention in the public and political
debate. Institutes such as the Ifo Institute (April 2019),
Fraunhofer ISI (February 2019) and the ifeu (April 2019) take
into account not just the emissions from the vehicle's use phase
(tank-to-wheel), but also the greenhouse gas emissions
generated when the vehicle and its fuel are being produced. The
Magazin des Deutschen Alpenverein also found in an article
entitled "Berg-Auto-Zukunft?" ["Mountain-Car-Future?"] that,
with reference to the current German electricity mix, "when
accounted for correctly, [...] battery electric cars are currently not
a real win for the environment".13
Source: Panorama – Das Magazin des
3.3 Our study is designed to encourage
Deutschen Alpenvereins, March
2019, 71st Edition, p. 14 higher transparency and fact-finding
The aim of our investigations is to determine the CO2 impact today
and in the future by taking into account relevant influencing factors
for the BEV and ICEV drive technologies in each life cycle stage.
The analysis is based on a calculation tool that incorporates the
following parameters and therefore covers all factors that are
currently considered to have an influence on the LCA:
Vehicle class: In this version, the compact class, the medium-
sized class, the SUV class and the class of light commercial
vehicles (LCV) are initially taken into account within the
passenger car segment.14
Year of registration and use of the vehicle: Starting with the
year 2020, vehicle registration can be determined up to the
(currently) last time of purchase in 2040. The period of use can
be selected arbitrarily, with 2050 being the last year shown.
Therefore the maximum period of use for a vehicle registered in
2040 is 10 years.
Battery capacity: In principle, our tool automatically determines
the battery capacity used for the CO2 calculation from the choice
of vehicle class. This default setting is based on the
representative battery capacities currently available on the BEV
13
Panorama – Das Magazin des Deutschen Alpenvereins, March 2019, 71st Edition, p.
12.
14
According to the categorisation by the Federal Motor Transport Authority
frontier economics 24THE OVERALL CO2 IMPACT FOR DRIVE TECHNOLOGIES IN Individual
TRANSPORT TODAY AND IN THE FUTURE
market. Users also have the option, however, to make their own
assumptions regarding battery size and to integrate these into
the model.
Annual mileage: The annual mileage can be selected at will.
Fuels, country of production and operation: Thie set of
parameters is completed with the choice of fuel (in this case
there is also the option of modelling the blend-in of e-fuels), the
choice of production and operation country and the progression
of the electricity and energy mix.15
The tool allows to estimate the impact of varying parameters on the
CO2 impact of the considered technologies .16 This means that
assumptions used as a default can be overwritten when new
information comes to light.
The study does not cover the following circumstances so far:
The analysis focuses on estimating CO2 emissions. Other
environmental and climate-impacting aspects, such as water or
raw material consumption, are not taken into account.
The model includes gasoline and diesel ICEVs and BEVs as
drive technologies. Hydrogen or natural gas ICEVs, fuel cell
electric vehicles or hybrid vehicles are not included in the
analysis.
The analysis concludes at a certain level of detail. Not covered,
for example, is the detailed cell structure for the various batteries
available on the market (cf. Annex C).
Individual sub-stages of the added value chain, such as CO2
emissions from the construction of the energy infrastructure (e.g.
electricity networks), charging and filling stations, etc. are not
part of the analysis. The tool therefore includes what has been
identified as the main drivers of CO2 emissions along the
vehicles' life cycle stages.
15
According to scenarios from the World Energy Outlook (WEO) by the International
Energy Agency (IEA).
16
For further explanations of the calculation tool, see also Error! Reference source not f
ound..
frontier economics 25THE OVERALL CO2 IMPACT FOR DRIVE TECHNOLOGIES IN Individual
TRANSPORT TODAY AND IN THE FUTURE
4. A BIRD'S EYE PERSPECTIVE ALREADY
REVEALS NEW FINDINGS
As described, changing from the ground-up to the bird's eye view,
the focus when assessing CO2 emissions shifts from tank-to-wheel
to the LCA or cradle-to-grave approach. We have summarised the
key results of our LCA analyses below. It shows that, from a broader
perspective, the advantageous nature of individual technologies
depends on a number of drivers and on the individual case in
question, making it significantly less clear than is frequently
assumed in the current debate around energy policy.
4.1 From a comprehensive perspective,
CO2 emissions are unexpectedly high in
battery electric cars
As previously presented, the public debate around energy policy
often perceives that battery electric vehicles do not produce any
CO2 emissions. This is not the case, however, as an LCA based on
the example of a BEV – in this case a medium-sized vehicle (Figure
9) – illustrates. Instead, significant CO2 emissions are produced
even with BEVs:
In the use phase, a BEV produces 0 g (CO2)/km in CO2
191 g (CO2)/km
emissions.
Over the BEV's entire life cycle, however, the CO2 impact is
191 g (CO2)/km (Figure 10). Of this number,
and not 0 g (CO2)/km □ 53 g (CO2)/km are generated during production of the vehicle
– especially the battery (with the assumption being that the
is the CO2 impact of an
battery is made in the EU);
example medium-sized
□ 129 g (CO2)/km are generated during the production of drive
BEV today energy (in this case the electricity for charging) in Germany:
this is particularly noteworthy in that a "dynamic"
development of the electricity mix is assumed. With a
"dynamically" specified electricity mix, it is assumed that its
CO2 intensity will be constantly reduced according to the
scenarios through the further expansion of renewable
energies. This therefore means that the electricity for
charging will be associated with increasingly fewer CO2
emissions in the climate impact, year on year, and
□ 9 g (CO2)/km are produced during recycling.
frontier economics 26THE OVERALL CO2 IMPACT FOR DRIVE TECHNOLOGIES IN Individual
TRANSPORT TODAY AND IN THE FUTURE
Figure 10. Overall CO2 impact using the example of a
medium-sized BEV
Zero emissions only when focus is on use phase
Total
g(CO2)/km
1. Vehicle 2. Fuel 4. End-of-life /
production 3. Use phase
production recycling
Source: Frontier Economics
Note: Vehicle type: Medium-sized car, year of purchase: 2020, period of use: 10 years,
annual mileage: 15,000 km, country of operation: Germany (reference scenario),
country of battery production: EU (reference scenario), dynamic
Since this scenario assumes that the battery is produced in the EU,
the comparatively climate-friendly European electricity mix is used
for the required electricity demands. As already mentioned,
however, around 70% of the production capacities for BEV
batteries are currently based in Asia. If, for example, the Chinese
A vehicle's use phase on electricity mix is selected for the "Vehicle production" life cycle
its own has only limited stage, the BEV's CO2 emissions for the entire life cycle increase in
mathematical terms to 223 g (CO2)/km (Figure 11).
informative value for the
emission impact
frontier economics 27THE OVERALL CO2 IMPACT FOR DRIVE TECHNOLOGIES IN Individual
TRANSPORT TODAY AND IN THE FUTURE
Figure 11. Overall CO2 impact using the example of a
medium-sized BEV – Country of battery
production: China
Total
g(CO2)/km
1. Vehicle 2. Fuel 4. End-of-life /
production 3. Use phase
production recycling
Source: Frontier Economics
Note: Vehicle type: Medium-sized car, year of purchase: 2020, period of use: 10 years,
annual mileage: 15,000 km, country of operation: Germany (reference scenario),
country of battery production: China, dynamic
Overall, it is apparent that focusing on the use phase (as described
in Section 2.4) leads to a less meaningful CO2 balance.
Comprehensive analyses are therefore essential for technology
evaluations.
4.2 The advantage of BEV over ICEV
varies significantly from case to case
In a comparison of different technologies, it can be seen under the
LCA approach that the overall emissions of BEVs today and over
the next few years will in many cases be on a similar level to vehicles
with a combustion engine. For example, the CO2 emissions of a
medium-sized vehicle are 198 g (CO2)/km for a diesel engine and
191 g (CO2)/km for a BEV (Figure 12). The minimal difference in the
numbers is due to the fact that
the additional emissions of the ICEV at the vehicle production
stage are significantly lower than those of the BEV, since the
energy-intensive battery production stage is not applicable (+24
g (CO2)/km).
frontier economics 28THE OVERALL CO2 IMPACT FOR DRIVE TECHNOLOGIES IN Individual
TRANSPORT TODAY AND IN THE FUTURE
additional emissions from the production of diesel are also lower
than from the production of electricity for charging based on the
German electricity mix (+ 109 g (CO2)/km).
additional emissions are similar in the disposal stage.
Figure 12. Differences in CO2 emissions between BEV and ICEV are in many cases relatively
small both today and over the next few years
1. Vehicle 4. End-of-life /
2. Fuel production 3. Use phase Total
production recycling
ICEV, conventional diesel BEV
g(CO2)/km
g(CO2)/km
Source: Frontier Economics
+ -146 g(CO2)/km
- - 7 g(CO2)/km
Note: Vehicle type: Medium-sized car, year of purchase: 2020, period of use: 10 years, annual mileage: 15,000 km, fuel: diesel, country of
operation: Germany (reference scenario), country of battery production: EU (reference scenario), dynamic
This result can easily change through varying a variation in the
assumptions. The BEV is at a disadvantage to the ICEV if the
battery for the vehicle is not produced in Europe, but rather for
example in China, based on the local electricity mixed used there
(cf. Figure 13).
frontier economics 29THE OVERALL CO2 IMPACT FOR DRIVE TECHNOLOGIES IN Individual
TRANSPORT TODAY AND IN THE FUTURE
Figure 13. Production of the battery in China worsens the
BEV's CO2 impact
1. Vehicle 4. End-of-life /
2. Fuel production 3. Use phase Total
production recycling
ICEV, conventional diesel BEV
g(CO2)/km
g(CO2)/km
- + 25 g(CO2)/km
Source: Frontier Economics
Note: Vehicle type: Medium-sized car, year of purchase: 2020, period of use: 10 years,
annual mileage: 15,000 km, fuel: diesel, country of operation: Germany (reference
scenario), country of battery production: China (reference scenario), dynamic
The case studies below, in which only the vehicle class is changed,
confirm this result: The advantage of the technologies in each case
varies significantly depending on the case study and assumptions.
Case study – compact class
Due to the relatively low emissions generated during battery
production (the assumption being that in this case a relatively small
battery is installed), a compact class BEV currently has an
advantage over a comparable ICEV. Based on the assumptions
made, the advantage is 15 g (CO2)/km with regard to the km-related
CO2 emissions compared to the ICEV.
frontier economics 30THE OVERALL CO2 IMPACT FOR DRIVE TECHNOLOGIES IN Individual
TRANSPORT TODAY AND IN THE FUTURE
Figure 14. Due to the relatively low emissions generated
during battery production, a compact class BEV
currently has an advantage over a comparable
ICEV
1. Vehicle 4. End-of-life /
2. Fuel production 3. Use phase Total
production recycling
ICEV, conventional diesel BEV
g(CO2)/km
g(CO2)/km
- - 15 g(CO2)/km
Source: Frontier Economics
Note: Vehicle type: Compact class, year of purchase: 2020, period of use: 10 years,
annual mileage: 15,000 km, fuel: diesel, country of operation: Germany (reference
scenario), country of battery production: EU (reference scenario), dynamic
Up to a total mileage of around 80,000 km, the ICEV has an
advantage in terms of overall emissions. From this point onwards,
with each further kilometre driven, the overall CO2 impact improves
in favour of the BEV (Figure 14 and Figure 15)
frontier economics 31You can also read