Predicting Migratory Corridors of White Storks, Ciconia ciconia, to Enhance Sustainable Wind Energy Planning: A Data-Driven Agent-Based Model - MDPI
←
→
Page content transcription
If your browser does not render page correctly, please read the page content below
sustainability

Article
Predicting Migratory Corridors of White Storks,
Ciconia ciconia, to Enhance Sustainable Wind Energy
Planning: A Data-Driven Agent-Based Model
Francis Oloo 1, *    ID
                          , Kamran Safi 2   ID
                                                 and Jagannath Aryal 3   ID

 1    Department of Geoinformatics (Z_GIS), University of Salzburg, Schillerstraße 30, 5020 Salzburg, Austria
 2    Max Planck Institute for Ornithology, Vogelwarte Radolfzell, Schlossalee 2, 78315 Radolfzell, Germany;
      ksafi@orn.mpg.de
 3    School of Technology, Environments and Design, Discipline of Geography and Spatial Sciences,
      University of Tasmania, Churchill Avenue, Hobart, Tasmania 7001, Australia; Jagannath.Aryal@utas.edu.au
 *    Correspondence: francisomondi.oloo@sbg.ac.at; Tel.: +43-662-8044-7569

 Received: 6 March 2018; Accepted: 5 May 2018; Published: 8 May 2018

 Abstract: White storks (Ciconia ciconia) are birds that make annual long-distance migration flights
 from their breeding grounds in the Northern Hemisphere to the south of Africa. These trips take place
 in the winter season, when the temperatures in the North fall and food supply drops. White storks,
 because of their large size, depend on the wind, thermals, and orographic characteristics of the
 environment in order to minimize their energy expenditure during flight. In particular, the birds adopt
 a soaring behavior in landscapes where the thermal uplift and orographic updrafts are conducive.
 By attaining suitable soaring heights, the birds then use the wind characteristics to glide for hundreds
 of kilometers. It is therefore expected that white storks would prefer landscapes that are characterized
 by suitable wind and thermal characteristics, which promote the soaring and gliding behaviors.
 However, these same landscapes are also potential sites for large-scale wind energy generation.
 In this study, we used the observed data of the white stork movement trajectories to specify a
 data-driven agent-based model, which simulates flight behavior of the white storks in a dynamic
 environment. The data on the wind characteristics and thermal uplift are dynamically changed on a
 daily basis so as to mimic the scenarios that the observed birds experienced during flight. The flight
 corridors that emerge from the simulated flights are then combined with the predicted surface on the
 wind energy potential, in order to highlight the potential risk of collision between the migratory white
 storks and hypothetical wind farms in the locations that are suitable for wind energy developments.
 This work provides methods that can be adopted to assess the overlap between wind energy potential
 and migratory corridors of the migration of birds. This can contribute to achieving sustainable
 trade-offs between wind energy development and conservation of wildlife and, hence, handling the
 issues of human–wildlife conflicts.

 Keywords: agent-based models; collision risk; data-driven models; sustainability; wind energy

Sustainability 2018, 10, 1470; doi:10.3390/su10051470                         www.mdpi.com/journal/sustainability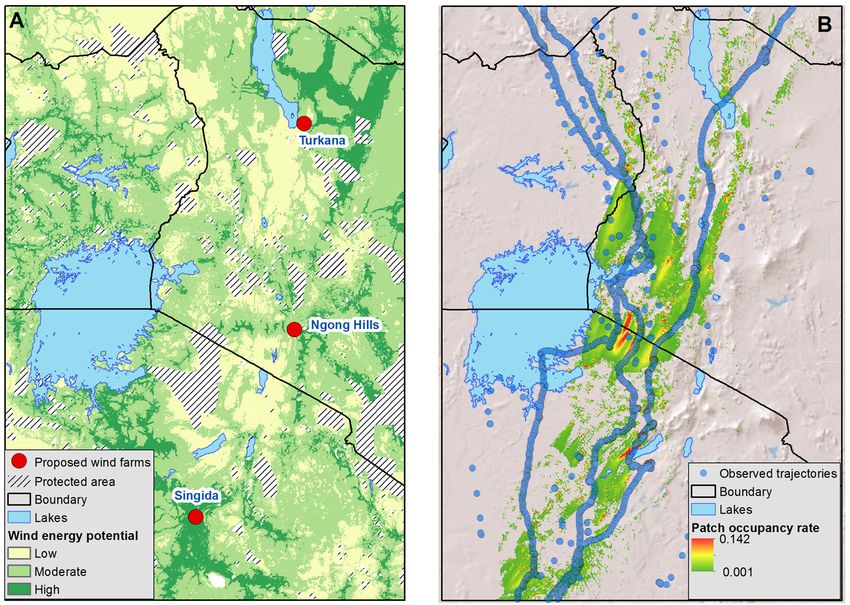
Sustainability 2018, 10, 1470                                                                        2 of 22

1. Introduction

1.1. Background
      Every year, thousands of birds fly from their breeding sites in Europe to their wintering grounds
in sub-Saharan Africa. To achieve this feat, the birds depend on the prevailing weather conditions,
topography, and landscape characteristics [1,2]. However, the anthropogenic activities in the flight
paths, particularly the continued development of wind energy infrastructure, poses a risk to the birds.
More specifically, the development of wind farms in close proximity to the nesting locations, foraging
patches, and migratory corridors of birds adversely affects the bird populations and behavior [3,4].
In particular, the establishment of wind farms contributes to habitat loss, barrier effects, disturbance,
and to an increase in the mortality rates from the collision between birds and wind farm infrastructure,
including turbines and cables [5–7]. The risk is worse for the migratory species that have no experience
flying in the wind farm locations and only encounter wind turbines and other wind energy related
infrastructure in the course of their migratory flights [8].
      White storks (Ciconia ciconia) are an example of bird species that make annual migratory flights
from their breeding grounds in Europe to wintering locations in Africa. During the migratory flights,
the white storks, because of their large sizes, rely more on the wind characteristics, orographic
updraft, and site-specific thermals, to facilitate their flight, rather than on their flapping behavior [9].
Their dependence on the weather and topography contributes to the vulnerability [10] of the birds
to collision with wind turbines, power cables, and other anthropogenic infrastructure that may be
in their flight path. This is particularly true in cases where wind farms are located in the potential
flight corridors of the migratory birds. Indeed, the poor siting of wind farms dramatically increases
the risk of collision with birds [11]. The evaluation of the collision related mortality of birds within
wind farms traditionally relies on the identification and enumeration of bird carcasses within wind
farms [12]. The pre-installation assessment of the risk of collision has also depended on the sighting
of birds in the proposed wind farm locations.
      Furthermore, studies on the collision risk of the birds in wind farms have predominantly been
conducted in Europe and North America. This is, in part, because of the considerable investment in
wind energy in these regions. Other assessments of the collision risk have also been conducted at bird
convergence locations at Gibraltar in the south of Spain [13,14] and in the south of Israel [15,16], as the
birds fly into continental Africa. The paucity of the studies on the collision risk between the migratory
birds and wind farms in Africa can be attributed to the low amounts of the installed generation capacity
of wind-based electricity in the continent. The global drive to improve access to clean energy has led
to an increased investment in wind energy in Africa. Additionally, with the setting up of the turbine
manufacturing factories in the continent, the installed capacity is likely to increase. This is evident
with the latest installations in Ethiopia, Kenya, and Tanzania [17], which, traditionally, have not been
the largest generators of wind-based energy in the continent.
      The emerging interest and investment in wind energy related projects in Africa, which is the
traditional wintering ground for white storks (and other European bird species), brings to the fore
the questions on the possible impact of the wind energy installations on migratory birds. The specific
questions of interest include the following: (a) What is the spatial variability of wind energy potential
in the African continent? (b) What is the proximity of the high wind energy potential areas to the
traditional bird migratory corridors and wintering sites? (c) What is the potential risk of collision
posed by wind farms were they to be built in corridors that are preferred by migratory birds?
      Attempts have been made to map the wind energy potential in the continent [18,19]. Usually, these
have been at the continental level with the results being summarized at the country level. Additionally,
some of the studies have evaluated the wind energy potential within individual countries [20–22].
However, most of the data from these studies are not publicly available. Furthermore, in our analysis of
the literature, we did not find any studies in Africa where the potential effects of wind energy projects
on expansive corridors of migration for birds has been assessed. Commonly, the potential impact of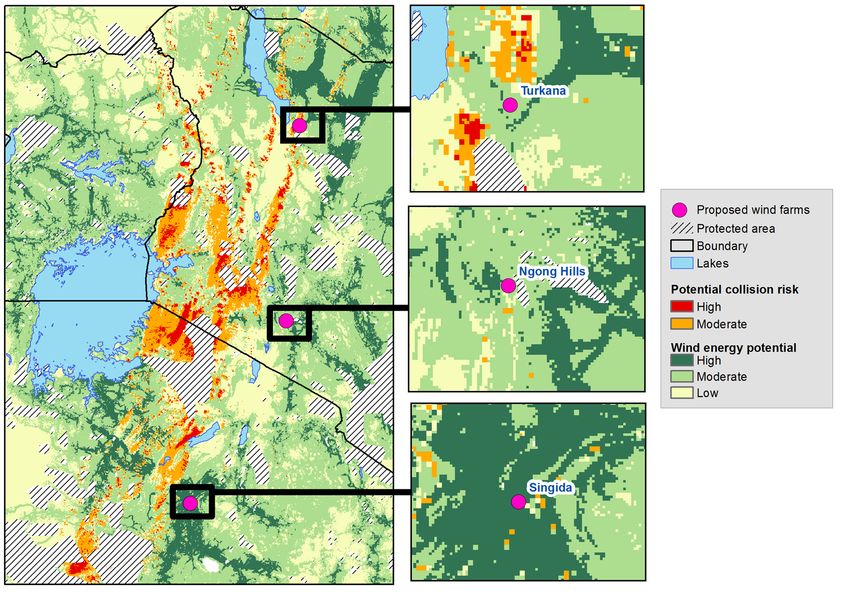
Sustainability 2018, 10, 1470                                                                      3 of 22

wind energy projects is examined as part of environmental assessment prior to the implementation
of wind farm projects. In the European Union, bird sensitivity maps are used to steer the wind
energy development away from most sensitive areas as a way of reducing the risk of collision [23].
Similarly, in United States, the government agencies like the U.S. Fish and Wildlife Service (FWS)
have responsibility to manage and regulate endangered animal species [24]. Consequently, accurate
collision prediction models are required as a pre-requisite to wind energy development. It is therefore
important to develop methods and tools that can accurately predict the risks that emerge from the
interaction between the birds and wind energy infrastructure.

1.2. Related Work
      Agent-based models (ABM) or individual-based models (IBMs), as they are commonly known
within ecology [25], are powerful tools for predicting and visualizing the interactions between animals
and their environment [5,26]. In the study of migratory birds, individual-based models have been used
to simulate and understand the soaring and gliding behavior among the migratory white storks [27].
Similarly, Deinhardt et al. [28] used agent-based models to combine the Global Positioning System
(GPS) trajectories, topographic information, and data on uplift in order to predict the new migratory
corridors for the golden eagles (Aquila chrysaetos) in North America. Furthermore, Zurell et al. [29]
investigated the influence of resource limitations on the spatial structure of the white stork population
density and reproductive rates.
      Scientific models are commonly specified, implemented, and used in order to estimate the risk
of collision between the birds and wind energy installations. In particular, Collision Risk Models
(CRM) [24], which are numerical in nature, have commonly been employed to assess the risk of
collision, resulting from the existing and pre-installed wind farms. As with other numerical models
that are used to simulate animal behavior, typical CRMs do not consider the autonomous behavior
of the individual bird agents in determining the risk of collision, for instance, by taking actions to
avoid collision [30,31]. As a result, IBMs have been specified, as they allow for the implementation of
individual agent-specific characteristics, which influence the risk of collision [32]. Other agent-based
models have been developed to improve the collision-risk-related data collection strategies [33].
      Within ecology, the individual based models have traditionally been specified from the
documented theories and knowledge about the system of interest [34]. With the advances in sensor and
tracking technology, it is now possible to record fine-grained data in space and time about the systems
in remote and inaccessible areas [35]. The data from these kinds of implementations can provide a
basis for generating knowledge about the previously under researched systems [36]. Consequently,
the data-driven approaches to knowledge discovery, through iterative modelling and simulation, have
gained prominence. In relation to the current study, a major gap in the research, that is yet to be
extensively explored, is the use of data-driven agent-based models in analysing the link between the
bird behavior and the risk of collision between the birds and wind energy infrastructure.
      There are three important components of data-driven modelling and simulation frameworks,
namely, the model space, which specifies the general structure of the system of interest; search
algorithm, which efficiently discover candidate system behaviors and fitness function to evaluate the
performance of the search algorithm; and the candidate solutions [37]. As a result of the iterative
nature of the data-driven modelling approaches, evolutionary algorithms are preferred for discovering
significant system behaviors. These algorithms search for distinctive behaviors and patterns and
optimize the solutions dynamically by comparing the model results with the observed patterns in
the data. Genetic Algorithms (GA), which borrow from biological processes of evolution and natural
selection [38], have been used in agent-based models [39,40].
      In GA, an initial random population is introduced to provide a solution to the behavior patterns
of interest. Through a process that is similar to biological evolution, the solutions are evolved and
optimized through selection, crossover, and mutation. To facilitate the evolution, fitness values are
assigned to candidate solutions based on how they perform in identifying the behaviors of interest.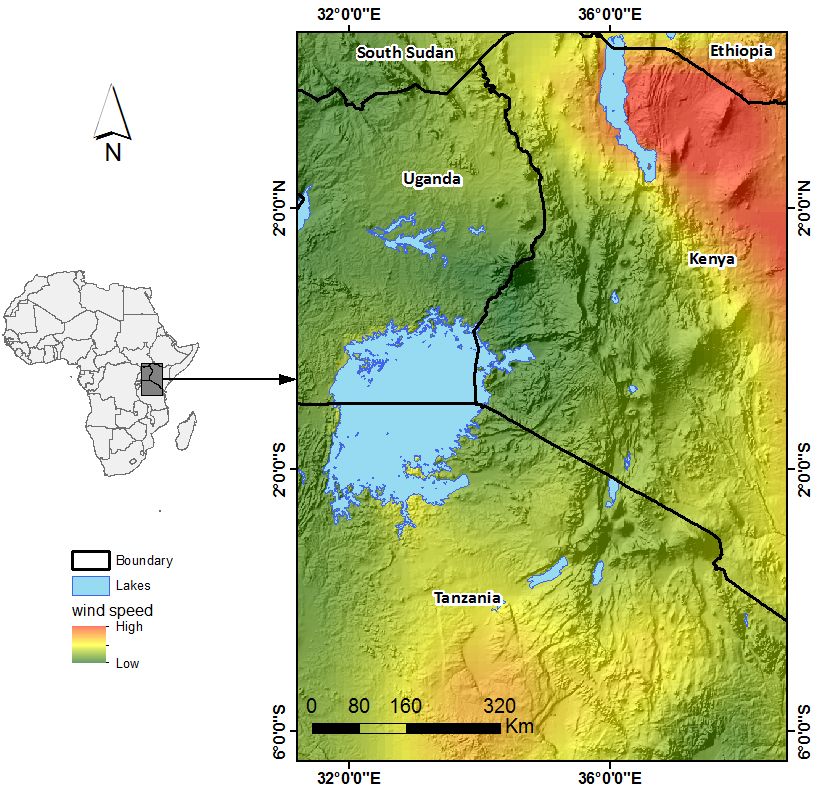
Sustainability 2018, 10, 1470                                                                      4 of 22

In order to produce an optimized solution, a process of selection is implemented to identify a set of fit
solutions that can generate the next generation of solutions. There are six main selection strategies,
including, roulette wheel selection, stochastic universal sampling, linear rank selection, exponential
rank selection, tournament selection, and truncation selection [41]. In this work, we used an elitist
roulette wheel selection.

1.3. Research Objectives
     Our research objective was to predict the migration corridors of white storks from the individual
bird flight behaviors and interactions with the environment. Additionally, we investigated whether the
emerging corridors coincided with areas that had a high potential for wind energy development and,
hence, were likely to contribute to the risk of collision between the birds and wind farms during the
migratory flights. Here, we set out to estimate the wind energy potential within the East Africa region,
particularly in a region that covers the Eastern Rift Valley from northern Kenya to central Tanzania.
Additionally, we implemented an agent-based model to simulate the flights of the migrating white
storks during their migration to southern Africa. Thereafter, we combined the emerging migratory
corridors of the simulated white storks with the estimated wind energy potential surface in order to
predict the potential locations of bird-friendly wind farms.

2. Materials and Methods

2.1. Study Area
     The East African region is home to the Great Rift Valley. The Eastern Rift Valley is a recognized
bird flyway [42], and is used by the migrating soaring birds during the wintering flights to the south
of Africa. This is as a result of the topography of the valley, which provides a good orographic uplift,
and also as a result of the availability of several lakes in the valley, which serve as foraging sites
for different bird species. As a result of the expansive nature of the region, executing a detailed
environment impact assessment prior to project implementation would have been expensive and
untenable. Methods that combined the data from different sources and considered the dynamic
interaction between multiple users of the environment were preferable when designing the sustainable
resource use plans. Linking the geographic information systems (GIS) and agent-based models (ABM)
could be better suited for such a task.
     The area of study, which was approximately 700,00 km2 , was located within East Africa, and
covered the region between latitudes 6.42◦ S and 4.72◦ N and longitudes 31.18◦ E and 38.68◦ E. The area
had recently been targeted for the implementation of one of the biggest wind energy projects in Africa,
the Lake Turkana Wind Energy Project [43]. The average wind speed between 2006–2017 varied
between 2 m/s to 8 m/s, with the highest values being associated with the mountain ranges in the
north-eastern part of Kenya (Figure 1).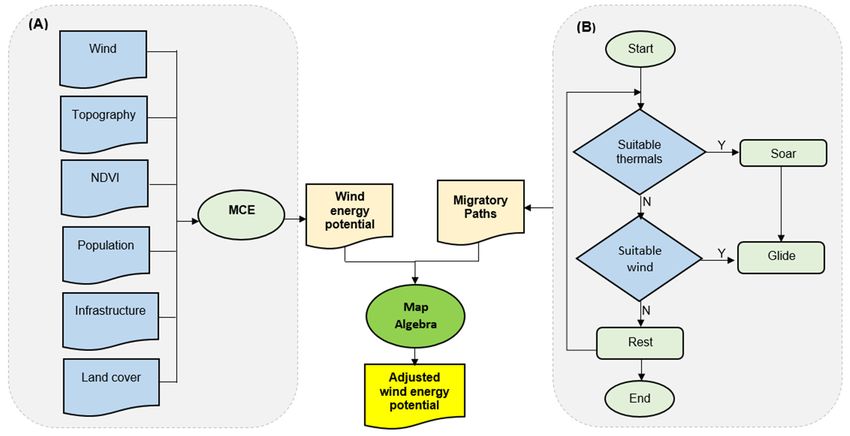
The area of study, which was approximately 700,00 km2, was located within East Africa, and
covered the region between latitudes 6.42° S and 4.72° N and longitudes 31.18° E and 38.68° E. The
area had recently been targeted for the implementation of one of the biggest wind energy projects in
Africa, the Lake Turkana Wind Energy Project [43]. The average wind speed between 2006–2017
varied between
Sustainability        2 m/s
               2018, 10, 1470 to 8 m/s, with the highest values being associated with the mountain ranges
                                                                                                      5 of in
                                                                                                           22
the north-eastern part of Kenya (Figure 1).

     Figure 1. Study area depicting the 10 year (2006–2017) average wind speed, as estimated by the
     European Centre for Medium-Range Weather Forecasts (ECMWF) reanalysis data [44].

2.2. Data Sources and Pre-Processing
     The GPS trajectories of juvenile white storks in their migratory journey, from their breeding
grounds in Europe to the wintering grounds in southern Africa, provided the empirical data on the
movement characteristics of the birds. The data [45] were initially collected so as to assess the cost
of the migratory decisions of the white storks [46] and captured the flight paths of 54 birds in their
journey to the wintering grounds and back. However, only five of the tagged birds had traversed the
areas of study. Furthermore, only three of the trajectories of the birds that passed through the area of
study were complete and usable in our work. We therefore used the observed trajectories of the three
birds that passed through the area of the study to specify our model. Other spatial datasets (Table 1)
provided the necessary variables so as to specify the characteristics of the environment over which the
birds flew.

                                Table 1. List of data and associated data sources.

           Type                 Data Variable                   Data Source                  Date
                              GPS trajectories of
    Observed trajectories                                 Movebank database [45]           2013–2014
                                white storks
                             Consolidated digital
                                                     Food and Agricultural Organization
         Elevation          elevation model (DEM)                                             2007
                                                           (FAO) Geonetwork [47]
                               at 1 km resolution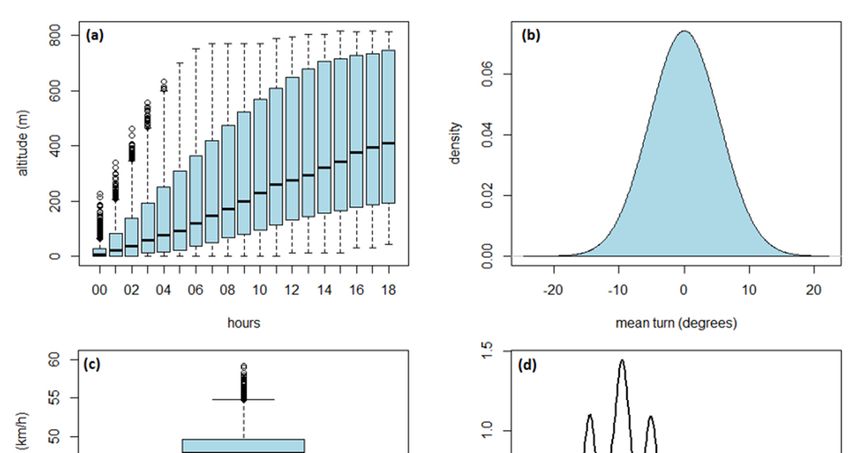
Sustainability 2018, 10, 1470                                                                                       6 of 22

                                                          Table 1. Cont.

             Type                    Data Variable                      Data Source                     Date
                                 Normalized Difference           Moderate Resolution Image
       Vegetation index                                                                              January 2014
                                Vegetation Index (NDVI)     Spectroradiometer (MODIS) NDVI [48]
                                                                European Space Agency (ESA)
          Land cover              Land cover classes                                                    2009
                                                                    GlobCover 2009 [49]
      Human population            Population Density               The AfriPop project [50]             2010
                                                            European Center for Medium-Range
                                      Wind speed            Weather Forecast (ECMWF) reanalysis       2006–2017
                                                                          data [44]
    Weather characteristics         Wind direction                 ECMWF reanalysis data              2013–2014
                                   Surface pressure                ECMWF reanalysis data              2013–2014
                                     Temperature                   ECMWF reanalysis data              2013–2014
                                   Sensible heat flux              ECMWF reanalysis data              2013–2014
                                   Relative humidity               ECMWF reanalysis data              2013–2014
         Water bodies                    Lakes             Global Lakes and Wetlands Database [51]      2017

     The thermal and orographic characteristics of the environment could influence the ground speed of
the birds and the energy expenditure during flight [52]. We estimated the thermal uplift and orographic
updraft by combining the topographic data (slope and aspect), wind characteristics (direction and
speed), temperature, sensible heat flux, and relative humidity, based on the methods that were
developed by Bohrer et al. [53].
     From the observed trajectories, we created clusters of dominant flight behaviors, using the
Expectation-Maximization Binary Clustering (EMBC) [54] method as it was implemented in the EMBC
package in the R statistical software. We then subset the result and only used the parts of the trajectories
that were classified as having high movement speeds and smaller navigation turns. This cluster
represented the migration (relocation) flight behavior, as the birds tended to move faster and in regular
orientations during the gliding flights.
     In order to use the trajectories in an agent-based model, we created a regular trajectory with a
constant time step of 10 min. We also resampled all of the raster data to a 1 km spatial resolution.

2.3. Model Specification
     Conceptually, we combined two sub-models in this work (Figure 2). In the first part, we used a
multi-criterial evaluation (MCE) model to derive a surface of the wind energy potential in the area of
the study. In the second part, we specified a dynamic agent-based model of the white storks migration
in the area of the study. In the agent-base model, the bird agents exhibited three main behaviors, which
included soaring, gliding, and resting. From the local interaction of birds with their environment,
we estimated the commonly occupied patches. We assumed that the commonly occupied patches
represented the potential migratory corridors. We then combined the outputs of the two models in
order to derive an adjusted surface of the wind energy potential that considered the potential use of
some of the patches as the migratory paths behavior.
     A simplified ODD (overview, design concepts, and details) protocol [55] was used to document
the various aspects of the agent-based model. In summary, the important aspects of the models were
as follows. An elaborate ODD protocol was provided in the supplementary materials.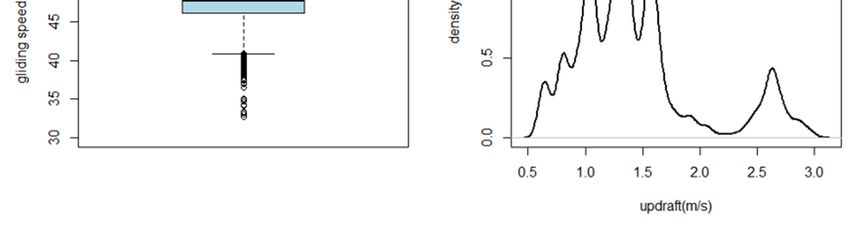
migration in the area of the study. In the agent-base model, the bird agents exhibited three main
behaviors, which included soaring, gliding, and resting. From the local interaction of birds with their
environment, we estimated the commonly occupied patches. We assumed that the commonly
occupied patches represented the potential migratory corridors. We then combined the outputs of
the two models
Sustainability        in1470
               2018, 10, order to derive an adjusted surface of the wind energy potential that considered
                                                                                                     7 of 22
the potential use of some of the patches as the migratory paths behavior.

     Figure
     Figure 2.2.Conceptual
                   Conceptualframework
                                frameworkof the
                                             of geographic   information
                                                 the geographic            systems
                                                                    information     (GIS)-derived
                                                                                  systems            wind energy
                                                                                            (GIS)-derived    wind
     potential  surface  and  agent-based  modeling   of the  white  stork migratory   flights.
     energy potential surface and agent-based modeling of the white stork migratory flights.    (A)  A simplified
                                                                                                            (A) A
     framework     for mappingforthe
     simplified framework             wind energy
                                   mapping          potential.
                                              the wind    energyFactors  are combined
                                                                   potential.             using
                                                                                Factors are      a multi-criteria
                                                                                             combined     using a
     evaluation   method
     multi-criteria        to create
                      evaluation     a representative
                                 method   to create a wind    energy potential
                                                       representative            surface.
                                                                        wind energy       (B) A simplified
                                                                                       potential             flow
                                                                                                  surface. (B)   A
     diagram
     simplifiedof flow
                  the agent-based
                        diagram ofmodel   of the whitemodel
                                     the agent-based    storks of
                                                               migratory
                                                                  the whiteflight behavior.
                                                                              storks         We assume
                                                                                     migratory            that the
                                                                                                  flight behavior.
     birds predominantly
     We assume               use soaring
                    that the birds        and navigation
                                   predominantly            manoeuvers
                                                    use soaring            during flight.
                                                                   and navigation          MCE—multi-criterial
                                                                                     manoeuvers      during flight.
     evaluation.
     MCE—multi-criterial evaluation.

2.3.1.AModel
        simplified   ODD (overview, design concepts, and details) protocol [55] was used to document
               Purpose
the various aspects of the agent-based model. In summary, the important aspects of the models were
      The main
as follows.      purpose ofODD
             An elaborate       the agent-based
                                     protocol wasmodel,
                                                     provided as specified  in this study, was
                                                                  in the supplementary          to simulate the flight
                                                                                            materials.
behavior of the white storks during the wintering migration. As a result, we assumed that birds in
the area
2.3.1.    of the
       Model      study flew southwards (from Europe) to the wintering grounds in southern Africa.
               Purpose
We therefore only simulated the navigation behavior towards the south of the area of the study.
      The main purpose of the agent-based model, as specified in this study, was to simulate the flight
behavior   of the
2.3.2. Model       whiteState
               Entities,   storks  during the
                                 Variables,  andwintering
                                                  Scales migration. As a result, we assumed that birds in
the area of the study flew southwards (from Europe) to the wintering grounds in southern Africa.
      We specified two sets of agents in the model. The empirical white stork agents emulated the
We therefore only simulated the navigation behavior towards the south of the area of the study.
migration behavior of the white storks as it was captured in the observed trajectories. The simulated
agents, on the other hand, predicted the flight behavior by adapting to the environmental characteristics
2.3.2. Model Entities, State Variables, and Scales
in their locality. We specified the environment (patch variables) to include factors that would influence
      We specified
the flight patterns two
                      of thesets  of agents
                              white   storks in  theSpecifically,
                                              [56].    model. Thewe   empirical
                                                                         used thewhite
                                                                                   spatialstork
                                                                                            dataagents    emulated the
                                                                                                 that represented    the
migration
wind speed, behavior   of the white
              wind direction,          storks as
                                  orographic      it was slope,
                                                updraft,    captured   in the observed
                                                                  normalized             trajectories.
                                                                                difference   vegetationThe   simulated
                                                                                                          index (NDVI),
agents,   on the other
human population             hand,
                      density,   andpredicted
                                      distance tothe
                                                   waterflight   behavior
                                                            bodies.  The windbyspeed
                                                                                  adapting    to the
                                                                                       and wind         environmental
                                                                                                    direction positively
characteristics  in their  locality. We   specified   the  environment     (patch  variables)  to  include
influenced the speed and direction of flight, while the vegetation (NDVI), human settlement, and water      factors that
would
bodies influence    the flight
        were indicators         patternsforaging
                            of potential   of the white
                                                     sites.storks  [56]. Specifically,
                                                             The topographic           we used
                                                                                variables,  which the  spatial data
                                                                                                     included       that
                                                                                                               the slope
and updraft characteristics, were indicators of potential sites for the gliding and soaring behavior.
      The agents had state variables that dynamically changed during the model run. Specifically,
the step length, a proxy for the speed of movement, turn angle, and the flying height were the main
variables that determined the flight behavior [57]. In the model, the step length and the turn angles
of the simulated white storks were separately estimated as the linear functions of the environmental
variables (Equations (1) and (2), respectively). We used seven environmental variables including the
altitude, NDVI, updraft, slope, wind speed, wind direction, and population density, respectively.

                                             s0 = C1 + f 2 E1 + . . . f 7 E7                                          (1)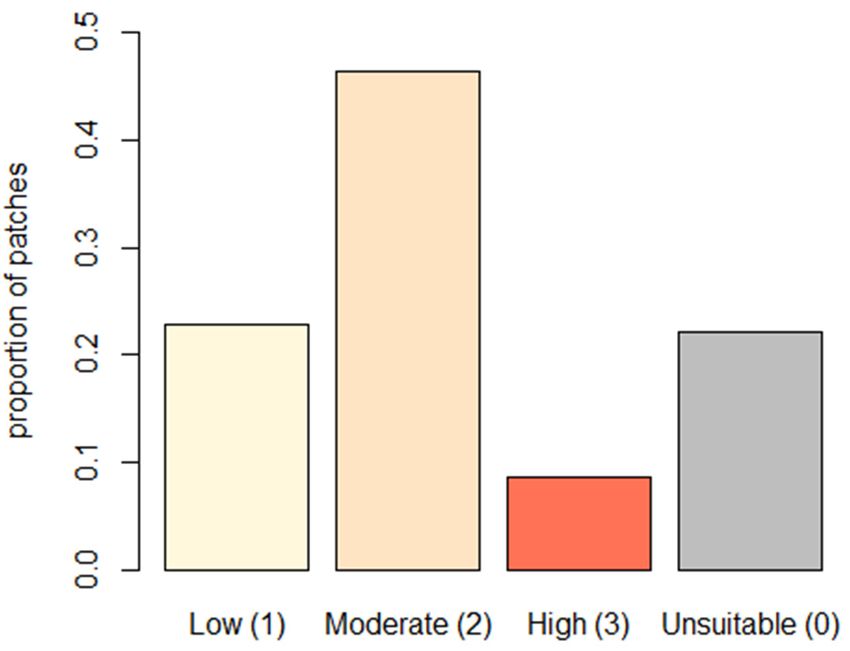
Sustainability 2018, 10, 1470                                                                       8 of 22

                                       t0 = C2 + f 9 E1 + . . . f 14 E7                                (2)

where

S0 instantaneous step length,
E1 E7 ; environmental variables
t0 instantaneous turn angle
C1 random value representing intercept of linear function for step length
C2 random value representing intercept of the linear function for turn angle
f 1 ; f 14 random values to represent co-efficient of environmental variables. We used the first seven
values to estimate step distance and the seven to estimate turn angles.

      The flying height of an agent varied, depending on the updraft characteristics of a bird’s patch.
For instance, in the patches that exhibited a good thermaling energy, the birds would gain height by
soaring and regularly lose height when gliding.
      From the observed trajectories, the real white storks were able to traverse the area of the study in
less than one month (three weeks on average). We therefore assumed that the vegetation characteristics
in the area of the study remained largely the same during the flight duration. As such, the NDVI
data remained unchanged for the duration of the flight. Similarly, the topographic data, including the
elevation, slope, and aspect remained unchanged during the simulation. On the other hand, the raster
files that represented the wind speed, wind direction, and uplift characteristics data were updated
dynamically after each day in the model time scale. In order to optimize the model, we estimated and
used the updraft raster files from the arithmetic sums of the estimated orographic updraft and thermal
uplift. The time step (temporal scale) for each simulation was 10 min. A day of simulation ran from
00:00 h to 19:00 h, this was the same duration that was captured in the observed trajectories.

2.3.3. Process Overview and Scheduling
     The simulated white stork agents exhibited three main behavior characteristics, namely, they
could soar, glide, and rest. We assumed that the intensive foraging behavior took place during
the resting behavior. During this procedure, the simulated agents randomly walked within their
present patch and only marginally turned their heading to an angle of less than 20◦ on either side.
The soaring and gliding behavior were largely dependent on the thermal and wind characteristics
of the environment. The birds used suitable updraft characteristics (a combination of thermal uplift
and orographic updraft) to perform the soaring behavior. Similarly, the suitable wind speed and
direction facilitated the gliding decisions. At each time step, the simulated agents checked the thermal
characteristics of their patch. If there were suitable thermal characteristics, which we had assumed
to be any thermal energy above 1 ms−1 , the birds soared. Upon attaining a suitable soaring height,
the birds performed a gliding behavior.
     Apart from the processes that guided the flight behavior, the parameters for estimating the flight
velocity and turn angles of the agents were progressively optimized through genetic algorithms.
Specifically, we implemented an elitist selection criterion in the genetic algorithm to select the best
performing parameters after each full run. The performance of the navigation parameters was
evaluated by a fitness function. A fitness value was calculated and assigned to a simulated agent,
based on the proximity of that agent location to the flight locations of the observed birds. The lowest
performing agents were eliminated and their places were taken by new agents that were generated
from a re-combination of the chromosomes of the parameters of the best performing agents. The fitness
of the navigation parameters was evaluated at the end of the simulation run.

2.3.4. Design Concepts
      In this model, we considered the following agent-based modeling design concepts.
Sustainability 2018, 10, 1470 9 of 22
• Emergence: From the individual white stork agent behaviors and interactions of the agent with
its local environment, we were interested in the emergence of plausible trajectories. Furthermore,
from the autonomous decisions of agents, we were interested in the system-level migratory
corridors that emerged from the patch occupancy by the different agents.
• Adaptation: Bird agents adapted to their environment by, for instance, avoiding water bodies,
soaring at patches with suitable thermals, and gliding when they had suitable flying heights that
could facilitate the gliding and resting when the patch was neither suitable for soaring nor gliding.
• Sensing: Bird agents could perceive the differences in elevation, thermal characteristics, and water
bodies. When elevation and thermals were suitable, birds soared and glided, and when the birds
were closer to water bodies, they chose dry patches in their vicinity to fly to.
2.3.5. Model Output
As part of the output from the model, we defined a procedure in order to create a text file that
contained a subset of the state variables of the agents at each run. Specifically, we recorded the
arithmetic mean and standard deviation of the step distance, turn angles, flight height, and fitness
values of the agents in each step of the model. Additionally, we specified a procedure so as to export a
raster, which specified the number of agents that visited a particular patch during each simulation run.
2.4. Mapping Wind Energy Potential
We adopted the multi-criteria evaluation (MCE) approach to estimate the wind energy potential.
We used the literature review to select the factors that had commonly been used to predict wind
energy potential [58–61]. In particular, the main factors included the wind characteristics; topography,
which could be derived from the slope and surface roughness; population density; proximity to
major roads; proximity to existing transmission lines; and land cover characteristics. We derived
the Topographic Roughness Index (TRI) from the digital elevation model, using a method that was
developed by Riley et al. [62]. We adopted and modified the classification scheme, which was
developed by Miller & Li [58], in order to reclassify each factor into the appropriate suitability classes
(Table 2). As a result of the number of classes in the land cover surface, we presented the suitability
score for each land cover class in Table 3.
Table 2. Wind energy potential suitability factors and related suitability score associated with each
suitability factor.
Factors/Suitability Score Highest (5) High (4) Medium (3) Low (2) Lowest (1) Unsuitable (0)
Wind speed (m/s) >8 >7–8 >6–7 >5–6 >3–5 0–3
Slope (%) 0–5 >5–10 >10–15 >15–30 >30–40 >40
Slightly Intermediately Moderately Highly Extremely
Terrain Roughness Index Level
rugged rugged rugged rugged rugged
Population density
0–25 >25–75 >75–150 >150–300 >300–500 >500
(people/km2 )
Distance to major roads (km) 0–1 >1–2 >2–5 >5–10 >10–20 >20
Distance to existing
0–5 >5–10 >10–15 >15–20 >20–30 >30
transmission lines (km)
In reclassifying the land cover classes (Table 3), we modified the Miller & Li scheme, so that water
bodies were considered unsuitable, forested areas and perennially flooded surfaces were considered to
be of low suitability, as building wind farms in such locations would lead to the destruction of forests
and wetlands, which provide other vital ecosystem services to the resident communities. Open areas
and locations of sparse vegetation were considered to exhibit the highest potential for establishing the
wind energy infrastructure.Sustainability 2018, 10, 1470 10 of 22
Table 3. Suitability score for the land cover classes.
Land Cover Class Suitability Class Suitability Score
Irrigated croplands Lowest 1
Rain-fed croplands High 4
Mosaic croplands/vegetation High 4
Mosaic vegetation/croplands High 4
Closed to open broadleaved evergreen or semi-deciduous forest Medium 3
Closed broadleaved deciduous forest Lowest 1
Open broadleaved deciduous forest Low 2
Closed needle-leaved evergreen forest Lowest 1
Open needle-leaved deciduous or evergreen forest Low 2
Closed to open mixed broadleaved and needle-leaved forest Low 2
Mosaic forest–shrubland/grassland Medium 3
Mosaic grassland/forest–shrubland Medium 3
Closed to open shrubland Low 2
Closed to open grassland Highest 5
Sparse vegetation Highest 5
Closed to open broadleaved forest regularly flooded (fresh-brackish water) Low 2
Closed broadleaved forest permanently flooded (saline-brackish water) Low 2
Closed to open vegetation regularly flooded Lowest 1
Artificial surfaces Unsuitable 0
Bare areas Highest 5
Water bodies Unsuitable 0
Permanent snow and ice Lowest 1
No data Unsuitable 0
Based on the suitability classes and the suitability scores, we used the Weighted Overlay method
in ArcGIS 10.4 software to combine the suitability factors. We assigned weights, which ranged from 1
to 3, to each suitability factor so as to reflect their relative importance in influencing the wind energy
potential. The factors that significantly influenced the suitability of a site for wind energy development
were assigned a weight of 3, while the factors with the marginal influence were assigned a weight of 1.
The relative influence was estimated as the percentage of the weight that was assigned to each factor,
relative to the sum total of the weights of all of the factors.
We considered the long-term average wind speed as the most significant determinant of the
ambient wind energy potential and assigned it a relative influence of 25% (Table 4). Secondly,
the topography, as represented in this case by the topographic roughness index (TRI), and slope were
assigned a combined influence of a relative influence of 17%. This was shared between the TRI (8%)
and slope (9%). The land cover characteristics were assigned a relative influence of 16%, while the
distance to the main roads and to the existing transmission lines were each assigned an influence
of 16%. Finally, the population density, which was a proxy for the urban and non-urban areas, was
assigned a weight of 1, which corresponded to a relative influence of 8%. The non-urban areas (sparsely
populated) were preferable for wind energy production [60], because of the minimized influence of
noise and disturbance from the wind farms to the inhabitants in the surrounding areas.
Table 4. Weights and associated relative influence of the factors contributing to the wind
energy potential.
Layer Assigned Weight Relative Influence (%)
Wind speed (m/s) 3 25
Slope (%) 1 9
Terrain Roughness Index (TRI) 1 8
Population density (persons/km2 ) 1 8
Distance to roads (km) 2 17
Distance to existing transmission lines (km) 2 17
Land cover classes 2 16Sustainability 2018, 10, 1470 11 of 22
The areas that corresponded to the protected areas, which included the forest reserves, national
parks, and national reserves, were considered as unsuitable areas and were masked out from the
results of the weighted overlay analysis. In the resulting surface of the wind energy potential, the cells
that were classified with the high and highest wind energy potential were combined to represent the
areas with a high suitability for wind energy development. In contrast, the cells that represented the
low and lowest wind energy potential were merged so as to portray the locations with a low suitability
for wind energy generation. As a result, the final map of the wind energy potential was designed to
show the areas with a high, medium, and low suitability for wind energy generation.
2.5. Predicting Migratory Corridors of White Storks
We implemented a genetic algorithm in order to simulate the flight paths of 1000 bird agents in
the area of the study. We iteratively implemented the algorithm for 50 generations. Each generation
lasted for the duration of a complete model run. We set this to run for, at most, 2500 time steps in the
model. In each time step, the fitness of the decision that was made by each agent was calculated as a
function of the success of finding a soaring location and the proximity of the bird to the target patch.
For each agent, we specified the target to be a patch within the southern border of the simulation
world. The agents remembered their target patch throughout their entire lifetime (a simulation run).
At the end of each generation, we replaced a proportion of the poorly performing agents and selected
the remaining agents to hatch new agents in place of the replaced agents. We achieved this though
selection and chromosome crossover procedures.
As part of the results from each simulation run, we exported a raster, which estimated the number
of agents that visited a particular patch during the model run. From the 50 simulation runs, we selected
the raster files from the last 25 model runs and computed the average raster. Furthermore, we divided
the resulting raster by the number of bird agents that were in the simulation (1000 in this model)
in order to estimate the patch occupancy rate. In the further steps, we used the raster of the patch
occupancy rate as a proxy for the migratory corridors of the white storks in the area of the study.
2.6. Incorporating the Influence of Proximity to Predicted Migratory Corridors on Wind Energy Potential
In this study, we did not estimate the actual risk of collision between the birds and wind turbines
at the actual wind farms. Instead, we assumed that the collision risk increased when the wind farms
were built in close proximity to the potential corridors of bird migration. We combined the surface of
the estimated wind energy potential with the predicted white stork migratory corridors. Specifically,
we scaled the inverse of the patch occupancy rate to range from 0 to 3. This ensured that the range
of the scaled raster of the patch occupancy was the same as the maximum number of the suitability
classes, with 0 signifying a low wind energy potential and 3 signifying a high wind energy potential.
We then computed a weighted sum of the patch occupancy raster and original surface of the
wind energy potential. As a result, we ended up with an adjusted surface of the wind energy potential.
This surface considered the proximity of birds’ migratory corridor to the predicted wind energy
potential surface. We then designed a map to visualize the adjusted surface of the wind energy
potential that was cognizant of the migratory corridors.
3. Results
3.1. Flight Behavior of the Migratory White Storks
From the agent-based model, we plotted and analysed state variables of the bird agents.
In particular, we examined the flying altitude, turn angles, speed (or step length), updraft
characteristics of the visited patches, and fitness of the agents during the flight.
We found that the birds tended to fly higher (reaching a median of approximately 400 m above
the ground) as the day progressed (Figure 3). This was similar to the flight height, which ranged
between 400 m and 500 m, that had been observed among the migrating white storks in Bulgaria [63].From the agent-based model, we plotted and analysed state variables of the bird agents. In
particular, we examined the flying altitude, turn angles, speed (or step length), updraft characteristics
of the visited patches, and fitness of the agents during the flight.
We found that the birds tended to fly higher (reaching a median of approximately 400 m above
the ground)2018,
Sustainability as 10,
the1470
day progressed (Figure 3). This was similar to the flight height, which ranged
12 of 22
between 400 m and 500 m, that had been observed among the migrating white storks in Bulgaria [63].
Additionally, the simulated birds exhibited regular turns of up to 20°◦ in clockwise and anti-clockwise
Additionally, the simulated birds exhibited regular turns of up to 20 in clockwise and anti-clockwise
directions. Furthermore, we observed that during migration, the simulated white storks moved at an
directions. Furthermore, we observed that during migration, the simulated white storks moved at an
average speed ranging between 40 and 55 km h−−11 (11 and 15 ms−1 ). Finally, the white stork agents
average speed ranging between 40 and 55 km h (11 and 15 ms−1 ). Finally, the white stork agents
preferred the patches with combined updrafts above 1 ms−1 .
preferred the patches with combined updrafts above 1 ms−1 .
Figure
Figure 3.3. Flight
Flight parameters simulatedwhite
parameters of the simulated whitestork:
stork:(a)
(a)box
boxplots
plotsdepicting
depictingthe
thehourly
hourly variation
variation in
in the flying altitude of the simulated birds; (b) probability density plot of the mean turn angles;
the flying altitude of the simulated birds; (b) probability density plot of the mean turn angles; (c) box (c)
box
plotplot of gliding
of the the gliding speed
speed of the
of the simulated
simulated birds;
birds; andand (d) the
(d) the density
density distribution
distribution of the
of the updraft
updraft of
of the
the visited
visited patches.
patches.
In
In this model, the
this model, theindividual
individualbird
birdagents
agentsmade
made decisions
decisions to to either
either glide
glide or soar,
or soar, based
based ontime
on the the
time
of theofday,
thepatch
day, patch characteristics,
characteristics, and theand the instantaneous
instantaneous flying altitude
flying altitude of theTrajectories
of the agent. agent. Trajectories
emerged
emerged from the individual agent behaviors and the interaction between
from the individual agent behaviors and the interaction between the agents with the the agents with the
environment.
environment.
By considering Bythe
considering thesmallest
patch as the patch as the smallest
spatial unit andspatial unit and
by looking bybird
at the looking
agentatbehaviors
the bird at
agent
this
behaviors at this scale, we visualized the patch occupancy rate as a macro-system
scale, we visualized the patch occupancy rate as a macro-system outcome of the individual bird-agentoutcome of the
decisions. The patch occupancy signified the rate at which the agents visited or stayed in a particular
patch and had been used to evaluate the range [64] and metapopulational dynamics [65]. We mapped
the variations in the patch occupancy for each model run at the 1st, 10th, 20th, 30th, 40th, and 50th
generations (Figure 4). We observed that the areas with conspicuously high patch visitations were
around Mt. Elgon in the border between Kenya and Uganda, the Maasai Mara–Serengeti corridor
between Kenya and Tanzania, and around Lake Eyasi in Tanzania.individual bird-agent decisions. The patch occupancy signified the rate at which the agents visited or
stayed in a particular patch and had been used to evaluate the range [64] and metapopulational
dynamics [65]. We mapped the variations in the patch occupancy for each model run at the 1st, 10th,
20th, 30th, 40th, and 50th generations (Figure 4). We observed that the areas with conspicuously high
patch visitations
Sustainability 2018, 10,were
1470 around Mt. Elgon in the border between Kenya and Uganda, the Maasai Mara–
13 of 22
Serengeti corridor between Kenya and Tanzania, and around Lake Eyasi in Tanzania.
Figure 4.
Figure 4. Variation
Variationininthe
the patch
patchoccupancy
occupancyby bymodel
modelgenerations.
generations.(a)
(a)1;1;(b)
(b)10;
10;(c)
(c)20;
20;(d)
(d) 30;
30; (e)
(e) 40;
40; and
and
(f) 50
(f) 50 generations.
generations. The
The area
area of
of interest
interest highlights
highlights the
the locations
locations in
in the
the map
map where
where conspicuous
conspicuous patterns
patterns
of high occupancy have emerged.
of high occupancy have emerged.
3.2. Wind
3.2. Wind Energy
Energy Potential
Potential from
from Classical
ClassicalMulti-Criteria
Multi-CriteriaEvaluation
Evaluation
From the
From the results
results of
of the
the multi-criteria
multi-criteria evaluation,
evaluation, we
we presented
presented the
the suitability
suitability of
of the
the wind
wind energy
energy
potential in
potential in three
three categories
categories (low,
(low, moderate,
moderate, and
and high)
high) (Figure
(Figure 5A)
5A) and
and excluded
excluded thethe protected
protected areas,
areas,
which included forests, national parks, nature conservancies, and heritage sites. We
which included forests, national parks, nature conservancies, and heritage sites. We estimated thatestimated that
14% of the surface (outside of the protected areas and water bodies) in the area of the study
14% of the surface (outside of the protected areas and water bodies) in the area of the study exhibited aexhibited
a high
high potential
potential wind wind
energyenergy generation,
generation, whilewhile approximately
approximately 60% of60% of the
the area wasarea was moderately
moderately suitable.
suitable. Traditionally, a suitability map of the kind that we designed could
Traditionally, a suitability map of the kind that we designed could serve as the first serve as the basis
first basis of
of the
the assessment of wind energy
assessment of wind energy resources. resources.Sustainability 2018, 10, 1470 14 of 22
Sustainability 2018, 10, x FOR PEER REVIEW 13 of 21
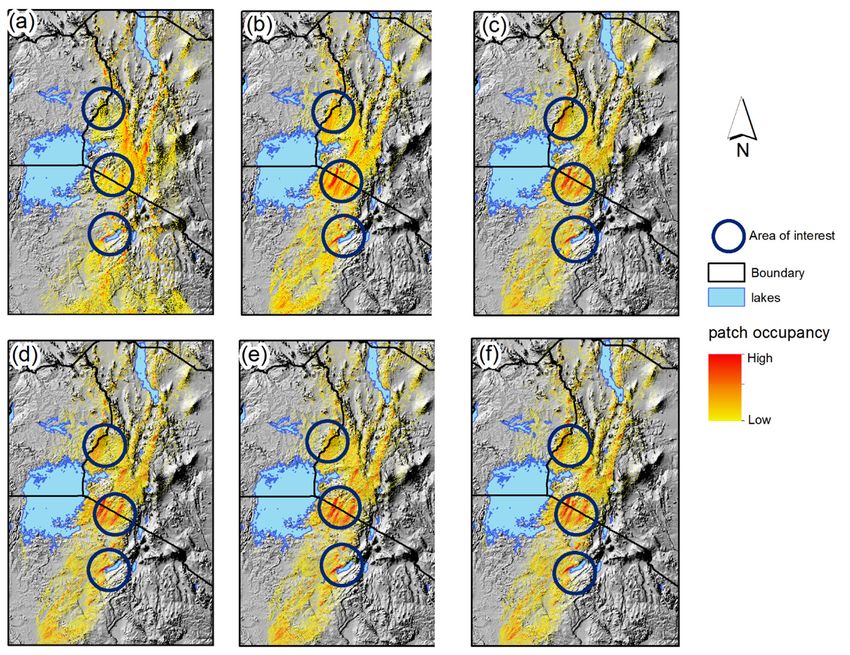
Figure 5.
Figure 5. Main
Main outputs
outputs from
from multi-criteria
multi-criteria evaluation
evaluation and
and agent-based
agent-based model.
model. (A)
(A) Predicted
Predicted spatial
spatial
variability of
variability of wind
wind energy
energy potential
potential from
from the
the classical
classical multi-criteria
multi-criteria evaluation.
evaluation. Areas shaded in
Areas shaded in the
the
dark green shade are potentially highly suitable for wind energy installations, while the areas
dark green shade are potentially highly suitable for wind energy installations, while the areas that that are
shaded in light yellow shade exhibit low suitability. (B) Emergent migratory pathways of
are shaded in light yellow shade exhibit low suitability. (B) Emergent migratory pathways of white white storks
together
storks with the
together observed
with trajectories.
the observed The most
trajectories. Thevisited patchespatches
most visited were those
were at the at
those border point
the border
between
point KenyaKenya
between and Tanzania in the
and Tanzania inMaasai Mara—Serengeti
the Maasai Mara—Serengeti region andand
region alsoalso
around
aroundLake Eyasi
Lake in
Eyasi
Tanzania.
in Tanzania.
3.3. Migratory
3.3. Migratory Corridor of Simulated
Corridor of Simulated Birds
Birds
We calculated
We calculated the
the patch
patch occupancy
occupancy rate
rate as
as aa proxy
proxy for
for the
the preference
preference ofof aa particular
particular patch
patch by
by the
the
bird agents
bird agents (Figure
(Figure 5B).
5B). We
We observed
observed that,
that, during
during the
the migratory
migratory flights,
flights, the
the white
white storks
storks preferred
preferred to
to
fly on the ranges of the rift valley on the side that faced Lake Victoria. Additionally, we observed
fly on the ranges of the rift valley on the side that faced Lake Victoria. Additionally, we observed that,
that, even within the corridor, there was a variation in the patch occupancy rate, with most of the
even within the corridor, there was a variation in the patch occupancy rate, with most of the preferred
preferred patches having an occupancy rate of approximately 0.14. The migratory corridor and the
patches having an occupancy rate of approximately 0.14. The migratory corridor and the variation in
variation in the patch occupancy rate within the corridor provided a basis for adjusting the original
the patch occupancy rate within the corridor provided a basis for adjusting the original wind energy
wind energy potential surface. By overlaying the observed trajectories on the surface of the patch
potential surface. By overlaying the observed trajectories on the surface of the patch occupancy rate,
occupancy rate, we observed that, generally, the predicted pathway of the white stork migration
we observed that, generally, the predicted pathway of the white stork migration tended to follow the
tended to follow the pattern that was followed by the observed birds.
pattern that was followed by the observed birds.
We also estimated that approximately 60% of the patches from the wind energy potential surface
We also estimated that approximately 60% of the patches from the wind energy potential surface
in the migratory corridor were classified to be moderately or highly suitable for the wind energy
in the migratory corridor were classified to be moderately or highly suitable for the wind energy
generation (Figure 6). Furthermore, we observed that some of the patches, which were initially
generation (Figure 6). Furthermore, we observed that some of the patches, which were initially
classified as moderately suitable for wind energy development, might have potentially served as
classified as moderately suitable for wind energy development, might have potentially served as
alternative sites when we considered that they were away from the bird flight corridors.
alternative sites when we considered that they were away from the bird flight corridors.Sustainability 2018, 10, 1470 15 of 22
Sustainability 2018, 10, x FOR PEER REVIEW 14 of 21
Figure 6.
Figure 6. Proportion
Proportion of
of the
the patches
patches from
from the
the wind
wind energy
energy potential
potential surface
surface in
in the
the predicted
predicted migratory
migratory
corridor. Approximately 60% of the patches in the predicted corridor of the white stork migration
corridor. Approximately 60% of the patches in the predicted corridor of the white stork migration had had
either aa moderate
either moderateor orhigh
highpotential
potentialfor
forwind
windenergy
energygeneration.
generation.
3.4. Wind
3.4. Wind Energy
Energy Potential
Potential Surface
Surface and
and Potential
PotentialCollission
CollissionRisk
Risk
By combining
By combining the the predicted
predicted white
white stork
stork migratory
migratory corridors
corridors with
with the
the predicted
predicted surface
surface of
of wind
wind
energy potential, we designed a suitability map that accounted for the locations that
energy potential, we designed a suitability map that accounted for the locations that were preferred by were preferred
by the
the migratory
migratory birdsbirds
(Figure(Figure
7). To7).highlight
To highlight the potential
the potential migratory
migratory corridors,
corridors, the patches
the patches that
that were
were frequently visited by the birds during flight were displayed in red shade while
frequently visited by the birds during flight were displayed in red shade while the moderately visited the moderately
visited patches
patches were shaded were in shaded
orangein orange
Sustainability 2018, 10, x FOR PEER REVIEW 15 of 21
We observed that there were still contiguous patches, particularly towards Lake Victoria in
Kenya and around Lake Eyasi in Tanzania, that were frequented by birds and, therefore, should
preferably be conserved to protect the bird populations. Similarly, there were contiguous portions of
land, particularly in the north eastern part of Kenya and in the southern parts of Tanzania, that
exhibited a moderate or high potential for wind energy development, while having a lower risk of
collision with birds, hence making it possible to achieve trade-offs between wildlife conservation and
renewable energy planning. This type of zonation could provide an initial basis for sustainable
natural resource planning to the benefit of conservation and the renewable energy development.
FigureFigure 7. Adjusted
7. Adjusted wind wind energy
energy potentialbased
potential based on
on the
the influence
influenceofofthethe
migratory
migratorycorridors of theof the
corridors
white storks. Locations that are shaded in dark green represent areas that exhibit a high potential for
white storks. Locations that are shaded in dark green represent areas that exhibit a high potential for
wind energy development and are likely to pose the lowest risk to the migratory birds. Patches that
wind energy development and are likely to pose the lowest risk to the migratory birds. Patches that
are shaded in red and orange represent areas that are likely to frequently be visited by the migratory
are shaded
whitein red and orange represent areas that are likely to frequently be visited by the migratory
storks.
white storks.
4. Discussion
Here, we set out to demonstrate the potential use of the data-driven agent based models and the
classical GIS analysis methods to provide an initial assessment of the risk to the migratory white
storks from the potential future wind farm development. We combined the predicted surface of the
wind energy potential with the predicted white stork migratory corridors, so as to highlight theSustainability 2018, 10, 1470 16 of 22
We observed that there were still contiguous patches, particularly towards Lake Victoria in Kenya
and around Lake Eyasi in Tanzania, that were frequented by birds and, therefore, should preferably
be conserved to protect the bird populations. Similarly, there were contiguous portions of land,
particularly in the north eastern part of Kenya and in the southern parts of Tanzania, that exhibited a
moderate or high potential for wind energy development, while having a lower risk of collision with
birds, hence making it possible to achieve trade-offs between wildlife conservation and renewable
energy planning. This type of zonation could provide an initial basis for sustainable natural resource
planning to the benefit of conservation and the renewable energy development.
4. Discussion
Here, we set out to demonstrate the potential use of the data-driven agent based models and the
classical GIS analysis methods to provide an initial assessment of the risk to the migratory white storks
from the potential future wind farm development. We combined the predicted surface of the wind
energy potential with the predicted white stork migratory corridors, so as to highlight the overlap
between the wind energy potential and white stork migratory pathways. The fundamental insights
and limitations of our work are summarized in the following sub-sections.
4.1. GNSS Tracking and Behavior Mapping
The advances in the Global Navigation Satellite Systems (GNSS) tracking technology have
contributed immensely to the study of the behavior of animals in expansive environments [66].
Monitoring the population and behavior of animals has been important in order to ensure their
conservation and to reduce the human–wildlife conflict [67]. However, the cost of tracking has
remained high, thus making it impossible to track an entire population of a species of interest.
Consequently, the scientific methods that would bridge the gap between data collection and knowledge
discovery are necessary. Agent-based models, because of their efficiency in representing dynamic
processes [68], have provided a good opportunity to augment the tracking efforts as a means of
investigating, understanding, and representing the complexity of the animal ecosystems. Particularly,
we adopted data-driven agent-based models as they could integrate both the measuring and
computational aspects of an application [69]. Furthermore, the empirical data from GNSS together
with spatial data from the remote sensing and sensor networks could support the representation of
the spatially explicit environments [70]. This was important when examining the influence of the
external environments on the behavior of the agents. Using the observed trajectories of the white storks,
we estimated that the initial flight characteristics were as a function of the climatic and landscape
characteristics of the location of the flight. We then used these initial characteristics as the initial
solutions to simulate the flight paths of the white stork agents.
4.2. Dynamic Agent-Based Modeling for Space-Time Mapping
In ABMs, the agents could be specified to be dynamic, either in their state (being capable
to change their behaviors) or in space (by moving, based on the prevailing characteristics of the
environment) [68]. The dynamics within the ABM could be achieved by scheduling the sequence
of the agent behaviors and by changing the characteristics of the environment iteratively. The use
of spatially and temporally reference empirical data to calibrate the agents and to specify the patch
variables in the model allowed us to simulate the white stork flight behavior in a dynamic environment.
Specifically, the agents navigated in an environment that was characterized by wind (direction and
speed), topography (elevation and slope), uplift (thermal and orographic updraft), vegetation (NDVI),
and human settlements (population density). Feeding the high-resolution data about the topography,
vegetation, and weather into the model allowed us to simulate a realistic environment in which the
agents had flown. Moreover, by considering the proximity to the observed trajectories as one of the
parameters of fitness, allowed us to partially validate the model in ‘real time’.You can also read