A RATIONAL LOOK AT RENEWABLE ENERGY - AND THE IMPLICATIONS OF INTERMITTENT POWER
←
→
Page content transcription
If your browser does not render page correctly, please read the page content below
A RATIONAL LOOK AT
RENEWABLE ENERGY
AND THE IMPLICATIONS OF INTERMITTENT POWER
By Kimball Rasmussen | President and CEO, Deseret Power | November 2010, Edition 1.2
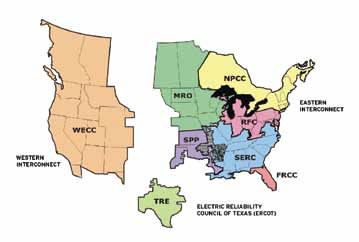
TABLE OF CONTENTS

Forward................................................................................................................................................................. 2
Wind Energy......................................................................................................................................................... 3
        Fundamental Issue: Intermittency............................................................................................................ 3
        Name-plate Rating versus Actual Energy Delivery............................................................................... 3
        Wind is Weak at Peak.................................................................................................................................. 3
        Texas ............................................................................................................................................................ 4
        California...................................................................................................................................................... 4
        The Pacific Northwest................................................................................................................................ 5
        The Western United States........................................................................................................................ 5
        Enter the “Twilight Zone”—A Control Area Nightmare......................................................................... 5
        The Shadow Grid—The Fossil Fuel Stand-In for No Show Wind............................................................ 8
        The Los Angeles Department of Water and Power (LADWP).............................................................. 8
        Increase in Carbon Dioxide from Wind Power—It is Possible............................................................... 9
        Got Transmission? The Missing Cost Element........................................................................................ 9
        Technical Potential versus Economic Potential.................................................................................... 10
        The Electric Continental Divide............................................................................................................... 10
        Wind Energy Storage—Not Ready for Primetime.................................................................................... 11
        Wind Turbines can Consume Electricity.................................................................................................. 13
        The Hard Realities of Renewable Pricing................................................................................................ 13
        Value of Power—Demand versus Energy................................................................................................ 14
Solar Energy....................................................................................................................................................... 15
        Not All Sunshine is Equal.......................................................................................................................... 15
        How Expensive is PV Solar?..................................................................................................................... 16
        Large PV Solar............................................................................................................................................ 16
        Concentrated Solar.................................................................................................................................... 16
        Solar Demand versus System Peak......................................................................................................... 17
        The Value of Solar Power—Demand versus Energy.............................................................................. 18
        The Solar Synopsis..................................................................................................................................... 18
Green Jobs—Will They Materialize as Promised? .................................................................................... 18
The Renewable Portfolio Standard (RPS) or How 20 Percent
Can Easily Become 100 Percent of a Utility’s Plant Investment......................................................... 19
Summary............................................................................................................................................................ 20
        Eyes Wide Open.......................................................................................................................................... 21
A RATIONAL LOOK AT RENEWABLE ENERGY
and the Implications of Intermittent Power
By Kimball Rasmussen | President and CEO, Deseret Power | November 2010
In December 2009, I had been invited to speak at This paper will explore wind and solar energy in
a conference discussing climate change policy in terms of their environmental, operational and
Las Vegas. It happened to be held at the same time economic attributes. We will then place these in
of the National Finals Rodeo. On my way out of context to form a rational look at renewable energy
town I stopped at a crowded In-N-Out Burger and the implications of intermittent power—the
where the majority of the patrons wore cowboy not-so-obvious operational challenges that have to
boots and hats, Wrangler jeans and western shirts. be addressed when large quantities of intermittent
One cowboy from Oklahoma noticed the “Electric energy must be accommodated on the electricity grid.
Power Cooperative” logo on my shirt, and asked if
I knew anything about wind energy. He told me, This analysis is based on the current state of wind
“I own a large ranch in Oklahoma where they and solar technologies. Further research and
have been installing wind mills all over the place. development efforts of these technologies may
My question is this: with all of those wind mills, produce breakthroughs, which could mitigate some
why hasn’t my power bill come down?” of the impediments to high penetrations of wind
and solar power to the electric grid, but as yet these
This seems to be a common misperception, that impediments remain significant.
wind turbines provide an inexhaustible supply of
cheap energy—after all, the fuel is free, isn’t it? FORWARD
Why don’t we simply build more and more Wind and solar energy—two of the primary sources
renewable energy and achieve low-cost energy of renewable energy—are sometimes touted as
independence, while at the same time creating the answer to the world’s energy challenges. Some
millions of new jobs to fuel a green economic advocates of these energy sources want us to believe
recovery? What’s not to like about that? they can mitigate everything from the disastrous
Unfortunately for all of us, the real world poses 2010 oil leak in the Gulf region to the global
limits on renewable energy technology, and with concern of climate change. Wind and solar energy
those limits come costs—relatively high costs, as are routinely promoted with the promise of green
will be shown in this paper—that must be paid to jobs, and that they will lead to a green technology
integrate even a modest amount of renewable energy revolution while improving the environment. But
into the power supply portfolio.
2 | A RATIONAL LOOK AT RENEWABLE ENERGYhow well do wind and solar energy solutions actually Name-plate Rating versus Actual
perform on these promises? Let’s take a rational look. Energy Delivery
For the sake of this discussion it’s important to
Wind Energy know that all power producing equipment comes
Wind energy is becoming a significant consideration with an output rating stating how much power the
in the planning and development of the modern facility will produce. This is referred to as name-plate
electric system. In the past decade, the United States capacity and it is expressed in kilowatts (kW) or
wind energy output grew, as a sector, 10 times faster megawatts (MW).2 For large utility grade generators
than the combination of all other forms of electric the customary expectation is that once installed, they
energy.1 The growth in wind turbines is remarkable, will deliver the name-plate output when supplied
given that the U.S. wind industry installed more with sufficient fuel. Additionally, they will operate, if
turbines in the years 2008 and 2009, than all required, around the clock. In the case of wind energy
previous years combined. We are truly in a wind installations this is simply not the case. The output
boom. This is attributable to a number of factors, over time is only a small fraction of name-plate rating
including the fact that wind farms are much quicker because of the intermittency of the fuel resource. The
to design, permit and construct than traditional ratio of actual output divided by maximum potential
coal- or gas-fired plants, and wind energy tends to be output is defined as capacity factor. The entire sector
one of the least expensive renewable energy options. of U.S. wind energy is currently operating at a
As a result, the U.S. now undeniably leads the world capacity factor of only 25 percent.3
in total wind energy, surpassing nations such as
Germany and Denmark. How far we go from here It is troubling that we see some astonishingly
depends on some specific attributes of wind and the simplistic reports in the media which assert the
systems required to deliver it. number of homes that a given “wind farm” will
allegedly supply. When reliability, expressed
Fundamental Issue: Intermittency as capacity factor, is taken into account, the
Despite robust wind development in the U.S., wind serviceability of wind is much lower than advertised.
faces a nearly insurmountable issue: intermittency. A misleading claim by a developer may contribute
Simply put, the intermittent nature of wind makes to the sentiment that renewable energy can easily
it difficult to harness effectively on a power grid that replace fossil fuels—it cannot.
is finely tuned to deliver electricity around the clock.
The down side of this intermittency is clearly evident Wind is Weak at Peak
in the actual performance data of wind turbines The intermittent and unpredictable nature of wind is
already installed. Wind performs poorly across all further compounded by the fact that the wind tends
traditional utility metrics for generating resources. to be weak during electrical peak load conditions.
For reliability, stability, forecast ability, proximity to Wind blows most consistently and creates the best
load centers, and economics, wind power is a poor generation opportunities during off-peak hours,
choice for large-scale power production. cooler days and evening hours; directly opposite
1
.S. Energy Information Administration, Net Generation by Energy Source, (2010), http://www.eia.doe.gov/electricity/epm/table1_1.html. Wind
U
data shown on Table 1.1.A. Net Generation by Other Renewables: Total (All Sectors), 1996 through July 2010. Based on a comparison of 2009 versus
1999, wind energy output expanded by 78 percent, natural gas electric generation grew 65 percent, nuclear grew 10 percent, coal declined 6 percent
and hydroelectric declined 15 percent. The entire electric mix from all sources grew a total of 7 percent.
2
One megawatt is equal to one thousand kilowatts.
3
The same reference as in the preceding note.1
A RATIONAL LOOK AT RENEWABLE ENERGY | 3the electric customer usage profile. This is a natural “California is a national leader in the
consequence of the climate forces that determine development of renewable resources.
wind: daily and seasonal temperature differentials. Because California has large quantities
On the hottest days of the summer the wind tends of renewable resources already on-line,
to be low or non-existent when air conditioning a significant amount of historical data
demands are at their peak. Then when it gets windy, is available to accurately model and
the temperatures will naturally moderate and air forecast future performance of the
conditioning loads drop off just in time for the wind various types of renewable resources.”
energy to pick up. Therefore, during the summer
months, wind generation is low during “Wind generation presents . . .
high demand times, and can be shown to reach significant operational challenges.
maximum generation when power demands are Wind generation energy production
down. The same phenomena can be demonstrated is extremely variable, and in
to occur during winter peak conditions. The California, it often produces its
very coldest days are also the days when the highest energy output when the
wind is not blowing. For this reason, utility-scale demand for power is at a low point.”
balancing regions simply do not plan for significant
contribution of wind at peak demand periods. CAISO’s graph demonstrates its summer wind
This can be amply demonstrated in real-world, generation and average variation by hour:
large scale examples from Texas, California, the
Pacific Northwest region, and the entire western WIND GENERATION & OUTPUT AT PEAK
United States. ACTUALS - WEEK JULY 17, 2006
1200
TEXAS 1000
Texas is home to the largest collection of wind 800
MW
generation facilities in the nation. More than one 600
out of every four wind turbines in America is 400
found in Texas. The Electric Reliability Council of 200
Texas (ERCOT) only plans for 8.7 percent of wind 0
name-plate rating as the “dependable contribution
7/17/06 0:00
7/17/06 12:00
7/18/06 0:00
7/18/06 12:00
7/19/06 0:00
7/19/06 12:00
7/20/06 0:00
7/20/06 12:00
7/21/06 0:00
7/21/06 12:00
7/22/06 0:00
7/22/06 12:00
7/23/06 0:00
7/23/06 12:00
7/24/06 0:00
7/24/06 12:00
7/25/06 0:00
7/25/06 12:00
7/26/06 0:00
to peak requirements,” in accordance with
ERCOT’s stakeholder-adopted methodology.4
Average hourly wind generation Average output at peak
This means that more than 91 percent of Texas
wind turbines are expected to be off-line when it
matters most—at peak load periods. The wind capacity available at California peak
demand times is about 200 MW. The name-plate
CALIFORNIA capacity of California-based wind generators is
The State of California ranks third in the U.S. for about 2,600 MW. Hence, the wind power available
total installed wind energy (behind Texas and Iowa). at peak is less than 10 percent, which is very similar
California is also the third largest state geographically to the Texas experience. In other words, about
(behind Alaska and Texas). According to the 90 percent of California wind turbines are idle at
California Independent System Operator (CAISO), peak load conditions.
4
Kent Saathoff, ERCOT Expects Adequate Power Supplies for Summer, ERCOT, May 12, 2010, www.ercot.com/news/press_releases/2010/nr-05-12-10.
4 | A RATIONAL LOOK AT RENEWABLE ENERGYNote that Texas and California are both summer- THE WESTERN UNITED STATES
peaking systems. Let us consider a vast winter- Now let us consider an even broader region—
peaking region—the Pacific Northwest—to see how all eleven western states, from Montana to
wind energy performs in that situation. New Mexico, from Washington to California,
and everything in between. This vast area is served
THE PACIFIC NORTHWEST as a single “reliability” region known as The Western
Oregon and Washington rank fourth and fifth in the Electricity Coordinating Council (WECC).
U.S. for total installed wind energy. The prominent During the heat wave of July 2006, the WECC
Federal Power provider in the region—the Bonneville system reached its peak on Monday, July 24, 2006.
Power Administration (BPA)—is a winter-peaking The hottest day was actually July 23, 2006, but
system with about 10,000 MW of load. this was a Sunday so total loads did not peak until
Monday. On the hottest day, the capacity factors for
wind resources through most of WECC were well
BONNEVILLE POWER ADMINISTRATION
ACTUALS - WEEK DECEMBER 14, 2008 under five percent, and on the peak day, which was
a slightly cooler day, the wind capacity factors were
12,000
less than ten percent.5 Again, this is very similar to
2008 BPA Peak Load
10,000 Texas, California and the Pacific Northwest.
Megawatts
8,000
These real-world lessons illustrate the grave
6,000 shortcomings of wind. Approximately 90 percent of
Load
wind turbines can be expected to NOT PRODUCE
4,000 Wind
Nameplate
power at peak load periods, even when distributed
2,000
over broad geographic areas.
0 Incidentally, I recently had a conversation with a
Sun Mon Tue Wed Thur Fri Sat
trustee of a large mid-western utility that is home to
Data: Bonneville Power Administration 450 MW of wind generation. He asked me to guess
how much of the 450 MW of wind was actually
On Tuesday December 16, 2008, the BPA system producing during their system peak. I responded,
reached its peak for the entire year, with a demand “Probably between 30 and 40 MW.” He gasped,
of 10,762 MW. At the time of peak demand, the “How did you know? That is exactly what we are
output of the entire fleet of wind resources, with a seeing!” Yes, wind is weak at peak.
name-plate value of 1,599 MW, was only 116 MW,
or about seven percent of the name-plate potential. Enter the “Twilight Zone”——a Control
This is very similar to the Texas and California wind area6 Nightmare
experience, only in this case about 93 percent are not The demonstrated low performance of wind energy
producing at the winter peak. during peak load conditions is only one side of the
coin. The other side occurs during off-peak periods
when unscheduled, unanticipated wind energy
5
WECC, Wind Capacity Issues Working Draft, March 17, 2010.
6
Control Area - A power generation regulation region that maintains and balances its power load and power interchanges with other control areas.
See also, Control Area Concepts and Obligations, North American Electric Reliability Council, 1992.
A RATIONAL LOOK AT RENEWABLE ENERGY | 5comes booming onto the system ready to serve loads Control area/Twilight Zone in Action:
that are nowhere to be found. BONNEVILLE POWER ADMINISTRATION
ACTUAL — APRIL 27, 2010
1,800
This can easily happen because of the physics of 1,600
60 Min
wind energy: the power output of a wind turbine 1,400
-800
accelerates at a much faster rate than the simple
Megawatts
W
1,200
0M
MW
change in wind speed. For instance, if the wind
0
1,000
+1,2
speed changes from 10 to 20 mph (a doubling of 800
the wind speed) the associated power output will 600 20
Min
change by a factor of eight.7 400
200
An actual case with the BPA brings the control area 0
4:00
5:00
6:00
2:00
3:00
4:30
5:30
6:30
2:30
3:30
7:00
7:30
problem into perspective. On April 27, 2010 about
3:00 a.m., wind generation on the BPA system Time of Day
ramped up by 1,200 MW in only one hour, and
then down 800 MW in only 20 minutes. Such rapid from a pool of different traditional generators to
changes cause extreme stress to a control area and provide the right amount of power at the instant it’s
in many cases result in market price distortions and required. In a normal day they blend the outputs of
environmental degradation. traditional power plants that include coal, nuclear,
natural gas, and in some regions hydroelectric to
Such erratic changes in generation run directly work in concert to minimize operating costs while
counter to the needs of utility operators who select maintaining reliability.
BONNEVILLE POWER ADMINISTRATION 2009/10 TOTAL SYSTEM LOAD
AND WIND CONTRIBUTION
12,000
SYSTEM ANNUAL
TOTAL SYSTEM LOAD PEAK LOAD
10,000 WIND NAME-PLATE
WIND ACTUAL
8,000
MEGAWATTS
6,000
4,000 Wind contribution 2% of name-plate
2,000
0
NOVEMBER 2009
7
ote that the physics of wind energy is such that the change in power of a wind turbine is proportional to the cube of the change in wind speed.
N
This means that if the wind speed cuts in half, the power output will cut to one-eighth. See also, Wind Systems Power Calculation, http://
windpower.generatorguide.net/wind-speed-power-.html.
6 | A RATIONAL LOOK AT RENEWABLE ENERGYNow we have the advent of wind. The use of wind described, that can easily swamp out the total load
energy creates an unprecedented challenge, which requirements of the utility—meaning there’s literally
can easily launch utility power systems into an off- no place for the energy to go.
peak condition, something that can be described as
the “twilight zone.” Now the utility is forced to make quick and drastic
decisions to balance loads and resources. I call this
Consider an event that occurs during off-peak or the twilight zone—a control area no-man’s land.
twilight hours. The various utilities are operating One option might be to enact the costly decision to
with all of the peaking plants off line and many of shut down a base-load resource, such as a nuclear
the intermediate resources off line. Still running are or coal unit, and then subsequently face a high cost
base-load, coal-fired generators but they have been “re-start” with its attendant unusual wear and tear
reduced to minimum-load status. The nuclear plants on the affected units. In the case of a coal-fired unit,
are running because they remain in “must-run” emissions will increase as the unit and its pollution
condition for safety and economic reasons. The wind control equipment ramp up during the few hours
turbines are cruising along at a modest output. after startup.
Now assume that a sudden, unanticipated, change Another twilight zone choice is to try to sell the “hot
in the weather brings with it a rapid ramping of potato” energy to a neighboring utility, or to another
wind energy output. This can result in a large block control area authority. What if the neighbor already
of several thousand MW of unplanned energy is operating at optimum balance?
that when combined with the operating status just
WIND PERFORMANCE SCORECARD
Total hours in peak period 2208 or 3 months
Percent of period when output was below
5% of name-plate 45%
Total hours in period below 5% 982.6 or 5.9 weeks
Consecutive hours of generation below 5% 103.9 or 4.3 days
Capacity Factor during peak period 16%
DECEMBER 2009 JANUARY 2010
A RATIONAL LOOK AT RENEWABLE ENERGY | 7Choices are limited, and the market Effectively, we end up building new
price for electricity can plunge so low fossil-fueled peaking power plants
that the price actually goes negative. (usually natural gas) to back up the
wind resources that were intended to
The host utility might actually have to pay a eliminate fossil-fueled resources in the
neighboring utility to accept the surplus schedule first place.
and allow delivery onto its system. This absurd result
is a reality in a system that has a high percentage of This duplication of costs is forced onto consumers,
wind generation installed, and can be very costly to who must pay for both the wind turbine and the
the host utility. back-up generator.
Do you think the twilight zone problem is The Los Angeles Department of Water
insignificant? Is this just a remote hypothetical? and Power (LADWP) recognizes the need to
Think again. Many utilities have found themselves back up wind with gas in order to maintain capacity
in precisely this situation. For this reason some and reliability. Consider the following statement
system operators are now requiring wind turbines from the LADWP’s executive summary of its 2010
to be equipped with a “cut out” switch that Draft Integrated Resource Plan:
disconnects the wind farm from the grid by remote
control. This becomes an obvious waste of energy. “There is ongoing debate regarding the
level of on-peak reliability of renewable
THE SHADOW GRID——THE FOSSIL FUEL resources. However, the renewable
STAND-IN FOR NO SHOW WIND resources were added mainly to satisfy
Wind’s unpredictable nature tends to provide energy Renewable Portfolio Standard (RPS)
that does not match consumer demand. As noted in target requirements, while natural gas
the examples of ERCOT, California and the Pacific resources were incorporated to ensure
Northwest, wind volatility makes it unsuitable for system reliability.”
electricity planners to rely on wind energy to meet
peak demand needs. In order to mitigate these In other words, the LADWP overtly recognizes that
negative effects, the grid operators and planners must the wind projects on the system are only meeting
construct a shadow grid, typically consisting of fossil- the legislatively mandated RPS as they provide
fueled power plants (particularly gas-peaking units). intermittent energy. But to actually operate a
This shadow grid stands as reserve generation for reliable system, with capacity and energy, LADWP
those times when wind resources are not delivering must install natural gas generation resources. In
their potential capacity. At those times, homes still spite of the obvious environmental objective of
need heat and light, commercial and industrial sites wind energy, the shadow grid of gas generation will
still have to run electric equipment, when the wind result in air emissions, including carbon dioxide.
may not be producing up to its potential. Many such generators are “simple cycle” peaking
units, which tend to be less efficient and have the
highest emissions among gas-fired generators.
8 | A RATIONAL LOOK AT RENEWABLE ENERGYThe need to develop a shadow grid has also resulted Wind power does not produce all of the
in the actual filing of new tariffs to charge for the claimed benefits of reductions in fossil
cost of such a grid. Puget Sound Electric has recently fuel consumption and CO2 emissions
filed a tariff with a proposed charge of $2.70 per when the fuel consumption and related
kilowatt-month to offset the carrying cost of a emissions of the shadow grid of gas-
shadow grid of gas turbines that are required to fired resources are taken into account.
stabilize the volatility of wind.8 This can result in
an energy charge of one- to two-cents per kWh— The actual benefits are much less. When real-
or an additional 10 to 20 percent (or more) tacked world efficiency losses and additional emissions
onto the already high cost of a wind turbine in order from the gas turbines are taken into account,
to integrate it operationally into the grid. the perceived environmental savings of wind
energy are greatly diminished.
Increase in Carbon Dioxide from Wind
Power——It is Possible Got Transmission?
In addition to the obvious investment and operating The Missing Cost Element.
cost of the shadow grid, there is another unintended No matter where you live, or how windy you think
consequence of this fossil-fueled backstop system: it is, some regions of the country see relatively little
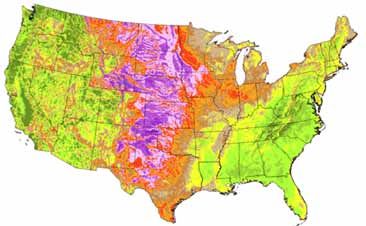
carbon emissions. As discussed above, a significant sustained wind at all. Below is a basic map of the
penetration of wind turbines into an electric grid can United States’ wind energy potential.
cause base and intermediate resources to be fired up
and energized onto the grid or dispatched at levels
where design efficiencies are very poor. This results
in unintended carbon emissions.
Think of it like this: Suppose that you were to go Wind Speed m’s
on a road trip where you are required to maintain > 10.0
10.0
an average speed of 60 mph. In the base case you 9.5
9.0
8.5
do this by setting the car on cruise control. Now 8.0
7.5
7.0
imagine an outside influence that requires you to 6.5
6.0
5.5
suddenly stop, and then rapidly accelerate to 120 Wind resource data developed by AWS
5.0
4.5
Truewind, LLC for windNavigator® 4.0
mph, and to do so at unpredictable intervals, all the Red, purple and blue areas: most economic potential
> 4.0
while you are required to average 60 mph. Can you Brown and possible green areas: most technical potential
imagine the fuel economy differences between these
two cases? This is more or less what happens to an
electric system that attempts to accommodate a high Note that the regions of maximum wind potential
percentage of wind resource into the grid. (the areas of red, purple and blue) do not coincide
with the areas of dense population. The wind speed
The concept and conclusion is as valid as it and duration are generally the greatest in the least
is alarming: populous areas far away from the big cities on
8
Energy News Data - California Energy Markets, July 16, 2010, No. 1087, 11-12.
A RATIONAL LOOK AT RENEWABLE ENERGY | 9either coast. This mismatch between resource and not in any way suggest that doing so will be an
population is one of the reasons that developers economically viable option.
of wind energy are challenged to find and exploit
locations close to existing high-voltage transmission The very best “economic potential” wind sites can
lines that can carry electricity from wind turbines to produce capacity factors in the range of 30 to
big city distribution lines. As more of these locations 40 percent, while the poorer “technical potential”
become occupied, adding more wind generators sites can be much worse at 20 percent or less.
can only happen in locations where new additional
transmission corridors are cleared and constructed, The national average performance
to carry out the delivery process from high wind through 2008, for all wind turbines in
zones to urban centers. Obviously the lack of America, was a capacity factor of about
new transmission adds a significant hurdle when 25 percent.9
considering wind development. Too often
this component of cost gets overlooked in discussing This means that, in terms of their operating
the relative costs and benefits of wind energy. This characteristics, and even for the best wind resources,
tends to duplicate the investment cost of the wind, the grid must be designed and operate as if 60 to
and will also require less efficient gas resources to 75 percent of the time a typical wind turbine
supplement the wind energy so that the composite produces very little or nothing at all. Wind is as
product is usable to the system. fickle as weather, and electrical wind generation is
as fickle as weather to the third power,10 literally.
The western continental United States is home to
eight of the largest states, in terms of land area (with The Electric Continental Divide
Alaska and Texas completing the top ten). Of these The United States electric delivery system does not
eight states, only California ranks in the top ten in operate as a single grid, but rather as three separate
terms of population. The relatively sparse population grids as shown on the map below:
in the vast, open areas call for lengthy, and therefore
NORTH AMERICAN ELECTRIC RELIABILTY
costly, transmission lines. CORPORATION (NERC) REGIONS
Technical Potential versus
Economic Potential
After studying the U.S. map (shown on the previous
page), you can easily determine where the best wind
energy potential lies. The sites of economic potential
will produce wind energy at the least cost; the sites
with technical potential will produce wind energy
but will experience relatively poor economics.
Hence if a study touts significant technical potential
to develop wind energy in a given region this does
9
.S. Energy Information Administration, Summary Statistics for the United States, (2010), www.eia.doe.gov/cneaf/electricity/epa/epates.html. Calculated
U
using total wind energy as compared to name-plate capacity multiplied by 8,760 hours per year.
10
ote that the physics of wind energy is such that the change in power of a wind turbine is proportional to the cube of the change in wind speed. This
N
means that if the wind speed cuts in half, the power output will cut to one-eighth.
10 | A RATIONAL LOOK AT RENEWABLE ENERGYBecause electric energy is instantaneously generated the job done. Besides, the current interties, being
and consumed, the operation of these grids already in service, have little excess capacity to move
requires a coordinated balancing of generation and new renewable power.
consumption of power within each grid. Control
Area Operators (CAOs) perform this function, In addition to the obvious transmission challenges
as well as other important tasks, that allow the of renewable energy, there is a virtual wall between
interconnected electric power systems and their east and west. Unfortunately, the greatest “economic
components to operate together both reliably and potential” of wind energy is electrically trapped in
efficiently. There are approximately 150 Control the Midwest. It is virtually impossible, or at least
Areas in the nation. Most are run by the dominant very cost prohibitive, to consider transmitting this
large investor-owned utility in a geographic area resource to the west. It is also impractical and cost
defined by an interconnected transmission grid prohibitive to transmit this energy to the east coast
and power plant system. The CAOs dispatch population centers that are, in some cases, more than
generators from a central control center with a thousand difficult miles away.
computerized systems in such a way as to balance
supply and demand and maintain the transmission Just as precipitation will naturally drain within a
system safely and reliably. continental divide, in similar manner the nation’s
energy resources are virtually constrained to remain
The Western Interconnect boundary (WECC) within the three “electric continental divides” of the
consists of 30 such “control areas” that include West, the East and Texas. What happens in the west
most of Montana, Colorado, New Mexico, and stays in the west. What happens in the east stays in
all states to the west. The Eastern Interconnect the east. What happens in Texas stays in Texas.
includes everything east of this border, with
about 120 individual control areas. And Texas? Wind Energy Storage——Not Ready
I guess you don’t mess with Texas! They do their for Primetime
own thing down there. What if we could just store the wind energy when
it is produced (and not needed) and then call on it in
These three grids operate independently from times of need? Consider this statement from the North
one another. Since the three large grids are not American Electric Reliability Corporation (NERC):11
in synchronous operation with one another, they
cannot be interconnected with one another through “Unlike water or gas, electricity
traditional “alternating current” (AC) transmission cannot be stored. It must be generated
lines. The only possible means of interconnection as it is needed, and supply must be kept
is through “direct current” (DC) and this is very in balance with demand. Furthermore,
costly. Consequently there are only six DC ties electricity follows the “path of least
connecting the Western Interconnect and the resistance,” so it generally cannot
Eastern Interconnect in the United States and be routed in a specific direction.
one additional DC tie in Canada. The capacity of This means generation and transmission
these ties is quite limited (due to cost). Six or seven operations in North America must
interties of several hundred MW will simply not get be monitored and controlled in real time,
11
North American Electric Reliability Corporation, About NERC: Understanding the Grid, http://www.nerc.com/page.php?cid=1|15.
A RATIONAL LOOK AT RENEWABLE ENERGY | 1124 hours a day, to ensure a consistent and according to the JEDI model (discussed later),
ample flow of electricity. This requires the would come with an installed cost of about
cooperation and coordination of hundreds $2.3 million. Storage, in this case, therefore adds
of electricity industry participants.” about 60 percent to the installed cost of wind.
Such a storage device is capable of offsetting any
Storage of electricity would, indeed, answer many unanticipated effects of the wind system for a
of the operational concerns raised when it comes to period of at least 2.5 hours, or longer. This gives
renewable energy. The notion that electricity cannot the utility system more opportunity to operate with
be stored is not entirely accurate, and in fact, there predictability; it also mates capacity with the wind
is much effort underway to develop new storage energy. The storage does not, however, mitigate the
technologies. An ideal storage mechanism would be paltry capacity factor of 25 to 40 percent energy
able to capture unlimited quantities of electricity, output that is typically associated with wind.
at a near infinite rate of charge and discharge on
demand. It would be able to hold a charge for long Based on the above estimates, storage would add
periods of time and would be free, or at least very about 4.7 cents per kilowatt-hour to the cost
inexpensive to install and operate, with little or no of wind. It is doubtful that such a system is
losses. Unfortunately, as of today, this dream set economically justified, but it is quite interesting
of criteria is a fantasy, although there is an obvious nonetheless. Such exotic storage systems are typically
need for energy storage technology. An effective reserved for the most rare of applications—remote
wave of new, renewable energy can only function islands, arctic outposts, etc., or for research
properly in a world that is ripe with near-ideal and development pilot projects. None of these
energy storage opportunities. technologies currently exist with sufficient supply
and at a low enough cost to make a meaningful
It is true that devices have been difference to the bulk power system.
invented to store bulk electric energy.
These are all miniscule in scale, and Not every region or location is suitable for the
expensive to acquire and operate. most promising storage opportunities. It should also
be noted that storage technologies always come at
One particular state-of-the-art storage device consists, a cost—both a capital cost to develop and acquire
essentially, of a high-speed flywheel (30,000 rpm) the storage mechanism, as well as an operating
that is suspended (or levitated) above cleverly cost or storage penalty (essentially the execution of
designed magnets, resulting in a storage that is thermodynamic laws). There is always some amount
almost frictionless. Such a device can begin charging of energy loss associated with storage. The flywheel
(or discharging) in a fraction of a second—it is system previously described claims a storage penalty
clearly able to respond to any sudden changes in of about five percent, including transformation,
wind or solar output. It is recommended by the while hydroelectric pumped storage requires about
developer of this technology that about 2.5 MWh 30 percent more energy to fill the storage pond than
of storage capacity (at a cost of $1.4 million) will can be extracted upon retrieval. The energy output
accommodate a wind system of about one MW of storage is always net negative.
name-plate rating. The one MW wind system,
12 | A RATIONAL LOOK AT RENEWABLE ENERGYWind Turbines can model, jointly sponsored by the Department
Consume Electricity of Energy (DOE) and the National Renewable
One of the little known ironies about utility scale Energy Laboratory (NREL). The JEDI model was
wind turbines is that they require an external source developed over a two-year period and involved a
of grid-provided electricity in order to run properly. serious collaboration of government and industry
Particularly in cold climates, where much of the best professionals to determine the jobs and economic
wind resources can be found, these units must be development costs and benefits of power generated
heated to maintain proper viscosity in lubricating by new wind, solar, gas, and coal projects.
fluids and to protect vital components from damage.
When it’s cold in Wyoming and up into the Dakota Consider the following graph showing JEDI cost
badlands where the calm night air drops to below- comparisons for wind and coal:
zero, it will be the fossil-based fuel from gas and
coal-fired power plants in the region that are DOE / JEDI WIND AND COAL COMPARISON
called upon to warm the massive wind turbines
towering hundreds of feet above the windswept 110
$104
plains. Wind turbines typically will not operate at 100
all when temperatures drop below minus 25° F. 90 $83
The turbines will also shut down when temperatures $80
80
2008 COST PER MWh ($)
rise to more than about 105º F. This further 70 $67
compounds the lack of wind turbine availability at
60
peak load conditions. $50
$48
50
40
As we gather more and more real-world data in
Wind + PTC
Wind + PTC
30
the production of wind energy, it is apparent
20
this resource has a long way to go before
Wind
Wind
Coal
Coal
becoming a viable contributor to the world’s 10
energy needs. While there may be a worthy role 0
for subsidies and taxpayer support of wind, the Costs During Costs During
Financial Life Economic Life
inescapable fact is that wind is unlikely to ever be
more than a supplemental resource, which must
be backed up by natural gas plants and/or energy As is evident, the wind power without the Renewable
storage technology. Energy Production Tax Credit (PTC) is about double
the cost of coal. Even with PTC wind is 70 percent
The Hard Realities of more costly. (The PTC is a corporate tax credit
Renewable Pricing incentive provided to industrial and commercial
Studies and claims regarding the cost of renewable companies building renewable energy plants.)12
energy abound—some seemingly very optimistic
and others less so. One established baseline value Besides the obviously lower per-unit cost, power
for wind versus coal costs is available from the from a new coal-fired facility also has the significant
Jobs and Economic Development Impact (JEDI) advantage of being available upon demand at or
12
atabase of State Incentives for Renewable & Efficiency, Renewable Electricity Production Tax Credit (PTC), (2010), http://www.dsireusa.org/
D
incentives/incentive.cfm?Incentive_Code=US13F.
A RATIONAL LOOK AT RENEWABLE ENERGY | 13near-full capacity to serve load, rather than available NV ENERGY SELECTED PROJECTS
only when strong winds are blowing. Project Type/ MW 1st Yr Price
Developer: Fuel Source: ($/MWh):
The JEDI model is a good indicator of theoretical Ormat Geothermal 25 86
energy costs. As another benchmark of the cost of Ormat Geothermal 40 88
Ram Power Geothermal 53.5 98
wind energy, let us consider data taken from actual Solar Reserve Solar w/ storage 100 135
projects being developed with real money at risk. Next Light Renewable Solar PV 50 132
Pattern Energy Wind 150 98
Waste Management Landfill Gas 3.2 81
NV Energy, the electric service provider serving
Source: Letter from Shawn Elicegui, Associate General Counsel,
Las Vegas and the surrounding area in southern NV Energy to NPSC in Docket 10-02009, July 9, 2010.
Nevada, has, since 2008, been issuing annual
Requests for Proposals (RFPs) for power from renewable energy plants come at a cost of 60 to 180
renewable energy projects to comply with percent of the JEDI per-unit cost of a coal-fired
requirements of the state Renewable Portfolio plant.
Standard (RPS).13 The most recently completed
RFP process began in 2009 and resulted in NV Value of Power——
Energy’s selection of the seven best projects based Demand versus Energy
on its bidding criteria (from among more than Commercial and industrial electric power is typically
30 responses). Contracts were executed with these priced and valued based on two components:
project developers in the first half of 2010.14 demand and energy. Demand, or capacity, is the
ability to supply electricity at the very instant it is
The table in the next column summarizes the needed. Energy refers to the amount of electricity
prices of the selected projects, all of which include that is actually delivered and used over the course of
a one percent annual escalation for the term of time (such as a monthly billing period). Depending
the contract. It is noteworthy that the solitary on the utility rate structure, the demand charge
wind project comes at a price—nearly 10 cents component can be as large or larger than the energy
per KWh—which is significantly greater than the charge component. This reflects the fact that the
baseline estimated by the JEDI model, even based utility must purchase, construct, and have available
on JEDI’s accelerated repayment of capital over only all of the generating and transmission resources
a 10-year term. necessary to meet peak demand needs, as well as the
cumulative energy needs measured over a period of a
Compare the highlighted column, the first year price month or a year.
of various renewable energy resources, with the costs
of a coal-fired plant: $50 per MWh over its financial Demand is closely associated with the notion of
life, and $48 per MWh over its economic life. The dependability or reliability.
13
The impacts of the Renewable Portfolio Standard (RPS) are significant and far-reaching. RPS will be covered in-depth on page 19.
14
ver the protests of the project developers, the Las Vegas Review-Journal filed a public records request regarding disclosure of terms of these contracts,
O
including pricing. The Nevada Public Service Commission ruled July 2, 2010 in favor of the public records request and required NV Energy to make
the pricing information public.
14 | A RATIONAL LOOK AT RENEWABLE ENERGYConsumers want the power to be there many reasons. The single greatest challenge to solar
the very instant that it is demanded. power is the immutable fact that the sun is only
available, at best, half of the time, no matter how
Having electricity intermittently available, at ideal other conditions may be.
unpredictable times and quantities, is not acceptable
in today’s electric system. A well-designed and situated solar
project will typically provide available
A practical example will help illustrate this point. energy at about 20 percent. At this
When it comes to our automobiles, we have a low availability, solar energy can never
tendency to demand cars be reliable and to be more than a supplement to a larger
meet our wants and needs at our beck and call. portfolio of power generating resources.
Consider a choice between two automobiles:
one gets 50 miles per gallon, but only runs And like wind, solar energy begs for supplemental
intermittently about 25 percent of the time; the storage in order to provide a degree of reliability to
other car gets about 20 miles per gallon, but it the grid.
runs all of the time. How would you value each
of these cars? If the first car had low fuel cost, but Not All Sunshine is Equal
no reliability, how much would you pay for such a Photovoltaic cells, or PV solar, are by far the most
car, and are you prepared to call a taxi when your common application for electric generation from
car stalls half way down the road? If the value of solar energy. Although there are other forms of
a car is based, shall we say, half on fuel economy solar renewable projects, given the availability and
and half on reliability, then the market value of the popularity of PV, we will focus on it first.
intermittent car will be intrinsically lower because
it fails to meet the primary purpose of reliable PV panels are made from materials such as crystalline
transportation. Who wants a car that rarely runs? silicon and cadmium telluride, which convert
photons from the sun’s rays into electric energy. To
This concept is very relevant to a discussion about make use of the energy produced by these cells, an
renewable energy. A claim might be made, for inverter is attached to a PV array to create alternating
instance, that a certain wind turbine can produce electric current. Some PV panels are small, roof
power at a cost of 8 cents per kilowatt hour (kWh). top applications, and a few are larger, utility scale
But cost is only half the story. The actual value of such facilities. PV solar panels have no moving parts.
power is properly assessed by considering both the Hence the operations and maintenance consists
demand and energy provided by any given resource. largely of a careful cleaning from time to time with
glass cleaner. But even a very large PV solar project
Solar Energy will have a fairly modest output.
There is significant national and international
interest in the development of new solar energy. The entire United States’ output of PV
While this is obviously an energy source that solar for the year 2009, was 807,988
has more applicability to regions with high levels of MWh, about one-tenth of one percent of
sunshine, it is a promising technology for the U.S. nuclear output.
A RATIONAL LOOK AT RENEWABLE ENERGY | 15How expensive is PV Solar? large PV solar projects, we would have to install
Apart from the day/night cycle of solar power, which a Nellis-sized facility each month for each of the
can’t be avoided, another disadvantage of PV solar is next 5,000 years.16 Indeed we are a long way from
its high cost. California provides robust rebates and accomplishing much with PV solar energy. With
incentives under its California Solar Initiative and has growth in the solar industry, there are now three
produced some valuable benchmarks for the cost of other PV solar facilities in the United States that
solar power. According to a study produced for the are larger than the Nellis facility, and 40 larger PV
California Public Utilities Commission in 2009, facilities in the world.
the price of installed PV under the California
program averaged $7,090 per kW for large industrial Given the inefficiencies of scale associated with PV
customer installations, and $8,490 per kW for solar, it is not realistic to envision the entire electric
residential installations.15 Assuming a 20 percent system consisting solely of such distributed units.
capacity factor, a cost of capital of six percent Homes cannot run entirely from PV solar panels
and a life of 25 years, the cost per kWh of these without some form of backup or battery storage.
installations would run from 32 to 38 cents per kWh. Even large arrays on commercial buildings are almost
always tied into the electric grid because of the
This example helps to explain why solar energy various shortcomings in PV systems, and largescale
is only a miniscule resource in the United States. utility systems require enormous tracts of land while
Still, solar is a growth industry and significant providing only modest energy output.
improvements in both design and cost are
forthcoming. Indeed there are anecdotal evidences Concentrated Solar
of less costly solar installations—as little as $4,000 PV technology directly converts solar energy into
per kW—but even at that installed cost, the bottom electrical energy through panels. Concentrated
line energy cost to the consumer would be in the solar, on the other hand, uses parabolic mirrors,
range of 15 to 20 cents per kWh. To be competitive, or similar technology, to focus solar energy into
solar would need to cut even further, probably heating a fluid that then goes through a heat
another 50 to 70 percent below even these levels. transfer process that is not unlike a traditional
gas- or coal-fired steam electric turbine. In fact,
Large PV Solar many concentrated solar facilities will have natural
Three years ago the much-publicized PV solar gas-based generation as a back up or supplement.
facility at Nellis Air Force Base was the largest Concentrated solar installations tend to cost around
such facility in North America, and the third largest two-thirds, or less, compared to the cost of a PV
in the world. It sits on 140-acres and produces installation. This is a significant step in the right
about 30,000,000 kWh per year. Yet this amount direction, but still very expensive power compared
of production is only equivalent to one day’s to traditional base load resources.
output of a 1,200 MW coal-fired plant. If we were
to attempt to replace the entire fleet of coal-fired Nevada Solar One boasts one of the newest and
electrical generation in the United States with largest concentrated solar facilities in the United
States. This project delivers 64 MW of capacity
15
California Energy Markets, July 2, 2010.
16
ased on the United States’ coal-fired electrical generation of 2 billion MWh per year compared to Nellis’ advertised annual output of 30,000 MWh.
B
(2 billion / 30,000) / 12 months = 5,555 years.)
16 | A RATIONAL LOOK AT RENEWABLE ENERGYand approximately 134,000 MWh of energy. intermittent cloud cover. If solar panels are spread
Gilbert Cohen, vice president of Engineering over a wide enough area, some of the cloud cover
and Operations for Solargenix, said the project effect can be mitigated through diversity. However,
installation costs are somewhere in the range of the peak solar output tends to occur prior to the
$220 to 250 million. At that price, the power is time of peak load for the utility shown in blue.
more expensive than most wind power projects, but
less expensive than typical PV projects. Energy from Based on the graphic, about 30 to 60 percent of the
Nevada Solar One currently cost about 13 cents solar peak was useful during the peak hour. The fit
per kWh.17 The developers of Nevada Solar One between solar-produced energy and the demand
believe that a target of seven cents per kWh will be curve for electricity usage is not as close as one might
achievable in the future. At that price, concentrated expect, and certainly not as good as one would hope.
solar would be fairly competitive as a viable, utility This can be significantly mitigated and improved if
grade source of power. the solar project is combined with an energy storage
facility, which would obviously add to the cost.
Solar Demand versus System Peak
A desirable attribute of solar energy is that it is A similar result can be demonstrated across a
produced during hours that roughly coincide with much larger system. Last year, CAISO reported
utility system peak loads. The coincidence is not peak demand of 45,994 MW, which occurred at
perfect, but much better than wind. Following is 3:00 p.m. on September 3, 2009. In that hour,
an actual output profile of the 100 kW SunSmart even though California had installed PV capacity of
project in St. George Utah. nearly 250 MW, that was operational and online on
the state’s electric grid, only about 144 MW of solar
St. George City peak load energy was being generated to help serve the peak
vs. SunSmart’s output: demand, or around 58 percent of the amount that
100% the installed solar units were capable of producing.
90%
RATIO: HOURLY TO PEAK
80%
70% By contrast, as of noon that same day, the PV
60% Solar output falls
50%
off daily just as load
in St. George peaks
solar units reached their maximum capacity
40% factor at about 72 percent, which is the typical
30%
20%
peak performance for the California PV system.
10%
What happened to all the rest of the capacity that
0%
1 2 3 4 5 6 7 8 9 10 11 12 13 14 15 16 17 18 19 20 21 22 23 24 should have been available? The report submitted
HOUR OF PEAK, JULY 17, 2009 Dixie’s St. George Load to the California Utility Commission indicates that
SunSmart Output
dust and dirt affect the performance of PV panels
in the afternoon, and panels do not perform at
The solar output shown in yellow tends to ramp top efficiency above temperatures of 68ºF, which
up around 10 a.m. and then ramps down in the is commonly exceeded on summer afternoons in
afternoon. The shape of the output curve is very California.18 And frankly, the sun is on its way down
predictable, barring the unpredictable effects of in the afternoon at the same time electric loads are
picking up.
17
J esse Broehl, Renewable Energy World.Com, A New Chapter Begins for Concentrated Solar Power, (2006), www.renewableenergyworld.com/rea/news/
article/2006/02/a-new-chapter-begins-for-concentrated-solar-power-43336.
18
California Energy Markets, July 2, 2010.
A RATIONAL LOOK AT RENEWABLE ENERGY | 17It is also ironic that summer PV solar output is Green Jobs—Will they
not markedly better than spring or fall. While materialize as promised?
summer days are longer, they are also hotter and A claim of “five million new green jobs” has become
unfortunately solar panels lose efficiency in the heat. something of a national mantra.19 This promise of
millions of green jobs is not supported by extensive
The Value of Solar Power—— studies performed by the DOE or NREL, at least
Demand versus Energy in terms of the electric energy sector. In its
Solar power can be used to offset the fuel costs highly developed JEDI model, the DOE calculates
of traditional power plants, but it is expensive. only 121,417 gross number of direct jobs, or
For traditional production, energy-only costs tend 2.4 percent of the five million jobs promised.
to be in the range of 1.5 to 4 cents per kWh, hence, What a disappointment!
most utilities would view the 13.5 cent cost of solar
energy as quite expensive—coming with a premium Additionally, this level of direct job creation—
of 200 to 800 percent in terms of raw energy value. 121,417 jobs—will not be achieved until 2030.
JEDI also does not account for net job losses in the
Solar is generally the most expensive coal, oil, and gas sectors of the economy for each
form of renewable energy. new job gained in the renewable sector. When wind
jobs are compared head-to-head with coal-fired
The Solar Synopsis electric alternatives, the gross job gains in wind are
Solar energy, while costly, is grid friendly. Indeed the more than offset by net job losses in coal.
general rate of change of the solar output curve is
as calm as a morning sunrise or as smooth as Every new wind-related job comes at the
an evening sunset. The peak solar output precedes a cost of 1.5 to 2.7 coal-related jobs.20
typical system demand peak, with only about
60 percent of the solar maximum still available at The JEDI model also fails to account for the
the time of actual utility demand peak. Compared to dampening effect on the economy of significantly
wind, the solar output shows a significant advantage higher power costs associated with wind power, as
as a fairly reliable peak-period supplier, especially well as carbon tax programs. Yet it is quite clear that
when combined with a reasonable investment in the country depends on low-cost, abundant energy
complementary storage and/or backup resources. to power its economy.
The major hurdle with solar is cost. It is generally the With all factors considered, a green mandate in
most expensive form of renewable energy. However, the electric sector will not meet the goal of five
significant strides are being made to bring down the million new jobs and, in fact, will likely result in
cost and increase the reliability. Solar is not net job losses.
“in the money” yet, but with continued support
from taxpayer subsidies and incentives, solar is likely
to be a capable and significant resource of the future,
at least in some regions of the country.
19
Barack Obama and Joe Biden, “New Energy for America,” (August 3, 2008), www.barackobama.com/pdf/factsheet_energy_ speech_080308.pdf.
20
From testimony given by Kimball Rasmussen to the U.S. House and Senate Western Caucus on Energy Issues, July 30, 2009, based on the
“Jobs and Economic Development Impacts Model” developed by the U.S. Department of Energy, in a side-by-side comparison of wind and
coal, and published by Rasmussen in A Rational Look at Green Jobs and the Implications for the U.S. Power Sector, (September 2009).
18 | A RATIONAL LOOK AT RENEWABLE ENERGYYou can also read