Solar energy vision for Ethiopia - Opportunities for creating a photovoltaic industry in Ethiopia by Ethio Resource Group
←
→
Page content transcription
If your browser does not render page correctly, please read the page content below
Solar Energy
                                                          Development Association
                                                                  Ethiopia

          Solar energy vision
                   for Ethiopia

Opportunities for creating a photovoltaic industry in Ethiopia

                                by

                    Ethio Resource Group

            Freiburg (Germany) / Addis Ababa (Ethiopia)

                               2012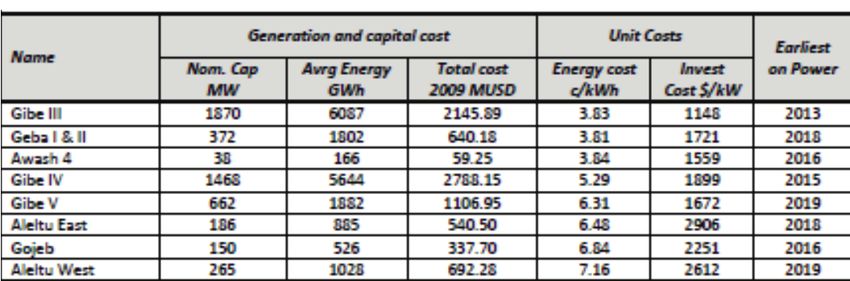
First published in 2012 Publisher: ISEI. International Solar Energy Institute, Germany / Ethiopia Stiftung Solarenergie - Solar Energy Foundation, Ethiopia Solar Energy Development Association, Ethiopia Author: Ethio Resource Group, Addis Ababa Copyright © ISEI. International Solar Energy Institute, Freiburg (www.isei.org) All rights reserved. No part of this publication may be reproduced, stored in a retrieval system, or transmitted, in any form or by any means, electronic, mechanical, photocopying, recording or otherwise, except as expressly permitted by law, without the prior, written permission of ISEI. International Solar Energy Institute (www.isei.org).
Table of contents

1. Introduction ............................................................................................................................................................. 3

2. Electricity sector context ......................................................................................................................................... 5

3. Demand for solar electricity .................................................................................................................................... 8

4. Value of a domestic photovoltaic industry ........................................................................................................... 12

5. Strategies for a PV industry in Ethiopia ................................................................................................................ 15

Bibliography.............................................................................................................................................................. 244

Summary
Solar electricity has clear advantages in accessibility, cost and reliability compared to traditional means of rural
electrification. In the mid to long term solar electricity will also be competitive on the grid. The relative benefits of PV
compared to the traditional alternatives are increasing because of rapidly declining costs, improving quality and
reliability, and proven models of technology diffusion.
Ethiopia has a large population with a rapidly growing economy and very low level of electrification. Photovoltaic
systems are cost-effective and reliable means to increase access not only to electricity but also to information and
communication through mobile devices. PV is already an important source of power for the mobile network in
Ethiopia – it will also be important for of energizing social institutions such as schools, clinics and water supply.
The large domestic market, increasing disposable incomes, and growing technical workforce should enable Ethiopia to
develop a sustainable PV manufacturing and distribution industry. Its sizable domestic market should also enable it to
position itself as the regional solar energy hub. It is estimated that a local manufacturing and service industry for PV
systems can create 50,000 full time skilled jobs by 2020. This, however, requires conceptual transformation for the
sector – the existing sector set up is inadequate to achieve this vision. Policy and regulatory issues must be resolved
and sector development support must be adequately provided. Since new industries are constantly faced with new
challenges the key is to have a strong institution to address them effectively as they appear.
Such an institution could be the rural electrification support unit within the Ministry of Water and Energy. This unit
must be truly capable and empowered; flexible in its operations; and be able to work with industry actors. It should
first work to improve the policy and regulatory environment, and then attract resources to provide adequate sector
development support.
1. Introduction
Ethiopia has 84 million people in 18 million households (2012). The population is growing at 2.6%
annually and projected to reach 103 million in 22 million households by 2020 (CSA, 2011). More than
eighty percent of the population resides in rural areas. Two-thirds of the population is under 25 years of
age, and a third of the population is between the ages of 15 and 35.

The country encompasses an area of 1.1 million square kilometers with sharply contrasting geography and
climate. About two-thirds of the population lives in the highlands (higher than 1,500masl) which constitute
about a third of the total landmass. The highlands are characterized by cool and wet or cool and semi/arid
climate. A third of the population lives in the lowlands which are characterized by hot and humid or hot
and arid climates.

Agriculture is still the main economic activity in Ethiopia: it is responsible for 41% of the gross domestic
production (GDP) and employs more than thirteen million households. Population densities are relatively
high in the highlands where the main source of livelihood is mixed crop and livestock production. The
lowlands are sparsely populated and rural inhabitants in these areas practice mainly pastoral (livestock) and
agro-pastoral production.

The industry and services sectors contribute 13% and 46% to GDP respectively. Industrial output is
derived mainly from construction and manufacturing. The services sector is dominated by small scale
commercial distributive services. The economy has grown at an annual rate of 11% over the past five years
and per-capita GDP now stands at US$400. The short term government plan projects 11% annual growth
for the economy as a whole and 20% annual growth for the industry sector specifically.

1.1 The energy sector in Ethiopia

The latest national energy balance indicates that Ethiopia consumed 1.3EJ of energy in 2010. This was
derived from biomass fuels (92%), hydrocarbons (7%), and electricity (1%). The main consumers of
energy were the residential and service sector (93%) and transport (5%) with the remainder going for
industrial and other applications. Rapid economic growth has increased the pace of energy demand growth
in Ethiopia: 6% for biomass fuels, 11% for electricity, and 11% for petroleum products.

Figure 1.1 Energy supply, 2010.                           Petrole
                                                                                  Others
                                                                                              Transp
                                                   Coal                            1%
                                                            um Electric                         ort
                                                   0%                                Indust
                                                           7%     ity                          5%
                                                                                        ry
                                                                  1%
                                                                                       1%

Total energy supply = 1.3EJ.
Per-capita consumption: 960kg/year of            Biomas
biomass, 25kg/year of petroleum, and                s
                                                  92%                                Reside
40kWh/year of electricity.                                                            ntial
                                                                                      93%
Source: MWE, 2011.

1.2 Strategies relevant to the energy sector

The Ethiopian government has issued sectoral and cross-sectoral policies, strategies and plans to guide its
actions. Some of these have been in place since the early 1990s while others have been very recent. The
most important and recent of these include the Climate Resilient Green Economy Strategy (CRGE, 2011)
the Growth and Transformation Plan (GTP, 2010), and Strategic Plan of the Ministry of Water and Energy
(MWE, 2011).

The Climate Resilient Green Economy (CRGE) strategy integrates accelerated economic growth with
climate resilience and GHG abatement. The four focal strategies are (a) improvement of agricultural
production practices to enhance food security while reducing emissions, (b) protection of forests for

                                                                                                           3
economic and eco-system services and as carbon sinks, (c) expanding electricity generation from
renewable sources of energy, and (d) leapfrogging to modern and energy-efficient technologies (CRGE,
2011b).
Traditional growth path Low carbon, green growth path
Energy Dependence on imported fossil fuels Sufficient renewable energy resources to
High GHG emissions support economic development
Power shortages and restricted Exporter of clean energy regionally
coverage Expansion of rural energy coverage
Economy wide Dependent on commodities and Macroeconomic conditions bring job and
international price fluctuations wealth creation, reduce poverty
including oil price Increased exports, reduced imports
More than 70% of Ethiopians depend on fuel based lighting including fossil and solid biomass fuels (CSA,
2012b) and a relatively small segment of the population also uses fuel based electricity generators. This
contributes to greenhouse gas emissions, air pollution, and local environmental degradation. The green
growth strategy seeks to displace fossil and solid biomass fuel use for lighting and other applications by
renewable sources of energy including hydro, wind and solar.
The Growth and Transformation Plan (GTP) is the short term national development plan for 2011-
2015. The plan envisages rapid growth (11%/year) and increased role for industry in the economy
(industrial growth of 20%/year). Development of infrastructure and in particular expansion of energy
infrastructure features prominently in the plan where it accounts for 40% of the total investment allocated
for the period (MOFED, 2010).
The energy plan in the GTP is heavily biased towards expanding the grid electricity infrastructure
including building hydro and wind generation facilities and investment in transmission and distribution.
Unit Base - 2010 Target - 2015
Power
Installed power MW 2,000 8,000
Distribution lines km 126,038 258,038
Transmission lines (66kV and above) km 11,537 17,053
Customers No. (million) 2.0 4.0
Telecom
Mobile phone users No. (million) 6.5 40.0
Mobile network access % < 50% 90%
The energy sector strategic plan (2011-2015) specifies the energy sector vision and goals for the period.
The plan puts in detail the goals stated in the GTP; quantitative targets are provided for both grid and off
grid electricity as well as for other energy applications. Solar electricity appears to be the principal choice
for off-grid electrification according to the Strategic Plan where the target is to distribute more than 3
million solar home systems by 2015 (MWE, 2010b).
Unit Base - 2010 Target - 2015
Off-grid power
Solar home and institutional systems No. (million) < 0.02 0.15
Solar lanterns No. (million) < 0.02 3.0
Other energy programs
Solar thermal systems (cookers, heaters) No. NA 13,500
Liquid biofuel production Liters (million) 7.0 1,630
Clean cook stoves No. (million) 7.0 16.0
The strategies envisioned for accelerating the uptake of off-grid and alternative energy systems are (a)
promoting greater participation of government and non-government actors and improving coordination for
greater effectiveness, (b) developing the market for off-grid and alternative systems through public
education, and (c) improving access to finance to suppliers and users, again to increase access to these
systems.
42. Electricity sector context
Electricity production and supply in Ethiopia is dominated by the state owned Ethiopian Electric Power
Corporation (EEPCO). At the end of 2011 EEPCO had 1998MW installed capacity, and sold 3,845GWh of
electricity to 1.9 million customers. The combined capability of power producers other than EEPCO, either
in centralized off-grid systems such as diesel generators, or in user owned petroleum or renewable based
generators, is believed to total less than 50MW, i.e., less than 3% of EEPCO’s capability.
EEPCO’s power generation capability is nearly entirely from large hydropower plants – in 2011, for
example, 11 hydropower plants accounted for 99% of the electricity supplied by the company. Diversity of
the power generation mix is very low currently but expected to improve in the near future mainly due to
commissioning of new wind power plants (320MW of wind power coming online by 2013 and additional
500MW by 2015/16).
Electricity sales on the EEPCO system has shown marked growth in the past two decades: growth was less
than 5% before 2001 but slightly above 10% after 2001. Residential demand on the system has grown
at11% annually between 2001 and 2010. Note that the period of rapid growth after 2001 was also
accompanied by frequent and substantial power black outs due to capability limitation – demand growth
with non-constrained capability would have exceeded 20% during this period.
Figure 2.1 Electricity sales (EEPCO) 3.500
3.000
GWh
2.500
2.000 Industrial
1.500
Commercial
1.000
500
Residential
-
1990 1995 2000 2005 2010
Source: EEPCO, Brief Statistics (several years)
The current five year plan for the power sector envisions increasing installed capacity four fold, doubling
the transmission and distribution infrastructure, and doubling the total number of customers. Review of
achievements in the past decade show mixed results: capacity additions have been realized rapidly,
however new customer connections have slowed down after rapid connection rates between 2004 and 2010
(Figure 2.2).
EEPCO has 1.9 million customers, 1.65 million of which are residential customers (2011). Nearly twice as
many residential customers or 3 million households share meters with EEPCO customers bringing the total
number of households with connections to some 4 to 5 million or 25 to 30% of the population (Figure 2.2).
Figure 2.2 Electrification rate 20
Million households Electrified - shared
15
Electrified
10
Not electrified
Actual rate 2001-2011 5
Ambitious electrification projection 2012-2020
The ambitious rate assumes doubling of the customer -
number in 2010 by 2015 then again by 2020 2000 2005 2010 2015 2020
The number of households is increasing by 2.6% annually or by 0.42 million households each year. This is
in contrast to EEPCO’s highest annual residential connection rate achieved in the past decade, 0.23
million, which is only about half of the growth in number of households. This means the population not
5getting connected by EEPCO is increasing in absolute terms and only slightly declining in terms of percent
connected.
More than eighty percent of the population still lives in rural areas and this continues to be a challenge to
increasing access to electricity from the grid. The current short term plan (the GTP) envisages doubling the
number of residential customers by 2015; however, this goal appears to be slipping – customer connection
rates have slowed down in the past two years (for example, there were fewer than 100,000 new residential
connections in 2011). However, even with full realization of the GTP goal and similarly very rapid
connections in the succeeding five years, fifty percent of the population or ten million households, may
still not be connected to EEPCO supplies (Figure 2.2).
2.1 Solar electricity applications
The first PV systems were installed in Ethiopia in the mid 1980s - these systems were installed for rural
home lighting and for school lighting. The largest of these was a 10.5kWp system installed in 1985 in
Central Ethiopia which served 300 rural households through a micro grid in the village. This system was
later upgraded to 30kWp in 1989 to provide power for the village water pump and grain mill.
It is estimated that a total of some 5.3MWp of PV is now in use in Ethiopia. The main area of application
for PV is now off-grid telecom systems (particularly for mobile and landline network stations) which
account for 87% of total installations. PV systems are also used in social institutions including health
stations, schools and for water pumping. Some thirty thousand residential customers are also electrified
with PV in rural areas.
Figure 2.3 PV capacity, kW, 2011 6.000
kW
5.000
4.000
3.000
2.000
1.000
-
Home &
Telecom School Health Water Total
business
Public 4.600 101 170 40 4.911
Source: ERG. Private 48 48
NGOs 28 191 30 56 305
Telecom application of PV, particularly for mobile network supply, is increasing rapidly and accounts for
87% of the total PV capacity installed in Ethiopia. Application in this sector is expected to increase rapidly
due to the near universal access to the mobile network planned by the government by 2015. It is to be
noted that the great leap in rural connectivity is due to PV powered mobile stations and PV powered
wireless phone stations.
2.2 PV sector actors and activities
PV installations in the early days were mainly project based government and NGO action and systems
were provided as grant to users. Project based installations are still important, particularly for institutional
systems (schools, health centers, and water pumps). However, both government and NGOs now realize
that only market based interventions will enable wider dissemination and also sustainability; they now
combine project (grant) based actions with market mechanisms and focus on market and capacity
development.
PV market and actors in Ethiopia can be broadly divided into three: (a) Telecom, (b) government and
NGOs, and (c) private driven. The Telecom market is by far the largest; systems and services are provided
mostly by foreign telecom contractors. PV systems for other government and NGO projects are provided
by external and local PV companies; local private company roles have been limited to installation in the
6larger projects. The local private sector is involved in PV system supply to government and NGO projects
and more recently also promoting off-grid systems.
About fifteen private companies distribute (import, install and service) PV systems in Ethiopia. Five of
these companies account for more than eighty percent of the systems supplied or installed (excluding
Telecom systems). The role of private companies had been limited to product supply and service to
government and NGO projects prior to 2000. Although government and NGO contracts are still important
to their business, private companies are now more active in promoting PV in rural areas particularly for
home use.
The Ethiopian PV market is still government and NGO driven and less than 5% of the system provided
goes through purely market means. Private companies have therefore been suppliers of systems and
services to such projects rather than addressing the market directly. The PV market is very small in
Ethiopia (particularly so when the telecom market is excluded) and this does not promote specialization
and market links which in turn increases transaction costs.
Table 2.1 Major actors and activities in the PV sector, 2011
Project Size (kWp) Description Application
Ethio Telecom 4,600 Up to 15kW per Increased rural connectivity, access to information,
mobile station
Rural Electrification 40 1,111 Solar Home Provide lighting service for 1,111 off-grid rural
Fund (REF) – Solar Systems installed households, better lighting improved education, access to
Home Systems communication through radio/TV, reduced indoor air
pollution due to kerosene lamps
REF – Institutional 124 345 Institutional solar 345 off-grid rural health posts electrified with solar PV
PV-1 PV systems installed system, improved health services
REF – Institutional 92 300 Institutional solar 200 rural health posts and 100 rural schools in off-grid
PV-1 PV systems installed areas electrified with solar PV system, improved health and
education services
REF – Institutional 55 270 Institutions solar 270 rural schools in off-grid areas got access to electricity
PV-2 PV systems installed using solar PV systems
REF Solar Home 1,250 25,000 Solar Home
Systems - 2 Systems; size ranges
20Wp to 130Wp
GIZ Energy 155 100 Institutional 100 rural health clinics in off-grid area are electrified with
Coordinating Office systems installed; solar PV system. Provide better health service for 24 hours
(ECO)-1 1.4kWp to 1.7kWp a day.
GIZ-ECO-2 8 5 community battery Increased access to electricity through solar PV systems.
charging systems; Replaced kerosene lamps, improved education, reduced
1.53kWp each indoor air pollution
Solar Energy Solar home, 11,012 Solar lanterns;
Foundation (SEF) community and SHS 8,872 for households, small enterprises, schools,
institutional systems clinics, churches, mosques, community houses etc.
5.5kWp water pump for Rema community
6kWp water disinfection system in Rema
7 x 80Wp solar street light systems in Rema
2kWp for Solar Training School in Rema
9kWp Solar system for Solar Valley Addis (Int. Solar
Energy Institute)
Plan International 85 Institutional PV and 15 rural schools, 12 health posts and 13 solar pumps in off-
Ethiopia - EU grant Community system grid rural areas were installed. Improved education,
for energy access evening classes, improved access to potable water,
improved health services to rural communities.
Menschen für Solar home and 1,314 x 10Wp Solar systems and 144 x 20Wp systems for
Menschen (MfM) institutional systems rural schools
29 health posts with 260Wp solar system for medicine
cooling and light
Source: ERG.
73. Demand for solar electricity
The outlook for the solar electricity sector in Ethiopia is for rapid increase in installation for off-grid
applications and later for grid connected applications. Off-grid applications will be dominant in the short
term but grid connected PV may become important in the medium and long term. Short term plans that
have direct relevance for the PV sector include plans to disseminate more than 3 million PV home systems
and plans to increase mobile ownership to 40 million.
Off-grid telecom applications now account for
87% of the total installed PV capacity in
Ethiopia. Strong growth is foreseen in the
coming ten years for this segment due to the
drive for universal access to mobile Off grid Off‐grid
connectivity (the plan is for 90% mobile Telecom Residential &
network coverage and for 40million mobile Mobile and other institutional
users by 2015). This will result in doubling of stations, wireless phones (commercial, social)
installed PV capacity by 2015 then again
87% 13%
doubling by 2020. This will be public sector
driven demand and is highly likely to be
realized.
On grid On grid
Off-grid residential applications will be an distributed grid connected
important segment of the demand for PV in the applications power
medium to long term. The demand for this Phone boxes Grid connected PV
segment of the market will be mainly private & Power backup
~0% 0%
sector driven and will depend on policies and
regulations in place. Existing government plans
for 3 million solar lanterns and home systems is
expected to spur rapid growth increasing
installed capacity by ten fold in the next five
years. Off-grid institutional applications will
also be important in the short term.
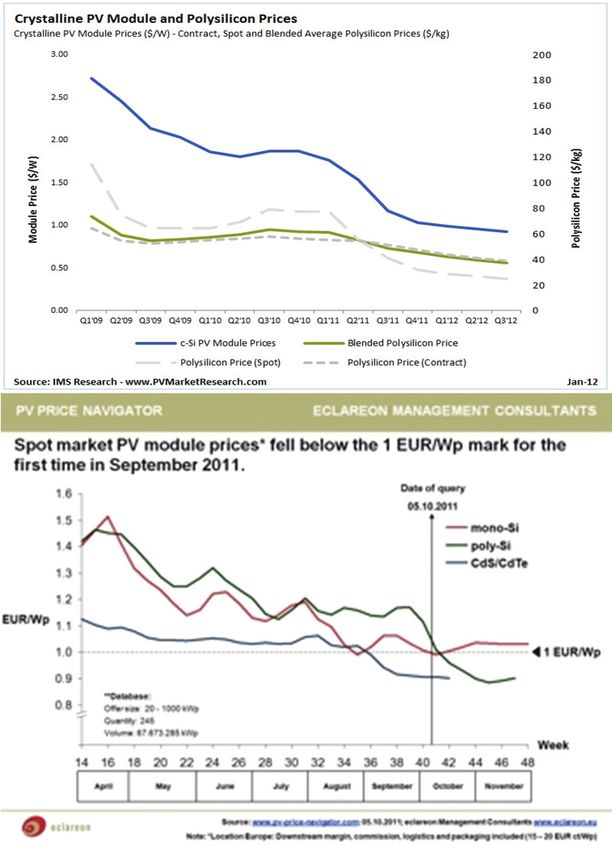
Grid connected PV is likely to be a major market in Ethiopia in the long term. Prices for PV systems are
falling rapidly going to grid parity. PV is expected to become grid competitive in the developed world
when installed cost of systems reaches the US$3/Wp mark which may be realized before 2015. PV will
also be grid competitive in Ethiopia when installed cost reaches US$3/Wp, in which case solar electricity
may be delivered at US$0.13/kWh.
3.1 Demand for PV for off-grid applications
Off grid PV applications include home and institutional lighting, mobile charging, running audio-visual
equipment, refrigeration and diagnostic equipment in heath facilities, water pumping, and powering
telecom stations. Off grid PV systems range in size from the smallest 1Wp solar lantern to a village micro
grid serving several hundred households and institutions.
PV systems are ideal to address small levels of demand in rural areas for the following reasons:
In the short to medium term it will be impossible to reach the scattered population through the grid
and PV will be ideal for such markets.
For a typical rural scattered settlement the unit cost of investment is lower for PV compared to grid
extension or petroleum based alternatives. This investment gap is increasing due to declining demand
levels because of the predominance of high efficiency (CFL and LED lighting) and low power (mobile
charging) devices.1
Investment on user connection is optimally sized (in contrast to a grid system where very similar
levels investment is made irrespective of demand levels)
1
For example, a household that traditionally used four 60W incandescent lamps totaling 240W now needs only four
CFL or LED lamps totaling 48W. A village of fifty such households which would have required 12kW now requires
only 2.5kW. This means it becomes even less economic to extend grids to such villages than in the past.
8 Investment in system is wholly covered by private funds (in contrast to grid extension where the
largest investment cost is covered by public funds)
PV systems are very reliable – crystalline PV modules installed 20 years ago still provide practically
the same level of output
Demand for off-grid power (in small quantities) is increasing rapidly due to rapid access to the mobile
phone network; access to the grid cannot grow as rapidly. The number of mobile users will overtake
the number of households connected to the electrical grid in 2015! The GTP, for instance, projects
increasing grid connected customers to 2 million households (10 million people) while the plan for
mobile ownership is 41 million (in more than ten million households).
Distribution and service of PV systems will create local jobs and incomes (in contrast to grid
distribution where jobs and incomes are centralized)
Off-grid systems may be categorized into three segments: home systems, institutional systems (for
individual institutions, for water pumping or for telecom stations), and village micro grids. Unit costs
decline as system size increases, i.e. cost per unit of energy produced (Birr/kWh) is higher for small home
systems compared to large institutional systems and village micro grids (usually due to higher per unit
costs for Balance of System (BOS) components in smaller systems).
a. Residential systems
Home systems can vary in size from a 1W lantern to 100W or larger systems providing power for lighting,
audio-visual and ICT equipment, refrigeration, and other applications. PV home systems are the least cost
and often the only option of electrification of scattered rural settlements. At least two-thirds of the rural
population or more than forty million people in eight million households live in such settlements.
Connection of such very low density areas to the power grid will be too costly – it will require installation
of hundreds of meters of distribution line for each household to address very low demands.2
There are about ten million off grid households at present and there would still be ten million off-grid
households in 2020 (see Figure 2.2). The technical potential for PV home systems is therefore ten million
households in 2020. Addressing just half of the off-grid population with middle to highest expenditure
quintile will create a market for 3 million solar home systems. The total demand from these households
will be 60MW.
Table 3.1 Electricity expenses: baseline vs. solar home systems, rural areas, 2011
Energy Energy Lighting Lighting &
Expenditure expense share expense expense charging Solar system buyable with
rural $/hh/y (2005) ($/y) est. ($/y) cost est. ($/y) 2-year electricity expense
Lowest 20% 861 5.1% 44 12 12 PV lantern
Second 20% 934 5.0% 47 12 24 PV lantern with mobile charger
Middle 20% 1,030 4.7% 48 18 30 10W SHS
Fourth 20% 1,169 3.9% 46 18 42 20W SHS
Highest 20% 1,874 2.3% 43 >24 >48 Systems larger than 20W
Note that despite significant variation in total expenditure levels by income quintile energy expenditure in absolute amounts (Birr or $
spent) is practically the same for all income groups. Energy expenses include cash outlays and imputed costs (for example, for freely
collected fuels). Lighting fuel expenses are estimated to account for a quarter (lower income levels) to half (higher income levels) of
total energy expenses. Mobile charging costs are estimated to range from nil (lowest 20%) to $2/month (highest 20%).
Sources: Mean rural per-capita expenditure (MOFED, 2012) distributed by expenditure quintile using distributions in 2005 (CSA,
2007); energy expense share for 2005 (CSA, 2007).
Coverage, ownership and desirability – mobile phone vs. electricity
Mobile phone ownership has reached 24.7% of households in 2011 – 65.2% of households in urban
areas and 12.8% of households in rural areas (CSA, 2012a). This is related to mobile network
coverage of 12% in 2011 (MOFED, 2010). In contrast rural household electricity connection was only
4.8% in 2011 (CSA, 2012a). This leads to two important conclusions: (a) rural mobile ownership is
2
Rural settlement densities are about 15 households/km2 compared to 50 to 100 times more for a town or city.
9going as fast as mobile network coverage, and (b) the majority of rural mobile phone owners are not
connected to electricity.
Mobile phone owning households in rural areas had already reached 1.75 million in 2011. Rural
mobile ownership can be expected to reach 45% (this is the planned mobile network coverage for
2015) or 6 .8 million households by 2015. Since the electrification rate is going much slowly than
mobile phone network coverage more than two third of rural mobile phone owners (or more than 4
million households in 2015) would not be connected to electricity. This will create a large demand for
off-grid power in rural areas which solar electricity is best suited to address.
The significant rural ownership of mobile phones also negates the notion that capacity to pay in rural
areas is inadequate to cover costs of solar systems. The cheapest mobile phone costs Birr 400 (US$23)
and owners must pay Birr 35/month (US$2/month) to cover minimum monthly call charges and
mobile phone battery recharges. First year ownership and operating expenses thus run to Birr 820
(US$47). Mobile phones are usually purchased on cash basis without any formal financing (although
owners may finance their purchases from loans from family and friends).
Solar home systems are highly valued although they may not be as desirable as mobile phones.3Home
systems can provide the mobile charging requirement of a household in addition to replacing lighting
fuel requirements – they, therefore, complement mobile phone ownership while substituting fuel based
lighting. These two services are worth at least US$2/month for a mobile owning household. The
yearly mobile charging and lighting fuel expense avoided (US$24) is sufficient to purchase the basic
solar lantern with mobile charging capability.
b. Institutional systems
Universal access to basic services for health, primary education, water supply and communication is a key
government goal. The number of service facilities has grown very rapidly over the past ten years and
universal access is expected to be achieved by 2015. A large proportion of these facilities are situated in
off-grid rural areas and quality of service suffers from lack of adequate power to run important applications
(for example, refrigeration in a health post, and educational media in schools).
There is one or more social (health post, primary school, water pump) service centers in a Kebele – i.e.
there are more than 40,000 such centers in off-grid rural areas. Each of these facilities requires 300W
(lights and refrigeration for health posts, lights and audio-visual media for schools) to 1,000W (for water
pumping). The total demand for universal electrification off-grid social institutions will be about 20MW.
Universal access to the mobile network will require hundreds of new mobile stations each requiring
15kWp – total demand from 500 new stations will be about 7.5MW.
Rural businesses consist of food and drink houses, consumer product retailers, tailors, and open market
stalls for food and other items. These businesses are usually located in the Kebele center. Rural businesses
require electricity mainly for lighting, mobile charging and audio-visual equipment. A typical rural
food/drink house will require several lights and power for a TV totaling 50W or more. The combined
power requirement for providing power to just two such businesses in each of the ten thousand non-
electrified rural Kebeles will be 1MW.
3.2 PV within the grid
PV prices are coming down fast, going to grid parity. The projection is that grid parity may be reached in
developed countries when prices by 2020 (IEA, 2010; p. 3):
PV will achieve grid parity – i.e. competitiveness with electricity grid retail prices – by 2020 in many
regions. As grid parity is achieved, the policy framework should evolve towards fostering self-sustained
markets, with the progressive phase-out of economic incentives, but maintaining grid access guarantees and
sustained R&D support.
3
Mobile phones may be more desirable for the household member who makes major purchase decisions in the
household or the family in general – because they enable communication for security, social or business purposes and
also because they are visible personal status symbols.
10Present PV system prices are so low that they are becoming competitive with some thermal systems. Grid
parity will come later in developing countries because of generally lower generation and transmission costs
for the grid. However, cost of power generation on the grid is rising while PV prices are dropping closing
the cost gap. This is opening up the market for grid connected PV and governments are now considering
them as feasible alternatives.
For example, the 265MW Aleltu West hydropower plant planned to be commissioned in 2019
will cost US$0.072/kWh (EAPP, 2011). Transmission and distribution will add US$0.04/kWh
increasing delivered cost to US$0.12/kWh. In this case PV can reach grid parity if installed cost
(including PV modules, inverter, other auxiliary equipment and service charges) declines to
US$3/W4 – which is very likely to happen in the coming five to ten years.
Local production of PV components may lower production costs; and expanding market for PV systems
will lower costs of distribution and installation. These two together will reduce installed cost for PV and
cut the length of time required for grid parity.
250
Figure 3.1 PV demand in Ethiopia MW
200
Grid
150 connected
Off-grid -
100
institutional
Off-grid -
50 residential
Telecom
Source: ERG estimates based on potentials. 0
2010 2015 2020 2025
3.3 Regional demand
The immediate major markets for PV produced in Ethiopia would be South Sudan, Kenya, Uganda, and
Tanzania. Regional off-grid markets would be high for mobile networks and home systems; in the long
term PV may also be promoted on the grid.
Ethiopia will have the largest regional power market and also the largest PV market by 2020 compared to
countries in the region. This favors Ethiopia to be the regional center for PV manufacturing. However,
other countries in the region are already in the process of establishing PV manufacturing capability – for
example, recently a German PV company (Centrosolar) opened the first PV module assembly plant in
Kenya.5
4
1Wp PV produces about 20kWh of electricity over 20 years: Present Value (5%, 20 years, 1.8kWh/y). Installed cost
of US$3/W implies US$3/20kWh or US$0.13/kWh.
5
Rivers State News, September 2011 (http://www.riversstatenews.com/first-solar-module-factory-in-east-africa-
opens-near-nairobi/)
114. Value of a domestic photovoltaic industry
The PV value chain consists of manufacturers, distributors, installers and service providers of PV systems
and associated components. Research and development and marketing are parts of each segment of the
chain; R&D is particularly important in upstream activities while marketing is important in downstream
activities. Upstream activities are large scale undertakings with international focus while downstream
activities are small scale activities with local focus.
Figure 4.1 The PV value chain
Macro context: enablers – policies, strategies, plans, regulations
Meso context: supports – capacity building, market development
Poly- Distrib Installa
silicon
Ingot Wafer Cell Module BOS
ution -tion Service
Note that BOS (Balance of System) includes batteries, charge regulators, invertors and others.
Production scale, i.e., capacity by a single manufacturer, declines down stream as does the investment
required per unit of watt produced ($/Wp) and the technical knowhow. The number of jobs created per unit
of watt produced or distributed increases downstream. Generally, the barriers for entry are high for
upstream activities (these are very few capital and knowledge intensive industries with very large
capacities) whereas there are fewer barriers for entry into downstream industries (less capital and
knowhow). These characteristics of the sector are illustrated in Table 4.1.
Table 4.1 PV industry investment, jobs, value added and barriers to entry
CAPEX Jobs/MW Value Production Technical
M$/MW US$/Wp, scale knowhow
Silicon 0.8-1.5 0.30-0.50
Ingot,
Wafer
0.7-1.0 3-4 0.10-0.30
Cell 0.4-0.8 0.25-0.80
Module 0.1-0.5 2-4 0.35-0.70
Balance of System 1/50SHS
1.60-3.60
Distribution, 1,000/MW
Installation, Service
Source: Morgan et.al. 2006 (CAPEX); Sovacool, et.al. 2011 (Jobs for BOS and distribution) Gunther, 2010 (value added)
Important conclusions from the above figure include (a) investment requirements are much lower for
downstream industries starting from module manufacture; (b) value added is relatively high for
downstream activities: for example, module assembly accounts for 28% of the module cost; and (c) the
number of jobs created in downstream activities, particularly for distribution and service, can be quite
high.
The PV industry has seen unprecedented changes in the past two years where prices have fallen by more
than 50% for modules and prices for upstream outputs such as polysilicon has dropped by more than 70%.
This shakeup of the industry has accentuated the advantages in downstream activities: downstream
industries now account for a larger share of the total value added in the industry.
124.1 Assembly of PV modules and BOS components
The relative barriers to entry and the benefits in value added and employment in the PV value chain
indicate that focus should be in the last three stages – PV module and BOS assembly, and distribution and
service. PV module and BOS assembly account for about 50% of the total value added in the hardware and
the hardware accounts for about 50% of the installed cost – i.e., module and BOS assembly contribute 25%
of the total installed cost. Distribution and service account for 40% of the installed cost. This means about
two-thirds of the total installed cost for PV systems can be locally supplied.
Local PV assembly will have significant benefits in value addition and employment – however, the extent
to which this can be achieved depends on local capacity to deliver components other than the PV cell.
Materials required for PV module manufacture, other than the PV cell, include glass, frame, ribbon, and
adhesives. The share of the potential value added that can be made here will depend on which of these
other components can be produced locally.6
Figure 4.2 Value in PV module manufacture
2,50 100%
$/W
2,00 0,70 80%
Module
Module
1,50 60%
Cell
0,80 Cell
1,00 40%
0,35 Ingot/Wafer
0,30 Ingot/Wafer
0,50 0,25 20%
0,10 Silicon
0,30 0,50 Silicon
- 0%
Low High Low High
Assembly of BOS components will be the first step in the localization of the PV technology in Ethiopia.
Local capability and experience exists for this – two companies have been assembling charge regulators;
existing automotive battery manufacturers can also supply appropriate batteries for the PV industry.
Starting assembly of charge regulators will be a good entry point into low-cost and medium-skill electronic
assembly. Battery manufacturers will have a larger market than the automotive battery market (if the PV
market develops to its full potential there will be twice as many solar systems as vehicles in ten years).
4.2 Characteristics of the domestic PV sector
The PV sector in Ethiopia is small and the main applications are for telecom stations and for off-grid
lighting. PV modules and balance of system components are all imported. Both foreign and domestic
companies are engaged in the distribution and service for PV systems (for example, PV systems for
telecom stations are imported and installed by Chinese telecom companies).
Table 4.3 Domestic PV sector – market and present setup
Market size VA Value Companies Jobs
MW, 2010 US$/W MUS$, 2010 No. No.
Import 1.0 2.0 2.0
10 30
Import 1.0 1.5 1.5
Domestic, external 1.0 0.5 0.5 10-20 200
Source: ERG estimates.
6
For example, glass constitutes 67% of the weight of the PV module, local production of glass would be a great
advantage; but making PV grade glass may not be economically feasible here (because of scale).
13The present setup of the sector is based on imports and significant role of foreign companies in installation.
More value added and jobs will be created with larger market, local assembly of modules and BOS
components, and extensive network of local distribution and service. An accelerated development of the
sector could increase the value four-fold and employment by more than hundred times present levels
within five years.
The Bangladesh PV program which was initiated in 2003 has created employment in BOS assembly,
system installation and service for 12,000 people for a cumulative installed system of about 0.6
million solar home systems or for a total installed capacity of about 10MWp by 2009 (Sovacool,
2011). This is equivalent to one full time job for every 50 households served.
The plan to distribute three million solar home systems (including solar lanterns) and several thousand
institutional systems will create employment for more than 50,000 people for installation and service.
There would be additional employment effects through part time jobs in complementary industries and
services including manufacture and distribution of lamps, batteries and PV module support structures.
Table 4.4 Domestic PV sector – accelerated market development and domestic industry
Market size VA Value Companies Jobs
MW, 2020 US$/W MUS$, 2020 No. No.
Manufacture 10 0.5 5 1 50
Manufacture 10 0.5 5 10 1,500
Domestic 50MW
0.5 25 50,000
(cumulative) 3M SHS
Source: ERG estimates for market size in the short term and value added from Table 4.1.
The strategy for developing the PV manufacturing sector in Ethiopia should focus on module and BOS
assembly and on distribution because the knowhow and investment requirements for these operations are
low while the employment and value added gains are high. There are no module assembly plants in
Ethiopia but there is some experience for assembly of BOS components including batteries and charge
regulators. Knowledge and skills required for BOS assembly and for distribution exist in Ethiopia; where
there are shortcomings (quality, specific training) these can easily be addressed by private industry.
Local demand for modules in the short term (five years) will be under 10MW/y – one to three plants with
total capacity to produce 10MW of PV will be adequate to address domestic demand in the short term.7
Investment costs are lower for larger assembly plants – this means the general recommendation is to have
few relatively large PV module assemblers than many smaller ones. PV module assembly is feasible
through private or government companies (or associations between government and local or external
private companies). Considering there is no local experience in module assembly partnership is
recommended.
There would be several BOS component manufacturers. In Bangladesh, for example, all the main
distributors of PV home systems also assemble charge regulators - there are ten or more BOS assemblers
for a market of 5MW/y. Assembly of charge regulators and inverters will require only small electronic
workshops which many local companies can easily set up and some have done so already.
Distribution and service will create the largest portion of the employment in the PV sector. The distribution
network will span the whole country through a chain of private (or cooperative) enterprises extending from
manufacturers and importers at the center to retailers and service providers at the Wereda and Kebele
levels.
7
A UNINDO study in 2010 also proposed 5MW/y module assembly capacity (UNIDO, 2010).
145. Strategies for a PV industry in Ethiopia
Ethiopia has a large off-grid rural power market, equivalent to the combined off-grid market of countries in
East Africa. Ethiopia is singular in the opportunities to address its own as well as regional markets through
renewable energy due to good renewable resources, rapidly growing incomes, its green economy strategy,
and its growing educated and trained workforce. Solar electricity has the potential to address major
development goals in rural areas in the health, education, and information sectors. The size of demand and
growing manufacturing capability opens potential to create a domestic solar energy industry.
a) A large dispersed rural population: Eighty percent of the population or 65 million Ethiopians live in
rural areas. Addressing demand for energy services for this population is a challenge; but it is also an
opportunity to meet it through distributed renewable energy services including solar electricity.
b) The fastest growing, non oil-exporting, economy in Africa: Ethiopia grew at more than 8% annually
for the past six years, twice as fast as the African average. This increases domestic financial and
technical capability and opens opportunities to mobilize consumer, private and public resources.
c) One of the few green economy strategies in the world: Ethiopia has one of the few green economy
strategies in the world and only the second in Africa. This creates opportunities to attract resources,
domestic and external, for green programs in Ethiopia.
d) Rapidly growing educated and trained workforce. The pool of engineers and technicians has rapidly
increased in Ethiopia over the past decade. This opens the opportunity to engage this workforce in the
fast growing solar energy sector in research and development, manufacture and distribution.
However, Ethiopia needs clearly articulated vision and strategy for renewables, addressing the entire value
chain – from R&D to manufacture to services (not just state renewable energy production goals). It needs
effective governance to realize the vision. There is also need to integrate this vision and strategy with the
industry strategy.
There is obvious desire to make Ethiopia the regional renewable energy leader (stated in the sector
Strategic Plan). But this desire is not backed by adequate industry (for renewables) level strategies and
actions, sector institutions are also not effective. There is need for long-term outlook, specific strategies for
renewables, implementation of plans without loosing focus of goals, learning from experience,
incorporating flexibility where needed.
a. The institutional framework for success
The framework for sector development (to create a viable domestic industry) consists of government
setting conducive environment for investment and market development, government and other
development agencies providing sector development support, and the private sector providing products and
services. A generalized context for the institutional frame is shown in the following figure.
Figure 5.1 Institutional frame • Policies
for sustainable industry and Macro level - enablers • Regulations
market development
• Market development
Meso level - support • Capacity development
• Products
Industry level - supplies • Services
a) Government provides conducive policies, strategies and regulations. These include national
development strategies such as the Climate Resilient Green Economy (CRGE) strategy; sectoral and
cross-sectoral policies, and regulations that promote investment and market development such as tax
exemptions for manufacturers and users.
15b) Government and NGOs provide sector development support. Such support includes market
development including information and financing for users, implementation capacity building for
government and other development agencies, and technical and financial support to industry.
c) The private sector invests in manufacturing and distribution to provide products and services. Large
and small companies invest in manufacture, assembly, installation and service to address the market.
A sustainable supply chain for products and services is created.
A selection of case examples is provided below to illustrate how the institutional frame just described has
been successfully applied to create vibrant renewable energy industries. As the case examples illustrate this
general framework is implemented across countries differently with some functions being more important
than others in developed and developing countries.8
b. Case examples of success
Germany has the largest installed renewable energy capacity and the largest renewable energy market in
the world. It also has a large renewable energy industry employing more than 350,000 people. German
companies are now industry leaders in many fields. The renewable energy sector in Germany took off after
the Feed in Tariff of 1991 and the Renewable Energy Resources Act in 2000. The FiT and the Act were
issued to promote energy security, climate sustainability, domestic industry, jobs and innovation.
Institutions and policies – The Renewable Energy Sources Act, 2000.
Regulations – subsidy policy based on feed-in tariff that was established in 1991. Renewable resource
specific Feed in Tariff (FiT) has been the main instrument of promotion of renewables.9Ten years after
the Act was issued more than 24GW of PV capacity was fed into the grid (EPIA, 2011) – this is 250
times the amount installed prior to the Act.
Industry – the renewable energy industry grew very rapidly providing R&D and innovation,
manufacturing and distribution. Prior to the Act Germany was prominent in some renewable energy
manufacturing (mainly wind); after the act Germany became the global leader in manufacturing and
installation in wind, solar and biomass energy systems.
The Chinese renewable energy industry is the fastest growing in the world. Chinese industry is particularly
strong in the solar sector. Chinese low cost manufacturing has been one of the drivers for the rapid decline
in PV system prices. China has been leading the solar thermal market for some time; China became the
largest PV cell producer in 2008. The Chinese PV industry is export oriented: in 2009, for example, China
exported several times more than it installed domestically (REN21, 2009).
Institutions and policies – National Renewable Energy Law, 2005; Medium and Long-Term
Development Plan for Renewable Energy, 2007.10
Regulations and programs – The Renewable Energy Law identified four schemes to expand the
market and industry for renewables (REN21, 2009):
Cost-sharing: in which additional cost for renewables is paid by the user through a surcharge
Feed in Tariff: fixed additional amount is paid for renewable capacity on the grid
Mandatory grid connection: grid operators are obliged to purchase renewable electricity
National target: sets target of 10% renewables by 2010 and 15% renewables by 2020.
8
Sector development support is not required in developed countries because private industry can deliver services where
policies and regulations are conducive. In contrast in developing countries sector development is often the most
important area because of inadequate capabilities (market information, technical and financial capability) in
government, industry, and the public.
9
Feed in Tariffs obligate power providers on the grid to accept renewable energy generated at pre determined prices.
They provide incentives to developers and manufacturers to invest in renewable energy; they also promote
competitiveness because tariffs are periodically reviewed downwards.
10
Also note that policies in Europe (particularly in Germany and Spain) have had significant impact on increasing
manufacturing capacity for PV in China.
16For rural areas China made significant government investment (US$ 293 million) to expand the market
for renewables through its Township Electrification Program (2002-2004). This program increased the
market for PV in rural China.
Another program, called the Golden Sun Demonstration Project, issued in 2009 aims to expand the
market and manufacturing capability for PV through subsidies. The project subsidizes 50% of
investment for solar power projects connected to grid and 70% of the investment for PV projects in off-
grid areas. Other forms of regulation for renewables include standards and mandatory regulations such
as for solar water heating in buildings.
Sector development support – China supports its domestic renewable energy industry through tax
breaks, R&D and investment subsidies. These financial supports have been responsible for the
localization of renewable energy technologies in China. The Chinese government also uses mandatory
regulations that require minimum local value for renewable systems installed in China (for example,
70% of the product cost for wind power) which forces external developers to manufacture components
in China (set up factories in China or go into Joint Ventures with Chinese companies).
Industry – The Chinese renewable industry has grown very rapidly to address domestic demand as
well as the export market. Local financial incentives as well as policies in export markets have been
responsible for rapid localization of renewable energy manufacturing in China.
Policy dialogue among stakeholders and effective implementation of policies was one of the challenges
for the Chinese renewable energy sector. Establishment of an official renewable energy industry
association was recommended to act on these challenges..
India is an important market for renewables and also a growing center of renewable energy system
manufacture. An Indian company (Suzlon) is the fifth largest wind turbine supplier in the world. Some
Indian companies are also prominent in the PV sector. India launched the National Solar Mission 2010
with the objective of making India a global leader in solar energy by creating policy conditions for the
rapid diffusion of the technology in India as well as increase PV manufacture capability.
Institutions and policies – India has the world’s only ministry dedicated to promoting renewable
energy, the Ministry of New and Renewable Energy (MNRE established in 1992). Several institutes
and agencies are administered under the MNRE including the Solar Energy Center, the Center for Wind
Energy Technology, and the Indian Renewable Energy Development Agency (IREDA).
Policies are expressed in India through national plans (e.g., development plans and climate change
actions). The Eleventh national plan 2007-2012, for instance, provides for 10% contribution by
renewables by 2012. The National Action Plan for Climate Change (NAPCC, 2008) issued targets for
renewable energy and announced eight missions including one for solar energy.
Regulations – India has issued several Plans, Acts and Missions to facilitate the uptake of renewable
energy. These include (NREL, 2010):
Electricity Act 2003, National Electricity Policy 2005, National Tariff Policy 2005 – allow for
minimum energy purchases, preferential tariffs for renewable energy tariffs, renewable purchase
obligations (RPO)
Rajiv Gandhi Grameen Vidyutikaran Yojana (RGGVY) 2005 – provides subsidies amounting to
90% of capital equipment for systems installed in rural areas
Jawaharlal Nehru National Solar Mission (JNNSM) 2010 – aims to increase domestic installation of
PV systems through attractive tariffs.11The JNNSM projects addition of 1100MW of PV for grid
and off-grid systems by 2013 and 10GW of grid tied and 2GW of off grid PV by 2022. The plan
also envisions increasing PV module production to 5GW by 2022.
Sector development support – Support for the renewables sector in India consistent long term support
in R&D for example, for biomass energy at the Indian Institute of Technology (where for example the
gasification technology has been in development for more than twenty years. R&D work for some of
11
Feed in tariffs for PV have been in place in India since 2002; however, these have been unsuccessful in increasing
installation because tariffs were too low, i.e., US$0.3 /kWh.
17the biomass technologies now commercialized by IIE and others in India were initiated in Ethiopia at
about the same time as in India these were not consistently applied and as long as was required)
Industry – The Indian PV industry is an export industry. Indian PV manufacturing capacity exceeded
1000MW/y whereas the cumulative installed PV capacity was only 15.2MW in 2010 (NREL, 2010).
The Indian government provides 20%-25% subsidies on investment to PV manufacturers through its
Special Incentive Package Scheme (SIPS) since 2007.
Bangladesh is a low income country of 145 million people, 80% of whom live in rural areas. Bangladesh
is a good example of developing a PV sector in off-grid areas in a low income country. The Bangladesh
PV program started in 2003 installed 650,000 solar home systems serving more than 2 million people, and
employed more than 12,000 people by 2009. The program aims to increase installation to 2.2 million solar
home systems by 2012 (Sovacool and Drupady, 2009).
The Bangladesh PV market was the fourth largest in the world in 2008 (after Germany, Japan and Spain).
But it turns out now to be the most sustainable because of the much less subsidy driven nature of the
program than in Germany and Spain (where the PV market is stalling and manufacturers and developers
are going out of business).
Institutions and policies – Infrastructure development support including for renewable energy is
provided in Bangladesh by the Infrastructure Development Company (IDCOL). IDCOL is a
government owned investment company established in 1997 and manages renewable energy programs
in the solar, biogas and biomass areas.
Sector development support – The success of the Bangladesh PV program is attributed to the strong
implementation capacity in IDCOL. IDCOL and its partners have deployed a viable technology
diffusion model which provides user and supplier financing, builds the technical capacity of users and
suppliers, and ensures quality or product and service.
Integration of supply of product and finance by a single company has put the burden of high quality
service to users to the company thus ensuring the sustainable operation of systems as well as loan
repayment. Another area where sector development has been useful was in setting up quality
management system for PV products and services thus again ensuring sustainability.
Industry – the private companies and NGOs providing PV products and services have gradually
increased their technical and financial capability to install and service systems through an extensive
presence in most rural villages in Bangladesh.
The market for PV system components was dominated by imports (China and India) in the early years.
However, local manufacturing and assembly is now taking an increasing share of the market
particularly for BOS components. Five years after initiation of the program three of the companies had
started assembly of charge regulators. At the end of 2011 there was one PV module assembly plant in
operation (5MW/a) and three others, each with capacity to produce 5MW/a, were under construction.
Lessons from the case examples
The case examples illustrate that supportive policies are instrumental for the uptake of renewable energy
systems; however, what is even more important is that effective regulations and sector development
support are in place to achieve the policy goals. Policies and regulations must be applicable and must be
enforced – regulations that are not applicable (for example, unattractive FiT rates for PV in India) or that
are not enforced are worthless.
Regulations and sector development support open up the market and guide industry towards
competitiveness. Regulations, in FiT, renewable purchase obligations and others, are the drivers for
increasing the uptake of renewables on the grid. Sector development support through technical capacity
building and financing for users and suppliers, and monitoring for quality of products and services is the
main instrument for uptake of renewables for off-grid applications. Regulations and sector development
support are reviewed periodically to adjust to changing circumstances.
18You can also read