Asian Development Bank Institute - ADBI Working Paper Series Estimating Demand for Infrastructure in Energy, Transport, Telecommunications, Water ...
←
→
Page content transcription
If your browser does not render page correctly, please read the page content below
ADBI Working Paper Series

Estimating Demand for
Infrastructure in Energy, Transport,
Telecommunications, Water and
Sanitation in Asia and the Pacific:
2010-2020

Biswa Nath
Bhattacharyay

No. 248
September 2010

 Asian Development Bank Institute
Biswa Nath Bhattacharyay is a Lead Professional and Adviser to the Dean of the Asian
 Development Bank Institute and Lead Professional at the Asian Development Bank. This
 is a revised version of a background paper prepared for ADB/ADBI's Flagship study on
 Infrastructure and Regional Cooperation and the book ”Infrastructure for a Seamless
 Asia”.
 The views expressed in this paper are the views of the authors and do not necessarily
 reflect the views or policies of ADBI, the Asian Development Bank (ADB), its Board of
 Directors, or the governments they represent. ADBI does not guarantee the accuracy of
 the data included in this paper and accepts no responsibility for any consequences of
 their use. Terminology used may not necessarily be consistent with ADB official terms.

The Working Paper series is a continuation of the formerly named Discussion Paper series;
the numbering of the papers continued without interruption or change. ADBI’s working
papers reflect initial ideas on a topic and are posted online for discussion. ADBI encourages
readers to post their comments on the main page for each working paper (given in the
citation below). Some working papers may develop into other forms of publication.

Suggested citation:

Bhattacharyay, B. 2010. Estimating Demand for Infrastructure in Energy, Transport,
Telecommunications, Water and Sanitation in Asia and the Pacific: 2010-2020. ADBI
Working Paper 248. Tokyo: Asian Development Bank Institute. Available:
http://www.adbi.org/working-paper/2010/09/09/4062.infrastructure.demand.asia.pacific/

Please contact the author(s) for information about this paper.

Asian Development Bank Institute
Kasumigaseki Building 8F
3-2-5 Kasumigaseki, Chiyoda-ku
Tokyo 100-6008, Japan

Tel:      +81-3-3593-5500
Fax:      +81-3-3593-5571
URL:      www.adbi.org
E-mail:   info@adbi.org

© 2010 Asian Development Bank Institute
ADBI Working Paper 248                                                                   Bhattacharyay

Abstract*

Infrastructure plays a key role in promoting and sustaining rapid economic growth. Properly
designed infrastructure can also make growth more inclusive by sharing its benefits with
poorer groups and communities, especially by connecting remote areas and small and
landlocked countries to major business centers. Even if the Asia-Pacific region has
witnessed progress in infrastructure development, the growth of infrastructure lags behind its
economic growth, and also behind international standards of infrastructure quantity and
quality. Inadequate infrastructure can hamper the potential economic growth of Asian
countries, weaken their international competitiveness, and adversely affect their poverty
reduction efforts. The circumstances and effects of the recent economic and financial crisis
provide a number of reasons to further develop national and regional infrastructure in Asia.
Among these reasons is that regional infrastructure enhances competitiveness and
productivity, which could help in economic recovery and in sustaining growth in the medium
to long-term. Regional infrastructure also helps increase standard of living and reduce
poverty by connecting isolated places and people with major economic centers and markets,
narrowing the development gap among Asian economies. This paper estimates the need for
infrastructure investment, including energy, transport, telecommunications, water, and
sanitation during 2010-2020, in order to meet growing demands for services and facilitate
further rapid growth in the region. By using “top-down” and “bottom-up” approaches, this
paper provides a comprehensive estimate of Asia’s need for infrastructure services. The
estimates show that developing countries in Asia require financing of US$776 billion per year
for national (US$747 billion) and regional (US$29 billion) infrastructure during 2010-2020 to
meet growing demand.

JEL Classification: L9, O1, O2, R11, R4

*
The author thanks staff of ADB’s regional departments, Dong-Woo Ha of UNESCAP, and Anindya
 Bhattacharyay of the Institute for Global Environmental Strategies for providing data, and ADB Institute
 Research Associates, Neal Detert and Marie Danielle Guillen, for research assistance.
ADBI Working Paper 248                                                                                               Bhattacharyay

Contents

1.        Introduction ................................................................................................................ 3

2.        Infrastructure Connectivity and Competitiveness ....................................................... 6

3.        Methodology for Estimation ....................................................................................... 9

          3.1        “Top-down” Approach: Infrastructure Needs at the National Level ................ 9
          3.2        “Bottom-up” Approach: Regional Financing Needs Estimation ..................... 10
          3.3        Scenario-Building: Demand for Regional Infrastructure ................................ 11

4.        National Financing Needs for Connectivity: 2010-2020 ............................................ 11

5.        Infrastructure Needs for Regional Projects for Asian Connectivity: 2010-2020......... 16

          5.1        Pan-Asian Transport Network ...................................................................... 17
          5.2        Infrastructure Projects at the Sub-regional Level .......................................... 18
          5.3        Investment Needs for High Priority Projects ................................................. 19

6.        Challenges For Regional Infrastructure Financing ................................................... 20

References ......................................................................................................................... 22

Appendix ............................................................................................................................. 25

          Appendix 1: Regional and Sub-regional Groupings and Infrastructure ..................... 25
          Cooperation Programs ............................................................................................. 25
          Appendix 2. Compendium of Investment Needs of Regional Infrastructure .............. 27
          Projects by Sub-region and by Program .................................................................. 27
ADBI Working Paper 248 Bhattacharyay
1. INTRODUCTION
Infrastructure plays a key role in promoting and sustaining rapid economic growth. Properly
designed infrastructure can also make growth more inclusive by sharing its benefits with
poorer groups and communities, especially by connecting remote areas and small and
landlocked countries to major business centers. Studies in several developing Asian
countries illustrate how infrastructure, particularly road transport and electricity, help in
reducing poverty (ADB, JBIC, and World Bank 2005). Even if the Asia-Pacific region has
witnessed progress in infrastructure development, the growth of infrastructure lags behind its
economic growth, and also behind international standards of infrastructure quantity and
quality. Inadequate infrastructure can hamper the potential economic growth of Asian
countries, weaken their international competitiveness, and adversely affect their poverty
reduction efforts. Moreover, it is noteworthy to stress that the Asia-Pacific region accounts
for about 60% of the world’s population and 30% of the world’s total land area, with nearly
two-thirds of the world’s poor found in developing Asia (ADB 2007).
Interestingly, 10 out of 12 economies globally with GDP growth rates of 7% or more over the
past 25 years are in Asia 1 (Commission on Growth and Development 2008). During this
period of rapid economic growth, Asia has increasingly integrated into the global economy. It
has become the world’s factory by pursuing outward-oriented development strategies,
establishing global production networks and supply chains, and building needed
infrastructure. Asian regional economies have succeeded and benefited from regionally
producing and trading intermediate goods, then exporting final goods to the West.
However, the recent global crisis has reduced Asia’s external demand, industrial production,
investment and employment, adversely affecting consumer spending. The prospect of a
prolonged downturn in major advanced markets as a result of crisis underscores the urgent
need for rebalancing Asia’s growth and increasing investments in highly productive sectors,
such as infrastructure, to facilitate greater domestic and regional demand. Infrastructure
investment in particular has also played a major role in fiscal stimulus packages used by
Asian economies to mitigate the negative effects of the global crisis. These infrastructure
investments have been utilized in key sectors, such as transportation; energy; information
technology and communications (ITC); and water and sanitation, in both rural and urban
projects (Table 1).
1
Including Bangladesh, People’s Republic of China (PRC), Thailand, Indonesia, Japan, Republic of Korea
(Korea), Malaysia, Singapore, Taipei,China, and Hong Kong, China.
3ADBI Working Paper 248 Bhattacharyay
Table 1: Infrastructure Investment in the Stimulus Packages of the Major Asian
Economies (US$ billion)
Infrastructu
Total re as % of
Fiscal Infrastructure Total
Country Stimulus Component Stimulus Types of Infrastructure
Railways, airports, electrical transmission
technology, expressways, telecommunications
PRC 600.0 275.0 45.80%
technologies, rural roads, electricity, gas, water,
and irrigation projects
India 60.0 33.5 55.80% Highway, port, and power sectors
Communications and transport infrastructure,
Indonesia 7.7 1.3 16.90% rural infrastructure, and development of ports
and shipping industry
Viet Nam 8.0 4.8 60.00% Infrastructure spending
Water resource development and road
construction in villages and rural areas along
Thailand 46.7 30.6 65.50%
with transport, logistics, energy, and telecom
improvements
Low and medium cost housing, upgrade, repair,
and maintain police stations and army camps,
Malaysia 2.0 0.2 8.50%
and public and basic infrastructure project
maintenance
Korea 11.0 3.2 29% Roads, universities, schools, hospitals
Yen 1.6 trillion for fostering environmentally
friendly technologies, including plans to provide
cheaper solar power to homes and up to $2,500
Japan 154.55 16 10%+
as tax breaks to consumers on purchases of
“green” cars; subsidies of 5% on energy
efficient televisions and other appliances
Sources: Author’s estimations from data in: Kang (2010); Sugimoto (2010); Kumar and Soumya (2010); Patunru and
Zetha (2010); Nguyen, Nguyen, and Nguyen (2010); Jitsuchon (2010); World Bank (2009b); FAITC (2009);
Alibaba.com (2008); IFCE (2009); Economy Watch (2010); (Tabuchi 2009) and ADB
(2009a). http://www.economywatch.com/economic-stimulus/world-economic-stimulus/south-
korea.htmlhttp://www.nytimes.com/2009/04/09/business/global/09yen.html
The circumstances and effects of the recent economic and financial crisis provide a number
of reasons to further develop national and regional infrastructure (see Box 1 for definition) in
Asia. Among these reasons is that regional infrastructure enhances competitiveness and
productivity, which could help in economic recovery and in sustaining growth in the medium
to long-term. Regional infrastructure also helps increase standard of living and reduce
poverty by connecting isolated places and people with major economic centers and markets,
narrowing the development gap among Asian economies. It also promotes environmental
sustainability, facilitates regional trade integration and the acceleration of regional
cooperation, and helps increase regional demand and intraregional trade necessary to
rebalance Asia’s economic growth.
4ADBI Working Paper 248 Bhattacharyay
Box 1: Defining Regional Infrastructure
“A regional (cross-border or transnational) infrastructure project is defined as a project with
activities such as physical construction works and coordinated actions related to policies and
procedures, spanning over two or more countries, or a national infrastructure project that has
significant cross-border impact. A national infrastructure project has significant cross-border
impact if it satisfies one or more of the following criteria: (i) The planning and implementation
of a project that involves cooperation and coordination between two or more countries; (ii) As
per the pre-determined plan, a project that produces significant sales of goods or services
across regional borders, where significant means at least twenty-percent or more of the total
sales; (iii) A project that involves the construction of specific infrastructure, such as a road, a
bridge, or a tunnel located on or largely on the territory of a country near the border and is
necessary to link the country to the network of a neighboring country or a third country”
(Bhattacharyay 2008).
Despite relatively good growth in infrastructure investment and development during the last
few decades, the region still faces extensive basic infrastructure needs. For instance, 1.5
billion people in Asia and the Pacific have no access to improved sanitation, 638 million have
no access to improved drinking water, and 930 million have no access to electricity services
(IMF 2006). Only 3 out of every 10 people have access to telephone services and only
53.4% of the total road network in Asia of 5.66 million km is paved (ADB 2007). Moreover,
the cost of maintaining existing infrastructure continues to rise. Fast growing economies like
PRC, India, Thailand, Indonesia, the Philippines, and Viet Nam are seeing their countries’
aging infrastructure and limited capacities being stretched and coming under extreme
pressure. Therefore, in spite of the large infrastructure investment under the aforementioned
stimulus packages, the financing needs for national and regional projects are huge.
It is very important to assess the magnitude of national infrastructure financing needs and
financing gaps of Asian economies by key sectors such as transport, energy,
telecommunications, water and sanitation as well as the regional infrastructure financing
needs for identified regional projects.
This paper attempts to estimate national infrastructure financing needs for 32 Asian
developing economies during 2010-2020 using a “top down” econometric approach based
on the projected growth of key economic parameters such as GDP and population. The
selected countries by sub region are as follows:
Central Asia – Afghanistan, Armenia, Azerbaijan, Georgia, Kazakhstan, Kyrgyzstan,
Pakistan, Tajikistan, and Uzbekistan;
Southeast Asia - Cambodia, Indonesia, Philippines, Malaysia, Myanmar, Viet Nam,
Lao PDR, and Thailand;
East Asia and the Pacific - PRC, Mongolia, Fiji, Kiribati, Marshall Islands, Papua New
Guinea (PNG), Samoa, Solomon Islands, Tonga, and Vanuatu; and
South Asia - Bangladesh, Bhutan, India, Nepal, and Sri Lanka.
The paper also estimates, for the first time, the financing needs for regional infrastructure
projects using a ‘bottom-up” approach based on identified pipeline regional infrastructure
projects across Asia. Section 2 discusses the concept of pan-Asia infrastructure connectivity
and its relationship with quality of infrastructure and global competitiveness. The next section
presents the methodologies used for estimating financing needs for national and regional
infrastructure projects. Section 4 presents the financing needs of national infrastructure of 32
Asian economies by sector. The financing needs for regional infrastructure by sector and
sub region are presented in Section 5. Section 6 concludes with an examination of the broad
challenges for infrastructure financing in Asia.
5ADBI Working Paper 248 Bhattacharyay
2. INFRASTRUCTURE CONNECTIVITY AND
COMPETITIVENESS
Developing infrastructure networks and connectivity are essential to integrating core and wider
economic activities and basic services in the region. The latest World Economic Forum (2010)
Global Competitiveness Report, and the Infrastructure Quality assessment included within,
illustrates the importance of infrastructure quality in global competitiveness (Table 2). Moreover,
various studies have also shown that the quality and extensiveness of infrastructure networks
greatly impact economic growth and reduce income inequalities and poverty (ADB/ADBI 2009).
Table 2: Ranking and Score of Global Competitiveness Index and Infrastructure
Quality Assessment of Selected Countries in Asia
2009/2010
Economy GCI Infrastructure
Rank Score Rank Score
Developed and Newly Industrialized Asia (Average) 5.25 5.85
Australia 15 5.15 25 5.19
Hong Kong, China 11 5.22 2 6.54
Japan 8 5.37 13 5.83
Korea 19 5.00 17 5.60
Singapore 3 5.55 4 6.35
Taipei,China 12 5.20 16 5.60
Developing and Emerging Asia (Average) 4.10 3.44
Bangladesh 106 3.55 126 2.39
India 49 4.30 76 3.41
Indonesia 54 4.26 84 3.20
Malaysia 24 4.87 26 5.05
Nepal 125 3.34 131 2.03
Pakistan 101 3.58 89 3.06
Philippines 87 3.90 98 2.91
PRC 29 4.74 46 4.31
Sri Lanka 79 4.01 64 3.88
Thailand 36 4.56 40 4.57
Viet Nam 75 4.03 94 3.00
Note: Ranking out of 133 total countries surveyed
Score: 1-poorly developed, inefficient; 7-among the best in the world
Source: World Economic Forum (2010)
To date, connectivity has improved across most parts of the Asia-Pacific region, but much
still needs to be done. In particular, as shown in Table 3, enhancing transportation and
energy infrastructure in developing countries remains a challenge. Asian economies exhibit
a wide variation in road and rail densities as well as in rates of electrification. Even though
marked improvements in road and electrification have been seen over the last two decades,
there is still a long way to go before basic infrastructure needs are fulfilled.
6ADBI Working Paper 248 Bhattacharyay
Table 3: Regional Transport Infrastructure
Road Density Rail Network Density Household Electrification Rates
(km/1000 sq km land) (km/1000 sq km land) (% of Households)
1990 Latest Year 1990 Latest Year Earliest Year Latest Year
Central Asia
Afghanistan 32 65 (2006) … … (2007) … … 25 (1995)
Armenia 273 266 (2006) 30 25 (2005) 99 (2000) 100 (2005)
Azerbaijan 630 715 (2004) … 26 (2006) 97 (1999) 100 (2006)
Georgia 311 293 (2006) 23 22 (2007) … … 100 (2002)
Kazakhstan 59 34 (2006) 5 5 (2007) … … … …
Kyrgyz Rep. 99 97 (2001) … … … 100 (1997) 100 (2002)
Pakistan 220 338 (2006) 11 10 (2007) 60 (1990) 89 (2006)
Tajikistan 213 198 (2001) … … … 97 (1999) 99 (2003)
Uzbekistan 170 192 (2001) … 9 (2007) 100 (1996) 100 (2002)
East and Southeast Asia
Cambodia 203 217 (2004) 3 4 (2005) 17 (2000) 21 (2005)
PRC 127 371 (2006) 6 7 (2007) … … … …
Indonesia 159 216 (2005) … 3 (1998) 49 (1991) 91 (2007)
Lao PDR 61 129 (2006) … … … … … 46 (2002)
Malaysia 262 283 (2005) 5 5 (2007) … … … …
Mongolia 27 31 (2002) 1 1 (2007) 67 (2000) 86 (2005)
Myanmar 38 41 (2005) 5 … … … 47 (2002)
Philippines 539 671 (2003) 2 2 (2006) 65 (1993) 77 (2003)
Thailand 141 352 (2006) 8 8 (2006) … 99 (2005)
Viet Nam 295 717 (2004) 9 10 (2007) 78 (1997) 96 (2005)
South Asia
Bangladesh 1444 1838 (2003) 21 22 (2007) 18 (2000) 47 (2007)
Bhutan 50 171 (2003) … … … … … 41 (2003)
India 673 1116 (2006) 21 21 (2007) 51 (1991) 68 (2005)
Nepal 48 121 (2004) … … … 18 (1996) 61 (2006)
Sri Lanka 1439 1505 (2003) 23 19 (2005) … … 81 (2002)
The Pacific
Fiji 167 188 (2001) … … … … … 67 (1996)
Kiribati … 827 (2000) … … … … … 39 (2005)
PNG 41 43 (2001) … … … … … 11 (1996)
Samoa … 826 (2001) … … … 79 (1991) 92 (2006)
Solomon Is. 43 50 (2001) … … … … … 16 (1999)
Timor-Leste … ... … … … … … … 27 (2002)
Tonga … 944 (2001) … … … 80 (1994) 89 (2006)
Vanuatu … 88 (2001) … … … 18 (1994) 19 (1999)
Source: ADB (2009b)
The concept of connectivity through the development of regional infrastructure projects or
infrastructure that links one country to another is not really new to Asia. History shows that
transport connectivity in Asia started with the Silk Road in the 13th Century. The Silk Road used
to be the most important cross-border artery and the was an extensive, interconnected network
of pan-Asian trade routes linking East, South, Central, and Western Asia. In 1992, the concept of
pan-Asia transport connectivity was revived by the United Nations Economic and Social
Commission for Asia and the Pacific (UNESCAP). The Asian Land Transport Infrastructure
Development (ALTID) initiative is comprised of three pillars, the Asian Highway (AH), the Trans-
Asian Railway (TAR), and the facilitation of land transport projects through intermodal transport
terminals (UNESCAP 2010a).
7ADBI Working Paper 248 Bhattacharyay
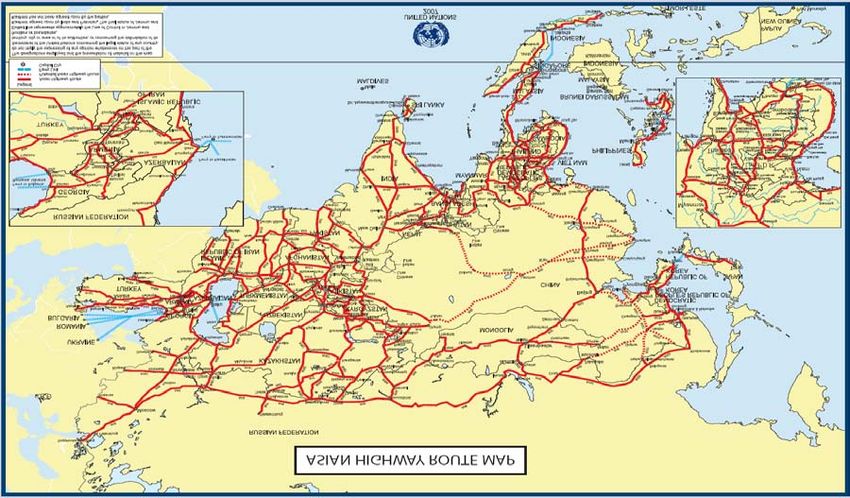
AH (Figure 1) seeks to improve economic links among Asia, Europe, and the Middle East. It is
planned as a network of 141,271 km of standardized highways—including 155 cross-border
roads—that crisscrosses 32 Asian countries.
Figure 1: Asian Highway Network
Source: UNESCAP (2010b)
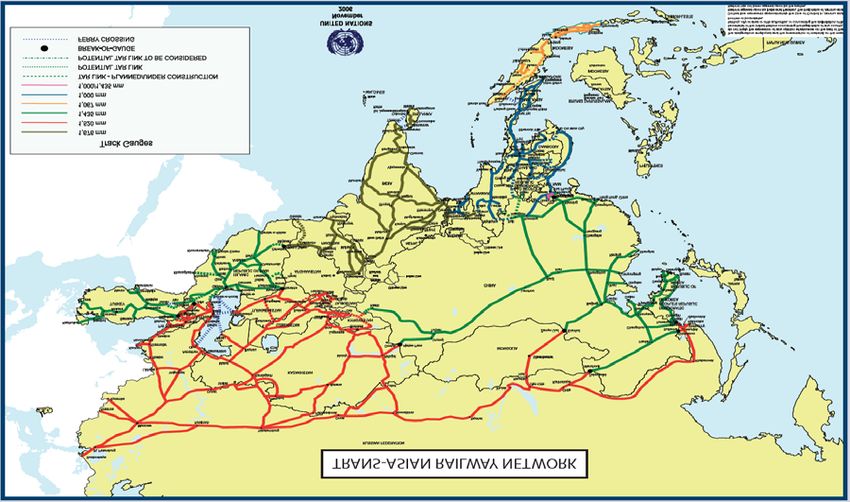
The TAR network (Figure 2) would link pan-Asian and pan-European rail networks at various
locations, connecting major ports of Asia and Europe and providing landlocked countries
with better access to seaports either directly or in conjunction with highways.
Figure 2: Trans-Asian Railway Network
Source: UNESCAP (2010c)
8ADBI Working Paper 248 Bhattacharyay
Regional infrastructure projects are usually more complicated and expensive than typical
national infrastructure projects. In this context, it is also a complex, yet necessary, exercise
to estimate the financing demand for regional projects and national projects with regional
implications. It is hoped in this paper that by providing estimates of the needed regional
infrastructure financing, it will help to clearly define the issues and challenges at hand and
facilitate the planning and development of solutions for identifying appropriate investment
strategies and financial resources, as well prioritizing projects for utilization of limited
resources.
3. METHODOLOGY FOR ESTIMATION
This section presents methodologies for both “top-down” and “bottom-up” approaches to
estimating or determining national and regional infrastructure investment needs respectively
for the Asia-Pacific region. While the “top-down” approach utilizes econometric analysis
techniques to quantitatively estimate national infrastructure needs and, by extension,
regional needs, the “bottom-up” approach reviews infrastructure investment demand at the
project level specifically for regional or cross-boarder projects.
3.1 “Top-down” Approach: Infrastructure Needs at the National
Level 2
A “top-down” econometric approach has been used to estimate national infrastructure
financing needs. A two-step procedure was utilized to develop the forecast. The first step
involved creating an econometric model that could be used across countries to project
physical capacity needs per sector for each year during the period 2010-2020. Reliability of
the model was tested by inputting available historic data through 2007. In the second step,
after the projections of the physical capacities were derived, standard unit costs (in 2008
US$) based on international “best practice” norms were applied to estimate the investment
requirements for new capacity. Finally, the report projected the investments required to
maintain or replace the existing capacity at the end of its useful life. The national
infrastructure estimates were based on the best available GDP growth scenarios. The
cumulative financing demand for national infrastructure projects were used as an estimate
for the region. The projections covered transport (airports, ports, railways, and roads),
telecommunications (landlines and mobile phones), energy (power), and water and
sanitation for the 32 developing countries in Asia included in this examination.
The econometric model developed by Fay (2001) was utilized to project the estimated
change in demand for infrastructure services in the period 2010 to 2020. The model
estimates future demand for infrastructure, where infrastructure services are both demanded
as consumption goods by individuals and as inputs into the production process by
companies. The model applied in this estimation also drew upon the works of Chatterton and
Puerto (2005) and Yepes (2004) to ensure forecasting accuracy. The baseline econometric
model is as follows:
I itj = α 1 I itj−1 + α 2Yit + α 3 Ait + α 4 M it + α 5U it + α 6 Pit + +α 7 t + D j + ε it
where,
I itj is the natural logarithm of demand for infrastructure stock of type j in country i at time t ,
Y is the natural logarithm of income per capita,
A is the natural logarithm of the share of agriculture value added in GDP,
M is the natural logarithm of the share of manufacturing value added in GDP,
U is the natural logarithm of urbanization,
2
Based on ADBI commissioned report by Centennial Group Holdings (2009).
9ADBI Working Paper 248 Bhattacharyay
P is the natural logarithm of population density, and
D j is a country fixed effect, and
ε it is the error term.
The given equation can be interpreted as a law of motion for infrastructure stock. The data
was organized as an unbalanced panel with yearly observations for the period 1960 to 2005
from a number of databases, including from the World Bank, the Energy Information
Administration, the Millennium Development Goals Indicators, and the United Nations
Statistics Division.
Projections for the independent variables were used to estimate the values of the
infrastructure variables in the period 2009-2020. These variables included land area,
population, urbanization, share of agriculture value-added in GDP, share of manufacturing
value-added in GDP, and GDP annual growth. Land area is assumed to be constant and
equal to 2005 figures in each country. The sources of projections for population and GDP
growth include the World Bank, ADB, and the International Monetary Fund (IMF). The
growth rates projected by IMF’s World Economic Outlook (WEO) for 2008-2013 were used
as the base case (IMF 2006). A cap of 900 mobile phones and 400 fixed lines per 1000
people was imposed for the telecommunication services. For the replacement costs, power,
roads, rail, airports, ports were assumed to be 2% of the stock value, while water and
telecoms replacement costs were assumed to 3% and 8% of the stock value, respectively.
Fixed linear regressions employing time and its square (as necessary) as explanatory
variables were used, using historic trends to predict each variable.
3.2 “Bottom-up” Approach: Regional Financing Needs Estimation
The estimation of future regional infrastructure demand is likewise very complicated and no
well-accepted econometric method is available. The actual realization of a regional project
depends on many economic and non-economic factors. Therefore, a “bottom-up”
methodology was used in this stage. The “bottom-up” methodology is a conservative
approach that identifies individual infrastructure projects and estimate costs of their
implementation. The compiled project information is then used to obtain the total
infrastructure service demand by region, by sub-regional program, and by sector.
This section gives an overview of the financing need per type of project by region. It tries to
avoid usual assumptions to project demand and instead identifies economically viable
projects, estimates the costs of their implementation, and combines all relevant infrastructure
projects (e.g., energy; transport; telecommunications; ICT; and logistics and trade
facilitation) that have already been entered into the planning stages throughout Asia. The
study utilized varied sources, including multilateral and bilateral development institutions. In
a few exceptional cases, the cost investment figures came from non-traditional sources like
media reports.
The investment estimations account for regional differences as well as priority investments in
planned infrastructure projects, and breaks down demand into the following groups and
programs 3:
(i) Pan-Asian, such as the ALTID project;
(ii) Sub-regional, including the Greater Mekong Sub-region (GMS), the Central Asia
Regional Economic Council (CAREC), the South Asia Sub-regional Economic
Council (SASEC), and the Pacific Countries; and
(iii) Other sub-regional and cross-sub regional programs, such as within and between
South Asia, Central Asia, Central-South Asia, East Asia-Southeast Asia, and the
Association for Southeast Asian Nations (ASEAN).
3
The lists of countries included in all of the groupings and programs can be found in Appendix 1 of this paper.
10ADBI Working Paper 248 Bhattacharyay
The limitations of this approach include not taking into account the regional infrastructure
projects that are national projects with significant cross-border impact such as airports,
seaports, roads connecting to borders, airports and seaports, and power generation projects
supplying power to neighboring countries. In addition, data on projects identified or planned
may not be available or may be confidential. Furthermore, large economies (such as PRC
and India) may have some sizable regional transport and energy projects with their
neighbors under their national plans that are not covered under pan-Asia and sub-regional
plans and programs. Finally, issues may arise as a result of inaccurate cost estimates and
failure to actually initiate or implement of some of the projects due to unforeseen reasons
and non-economic factors in the future.
As the estimation of national infrastructure financing needs is based on ‘top-down”
econometric method, it is not possible to identify specific national projects that are regional in
nature. However, the econometric estimation of national airports and seaports can be used
as regional infrastructure financing needs.
3.3 Scenario-Building: Demand for Regional Infrastructure
The mixture of “top-bottom” and “bottom-up” approaches simply means that the source of
information came from both the estimation of national infrastructure needs based on
macroeconomic and growth factors and the utilization of data provided by organizations and
countries involved in the implementation of the regional projects. Given the goal of
estimating regional demand, only infrastructure projects involving coordination between two
or more countries were included in the “bottom-up” approach. The calculation provides an
estimation on the cost per project and per sector, and then of the cumulative cost at the
national, sub-regional, and regional levels. The annual average costs per year are derived
from the estimated total cost for the period.
To provide the most realistic picture of Asia’s investment requirements in the “top-down”
approach, three sets of estimates were created. Scenarios including a “low-case”, a “base-
case”, and a “high-case” were derived from econometric models in which adjustments were
made to accommodate possible slower and faster than projected GDP growth and/or
managerial constraints. It is important to note though that these projections are estimates of
investments required to meet the needs of the countries. Estimates are based on a
replacement cost factor of 2% of existing infrastructure stock in most sectors and as such
could be very conservative. Actual unit costs would typically vary by country according to
domestic conditions and both new investment and replacement costs may turn out to be
higher than international best practice norms used to arrive at the estimations. Moreover, the
“top-down”, order-of-magnitude estimates must be regarded as a reference point rather than
a substitute for more precise, “bottom-up”, country and sector specific estimates. For the
remainder of this paper, all data references and tables pertaining to the “top-down”
estimations show the most conservative, “low-case” scenario results.
4. NATIONAL FINANCING NEEDS FOR CONNECTIVITY:
2010-2020
During the ten-year period of 2010-2020, the 32 ADB developing member countries covered
in this paper are expected to need almost US$8.22 trillion (in 2008 US$) for infrastructure
investment. This amounts to US$747 billion in annual investment needed over 2010-2020.
Around 68% of this is needed for new capacity investments in infrastructure and around 32%
is needed for maintenance or replacement of existing assets. In general, the total projected
infrastructure investment requirements are equal to about 6.5% of Asian estimated 2010-
2020 GDP. Of the total investment, approximately 49% is estimated to be needed for energy
infrastructure, 35% for transport, 13% for ITC, and 3% for water and sanitation. Among the
11ADBI Working Paper 248 Bhattacharyay
countries included in the study, PRC, India, and Indonesia represent the top three countries
in terms of amount of infrastructure investment needed. Overall, the top 11 countries
constitute 97% of Asia’s total infrastructure investment needs, most of which are in
Southeast Asia and South Asia (Table 4).
Table 4: National Infrastructure Investment Needs in Asia: 2010-2020
Investments as
% of Total Estimated Total 2008 GDP
Country / Sub Percentage of Total
Asian Investment Total Investment Per Capita
region
Investment Needs New Investment per Capita (Constant
Need (US$ millions) Capacity Maintenance per Year (US$) 2000 US$)
Central Asia 4.544% 373,657 54% 46% 33,969 1,403 753
Afghanistan 0.318% 26,142 57% 43% 2,377 901 -
Armenia 0.051% 4,179 41% 59% 380 1,358 1,520
Azerbaijan 0.344% 28,317 64% 36% 2,574 3,262 2,131
Georgia 0.060% 4,901 24% 76% 446 1,138 1,268
Kazakhstan 0.846% 69,538 61% 39% 6,322 4,436 2,378
Kyrgyz Rep. 0.107% 8,789 38% 62% 799 1,665 376
Pakistan 2.172% 178,558 53% 47% 16,233 1,075 650
Tajikistan 0.139% 11,468 47% 53% 1,043 1,678 245
Uzbekistan 0.508% 41,764 48% 52% 3,797 1,529 840
East and
66.553% 5,472,327 71% 29% 497,484 2,886 1,765
Southeast Asia
Cambodia 0.163% 13,364 51% 49% 1,215 918 511
PRC 53.118% 4,367,642 72% 28% 397,058 3,297 1,965
Indonesia 5.476% 450,304 70% 30% 40,937 1,981 1,087
Lao PDR 0.138% 11,375 56% 44% 1,034 1,833 475
Malaysia 2.287% 188,084 79% 21% 17,099 6,962 5,151
Mongolia 0.122% 10,069 37% 63% 915 3,812 735
Myanmar 0.264% 21,698 56% 44% 1,973 438 -
Philippines 1.546% 127,122 53% 47% 11,557 1,407 1,225
Thailand 2.103% 172,907 72% 28% 15,719 2,566 2,640
Viet Nam 1.335% 109,761 53% 47% 9,978 1,273 647
South Asia 28.829% 2,370,497 63% 37% 215,500 1,756 685
Bangladesh 1.762% 144,903 54% 46% 13,173 906 462
Bhutan 0.011% 886 30% 70% 81 1,291 1,247
India 26.421% 2,172,469 64% 36% 197,497 1,906 718
Nepal 0.174% 14,330 50% 50% 1,303 497 254
Sri Lanka 0.461% 37,908 52% 48% 3,446 1,881 1,199
The Pacific 0.073% 6,023 30% 70% 548 625 840
Fiji 0.008% 667 15% 85% 61 790 2,181
Kiribati 0.001% 82 10% 90% 7 846 826
PNG 0.051% 4,214 34% 66% 383 641 676
Samoa 0.003% 242 13% 87% 22 1,351 1,739
Solomon Is. 0.004% 336 33% 67% 31 657 1,136
Timor-Leste 0.001% 71 35% 65% 6 65 329
Tonga 0.001% 106 13% 87% 10 1,022 1,666
Vanuatu 0.004% 306 40% 60% 28 1,309 1,339
Total Asia 100% 8,222,503 68% 32% 747,500 2,335 1,272
Note: Estimates obtained using the low case scenario.
Source: Author, ADB/ADBI (2009), Centennial (2009)
12ADBI Working Paper 248 Bhattacharyay
The estimation results in this study are comparable with similar, country-level projections
undertaken in other available studies focusing on a similar time frame, including Goldman
Sachs Global Economics Papers by Lawson and Dragusanu (2008) and Poddar (2009) for
the BRICS 4 countries. A similar model was applied in these studies and the comparative
results support the estimations in this paper for PRC and India, as well as the other Asian
economies covered in this study. For example, the revised Poddar (2009) estimates for
India’s total infrastructure investment requirements for 2010-2020—after adjusting for
differences in sector coverage and scope (new capacity or maintenance)—is 18% higher
than the estimates provided in this study, and older estimates by Lawson and Dragusanu
(2008) for PRC over a slightly different time frame (2008-2018) are only 20% lower. The
estimates between this study and the Goldman Sachs studies are also comparable by
sector.
The estimates of total national infrastructure needs for 2010-2020 in this paper increased
slightly, by US$230.8 billion, compared to those presented previously in ADB/ADBI (2009).
Total infrastructure investment needs here include estimates for Myanmar, Afghanistan, and
the Solomon Islands, which were excluded in ADB/ADBI (2009). Additionally, some country
estimates were revised upward to take account of updated data and economic projections.
Table 5 shows the breakdown of investment needs by sector among the four sub-regional
groupings and Figure 3 presents national investment needs by sector for the top 11
economies. Generally, energy and transportation make up the largest components of total
Asia infrastructure investment needs. By sub-region, the biggest investment needs are in
East and Southeast Asia at US$5.47 trillion, or 67% of the total, and South Asia at US$2.37
trillion, or 29% of the total. Not surprisingly, the biggest economies in Asia—PRC and
India—are located in these sub-regions.
Table 5: National Infrastructure Investment Needs in Asia, 2010-2020: Per Sub-region
and Per Sector (2008 US$ billions)
East and
Sector / Subsector Southeast Central The
Asia South Asia Asia Pacific Total
Electricity 3,182.46 653.67 167.16 - 4,003.29
Transportation 1,593.87 1,196.12 104.48 4.41 2,898.87
Airports 57.73 5.07 1.41 0.10 64.31
Ports 215.20 36.08 5.38 - 256.65
Rails 16.14 12.78 6.03 0.00 34.95
Roads 1,304.80 1,142.20 91.65 4.31 2,542.97
Telecommunications 524.75 435.62 78.62 1.11 1,040.10
Telephones 142.91 6.46 4.45 0.05 153.87
Mobiles 339.05 415.87 71.97 0.95 827.84
Broadband 42.78 13.29 2.21 0.11 58.39
Water and Sanitation 171.25 85.09 23.40 0.51 280.24
Water 58.37 46.12 8.60 0.14 113.22
Sanitation 112.88 38.97 14.80 0.36 167.02
Total 5,472.33 2,370.50 373.66 6.02 8,222.50
Source: Author, ADB/ADBI (2009), Centennial (2009)
4
BRICS = Brazil, Russia, India, China, South Africa
13ADBI Working Paper 248 Bhattacharyay
Figure 3: National Infrastructure Investment Needs in Asia, 2010-2020: Top 11
Countries by Sector (2008 US$ Billion – PRC and India in 10 Billion)
450
400
350
300
Water
250 ITC
Transport
200
Electricity
150
100
50
0
C
am
a
a
n
nd
n
a
h
s
n
ne
di
a
si
si
es
ta
a
PR
st
ila
st
ne
ay
In
N
hs
d
pi
i
ki
a
ek
la
al
et
do
ilip
k
Pa
Th
ng
za
M
zb
Vi
In
Ph
Ka
Ba
U
Source: Author, ADB/ADBI (2009), Centennial (2009)
According to the estimates of this study, Central Asia is expected to need a total of US$374
billion in infrastructure investment over the next 10 years. Energy (electricity) infrastructure
comprises 45% of the amount, followed by the transport sector which needs 28% primarily
for investment in roads. Considering the geographic nature of Central Asia and the political
economy context of Central Asian nations, these results are understandable. In the South
Asian sub-region, the transport sector is facing the largest estimated investment requirement
of US$1.2 trillion. Considering that many of the countries are landlocked, similar to Central
Asian countries, the majority of this amount is also for road infrastructure. East Asia and
Southeast Asia are grouped here and include countries in ASEAN as well as GMS. In this
sub-region, nearly 60% of the investment needs are in the power sector. This is followed by
the transport sector, the telecommunications sector, and then the water and sanitation
sector. The Pacific sub-region needs an estimated US$6 billion in infrastructure investment,
representing 3.6% of the sub-region’s cumulative projected 2010-2020 GDP. A large
percentage of this need is in transport infrastructure, specifically road and airport projects.
Looking at national infrastructure investment needs in relation to projected GDP further
shows how great the demand is. As can be seen in Table 6, needed investments in
transport, electricity, ITC, and water amount to more than 6.5% of Asia’s estimated 2010-
2020 GDP. Electricity in particular represents the largest share, at 3.2% of Asian GDP, and
South Asia (excluding Afghanistan and Pakistan, which are included in central Asia) will
need to invest approximately 11% of GDP in order to meet rising demands for infrastructure
services.
14ADBI Working Paper 248 Bhattacharyay
Table 6: Infrastructure Investment Needs as a % of Estimated GDP 2010-2020
Investment as % of Estimated GDP
Water and
Country Transport Electricity ITC Sanitation Total
Central Asia 1.86% 2.97% 1.40% 0.42% 6.64%
Afghanistan 6.21% 0.00% 4.82% 0.89% 11.92%
Armenia 1.20% 1.01% 0.98% 0.27% 3.46%
Azerbaijan 0.60% 3.82% 0.44% 0.11% 4.97%
Georgia 1.20% 1.06% 0.69% 0.19% 3.14%
Kazakhstan 0.58% 2.92% 0.20% 0.07% 3.77%
Kyrgyz Rep. 3.94% 6.24% 2.44% 0.67% 13.29%
Pakistan 2.65% 2.68% 2.22% 0.73% 8.27%
Tajikistan 3.30% 9.83% 2.57% 0.51% 16.21%
Uzbekistan 2.65% 4.65% 1.94% 0.58% 9.82%
East and Southeast Asia 1.61% 3.22% 0.53% 0.17% 5.54%
Cambodia 4.43% 0.95% 2.97% 0.36% 8.71%
PRC 1.39% 3.42% 0.44% 0.13% 5.39%
Indonesia 3.88% 0.98% 0.97% 0.35% 6.18%
Lao PDR 10.62% 0.00% 2.40% 0.60% 13.61%
Malaysia 1.94% 4.42% 0.27% 0.04% 6.68%
Mongolia 12.04% 0.00% 1.21% 0.21% 13.45%
Myanmar 2.70% 0.00% 1.46% 1.88% 6.04%
Philippines 2.30% 1.87% 1.22% 0.65% 6.04%
Thailand 0.58% 3.69% 0.45% 0.19% 4.91%
Viet Nam 2.07% 3.12% 2.38% 0.54% 8.12%
South Asia 5.55% 3.03% 2.02% 0.39% 11.00%
Bangladesh 4.92% 1.24% 4.22% 1.19% 11.56%
Bhutan 2.84% 0.00% 0.87% 0.36% 4.07%
India 5.67% 3.23% 1.87% 0.34% 11.12%
Nepal 1.65% 0.58% 5.14% 1.10% 8.48%
Sri Lanka 4.23% 1.00% 1.39% 0.22% 6.85%
The Pacific 2.60% 0.00% 0.65% 0.30% 3.55%
Fiji 1.01% 0.00% 0.53% 0.14% 1.68%
Kiribati 5.17% 0.00% 0.16% 0.32% 5.65%
PNG 3.30% 0.00% 0.73% 0.32% 4.35%
Samoa 3.33% 0.00% 1.12% 0.26% 4.70%
Solomon Is. 3.50% 0.00% 0.28% 0.35% 4.13%
Timor-Leste 0.00% 0.00% 0.07% 0.79% 0.86%
Tonga 2.29% 0.00% 1.13% 0.29% 3.71%
Vanuatu 2.92% 0.00% 0.92% 0.28% 4.13%
Total Asia 2.30% 3.17% 0.82% 0.22% 6.52%
Note: Estimates obtained using the low case scenario.
Source: Author, Centennial (2009)
15ADBI Working Paper 248 Bhattacharyay
5. INFRASTRUCTURE NEEDS FOR REGIONAL PROJECTS
FOR ASIAN CONNECTIVITY: 2010-2020
The total investments required to meet demand for the identified 1202 regional projects is
valued at approximately US$320 billion, with an average infrastructure investment need of
about US$29 billion per year for the period 2010-2020 (Table 7). Of this total, needed
investment in energy projects accounts for about 30% and transport 70%. This information is
based on a consolidated list of various proposals that are considered both economically
viable and likely to be implemented between 2010 and 2020 5. The state of projects included
varies greatly and some are much more advanced in their development than others. The
data is compiled from a variety of sources—some much more detailed than others—and
includes proposals at various levels of definition, preparation, review, and vetting. Also,
some of the project information was acquired through anecdotal references where access to
detailed feasibility reports and economic and financial evaluations for the projects was
limited. The estimates of regional infrastructure investment needs in this paper, as shown in
Table 7, include revised projections of some projects and 125 additional projects, which
resulted in an increase of US$34.0 billion compared with estimates provided previously in
ADB/ADBI (2009).
Table 7: Asia’s Total Regional Indicative Investment Needs for Identified and Pipeline
Infrastructure Projects by Regional/Sub-regional Program: 2010-2020 (US$ Million)
Regional / Transport
Sub- regional Airport / TF /
Program Energy Port Rail Road Logistics Total Grand Total
AH - - - 17,425.0 - 17,425.0 17,425.0
TAR - - 107,469.0 - - 107,469.0 107,469.0
ACP* - 51,446.0 - - - 51,446.0 51,446.0
CAREC 15,667.0 1,347.7 5,131.3 12,932.9 9,925.1 29,337.0 45,004.0
GMS 2,603.8 200.0 1,523.0 3,972.0 163.0 5,858.0 8,461.8
ASEAN 11,583.0 - 16,800.0 - - 16,800.0 28,383.0
BIMP-EAGA 100.0 - - - - - 100.0
SASEC 133.0 - - - 203.0 203.0 336.0
Other** 61,928.6 - - - 89.5 89.5 62,018.1
Total 92,015.4 52,993.7 130,923.3 34,329.9 10,380.6 228,627.4 320,642.8
* ACP = Asian Container Ports
** Includes projects connecting East/Southeast – Central – South Asia that do not explicitly fall under a sub- regional
program.
Source: Author
The investment needs for regional projects are around 4% of total national infrastructure
investment needs, which is comparable to Europe (see Van der Geest and Nunez-Ferrer
2010). Figure 4 presents the composite of the 1202 bilateral, sub-regional, and pan-Asian
infrastructure projects that are planned and soon to be constructed, and that were included
in this study.
5
The complete compendium of projects in provided as Appendix 2 of this paper.
16ADBI Working Paper 248 Bhattacharyay
Figure 4: Total Regional Investment Needs for Identified and Pipeline Infrastructure
Projects by Region: 2010-2020 (US$ Million)
120000
100000
80000
TF / Logistics
Road
Rail
60000
Port
Energy
Airport
40000
20000
0
Central Asia East Asia South Asia Southeast AsiaEast/Southeast Other
Asia-Central
Asia
Source: Author
It is also evident from Figure 4 that the vast majority of financing demand for regional
infrastructure investment falls within East and Southeast Asia—though Central Asia has this
highest overall number of projects at 199. The investment needed for Asian transport sector
projects amounted to US$218 billion, more than 2.5 times the investment needed for energy
projects. This contrasts with the pattern of national investment demand, where energy
demand is 1.3 times the investment need for the transport sector. This may be due to the
very complex nature of cross-border energy projects together with high investment
requirements, the need for strong coordination and cooperation among participating
counties, and the difficulties of harmonizing energy regulation among participating countries.
Asian energy sectors are typically highly regulated.
The following subsections detail the investment requirements for regional projects in Asia at
the pan-Asian and sub-regional levels.
5.1 Pan-Asian Transport Network
The pan-Asia transport network consists of highways, rails, airports, and container ports
linking Asian countries as well as Asia to Eastern Europe and the Middle East. It includes the
Asian Highways (AH), the Trans-Asian Railway (TAR), and Asian Container Ports (ACP)
networks, and is estimated to need around US$176.3 billion in investment over the coming
decade. The AH network is a system of 141,000 km of standardized roadways crisscrossing
32 Asian countries with linkages to Europe. The 121 identified transport projects are
expected to cost around US$17.4 billion. The TAR network is comprised of almost 81,000
km of rail lines serving 28 countries, starting at the Pacific seaboard of Asia and ending in
Europe. There were 85 projects identified within TAR, whose needs were estimated at about
US$107.5 billion. A large share of investment needed for TAR falls in the East Asian region,
at US$70.6 billion. These projects were chosen for their potential to facilitate international
17ADBI Working Paper 248 Bhattacharyay
trade between Asia (UNESCAP 2007). Additionally, a range of 765 container ports projects
around Asia were identified and expected to cost a total of around US$51.4 billion.
5.2 Infrastructure Projects at the Sub-regional Level
More than 60% of Asia’s total energy investment needs are in the Southeast and Central
Asia sub-regions. TAPI, the largest among these energy projects, will transport natural gas
from the Dauletabad gas field in Turkmenistan through Afghanistan, Pakistan, and then to
India. It is expected to carry 27 billion cubic meters (bcm) of natural gas annually. There are
also 5 major power projects identified in Central and South Asia, some of which have links in
Asia and Europe.
In Southeast Asia, 119 projects estimated to be about US$61.6 billion belong to sub-regional
groupings like GMS, ASEAN, and BIMP-EAGA. More than 60% of regional transport
investment needs are in Viet Nam, followed by around 29% in the provinces of PRC. In the
regional energy projects in the GMS, around 50% of the needed investments are in Lao
PDR. Generally in the GMS sub-region, greater amounts of investment are needed in the
transport sector. This could imply that in order to harness, share, and utilize the available
resources found in each country, connectivity through transportation is very important.
The second largest investment project needed is identified by the CAREC. Central Asia is an
historical land bridge that connects the East and West (East Asia and Europe) and the North
and South (the Indian Ocean and the Persian Gulf to Russia and the Baltic). More than 40%
of the planned cross-border infrastructure in the CAREC region is for transportation (mostly
intra-regional road construction and upgrades), while the remaining majority is for cross-
border energy. The identified energy projects comprise of oil pipelines, electricity
transmission and distribution lines, and construction of hydropower plants, as well as the
rehabilitation of existing lines and electricity power loss control infrastructure. Many of the
identified projects involve Kazakhstan or Tajikistan or both.
Some of the indicative investment needs in South Asia are found under the SASEC
program. Many of the projects in South Asia, aside from energy, are related to logistics and
trade facilitation. This could emphasize the role of transport and communication
infrastructure in the trade openness of countries in this sub-region. On the other hand, in the
energy sector, around 80% of the investment needs are for renewable energy projects,
including hydroelectric power projects in Nepal and Bhutan.
There are many projects in South Asia, Central Asia, and Southeast Asia (including ASEAN
nations and East Asia), which have not been planned under pan-Asian and sub-regional,
intergovernmental programs 6. Though these projects may not have explicitly been planned
or programmed under designated sub-regional or regional cooperation programs, they have
been labeled under such programs in this study according to which countries are involved or
participating jointly on a given project. For example, some energy projects, such as the
Trans-Afghanistan Gas Pipeline (TAPI) and the Central Asia-China Natural Gas Pipeline do
not belong to any specific sub-regional program as they cut across South Asia and Central
Asia. Sections of these projects are included in their corresponding sub-regional programs
based on the countries involved.
In this section, proposed projects (based on academic studies) in the Greater Tumen
Initiative (GTI) are not included in the estimated total regional infrastructure needs. GTI
projects were not included primarily because there has yet to be any form of formal
government level agreement or commitment to these projects. However, with 47 proposed
projects estimated at nearly US$19 billion and involving trade and transport corridors
spanning the Northeast Asia sub-region—from Eastern Russia to Korea and also including
6
See Appendix 1 for descriptions of the sub-regional programs included in this study.
18ADBI Working Paper 248 Bhattacharyay
Mongolia, PRC, and Korea—these projects could also be included in future when
considering regional or pan-Asian infrastructure and connectivity (Kayahara 2003).
5.3 Investment Needs for High Priority Projects
The earlier section highlights more than 1202 regional projects with cost estimates. Based
on ADB/ADBI (2009), Table 8 presents a list of high priority regional transport and energy
projects costing an estimated $15 billion under three sub-regional programs in Southeast
Asia, Central Asia and South Asia. Projects were determined to fall in the “high priority”
category if they were well defined, had progressed through necessary approval processes,
and considered politically, technically, economically, and financially feasible. In GMS, there
were 10 projects identified. Out of the five projects in the transport sector, four of these are
road infrastructure. While in the energy sector, out of the five projects, three of these are
transmission lines and two are hydropower projects. In the CAREC program, there were six
projects identified mostly in the transport sector, estimated to be about US$10 billion, or 65%
of the total estimated cost of the twenty one priority projects. This figure is the largest among
the sub-regions. In SASEC, the major projects include primarily transport and logistics,
communication, tourism, and hydroelectric power projects.
The successful implementation of these priority projects could realize large benefits for
participating countries and persuade more Asian economies to participate in regional
projects with “win-win” benefits.
Table 8: Twenty One High Priority “Flagship” Regional Projects
Total
Cost Cost Total No.
Sub- Cost
Transport (in US $ Energy (in US $ of
region million) million) (in US$
Projects
million)
GMS 5 projects 3,324 5 projects 1,414 10 4,738
GMS Kunming-Hai
Phong Transport GMS Northern Power
Corridor-Noi Bai-Lao
1,21 Transmission
54
Cao Highway
GMS Nabong-Udon
2nd GMS Northern
Thani Power
Transport Network 135 Transmission and
110
Improvement
Interconnection
Lao PDR-Viet Nam
Rehabilitation of the
Railway in Cambodia
73 Power Interconnection 270
(Ban Sok-Pleiku)
Ha Long-Mong Cai GMS Nam Ngiep 1
Expressway
1,000 Hydropower Projec
380
GMS Hanoi-Lang GMS Nam Ngum 3
Son Expressway
900 Hydropower Projec
600
CAREC 4 projects (total) 9,043 2 projects (total) 1,072 6 10,115
Central Asia-South Asia
CAREC Corridor 1b 6,700 Regional Electricity 962
Market (CASAREM)
Caucasus
Regional Power
Corridor:Armenia-
Georgia Regional
323 Transmission 110
Interconnection Project
Transport
CAREC Corridor 2 1,800
Western Regional
Road Corridor
Development Project-
220
Mongolia
SASEC 3 projects (total) 293 2 projects (total) 279 5 572
19ADBI Working Paper 248 Bhattacharyay
SASEC Information
Highway
Green Power
Project(Bangladesh, 24 Development (Bhutan)
234
Bhutan, India, and
Nepal)
Sub-regional
Transport Logistics
and Trade
West Seti Hydroelectric
Facilitation Projects 179 Project (Nepal)
45
(Bangladesh,
Bhutan, India, and
Nepal)
Improving
Connectivity and
Destination
Infrastructure for Sub-
regional Tourism 90
Development
(Bangladesh, Bhutan,
India, Nepal, and Sri
Lanka)
Total 12 projects 12,660 9 projects (total) 2,764 21 15,424
Source: Author’s Compilation and ADB/ADBI (2009)
6. CHALLENGES FOR REGIONAL INFRASTRUCTURE
FINANCING
Meeting huge financing needs of US$776 billion per year for national (US$747 billion) and
regional (US$29 billion) infrastructure during 2010-2020 is one of the largest challenges
facing many developing countries in Asia. Asia is expansive and its economies diverse.
Continuing to promote competitiveness and productivity by reducing trade and logistics
costs, forming specialized industrials clusters, and enlarging and deepening production
networks all need high quality national and regional infrastructure to succeed.
Using the most conservative estimate, the investment requirement for infrastructure at the
national level is a staggering US$8.3 trillion over the next decade. In order to attract finance,
particularly from the private sector, there is a need, to translate this demand into “bankable”,
commercially viable and profitable projects. Individual countries need to mobilize domestic
resources for infrastructure development. However, low-income countries may be more
dependent on regional and international capital markets and donors (including bilateral and
multilateral development banks) for additional financing, particularly concessional financing.
Based on the “bottom-up” approach, the financing demand for the planned regional
infrastructure projects that are economically viable is about US$313 billion over period 2010-
2020 for 1202 projects. Despite the limitations in available data and of the methodology, this
paper provides a good illustration of infrastructure demand in Asia over the next eleven
years. However, it is important to note that it is not possible to predict the exact duration and
implementation of the planned projects that are in pipeline. The cost estimates are mostly
based on the results of the feasibility studies of planned projects. Though the methodologies
in estimating the national and regional investment needs are not fully comparable and may
inherently overlap, it is interesting to note that regional investment needs are only 3.9% of
national estimated needs.
The major challenge for Asia is to mobilize various available resources to finance “bankable”
infrastructure projects and ensuring strong coordination and cooperation among various
stakeholders at the national, sub-regional and regional level. This calls for an appropriate
comprehensive approach to infrastructure development to facilitate regional infrastructure
connectivity. This approach should address the need for the identification and preparation of
priority bankable projects pipeline through a project development mechanism or framework
20You can also read