Least Conflict Lands Municipal Decision Support Tool for Siting Renewable Energy Development - Miistakis Institute
←
→
Page content transcription
If your browser does not render page correctly, please read the page content below
Least Conflict
                                           Lands
                                           Municipal Decision Support
                                           Tool for Siting Renewable
                                           Energy Development

                                           Tracy Lee, Kelly Learned and
                                           Ken Sanderson
PHOTO: SARAH SCHUMACHER

                          Innovative research. Engaged communities. Healthy landscapes.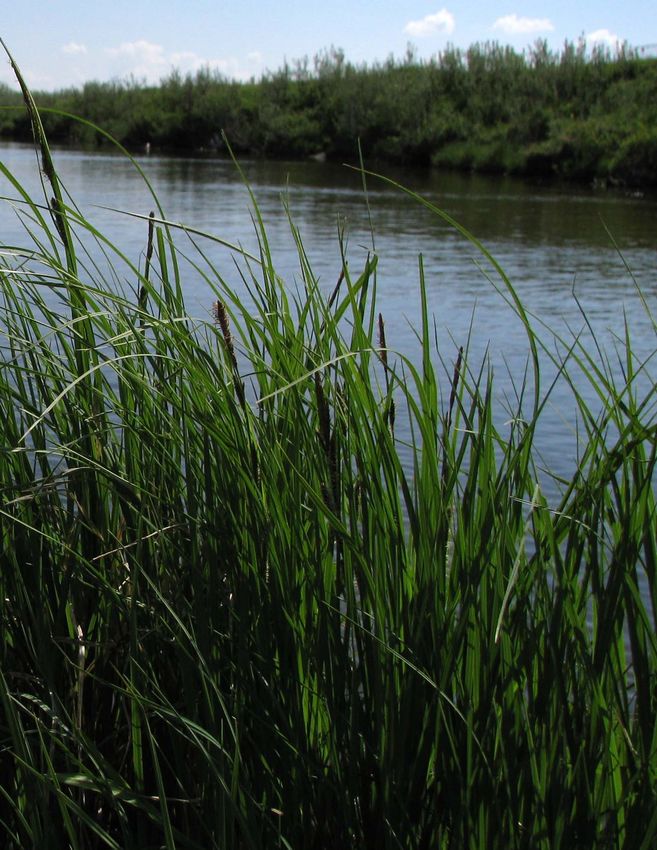
Municipal Decision Support Tool for
Siting Renewable Energy Development
Prepared by Tracy Lee, Kelly Learned and Ken Sanderson
October 2018

Miistakis Institute
Rm U271, Mount Royal University
4825 Mount Royal Gate SW
Calgary, Alberta T3E 6K6

Phone: (403) 440-8444
Email: institute@rockies.ca
Web: www.rockies.ca

TABLE OF CONTENTS
Acknowledgements . . . . . . . . . . . . . . . . . . . . . . . . . . . . . . . . . . . . . . . . . 1
Executive Summary . . . . . . . . . . . . . . . . . . . . . . . . . . . . . . . . . . . . . . . . . 2
Introduction . . . . . . . . . . . . . . . . . . . . . . . . . . . . . . . . . . . . . . . . . . . . . . . 8
Project Expectations and Constraints . . . . . . . . . . . . . . . . . . . . . . . . . 9
The Process . . . . . . . . . . . . . . . . . . . . . . . . . . . . . . . . . . . . . . . . . . . . . . . 10
Wind and Solar Opportunity Areas  . . . . . . . . . . . . . . . . . . . . . . . . . . 14
Ecological Theme . . . . . . . . . . . . . . . . . . . . . . . . . . . . . . . . . . . . . . . . . . 18
Agriculture Theme . . . . . . . . . . . . . . . . . . . . . . . . . . . . . . . . . . . . . . . . . 24
Culture and Scenic Resources Theme . . . . . . . . . . . . . . . . . . . . . . . . 30
Composite Map and Least Conflict Lands . . . . . . . . . . . . . . . . . . . . .36
References  . . . . . . . . . . . . . . . . . . . . . . . . . . . . . . . . . . . . . . . . . . . . . . . 40
Appendix 1: Feature, Justification and Regulations  . . . . . . . . . . . . 41
Appendix 2: Stakeholder Survey . . . . . . . . . . . . . . . . . . . . . . . . . . . . . 45
Appendix 3: Features Source Layers . . . . . . . . . . . . . . . . . . . . . . . . . 50

Acknowledgements
The Miistakis Institute is grateful for funding support from Rural Municipalities of Alberta,
the INTACT Foundation, Energy Efficiency Alberta’s Community Energy Capacity Building Program,
Wheatland County and County of Newell:

Dustin Pearce from the Conservation Biology Institute provided invaluable expertise throughout the process. Thank you, Dustin.

Numerous individuals helped us acquire the GIS data and or engaged in discussions on data manipulation and analysis, thanks to:
Trevor Reid, Nature Conservancy of Alberta; Colin Eyo, Alberta Conservation Association; Dustin Pate and Peter Fordham, Western
Sky Land Trust; David Spies and David Hildebragn Alberta Agriculture and Forestry; Oriano Castelli, Alberta Environment and Parks;
Paul Radchenko, Alberta Culture and Tourism, Jamie Thomas; Oldman River Services Commission, Konstantin Glants; County of
Newell, Reid Konschuh, Wheatland County; Lyle Boychuk, Ducks Unlimited; and Raza Mansoor, Altalink.

The following individuals provided information and/or guidance to the process: Jared Sproule, BlueEarth Renewables; Jenny
Burgess and Duke Hunter, Alberta Environment and Parks; Wendy Freedman, Alberta Culture and Tourism; and Darcy Driedger,
Alberta Agriculture and Forestry.

Finally, we would especially like to thank the various stakeholder representative organizations for providing their staff’s in-kind
support to participate in this process. Individuals and the organizations they represented are listed in each theme group section.
Thank you for your time and knowledge throughout this process.

Sincerely, the Miistakis Project Team:
Danah Duke, Executive Director
Tracy Lee, Senior Project Manager
Ken Sanderson, GIS Analyst
Kelly Learned, Project Manager
Holly Kinas, Research Assistant

                                              MIISTAKIS INSTITUTE Least Conflict Lands: Municipal Decision Support Tool for Siting Renewable Energy Development 1
Executive Summary
Alberta is investing in renewables as a key strategy to reduce greenhouse gas emissions. Alberta’s
Climate Leadership Plan aims to generate 30% of electricity from renewable sources by 2030. A
key challenge is to manage land use issues associated with the rapid growth in energy projects in
the province. Many land use impacts can be addressed through proper siting and avoidance of
areas important to ecology, agriculture or culture and scenic resources. A key lesson from other
jurisdictions supporting renewable energy development is the importance of siting renewable energy
development to reduce impacts to other land uses.

The Miistakis Institute partnered with the County of Newell                               37 stakeholders including representatives from municipal
and Wheatland County to develop a least conflict lands                                    staff and council, provincial government, irrigation districts
decision support tool to inform planning of renewable                                     and NGO’s. The process resulted in a series of spatial models
energy development. This process and decision support                                     that identified high value agriculture, ecology and cultural and
tool was modeled after the Least Conflict Lands for Solar PV                              scenic resources. In addition, industry identified opportunity
development in the San Joaquin Valley of California developed                             areas for wind and solar development. The resulting spatial
by Conservation Biology Institute, UC Berkeley School of Law,                             models identify areas of lowest ecology, agriculture and
and Terrell Watt Planning Consultants.                                                    culture and scenic values that represent the best opportunity
                                                                                          areas for wind and solar development.
In the County of Newell and Wheatland County this process
aimed to identify areas for utility scale wind and solar                                  This results of this process are non-regulatory, and do not
developments while avoiding important agriculture, ecology                                necessarily represent the individual views of stakeholders
and cultural and scenic resources at a municipal scale.                                   presence or the participating councilors.
The process was completed in six months, engaged

                                                                                                                                                        PHOTO: SARAH SCHUMACHER

2 MIISTAKIS INSTITUTE Least Conflict Lands: Municipal Decision Support Tool for Siting Renewable Energy Development
PHOTO: SARAH SCHUMACHER
What do we value in the region?
Stakeholders identified three important themes to consider; ecosystems, agriculture and culture and scenery. Each theme group
was asked to “identify the most valuable lands for their perspective theme.” For each theme group, important features were
identified that could be represented spatially on the landscape. Using an on-line survey, theme group participants scored each
feature based on its importance to the area using a scoring system ranging from very high (100), high (75), medium (50), low (25)
and very low (0).

     WE VA LUE AGRICULTURE

     Stakeholders identified 65% of the study areas as
     high to very high agriculture value.
     The agriculture stakeholder group was tasked with identifying the highest valued lands from an agriculture
     perspective. Four agriculture features were identified and represented spatially on the landscape.

      Agriculture Feature                                                                                                                 Value
      1. Irrigation Infrastructure right of ways and setbacks                                                                               100

      2. Land Suitability (alfalfa, canola, spring grains and brome)

         LSRS class 2 (slight limitations to growth)                                                                                        100

         LSRS class 3 (moderate limitations to growth)                                                                                        75

         LSRS class 4 (severe limitations to growth)                                                                                          50

         LSRS class 5 (very severe limitations to growth)                                                                                       0

      3. Irrigation Acres

         IL Class 1 (excellent for irrigated agriculture with no significant limitations)                                                   100

         IL Class 2 (good irrigation land with moderate limitations)                                                                        100

         IL Class 3 (fair for irrigation)                                                                                                     50

         IL Class 4 (severe limitations for irrigation, requires special management practices                                                 25

      4. Native Grasslands                                                                                                                  100

                    Ecological Importance Score:   100=Very High         75=High        50=Medium          25=Low        0=Very Low

     Once all agriculture features were assigned appropriate values, all 4 layers were overlaid and the maximum value was
     assigned per polygon.

                                                MIISTAKIS INSTITUTE Least Conflict Lands: Municipal Decision Support Tool for Siting Renewable Energy Development 3
WE VA LUE CULTURE A ND SCENERY

       Stakeholders identified 3% of the study areas as
       high to very high culture and scenic value.
       The culture and scenic resources stakeholder group was tasked with identifying the highest valued lands from a
       culture and scenic perspective. Thirteen features were identified and represented spatially on the landscape.

        Culture and Scenic Resources Feature                                                                                                Value
        Footprint features

             Provincial parks and protected areas                                                                                           100

             Historic Resource Value (Classes 1 and 2)                                                                                      100

             Campgrounds and reservoirs                                                                                                      50

             Dark skies                                                                                                                      75

             Golf courses                                                                                                                    25

             Historic Resource Value (classes 3 and 4)                                                                                       25

             Named lakes (2 km buffer)                                                                                                       50

        Scenic Resources

             Dinosaur Provincial Park (5 km buffer)                                                                                         100

             Kinbrook Island Provincial Park (1 km buffer)                                                                                   50

             Red Deer River (1.5 km buffer)                                                                                                  75

             Bow River (1 km buffer)                                                                                                         50

             Rosebud River (1 km buffer)                                                                                                     75

                            Cultural Importance Score:          100=Very High          75=High       50=Medium        25=Low   0=Very Low

       Once all cultural and scenic features were assigned appropriate values, all 4 layers were overlaid and the maximum
       value was assigned per polygon.

4 MIISTAKIS INSTITUTE Least Conflict Lands: Municipal Decision Support Tool for Siting Renewable Energy Development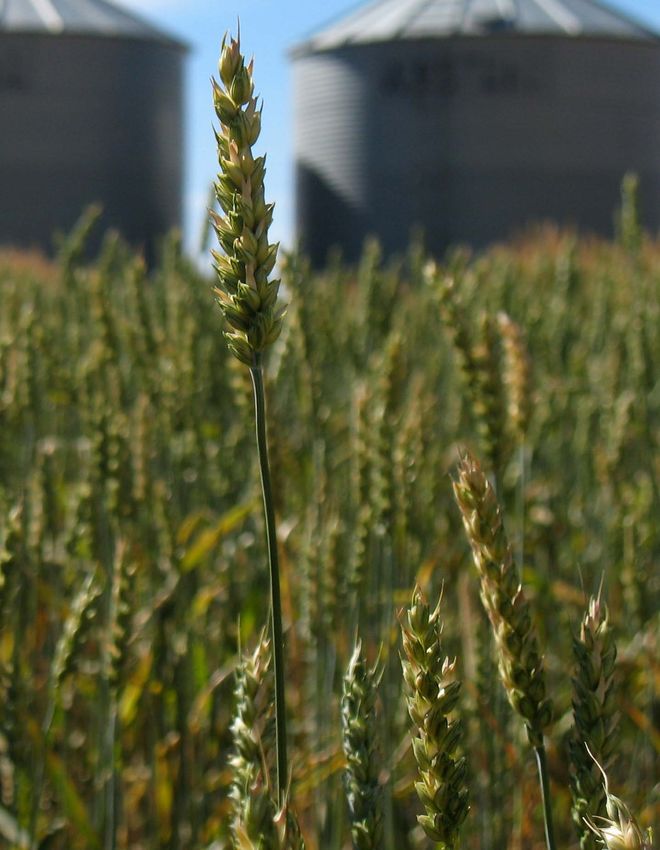
PHOTO: SARAH SCHUMACHER
WE VA LUE ECOS YS TEMS

Stakeholders identified 41% of the study areas as
high to very high ecological value.
The ecology stakeholder group was tasked with identifying the highest valued lands from an ecological perspective.
Eleven ecological features were identified and represented spatially on the landscape.

 Ecological Feature                                                                                                                   Value
 Provincial parks and protected areas                                                                                                   100

 County environmental reserve/conservation agreement lands                                                                              100

 Piping Plover critical habitat                                                                                                         100

 Large permanent water courses (100m)                                                                                                   100

 Smaller water courses (45m buffer)                                                                                                     100

 Wetlands class A (percentage of section)

    >45% of section is class A wetlands                                                                                                   75

    16-45% of section is class A wetlands                                                                                                 50

    6-15% of section is class A wetlands                                                                                                  25

 Native grassland (removed parcels 1.89)                                                                                           75

 Key wildlife and biodiversity zones                                                                                                      75

               Ecological Importance Score:    100=Very High         75=High        50=Medium          25=Low        0=Very Low

Once all ecological features were assigned appropriate values, all 11 layers were overlaid and the maximum value was
assigned per polygon.

                                            MIISTAKIS INSTITUTE Least Conflict Lands: Municipal Decision Support Tool for Siting Renewable Energy Development 5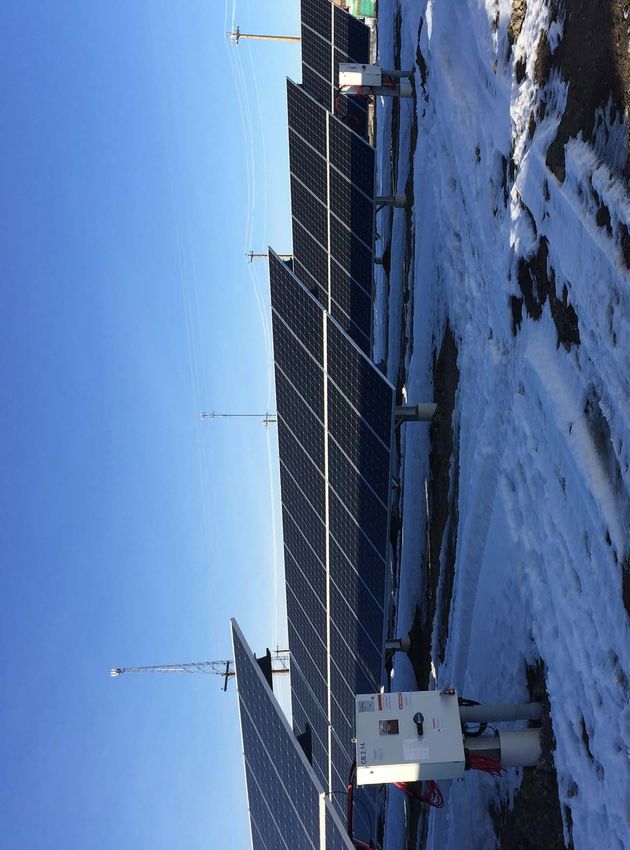
Where can renewable energy development go?

84% of the landscape was identified as opportunity areas
for wind and solar development.
The industry stakeholder group was tasked with identifying opportunity areas for solar and wind development within the
two pilot municipalities. There were 6 stakeholders who participated in workshops but numerous solar and wind industry
representatives played background roles in terms of guidance at key decision points.

Stakeholders identified opportunity areas by simply removing regulatory no-go areas. All other lands besides regulated no-go
areas were considered opportunity areas for wind and solar.

Putting it all together….
A composite map was developed by overlaying and summing the ecology, agriculture, and culture and scenic resource spatial
models. This approach highlighted areas of mutual high scores between theme areas and conversely highlights the best
opportunity areas for renewable energy development. Using the composite map, zero values (representing no conflict) and the
bottom 20% of values were identified as least conflict lands (best opportunity areas for renewable energy development). In
addition, due to industry needs any parcel less than 10 acres was removed for wind and any parcel under 50 acres was removed
for solar. Only those parcels falling within the wind and solar opportunity area were considered as least conflict lands or best
opportunity areas for renewable energy development.

Lighter colour lands represent least conflict areas for renewable energy development while darker colours represent areas of
importance based on ecology, agriculture and culture scenic resource considerations.

6 MIISTAKIS INSTITUTE Least Conflict Lands: Municipal Decision Support Tool for Siting Renewable Energy Development
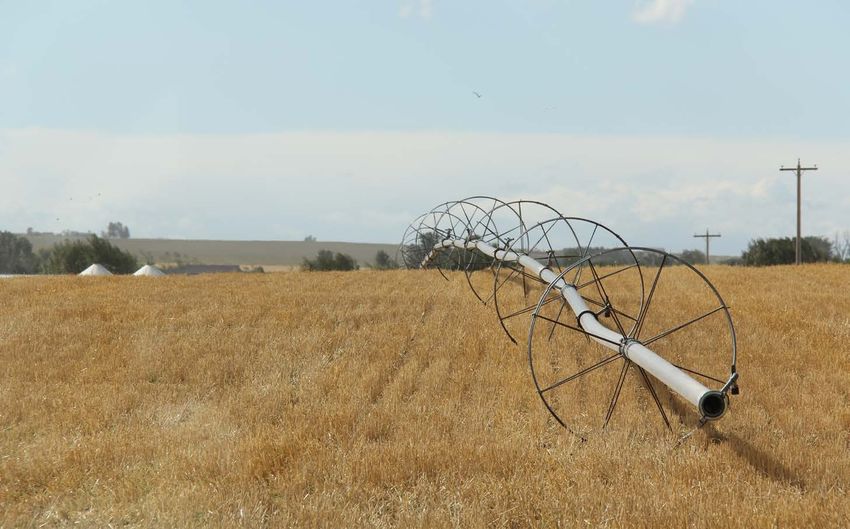
PHOTO: SARAH SCHUMACHER
Where are the best places for renewable energy development?
The decision support tool identified 15% of the study area, or 399,432 acres for solar and 413,530 acres for wind as least conflict
lands for renewable energy development. These lands represent opportunity areas for renewable energy development that do
not conflict with ecological, agriculture and culture and scenic resources.

                      Least Conflict Lands Solar

                      Least Conflict Lands Wind

                                              MIISTAKIS INSTITUTE Least Conflict Lands: Municipal Decision Support Tool for Siting Renewable Energy Development 7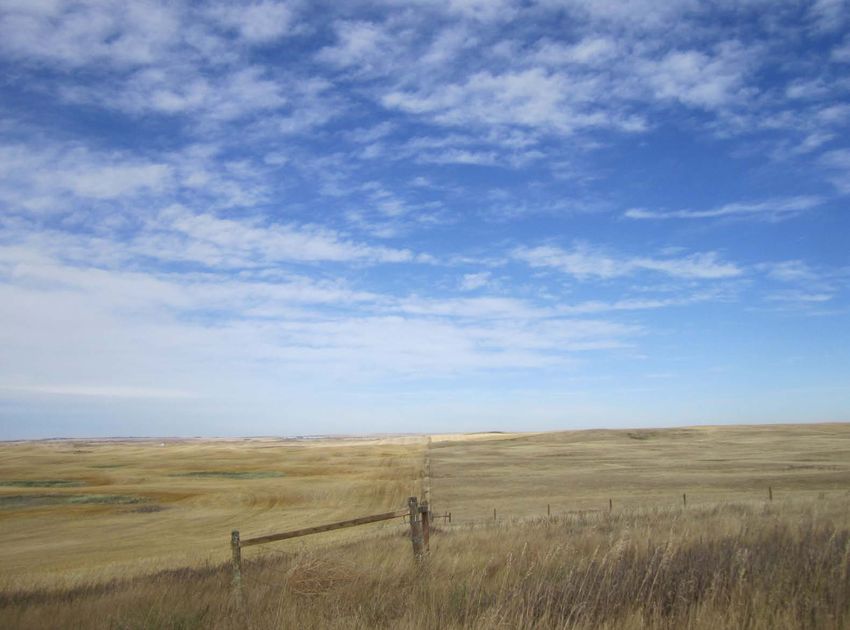
Introduction
“Smart from the Start: Renewable energy development planning that encourages developers to locate
 projects in areas with low environmental value and in proximity to existing transmission corridors.”
Kate Kelly and Kim Delfino, 2012

Many jurisdictions are focused on increasing wind and solar                               In a recent survey by the Miistakis Institute, rural
developments to meet renewable energy targets in an effort                                municipalities in Alberta identified a number of concerns in
to reduce our carbon footprint. Alberta is also investing in                              relation to renewable energy land use decisions including
renewables as a key strategy to reduce greenhouse gas emissions.                          competing interests in relation to high valued agriculture and
Alberta’s Climate Leadership Plan aims to generate 30% (currently                         ecological lands as well as impacts to views of the landscape2.
at 9%) of electricity from renewable sources by 2030. This 21%                            Municipal respondents to the survey indicated support for a
increase in electric power production from renewables over the                            process to help inform decision making related to the siting of
next 23 years is equivalent to 5,000 MW of power production.1                             renewable energy development.

As a result of the Alberta Climate Leadership Plan, both wind                             As a result of the survey responses, Miistakis completed an
and solar utility scale developments are expected to increase                             assessment of work other jurisdictions and organizations
in Alberta, particularly in southern Alberta where there is some                          have undertaken to assist with municipal decision making
of the best potential for wind and solar development. While                               and renewable energy siting. The research revealed a “least
this is an opportunity for municipalities, it also raises some                            conflict lands” tool developed by a collaborative in the
challenges from competing land uses. Many land use impacts                                San Joaquin Valley of California as a potential approach to
can be addressed through proper siting and avoidance of                                   assist rural municipalities in Alberta (Conservation Biology
areas important to ecological, agriculture, or culture and                                Institute, UC Berkeley School of Law, and Terrell Watt Planning
scenic resources.                                                                         Consultants 2016). This project was modeled on the San
                                                                                          Joaquin Valley project, but adjusted to the Alberta context
                                                                                          and stakeholder interests.

1   https://www.alberta.ca/climate-leadership-plan.aspx
2   http://www.rockies.ca/miradm/uploads/WISO_Survey%20Report_FINAL1.pdf

8 MIISTAKIS INSTITUTE Least Conflict Lands: Municipal Decision Support Tool for Siting Renewable Energy Development
Project Expectations and Constraints
The least conflict lands project does not solve all land use decisions that will be made at the pilot
municipal scale. This tool is the starting point for discussions between staff, the developers, and
Council members. Depending on how the municipalities choose to use it, it may become a way to
begin broader discussions with the public.
Project Constraints This project represents diverse perspectives and not the
opinions of individual participants. The process is described
This is not a regulatory tool. This tool helps visualize what below and outlines how there were many perspectives at each
the various perspectives, interests, and (to a certain extent) table and involved throughout the process. There are some
Provincial regulatory requirements are in the two counties. It features that had a high level of agreement in terms of how
shows ecological, agricultural, cultural/viewshed features on the the feature should be valued in the model, and there are some
landscape spatially. If an area is shown outside of a least conflict features that had a dispersed level of agreement. For those
land area, it does not necessarily mean it is not appropriate for features that did not have a high level of agreement, the project
development. It does however indicate there may be something team investigated how those features could be represented in
that needs further discussion, mitigation or investigation. a way that reflected the differing opinions. In some cases (as
This is not a parcel level assessment. Typically, when people noted in the report) there are certain features that are defined
see a map they look for the place they live or frequent and differently by stakeholders’ local knowledge and experience, by
are most familiar with. Due to the scale of this tool and the the regulations, or by science. These differences have been noted.
available data, there may be discrepancies between what the There are other important considerations not included
map indicates conceptually and what is on the ground at the in this process:
parcel level. Again, the tool is a starting point for discussion
and a way to indicate that further investigation may need to be Distance to transmission lines was not included because
done once a development interest is indicated. industry representatives noted technological advances and
size of the project greatly influence how far renewable energy
will be sited from transmission.
Proximity to settlement was not included in this analysis, but is
considered an important influencer.
PHOTO: SARAH SCHUMACHER
MIISTAKIS INSTITUTE Least Conflict Lands: Municipal Decision Support Tool for Siting Renewable Energy Development 9The Process
Rural municipalities sit at the nexus of land use planning and decision making around competing land use
interests. In rural Alberta, new renewable development will occur in communities where citizens care deeply
about lands of high agriculture, ecological, and cultural/heritage value as well as maintaining integrity of
picturesque views. To start smart (Kelly and Delfino 2012) Miistakis facilitated a pilot project to complete a
stakeholder driven process to identify least conflict lands in rural municipalities in Alberta. The pilot involved
two rural municipalities in southern Alberta that acknowledge the increasing interest in renewable energy
development in their jurisdictions, County of Newell and Wheatland County (figure 1)3
As described by Oldman River Services Commission the County of Newell spans an area of approximately 620,000 hectares
(1.5 million acres) with a population of 7,138. The County of Newell surrounds four urban municipalities, contains ten hamlets
and is bordered by four municipalities, one Special Area and one First Nation. The economy of the County of Newell is based on
agriculture and energy resource development. The County of Newell includes several large reservoirs, the two largest being
Lake Newell and Crawling Valley, which provide irrigation and recreational opportunities (Klassed et al. 2015).
As described by Oldman River Services Commission Wheatland County covers an area of approximately 460,000 hectares
(1.1 million acres), with a population of 8,285 (Alberta Municipal Affairs, 2013). Wheatland County surrounds four urban
municipalities, contains twelve hamlets and a number of other communities not officially designated as hamlets. The County is
bordered by five rural municipalities, one urban municipality and one First Nation. The economy of Wheatland County is based
on agriculture, including beef and grain production. In recent years industry, manufacturing, oil and gas have played key roles in
the County’s economic growth (Klassed et al. 2015).
Figure 1: Planning Area
3 For this process the First Nation reservation on the south side of study areas was not included in the assessment and is also not included in any of the area calculations.
10 MIISTAKIS INSTITUTE Least Conflict Lands: Municipal Decision Support Tool for Siting Renewable Energy DevelopmentTheme area stakeholder groups
(number of people)
Solar and Agriculture
Wind
6 13
The least conflict lands tool is unique
as it was developed in consideration
of multiple interests (ecological,
agriculture, culture and scenic resources
and renewable energy development),
included a strong engagement approach
by involving numerous stakeholders
(including county representatives and
elected officials), and identified areas Ecological Culture/Scenic
where land use conflicts could lengthen Resources
or complicate the approvals process for
renewable energy development.
12 7
Project Objectives
Convene local stakeholder groups to
represent the following land uses within
a rural municipality: Project preparation began at the end of January 2018 and
• wind, the last formal engagement was completed July 2018, a five-
• solar,
and-a-half-month stakeholder driven process.
• transmission,
All of the spatial layers were hosted on Data Basin, an open source science-
• agriculture,
based mapping and analysis platform developed by the Conservation Biology
• ecosystems, and Institute (CBI) that supports learning, research, and sustainable environmental
• culture/scenic resources stewardship4. Using Data Basin, gallery maps were created for each theme area
enabling participants to review spatial products as the process progressed.
Use existing data to develop spatial Model adjustments were updated in ‘real time’ to reflect new information to
maps that depict the best opportunities inform ongoing conversations with the stakeholder theme groups.
for wind and solar planning, while also
identifying the highest value lands for
ecological, agriculture and cultural/scenic
resources. We did not assess best location
for transmission planning in this process;
Identify lands where there is the least
conflict for solar and for wind energy
development projects within a relatively
quick timeframe (as applications are
already underway throughout Alberta).
4 https://databasin.org/
MIISTAKIS INSTITUTE Least Conflict Lands: Municipal Decision Support Tool for Siting Renewable Energy Development 11Key events are summarized in the diagram below:
INITIATION
MEETING
with Newell WORKSHOP 1: INDUSTRY CHECK IN:
County and Identify key Progress debrief
Wheatland features by theme, and feedback from
County develop criteria and industry group and
representatives. assign ranking. developers
MAY 1
201
FEB APRIL APRIL APRIL 26- MAY
13 10 12 MAY 2 2&8
2018 2018 2018 2018 2018
MAY 14-18
2018
STAKEHOLDER PRE- WHAT WE HEARD SURVEY:
CONSULTATION: REPORT AND CHECK-IN: ASSIGNING VALUES
Interviews Report summarizing TO FEATURES
completed. outcomes of workshop Each participant was
1 by theme group. asked to individually
Participants were asked rank features
to provide feedback. identified in their
theme group.
IN SUMMARY: Over 20 individual interviews were hosted by the 2 all-stakeholder
project team for pre-consultation interviews, data workshops
gathering and touch points throughout the process
1 survey
12 MIISTAKIS INSTITUTE Least Conflict Lands: Municipal Decision Support Tool for Siting Renewable Energy DevelopmentMOVING FORWARD WITH
MODELLING PROGRESS
REPORT distributed to PROGRESS REPORT
CHECK IN: stakeholders to identify distributed to
Phone calls with changes made from stakeholders to outline
stakeholders as workshop 2 and identify layer adjustments made
required. outstanding items for based on discussions
stakeholders to address. with stakeholders.
11-25
18
MAY JUNE JUNE JUNE
28 12-25 25 29 SEPTEMBER
2018 2018 2018 2018 2018
8
WORKSHOP 2: ALL STAKEHOLDER FINAL LEAST
Present draft spatial VIDEO CONFERENCE: CONFLICT LANDS
layers by theme Present final layers REPORT
and composite map and facilitate completed and
for opportunity discussion on any distributed to
areas; feedback and remaining items, stakeholders and
discussions. comments, feedback. posted to the
Miistakis website.
8 video or conference call group meetings were hosted 2 progress reports
to touch base with participants, hear feedback and host discussion to all stakeholders
opportunities on how the process was going, what needed to
be adjusted, and what the next steps were 1 final report
MIISTAKIS INSTITUTE Least Conflict Lands: Municipal Decision Support Tool for Siting Renewable Energy Development 13Where are the opportunity areas for wind and solar in
Wheatland County and County of Newell?
Wind and Solar Opportunity Areas
The industry stakeholder group was tasked with identifying opportunity areas for wind and solar
development within the two pilot municipalities. The municipalities have a combined land base
of 2,695,278 acres (10,900km2), the majority in agricultural production across relatively flat, open
landscapes with a high number of sunny days and consistent wind speeds throughout the area –
an ideal context for wind and solar developers.
To address concerns from municipal administrators of perceived future bias, developers that were active or may have an
interest in developing in the two counties did not participate as stakeholders at the workshops. However, industry organization
representatives did participate (CanSIA and CanWEA). In addition, Miistakis ensured a number of touch points with solar and
wind developers to provide progress reports, test findings and compile their feedback and recommendations.
14 MIISTAKIS INSTITUTE Least Conflict Lands: Municipal Decision Support Tool for Siting Renewable Energy DevelopmentSTAKEHOLDERS
Model Design Process
Patrick Bateman
There were six participants in the Industry Theme Stakeholder group. Five of the six were
Director of Policy and Market
Development, CanSIA interviewed prior to the workshop as well as one wind industry expert that did not participate
in the process.
Bruce Cole
Manager Environment, The interviews provided insight into the type of data to collect and some of the key
AltaLink considerations for solar and wind developers.
Paul Deleske Pre-workshop interviews identified several features that could influence renewable energy
Corporate Communications,
development:
AESO
Ian Johnstone • distance from transmission line and/or existing system substation
Manager Siting, AltaLink • voltage of transmission required for commercial sites
Stewart Musgrove • slope restrictions
County of Newell
• areas off-limit for solar or wind development based on regulation
Evan Wilson • quality of solar or wind resource potential
Regional Director Prairies,
CanWEA During workshop 1, the industry group was asked to test the features identified through the
pre-workshop activities that would define opportunity areas for wind and solar.
Participants were asked how identifying least conflict lands might impact (positively or
negatively) the Industry Theme area. Discussion points were grouped by the stakeholders into
the following categories:
• Risk management – risk to different projects in development outside the least conflict
areas; what if the amount of land identified by the least conflict tool is not considered
economically significant to industry?
• Data and planning tool – assist in defense of site selection; increased data quality and
availability to stakeholders; minimize project stakeholder/regulatory conflict.
• Landowner property rights – is there a risk to property rights for landowners/industry?
Potential impacts on land values within and outside the least conflict areas.
• Existing regulatory environment – opportunity for education and outreach on what
current regulations exist related to renewables and the standards developers are held to.
• Proximity to existing infrastructure – efficiency in future projects; shortest route for
distribution and transmission.
• Impact analysis – micro opportunities outside wind and solar and the consequential
impacts of these large projects.
MIISTAKIS INSTITUTE Least Conflict Lands: Municipal Decision Support Tool for Siting Renewable Energy Development 15Key considerations for solar and wind development were
identified and included:
• Solar development costs are scalable, proximity to
distribution and cost of connection is proportionate to
project size (i.e. the further from connection to the grid,
the larger the project needs to be).
• Wind is more constrained than solar technology as
it is reliant on wind consistency and proximity to
interconnection.
• Environmental considerations include: avoidance of
migratory pathways; native grassland disturbance;
wetlands; and crown land restrictions.
• Crown land is a no-go; native grassland and wetlands are
highly regulated; migratory bird pathways are regulated
and local monitoring is required; habitat for wildlife
setbacks are defined in AEP directives for wind and solar.
• AUC Noise Guidelines – cumulative noise must be
considered.
• Municipal setbacks.
• Proximity to road and rails to get product to and from
the site. Often requires road agreements between the
municipality and the developer.
• Pipelines, oil and gas infrastructure.
• Parcel size would be project specific so too difficult to
estimate as a feature.
• Ecological features should be determined by the
Ecological Theme group.
• Noise is cumulative and not spatially identifiable, so it
cannot be mapped.
• Focus on mapping no-go areas that are regulated.
• Don’t map oil and gas infrastructure as it would sterilize
the entire study area at the scale we are working at.
• Map irrigation infrastructure as no-go areas.
• Airports and municipal airstrips.
• Railways, highways and secondary road right of ways.
• Transmission line ROWs.
• Solar potential exists throughout the two counties
minus the absolute no-go areas.
• NRCAN model could be used to identify wind
opportunity areas.
After workshop 1, the project team compiled a ‘What we Heard’
report that listed each theme group’s features, criteria for
assessing that feature, and data required to map it. Through
direct distribution and a remote presentation, Industry Theme
PHOTO: SARAH SCHUMACHER
16 MIISTAKIS INSTITUTE Least Conflict Lands: Municipal Decision Support Tool for Siting Renewable Energy DevelopmentGroup stakeholders and wind and solar developers were • Piping plover water bodies and 200m setback (AUC 007)
asked for feedback to confirm the discussions and if findings • Parks and protected areas
appropriately reflected identification of opportunity areas for
• Historic Resources Value class 1 and 2 (Alberta Historic
wind and solar. No-go areas for modeling were also confirmed.
Resources Act 2.0)
The industry group advised that negotiations may happen on
certain features (i.e. slopes, setbacks from roadways, etc.) or Stakeholder discussions prior to and after workshop 2
there may be context specific influencers and those types of confirmed the approach to mapping opportunity areas for
features should not be included as no-go areas. The agreed to least conflict lands:
no-go areas include:
• Solar resource is sufficient throughout the study area
• Crown land • Wind resource < 3m/sec is likely not economically
• Roadways – only the right-of-way viable for wind development
• Transmission lines – only right-of-way • Remove absolute no-go areas (listed above).
• Irrigation infrastructure and setbacks
• Permanent watercourses with 100m setback for large
rivers, and 45m setback on smaller watercourses (AUC 007)
Opportunity Areas Modelling Results
Wind and solar opportunity areas within the counties represent 1,046,237acres or 84% of the study area (figure 2).
Figure 2: Opportunity Areas for Wind and Solar
MIISTAKIS INSTITUTE Least Conflict Lands: Municipal Decision Support Tool for Siting Renewable Energy Development 17Where are the least conflict lands for renewable energy
development from an ecological perspective?
PHOTO: SARAH SCHUMACHER
Ecological Theme
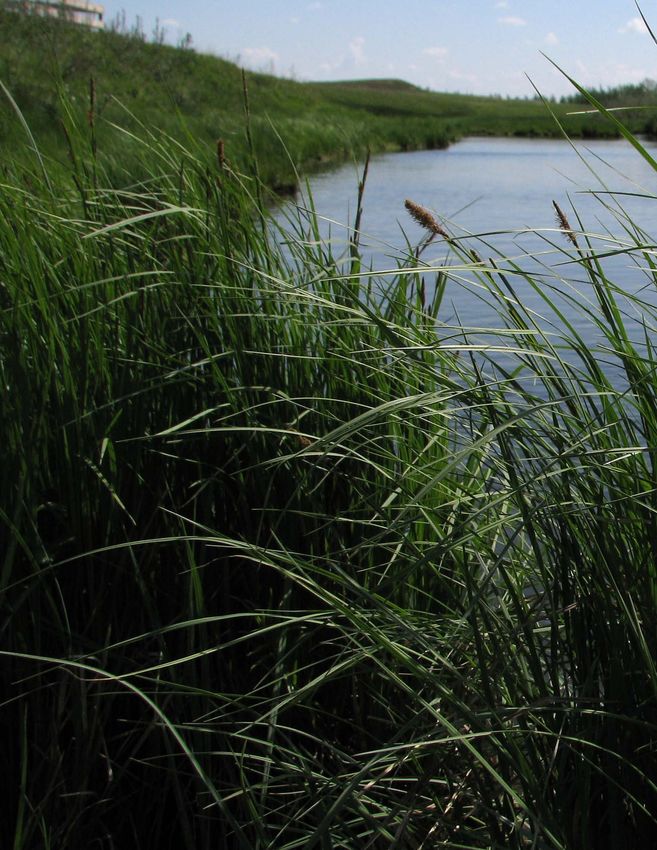
Wheatland County and the County of Newell are predominately composed of native grassland and
large and small waterways, wetlands, lakes and associated riparian areas. Both counties are located
in the grasslands natural region, and as with other jurisdictions the region supports multiple land
use activities resulting in pressure on natural features. A recent report released by ABMI noted that
as of “2016, the human footprint occupied 57.12% of the Grassland Natural Region. Agriculture was
the predominant human footprint, covering 49.59% of the landscape. Transportation (2.66%), energy
(2.47%), and urban/industrial (1.47%) footprint all covered similar areas. ” Within the study area
native grassland has been predominantly converted to agriculture and is heavily fragmented from oil
and gas activity(Alberta Biodiversity Monitoring Institute 2017).
Native grasslands are important because they provide a suite of ecological goods and services, including but not limited to: providing
wildlife and fish habitat, promoting healthy riparian areas to maintain water quality and quantity, providing clean air, maintaining
biodiversity, preventing soil erosion, providing carbon sinks, stabilizing ecosystems during drought, and providing economic
opportunities (Alberta Biodiverity Monitoring Institute 2015). In addition, native grasslands support numerous species at risk in the
counties including burrowing owl, prairie rattlesnake, and piping plover (Alberta Environment and Parks: Fish and Wildlife 2017).
Both counties have established policies in regard to natural resources in their Municipal Development Plans (MDPs), including
protecting, enhancing or conserving natural assets such as environmentally significant areas and other significant natural areas.
The Intermunicipal Development Plan for the counties identified the following important ecological features: natural water features;
highly suitable natural habitats for species-at-risk and keystone wildlife; and Environmentally Sensitive Areas (Klassed et al. 2015).
18 MIISTAKIS INSTITUTE Least Conflict Lands: Municipal Decision Support Tool for Siting Renewable Energy DevelopmentSTAKEHOLDERS The following resources5 from Alberta Environment and Parks informed discussions for the
Clarence Amulung Ecological Theme group process:
Councillor, County of Newell • Wildlife Directive for Alberta Wind Energy Projects: summarizes potential wildlife issues
Mark Bennett associated with wind energy projects and provides direction for minimizing effects to wildlife
Executive Director, and wildlife habitat during siting, construction, and operation of wind energy projects.
Bow River Basin Council
• Wildlife Directive for Alberta Solar Energy Projects: summarizes potential wildlife issues
Brandy Downy associated with solar energy projects and provides direction for minimizing effects to wildlife
Species at Risk Biologist, and wildlife habitat during siting, construction, and operation of solar energy projects
Alberta Environment
and Parks • Renewable Energy and Wildlife Habitat Sensitivity Map: map includes four categories;
critical wildlife, high risk, moderate risk and lower risk. Critical areas must be avoided for
Craig Harding
renewable energy projects. Areas of high risk require increased pre-assessment work,
Manager Conservation
Science and Planning, Nature mitigation and specialized construction or operation techniques/rules.
Conservancy Canada
Diane Horvath
Senior Planner, Oldman River 5 http://aep.alberta.ca/fish-wildlife/wildlife-land-use-guidelines/default.aspx
Services Commission
Ed Matthies
Landowner, County of Newell
Amanda Miller
Provincial Rangeland
Specialist, Alberta Model Design Process
Environment and Parks
There were 11 participants in the Ecological Theme Stakeholder group. Prior to the first
Brian Peers workshop, four participants were interviewed (one staff person from each county, and
Director, Prairie two subject matter experts) to help identify a list of key ecological features and concerns.
Conservation Forum
Pre-workshop interviews identified three key ecological impacts from renewable energy
Jessy Rajan development for consideration:
Red Deer River
Watershed Alliance • loss and fragmentation of native grassland;
Alyssa Robb • loss of wetlands; and
Environmental Coordinator, • direct mortality for birds and bats.
Wheatland County
In addition, pre-workshop interviews resulted in the development of a preliminary list of
Mike Uchikura
Alberta Conservation ecological features important to the area, and highlighted provincial regulations, municipal
Association plans and bylaws aimed at conserving ecological features.
At the first workshop participants refined the list of ecological features, identified why it was
ecologically important and discussed regulatory requirements. The 11 features included in the
ecological model:
• Provincial parks and protected areas
• County Environmental Reserve/conservation agreement lands
• Piping Plover critical habitat
• Wetlands
• Large permanent water courses (100m)
• Smaller water courses (45m buffer)
• Named water bodies (plus 1000m buffer)
• Native grassland (removed parcels 1.89)
• Key wildlife and biodiversity zones
Details on each feature, including why it is important, supporting regulations and/or plans are
outlined in appendix 1.
MIISTAKIS INSTITUTE Least Conflict Lands: Municipal Decision Support Tool for Siting Renewable Energy Development 19Once the 11 features were agreed on by stakeholders, spatial layers were developed for each feature and shared on Data
Basin for participants to review. Using an on-line survey, theme group participants scored each feature based on its ecological
importance to the area using a scoring system ranging from very high (100), high (75), medium (50), low (25) and very low (0).
The value with the highest percentage of votes was applied to each feature (table 1). Detailed summary of the survey can be
found in appendix 2.
Table 1: Ecological features and ecological value
Ecological Feature Value
Provincial parks and protected areas 100
County environmental reserve/conservation agreement lands 100
Piping Plover critical habitat 100
Large permanent water courses (100m) 100
Smaller water courses (45m buffer) 100
Wetlands class A (percentage of section)
>45% of section is class A wetlands 75
16-45% of section is class A wetlands 50
6-15% of section is class A wetlands 25
Native grassland (removed parcels 1.89) 75
Key wildlife and biodiversity zones 75
Ecological Importance Score: 100=Very High 75=High 50=Medium 25=Low 0=Very Low
Once all features were assigned appropriate values, all 11 layers were overlaid and the maximum value was assigned per
polygon. Therefore, there is no cumulative value, but instead we assign the highest value to each polygon (a spatial area).
The ecological features and their values were used to develop the ecological model. No new data was developed for this
process, so the project team was dependent on existing datasets. For each feature a spatial layer was developed then assigned
an ecological value as defined by the ecological stakeholder group (see table 1). Maps of source feature files are displayed in
appendix 2.
There were a number of data gaps identified during the overall process:
• Many of the stakeholders expressed concern in using the provincial merged wetland layer in the modeling process due to
inaccuracies with findings on the ground.
• Bird and bat migration areas are not well documented in the area or include very wide bands that are not appropriate
for the scale of the study area. We addressed this by assuming riparian areas associated with large river valleys and lakes
likely represent important migration pathways.
• Wildlife connectivity is not well understood in the study area.
20 MIISTAKIS INSTITUTE Least Conflict Lands: Municipal Decision Support Tool for Siting Renewable Energy DevelopmentTheme Layer Development
1. Parks and Protected Areas: shapefile acquired from Monitoring Institute 2016) features including well pads,
Alberta Parks (Last updated in November 2017, with a well pad roads, unknown clearings, crop, and tame
scale at 1:20K). pasture from the native grassland footprint. lastly parcel
2. County Environmental Reserve and Conservation sizes under 155 acres were removed.
Agreement Lands was developed using the following 8. Named water bodies and 1000m buffer developed using
six data sources: Alberta base features extracted hydro waterbodies that
a. County of Newell Environmental Reserves had names (Last Updated in 2016, scale 1:20K)
b. Wheatland County Environmental Reserves 9. Important bird area shapefile acquired from Bird Studies
c. Nature Conservancy of Canada Conservation Canada. Important Bird Areas (IBAs) are discrete sites that
Easements. (Updated 2018, scale quarter section). support specific groups of birds: threatened birds, large
groups of birds, and birds restricted by range or by habitat.
d. Western Sky Land Trust Conservation Easements.
IBAs are identified using criteria that are internationally
(Updated 2018, scale quarter section level).
agreed upon, standardized, quantitative, and scientifically
e. Alberta Conservation Association, lands with defensible. This gives them a conservation currency
Conservation Agreements (Updated 2018, legal that transcends international borders and promotes
land descriptions). international collaboration for the conservation of the
f. Ducks Unlimited, Lands with Conservation world’s birds (Bird Studies Canada 2015).
Agreements. (Updated 2018, legal land descriptions).
10. Environmentally significant Areas: shapefile was
3. Piping Plover waterbodies: a shapefile acquired from acquired from Alberta Parks. Environmentally
AEP of Piping Plover Waterbodies includes all water Significant Areas (ESAs) are generally defined as areas
bodies as of 2009 with confirmed breeding pairs as that are important to the long-term maintenance of
determined by annual surveys. An entire water body is biological diversity, physical landscape features and/
considered a nesting site. (Last updated in 2010). or other natural processes, both locally and within a
4. Large Permanent Water Course extracted from Alberta larger spatial context (Fiera Biological Consulting LTD.
base features. (Updated in 2016, scale at 1:20K). 2014). (Last updated in 2014, scale per quarter section).
5. Small Permanent Water Courses extracted from Alberta 11. Key Wildlife and Biodiversity Zones: Endorsed by the
base features. (Updated in 2016, scale at 1:20K). Government of Alberta, includes a combination of key
wildlife habitat from both uplands and major watercourse
6. Wetlands: Developed a spatial layer based on the
valleys. The basis of this zone was determined using
offset wetland provincial data by identifying the
major river corridors, valley topography, valley slope
number of hectares of class A wetlands per section.
breaks and ungulate winter densities. The Key Wildlife
We valued the sections as followed:
and Biodiversity Zone is intended to prevent loss and
–– 5-14% of section is class A (25) fragmentation of habitat; prevent short and long-term
–– 15-44% of section is class A (50) all-weather public vehicle access; prevent sensory
–– >45% of section is class A (75) disturbance during periods of thermal or nutritional
stress on wildlife; and prevent the development of
7. Native grassland: was identified native grassland from barriers to wildlife corridors (e.g., stream crossings). Note
the Grassland Vegetation Index (GVI) – using native that this layer is a consolidation of previous Key Ungulate
vegetation upland (where there was 50% herbaceous Areas, Key Ungulate Winter ranges, and Class C - Key
veg within a quarter section). The GVI was updated in Wildlife and Watercourse areas.(Last updated in 2010).
2009. We extracted human footprint (Alberta Biodiversity
MIISTAKIS INSTITUTE Least Conflict Lands: Municipal Decision Support Tool for Siting Renewable Energy Development 21Modelling Results
The ecological model is displayed in figure 4 (next page). In this model darker green represents higher ecological importance and
lighter green to white represent lower ecological importance. Figure 3 shows the percentage of land considered very high and
high ecological value for County of Newell County (58%), Wheatland County (19%) and across the study area (41%). This model
is intended for high-level planning purposes and is not appropriate for parcel level evaluations. In addition, model outputs
represent a snap shot in time and are dependent on resolution and accuracy of the source data used to represent each layer.
Figure 3: Percent of land in high to very high ecological value
NEWELL WHEATLAND STUDY AREA
19%
41%
58%
893,718 ACRES/3,616 KM2 214,642 ACRES/869 KM2 1,108,360 ACRES/309 KM2
22 MIISTAKIS INSTITUTE Least Conflict Lands: Municipal Decision Support Tool for Siting Renewable Energy DevelopmentFigure 4: Ecological Theme Model
PHOTO: SARAH SCHUMACHER
MIISTAKIS INSTITUTE Least Conflict Lands: Municipal Decision Support Tool for Siting Renewable Energy Development 23Where are the least conflict lands for renewable energy
development from an agriculture perspective?
Agriculture Theme
An important economic driver in Wheatland County and the County of Newell is agriculture; including
the production of a diversity of crops and beef cattle. Forage and silage production support a livestock
industry including feedlot and cow-calf operations. Both counties support high levels of crop production
and diversity due to readily available water from irrigation. Wheatland County is irrigated in the southern
portion by the Western Irrigation District which operated 1,200 km canal system to support various land
uses in the county. County of Newell is also irrigated in the southern portion by the Eastern Irrigation
District. Irrigated crops are dedicated to cereal and corn silage, feed grains and alfalfa hay for livestock.
Non-irrigated crops common in the region include mainly wheat, canola and barley.
Native grasslands play an important role in livestock production, because forage quality on native grasslands is high for
livestock. In addition, natural grasslands are hardy, drought resistant, and evolved as highly adapted to the climate for the past
50 million years. “Ranchers and livestock farmers often have a combination of forage types for grazing, including some natural
grasslands, tame perennial grasslands, annual forages, stubble crop residues, annual crop windrows, and occasionally irrigated
pastures. Some tame perennial grasses, such as crested wheatgrass and smooth bromegrass, can provide quality spring to early
summer pasture” (Bailey, McCartney, and Schellenberg 2010).
An Economic Development Strategy 2016-2019 for Wheatland County noted that “a strong agricultural sector is the backbone of
the local economy, and agricultural land and activity need to be maintained” (Ingenuity Services Consulting 2016). A key concern
for the region is loss and/or fragmentation of agriculture lands due to competing land uses such as energy production and
acreage developments.
24 MIISTAKIS INSTITUTE Least Conflict Lands: Municipal Decision Support Tool for Siting Renewable Energy DevelopmentSTAKEHOLDERS
Model Design Process
Dan Buell
There were 12 participants in the Agriculture Theme Stakeholder group. Prior to the first
Land Administrator, Eastern
Irrigation District workshop, five participants were interviewed (one staff person from each county, a subject
matter expert and representatives from both irrigation districts) to help identify a list of key
Janna Casson agricultural features and concerns. Pre-workshop interviews identified three key agricultural
Agri-Environmental
impacts from renewable energy development for consideration:
Stewardship Specialist, Alberta
Agriculture and Forestry • loss of high value agricultural lands;
Nathan Fontaine • fragmentation of high value agricultural lands; and
Land Supervisor, Eastern
Irrigation District • invasive species (ag-economic concern).
Todd Green In addition, pre-workshop interviews resulted in the development of a preliminary list of
Agricultural Fieldman, County agricultural features which were finalized during workshop 1.
of Newell
• crop production (canola, spring grains, alfalfa and brome);
Wayne Hammergren
Councillor, County of Newell • native grassland/tame pasture;
Chrissy Mills • irrigation infrastructure; and
Land Administrator, Western • irrigation acres.
Irrigation District
Using an on-line survey, theme group participants scored each feature based on its agriculture
Russel Muenchrath
importance to the area using a scoring system ranging from very high (100), high (75), medium
Manager Ag Services,
Wheatland County (50), low (25) and very low (0). The value with the highest percentage of votes was applied to
each feature (table 2). Detailed summary of the survey can be found in appendix 2.
Janet Patriquin
Assistant Farmers’ Advocate,
Farmer’s Advocate Office Table 2: Agriculture features and values
Karen Raven
Land Use Unit Lead, Alberta
Agriculture and Forestry Agriculture Feature Value
Rich Smith
1. Irrigation Infrastructure right of ways and setbacks 100
Executive Director, Alberta
Beef Producers 2. Land Suitability (alfalfa, canola, spring grains and brome)
Alyce Wickert
Manager Planning and
LSRS class 2 (slight limitations to growth) 100
Development, County
LSRS class 3 (moderate limitations to growth) 75
of Newell
Jason Wilson LSRS class 4 (severe limitations to growth) 50
Councillor, ASB Farm
Representative, LSRS class 5 (very severe limitations to growth) 0
Wheatland County
3. Irrigation Acres
IL Class 1 (excellent for irrigated agriculture with no significant limitations) 100
IL Class 2 (good irrigation land with moderate limitations) 100
IL Class 3 (fair for irrigation) 50
IL Class 4 (severe limitations for irrigation, requires special management practices 25
4. Native Grasslands 100
Ecological Importance Score: 100=Very High 75=High 50=Medium 25=Low 0=Very Low
MIISTAKIS INSTITUTE Least Conflict Lands: Municipal Decision Support Tool for Siting Renewable Energy Development 25Each feature was represented spatially using existing datasets. 3. Irrigation Acres (lands currently under irrigation) was
provided by WID and EID. Alberta Agriculture and
1. Irrigation Infrastructure and setbacks were provided
Forestry provided land classes for irrigation (1-5),
by the Western Irrigation District (WID) and Eastern
where 1 is excellent for irrigation and 5 is non-irrigable.
Irrigation District (EID) and include canals, pipelines,
Each land class was given a value based on agriculture
reservoirs, spillways and natural waterways. Setbacks
stakeholder score (table 2). The land classes were then
vary depending on location (tend to be around
equated to lands in irrigation provided by WID and EID.
15-30m) and were provided by Western Irrigation
District. For the Eastern Irrigation District similar 4. Native grasslands play an important role in livestock
setbacks were applied. production. Other forage types were addressed in
the LSRS layer. The native grasslands layer developed
2. Crop productivity was evaluated using the land suitability
using the same methodology as out lined in the
rating system developed by Alberta Soils Inventory
Ecological Theme. Native grassland was identified using
database (AGRSID 4.1) provided by Alberta Agriculture
the Grassland Vegetation Index (GVI) – using native
and Forestry. Stakeholders opted to value all crops of
vegetation upland (where there was 50% herbaceous
equal value (canola, brome (tame pasture), spring seed
veg within a quarter-section). The GVI was updated
grains and alfalfa) as crops are often rotated (note:
in 2009. We extracted human footprint (Alberta
irrigation acres were included as a separate evaluation).
Biodiversity Monitoring Institute 2016) features including
Land suitability polygons (defined area spatially) well pads, well pad roads, unknown clearings, crop, and
for small spring seeded grains, alfalfa, canola and tame pasture from the native grassland footprint. Lastly
brome have assigned LSRS classes. Each polygon has parcel sizes under 155 acres were removed.
a percentage of primary, secondary and sometimes
classes that add up to 100 percent. To produce a crop Details on each feature, including why it is important, supporting
and pasture suitability layer we used the assigned regulations and planning documents are located in appendix 1.
value (very high, high, medium, low and very low) to The agriculture features and their values were used to develop
each class type based on stakeholder feedback. the agriculture model. Each feature layer was overlaid and
Each polygon was scored using the following formula: the highest value was assigned to each polygon. There is
(primary class score assigned by participants * percent of no cumulative value between features. See figure 5 for the
polygon + secondary class score assigned by participants agriculture model methodology.
* percentage of polygon + tertiary class score assigned No new data was developed for this process, and therefore
by participants * percent of polygon). This was re-run the project team was dependent on existing datasets. Maps of
for each type of crop small spring seeded grains, alfalfa, source feature files are displayed in appendix 3.
canola and brome. This resulted in four models, one
for each crop type. Since stakeholders equated all crop
types to be equal, to create the final LSRS model the four
models were overlaid and the highest value was assigned
to the polygon.
26 MIISTAKIS INSTITUTE Least Conflict Lands: Municipal Decision Support Tool for Siting Renewable Energy DevelopmentFigure 5: Model for Agriculture
AGRICULTURE HIGHEST VALUE LANDS
MAX
LSRS crop/tame pasture Irrigation acres: Irrigation Infrastrcuture NP Pasture:
highest value based on four values from and setback: all valued
layers developed below 25 to 100 all valued at 100 at 100
MAX
Canola Alfalfa Spring Seed NP identifed
Brome LSRS Irrigation acres as 50% value
LSRS class LSRS class Grain LSRS
2-4 using layer provided per quarter
2-4 using 2-4 using 2-4 using
primary, by WID and WID setbacks provided in GVI, and
primary, primary, primary,
secondary EID are valued as spatial layer, applied only included
secondary secondary secondary
and tertiary based on similar buffers to EID parcels >160
and tertiary and tertiary and tertiary
percent irrigable classes infrastructure layer acres to
percent percent percent
values * underlying account for
values * values * values *
AG theme the acres. continuous
AG theme AG theme AG theme
stakeholder blocks
stakeholder stakeholder stakeholder
value for
value for value for value for
each class
each class each class each class
LSRS class
Irrigable lands
values by
classes (per
theme
section) values: Irrigation Infrastrcture
stakeholders NP pasture:
Class 1: 100 and setbacks:
Class 2: 100 value 100
Class 2: 100 value 100
Class 3: 75
Class 3: 50
Class 4: 50
Class 4: 25
Class 5-7: 0
CROP/TAME PASTURE IRRIGATION ACRES IRRIGATION INFRASTRUCTURE NATIVE PASTURE
MIISTAKIS INSTITUTE Least Conflict Lands: Municipal Decision Support Tool for Siting Renewable Energy Development 27The agriculture model is displayed in Figure 7. In this model brown represents higher agriculture importance and lighter brown to
beige represent lower agriculture value. Figure 6 represents percentage of land considered very high and high agriculture value for
County of Newell County (66%), Wheatland County (63%) and for the study area (65%). This model is intended for high-level planning
purposes and is not appropriate for parcel level evaluations. In addition, model outputs represent a snap shot in time and are
dependent on resolution and accuracy of the source data used to represent each layer.
Figure 6: Percent of land in high to very high agriculture value
NEWELL WHEATLAND STUDY AREA
66% 63% 65%
1,019,547 ACRES/4,125 KM2 724,352 ACRES/2,931 KM2 1,743,899 ACRES/7,056 KM2
28 MIISTAKIS INSTITUTE Least Conflict Lands: Municipal Decision Support Tool for Siting Renewable Energy DevelopmentPHOTO: SARAH SCHUMACHER
Figure 7: Agriculture Theme Model
MIISTAKIS INSTITUTE Least Conflict Lands: Municipal Decision Support Tool for Siting Renewable Energy Development 29Where are the least conflict lands for renewable energy development
from a culture and scenic resources perspective?
PHOTO: SARAH SCHUMACHER
Culture and Scenic Resources Theme
How people connect to a place depends on their personal value systems which tend to be context
specific and can change over time. These connections to a place may be functional (land provides
food) or may relate to how it makes one feel, which can be difficult to quantify. However, there is
increasing recognition of the importance of less tangible or quantifiable benefits that people derive
from nature (Barendse et al. 2016). A recent attempt to systematically identify scenic resources
for the South Saskatchewan Regional Plan noted scenic resources are an “important element of
recreation and tourism-based economic development, and scenic quality is an important aspect of
quality-of-life” (O2 Planning and Design Inc. 2010).
A key challenge in trying to address this theme is the difference in how people react to renewable energy installations. While
some may like seeing renewable energy development and even see tourism potential, others may see renewable developments
as a negative impact on cultural assets or viewsheds (Barendse et al. 2016).
The Culture and Scenic Resources theme group was tasked with identifying features that are important to the community
(provide a sense of place), such as features of historical significance, recreational areas and /or features where scenic resources
are important.
30 MIISTAKIS INSTITUTE Least Conflict Lands: Municipal Decision Support Tool for Siting Renewable Energy DevelopmentYou can also read