ACCELERATING USE OF RENEWABLE ENERGY BY GREEN TIME OF DAY TARRIF
←
→
Page content transcription
If your browser does not render page correctly, please read the page content below
ACCELERATING USE OF RENEWABLE ENERGY
                  BY GREEN TIME OF DAY TARRIF

DISCLAIMER: The views expressed in this publication do not necessarily reflect the views of the United States Agency for International
Development or the United States Government. It is prepared under the Scaling Up Renewable Energy (SURE) project by Tetra Tech ES, Inc.,
the prime contractor under Contract Number AID-OAA-I-13-00019/AID-OAA-TO-17-00011
ACCELERATING USE OF RENEWABLE ENERGY BY
GREEN TIME OF DAY TARRIF

Prepared for:

        United States Agency for International Development (USAID/India)
        American Embassy
        Shantipath, Chanakyapuri
        New Delhi-110021, India
        Phone: +91-11-24198000

Submitted by:

        Tetra Tech
        A-111 11th Floor, Himalaya House, K.G Marg, Connaught Place
        New Delhi-110001, India
        Phone: +91-11-47374000

USAID TASK ORDER AID-OAA-I-13-00019AID-OAA-TO-17-00011

DISCLAIMER

This report was developed under USAID’s PACE-D 2.0 RE Program – Prime Contractor, Tetra Tech
ES, Inc. and its subcontractor, En-genuity. The views expressed in this publication do not necessarily
reflect the views of the United States Agency for International Development or the United States
Government.
DATA DISCLAIMER

The data, information, and assumptions (hereinafter “data set”) used in this document are in good
faith and from the source to the best of PACE-D 2.0 RE’s (the program’s) knowledge. The program
does not represent or warrant that any data set used will be error free or provide specific results.
The results and the findings are delivered on an "as-is" and "as-available" data set. All data sets
provided are subject to change without notice, and the outcomes, recommendations, and results
may vary. The program disclaims any responsibility for the accuracy or correctness of the data set.
The burden of fitness of the data set lies entirely with the user. In using the data set, data source,
and timelines, the users and the readers of the report further agree to indemnify, defend, and hold
harmless the program and the entities involved for all liability of any nature.

2 | ACCELERATING USE OF RENEWABLE ENERGY BY GREEN TIME OF DAY TARRIF                       USAID.GOV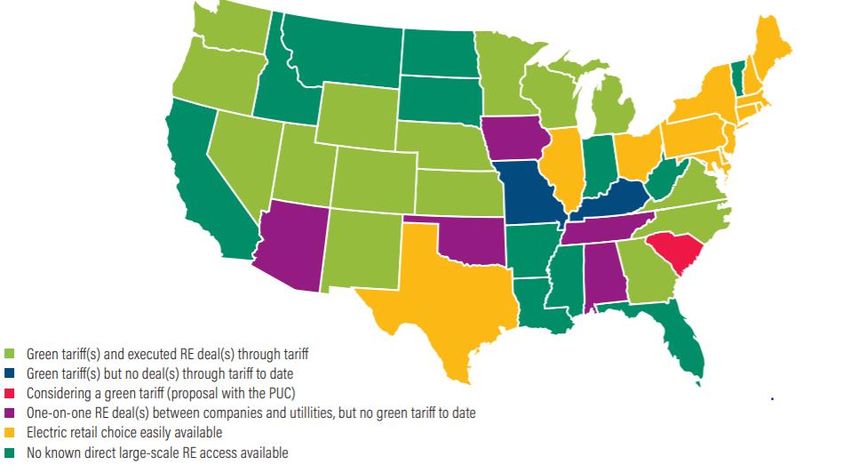
CONTENTS
1.       Introduction ...................................................................................................................................................... 10
     1.1. Projected Impact of RE Targets on the Power Scenario .................................................................... 10
     1.2. Green Time of Day Tariff ........................................................................................................................... 13
2.       Green Tariff: An overview ............................................................................................................................ 15
     2.1. Green TOD-International Experience .................................................................................................... 16
     2.2. Green ToD Application in India ............................................................................................................... 17
         2.2.1. Andhra Pradesh .................................................................................................................................... 17
         2.2.2. Karnataka................................................................................................................................................ 17
         2.2.3. Madhya Pradesh .................................................................................................................................... 17
         2.2.4. Maharashtra ........................................................................................................................................... 17
3.       Estimating shift in Demand due to Green ToD Tariff ............................................................................ 19
     3.1. Experience with ToD .................................................................................................................................. 20
     3.2. Demand Shifting ............................................................................................................................................ 20
         3.2.1. Regulated Load...................................................................................................................................... 20
         3.2.2. Deferrable LOAD ................................................................................................................................ 21
         3.2.3. Adaptable Loads ................................................................................................................................... 21
     3.3. Estimation of Demand Shift ....................................................................................................................... 21
         3.3.1. Agricultural Load .................................................................................................................................. 22
         3.3.2. Industrial Loads ..................................................................................................................................... 22
         3.3.3. Commercial, Railway Traction, and Other Load .......................................................................... 23
         3.3.4. RESIDENTIAL Load ............................................................................................................................. 23
         3.3.5. Water-Pumping Load .......................................................................................................................... 23
     3.4. Summary ......................................................................................................................................................... 24
4.       Estimating Generation of Additional demand due to Green tod......................................................... 25
     4.1. Reduction of Electricity Tariff ................................................................................................................... 25
         4.1.1. Lower Cost Electricity Generated from RE Sources .................................................................. 25
         4.1.2. reducing T&D Losses .......................................................................................................................... 25
         4.1.3. High Electricity Tariff ........................................................................................................................... 25
     4.2. Factors Other Than BAU ........................................................................................................................... 26
         4.2.1. Low Per Capita Consumption........................................................................................................... 26
         4.2.2. Electric Vehicles .................................................................................................................................... 27
         4.2.3. ENERGY SUBSTITUTION................................................................................................................. 27
         4.2.4. INDUSTRIAL CUSTOMER ................................................................................................................ 27
         4.2.5. ELECTRIC COOKING ....................................................................................................................... 28

3 | ACCELERATING USE OF RENEWABLE ENERGY BY GREEN TIME OF DAY TARRIF                                                                                      USAID.GOV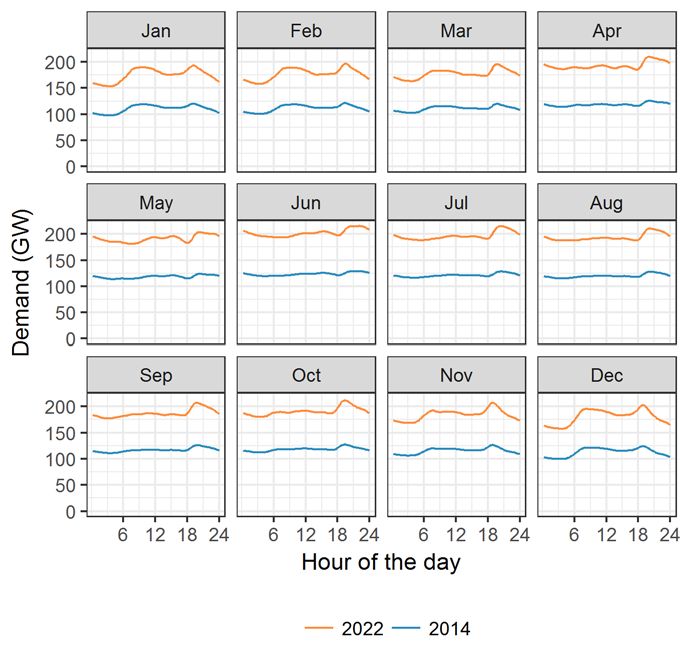
4.2.6. Energy Storage Systems (ESS) ........................................................................................................... 28
     4.3. Demand Generation VERSUS Tariff ........................................................................................................ 29
5.       Case Studies...................................................................................................................................................... 31
     5.1. Case Study – Assam .................................................................................................................................... 31
         5.1.1. Demand Supply Scenario in Assam .................................................................................................. 31
         5.1.2. Power Surplus in Assam ..................................................................................................................... 32
         5.1.3. Green ToD for APDCL ...................................................................................................................... 33
         5.1.4. Gains from Green ToD for APDCL ................................................................................................ 33
     5.2. Jharkhand ........................................................................................................................................................ 33
         5.2.1. Demand and Supply Scenario ............................................................................................................ 33
         5.2.2. Impact of Solar and Increase in Daytime Demand on the Cost of Procurement ................. 34
         5.2.3. Impact of Green ToD on the Revenue and Net Gains ............................................................... 35
     5.3. Experience of Maharashtra, Rajasthan, and Madhya Pradesh for Demand Generation by Tariff
     Incentive ................................................................................................................................................................. 35
         5.3.1. Impact of Incentive Schemes ............................................................................................................. 36
6.       Design and Implementation of Green ToD .............................................................................................. 37
     6.1. Design of Green ToD ................................................................................................................................. 37
     6.2. Implementation ............................................................................................................................................. 37

List of Tables
Table 1.1 Existing and Upcoming Generation Sources ......................................................................... 10
Table 1.2. Impact of higher RE on thermal power plant operations and DISCOM costs ................... 13
Table 3.1. All-India Electricity Consumption for Various Customer Categories ................................. 21
Table 3.2. Summary of Demand Shift by Green ToD .......................................................................... 24
Table 4.1 Potential of Demand Generation .......................................................................................... 30
Table 5.1. Sources of Electricity for APDCL ........................................................................................ 31
Table 5.2. Existing and Upcoming Supply Sources with Costs ............................................................. 34
Table 5.3. Profit to JBVNL with Ten Percent Demand Increase and Five Percent Demand Shift ....... 35
Table 5.4. Applicability, Eligibility, and Incentives for Demand Generation ......................................... 36

List of Figures
Figure 1.1 Typical Demand Curve for India ........................................................................................... 10
Figure 1.2. National average daily load profiles for each month in 2014 and 2022 ............................. 11
Figure 1.3. Average hourly net load in 2022......................................................................................... 12
Figure 1.4. Simulated maximum net load for October 21, 2022 .......................................................... 12
Figure 2.1. Utility renewable energy deals in the United States........................................................... 16

4 | ACCELERATING USE OF RENEWABLE ENERGY BY GREEN TIME OF DAY TARRIF                                                                                          USAID.GOV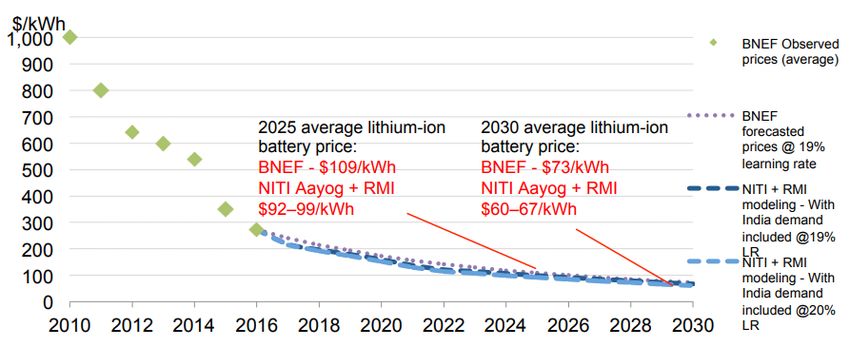
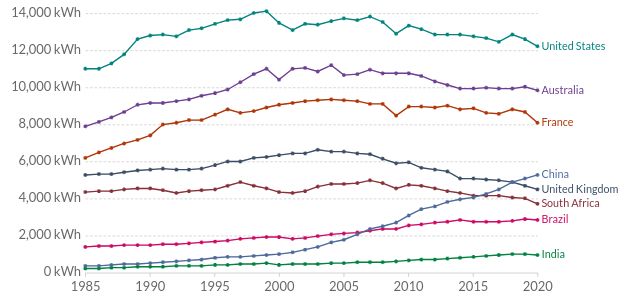
Figure 3.1. Demand curve for all of India .................................................................................................
Figure 3.2. Load curve of Karnataka before and after shifting agricultural load ......................................
Figure 4.1. Residential electricity prices in selected economies, 2018................................................. 26
Figure 4.2. Country-wide per capita electricity consumption .............................................................. 27
Figure 4.3. Projected decline in lithium-ion battery cost ..................................................................... 29
Figure 5.1. Annual average hourly load curve, 2019............................................................................. 31
Figure 5.2. Hourly exports to IEX ........................................................................................................ 32
Figure 5.3. Average diurnal variation of JBVNL demand ...................................................................... 33
Figure 5.4. Average hourly export/import in 2019............................................................................... 34

5 | ACCELERATING USE OF RENEWABLE ENERGY BY GREEN TIME OF DAY TARRIF                                                        USAID.GOV
ACRONYMS

 AERC              Assam Electricity Regulatory Commission
 APDCL             Assam Power Distribution Company Limited
 APEPDCL           Andhra Pradesh Eastern Power Distribution Company Limited
 ARR               Aggregate Revenue Requirement
 AT&C              Aggregate Technical and Commercial losses
 BERC              Bihar State Electricity Regulatory Commission
 CEA               Central Electricity Authority
 C&I               Commercial and Industrial
 CAPEX             Capital Expenditure
 DGVCL             Dakshin Gujarat Vij Company Limited
 DHBVNL            Dakshin Haryana Bijli Vitran Nigam Limited
 DISCOMs           Distribution Companies
 DPV               Distributed Solar Photo Voltaic Rooftop
 EESL              Energy Efficiency Services Limited
 EPC               Engineering, Procurement and Construction
 FIT               Feed-in Tariff
 GERC              Gujarat Electricity Regulatory Commission
 GoI               Government of India
 GW                Gigawatts
 HERC              Haryana State Electricity Regulatory Commission
 IEX               Power Exchange
 INR               Indian Rupees
 INR Cr            Indian Rupees Crore (10 million rupees)
 JBVNL             Jharkhand Bijli Vitran Nigam Limited
 JSERC             Jharkhand State Electricity Regulatory Commissions
 KSEB              Kerala State Electricity Board Limited
 kvAh              Kilovolt Ampere Hour
 kWh               Kilowatt Hour
 kWp               Kilowatt Peak
 LED               Light Emitting Diode
 LPC               Low-Paying Customer
 LT                Low Tension

6 | ACCELERATING USE OF RENEWABLE ENERGY BY GREEN TIME OF DAY TARRIF       USAID.GOV
MGVCL             Madhya Gujarat Vij Company Limited
 MUs               Million Units
 MW                Megawatt
 NBPDCL            North Bihar Power Distribution Company Limited
 NDC               Nationally Determined Contribution
 NSM               National Solar Mission
 PACE-D            Partnership to Advance Clean Energy – Deployment
 PACE-D 2.0 RE     Partnership to Advance Clean Energy – Deployment, Second phase
 PFC               Power Finance Corporation
 PGVCL             Paschim Gujarat Vij Company Limited
 PLF               Plant Load Factors
 PPA               Power Purchase Agreement
 PPP               Public-Private Partnership
 PV                Photo Voltaic
 RE                Renewable Energy
 RECs              Renewable Energy Certificates
 RESCOs            Renewable Energy Service Companies
 RPO               Renewable Power Purchase Obligation
 SBPDCL            South Bihar Power Distribution Company Limited
 SERCs             State Electricity Regulatory Commissions
 SOURA             SOURA Natural Energy Solutions India
 SPVRT             Solar Photo Voltic Rooftop
 T&C               Technical and Commercial
 T&D               Transmission and Distribution
 TPL               Torrent Power Limited
 UGVCL             Uttar Gujarat Vij Company Limited
 UHBVNL            Uttar Haryana Bijli Vitran Nigam
 UJALA             Unnat Jyoti by Affordable LEDs for All
 USAID             United States International Development Agency
 WBERC             West Bengal Electricity Regulatory Commission
 WBSEDCL           West Bengal State Electricity Distribution Company Limited

7 | ACCELERATING USE OF RENEWABLE ENERGY BY GREEN TIME OF DAY TARRIF            USAID.GOV
ACKNOWLEDGEMENTS
This white paper on green time-of-day (ToD) tariffs was prepared under the Partnership to Advance
Clean Energy-Deployment (PACE-D 2.0 RE) Technical Assistance Program, funded by the United
States Agency for International Development (USAID). The authors thank Anurag Mishra, Senior
Energy Team Leader, USAID/India, for all the support and vision. The PACE-D 2.0 RE team expresses
its sincere appreciation to Dr. Himanshu Jain, Asst. Professor, Indian Institute of Technology, Roorkee
(IIT – R) for his time and willingness to share his ideas and for reviewing this white paper.
This paper is the result of a comprehensive study carried out by the PACE-D 2.0 RE team, comprised
of experts from Tetra Tech and En-genuity. Program also wish to thank our partner states Assam and
Jharkhand for their valuable insights and contributions throughout the course.
The team is grateful for the overall guidance provided by the Ministry of New and Renewable Energy
(MNRE) and its valuable support to the program.
Program also wish to thank our authors for their detailed inputs, ideas, and knowledge:
Dr. Rakesh Kumar Goyal, Team Leader
Mr. Ranjit Chandra, Energy Expert
Mr. Prodyut Mukherjee, Energy Expert
Ms. Devina Anand, Research Associate
Mr. Ronnie Khanna, Ex- Module Lead

8 | ACCELERATING USE OF RENEWABLE ENERGY BY GREEN TIME OF DAY TARRIF                      USAID.GOV
EXECUTIVE SUMMARY
As the penetration of low-cost renewable energy (RE) increases in India, most distribution companies
(DISCOM) face surplus power during some period of the day. To cope, they operate thermal power
plants at low plant load factors (PLF) and/or sell power to power exchanges (IEX) at minimal
profit/loss. Several efforts are underway on the supply side to accommodate higher RE. Some of these
include (1) thermal machines operating economically at low PLF, (2) faster ramping rates, and (3)
decreasing storage costs. This paper suggests a novel demand-side approach that shifts existing demand
and generates additional demand during the surplus power period due to RE.
DISCOMs should examine the period of the day when:
        Variable cost of the surplus thermal power/Surplus RE power + Transmission and distribution
        (T&D) losses < Normal tariff.
When this equation holds true, there is a good case for a green time-of-day (ToD) tariff. Accordingly,
the green ToD tariff is the tariff that is lower than the normal tariff and applicable for additional demand
that is generated in a specified period compared to previous year demand in the same period and
helps in demand shift. The USAID PACE-D 2.0 RE program conducted this analysis for Assam Power
Distribution Company Limited (APDCL) and Jharkhand Bijli Vitran Nigam Limited (JBVNL) and found
that APDCL, by introducing the green ToD tariff of one Indian rupee/kilowatt hour (kWh) lower than
the normal tariff, can make an annual profit of INR 29.71 crore with a modest additional demand
generation of 6.6 percent from the previous year. Applying the same green ToD tariff, JBVNL can earn
an annual profit of INR 42 crore by generating an additional demand of only 3.2 percent.
Encouraged by the results of the analysis of APDCL and JBVNL, the program attempted to examine
the scenario at the national level. The above-mentioned equation cannot be used for national-level
analysis because of different variable costs, tariffs, variations in T&D losses, and different time periods
of surplus power across India. Therefore, to determine the demand shift, the program used India’s
past experience with ToD tariffs and price elasticity of electricity for demand generation. The team
found that keeping green ToD tariffs ten percent lower than normal tariffs should shift the demand by
4 percent and generate an additional demand of 0.2 percent in the short term and 0.6 percent in the
long term. The national analysis is more empirical, and there are not yet many published results
available on ToD tariffs and price elasticity of electricity. The results will get refined and improved in
the near future.
Each DISCOM should carry out an analysis on using surplus power to increase their business and
contribute to the state economy by increasing per capita consumption of electricity. To facilitate the
analysis, the PACE-D 2.0 RE program has developed the Excel-based Green ToD Tool and suggested
a methodology for designing green ToD tariffs. However, determining green ToD should be dynamic
process as it is sensitive to availability of the demand and supply. The green ToD should be reviewed
every year.
The biggest challenge in the implementation of the green ToD tariff lies in identification of the base
line, or previous year’s consumption and deployment of ToD meters green ToD is recommended for
additional demand only in the surplus period. To facilitate easy implementation, several examples for
various situations with and without the availability of ToD meter and consumption data are provided.
To further support the DISCOMs, the program organized a one-day capacity-building course on green
ToD with the Indian Institute of technology (IIT) Roorkee in April 2021. More than one hundred
professionals participated, and IIT Roorkee expressed interest in conducting a similar course sometime
in the next six months.

9 | ACCELERATING USE OF RENEWABLE ENERGY BY GREEN TIME OF DAY TARRIF                           USAID.GOV
1. INTRODUCTION
India has emerged as one of the leaders in the transition from fossil fuel–based energy sources to clean
energy sources. The country has “enhanced its installed renewable capacity by 2.5 times and increased
installed solar capacity by more than 13 times in the last six years,”1 as mentioned by India’s Prime
Minister Narendra Modi.
India’s nationally determined contributions (NDCs) under the Paris Agreement are to achieve a 40
percent share of non-fossil-fuel-based sources in its installed energy capacity by the year 2030. After
the Paris commitment, India set the target of 175 gigawatts (GW) (primarily 100 GW solar and 60
GW of wind) of RE capacity by 2022.
Table 1 provides the existing generation capacity from various sources as of January 31, 2021, and
the expected generation capacity in the target year.
Table 1.1 Existing and Upcoming Generation Sources
Source January 31, 2021 Expected in FY 2021-2022
Installed % of Total Installed Capacity % of Total
Capacity (GW) Installed (GW) Installed
Capacity Capacity
Thermal 231.87 61.46% 257.5 52.7%
Nuclear 6.78 1.80% 7.9 1.6%
Hydro 46.06 12.21% 59 12%
Renewable Energy 92.55 24.53% 160 32.7%
Sources
Total 377.26 488.1
Source: Central Electricity Authority. The data can be accessed at https://cea.nic.in/wp-
ontent/uploads/installed/2021/01/installed_capacity.pdf
1.1. PROJECTED IMPACT OF RE TARGETS ON THE POWER SCENARIO
The demand curve in most states in India is flat during the day. Generally, it has two peaks, one in the
morning and the other in the evening (Figure 1).
Figure 1.1 Typical Demand Curve for India
Source: NLDC, IEEFA
1
PV Magazine, January 5, 2021
10 | ACCELERATING USE OF RENEWABLE ENERGY BY GREEN TIME OF DAY TARRIF USAID.GOVThe national monthly load profile for 2014 and projected national monthly load profile for 20222 for
all months are presented in Figure 2. The figure indicates that in 2022 the ratio between peak demand
and average demand will be higher compared to the same ratio in 2014, and the higher RE generation
(100 GW solar) will come during the daytime. The variability in demand, especially during the day, is
largely met by coal-based power plants. To cater to the variability, thermal power plants operate at
varying PLFs.
Source: www.greeningthegrid.org
Figure 1.2. National average daily load profiles for each month in 2014 and 2022
However, solar PV generation is available only during the day and follows a generation pattern that
resembles a bell curve. Wind generation is available mostly at night. In India RE has a “must run” status,
which means the generation from RE sources is used first to meet the load. Under USAID’s Greening
the Grid program, an analysis was conducted to evaluate the operation of India’s power grid with 175
GW of RE. Figure 1.3 shows the net load curve, i.e., total load minus RE (100 GW solar and 60 GW
wind), in 2020.
2
Source: GTG Report
11 | ACCELERATING USE OF RENEWABLE ENERGY BY GREEN TIME OF DAY TARRIF USAID.GOVSource: www.greeningthegrid.org
Figure 1.3. Average hourly net load in 2022
The study further found that this load curve will require changing the minimum generation levels of all
coal plants from 70 percent of their rated capacities to 55 percent.3 Still, about 1.4 percent of RE
generation will be curtailed (Figure 4).
Source: www.greeningthegrid.org
Figure 1.4. Simulated maximum net load for October 21, 2022
3
CERC regulation specifies the minimum PLF for coal plants as 55 percent.
12 | ACCELERATING USE OF RENEWABLE ENERGY BY GREEN TIME OF DAY TARRIF USAID.GOVIncreasing RE penetration affects the operations of thermal power plants, which in turn affects the
finances of the DISCOMs and subsequently increases the cost of supply as shown in Table 2.
Table 1.2. Impact of higher RE on thermal power plant operations and DISCOM costs
Impact of increasing RE penetration on Impact on DISCOM costs
operations of thermal power plants
Decrease in thermal generation Per unit cost of generation increases with decrease
in the PLF of thermal plant. Thermal generators will
recover this increased cost from DISCOMs
Meeting technical minimum generation from thermal DISCOMs would need to purchase surplus power
power plants from thermal power plants to meet technical
minimum criterion and sell it to IEX at a lower
price. 4
Frequent reserve shut down To balance the grid, thermal power plants would be
shut down more frequently. Shutting down and
restarting the thermal power plants involves cost
and reduces the life of the power plant.
Fixed charges
Several measures are being planned on the supply side to meet the variability and dispatchability of the
175 GW of RE. These measures include enhancing the flexibility of thermal machines; retiring
inefficient thermal machines; increasing ramp-up and ramp-down rates, storage, and demand response;
and enlarging geographical and electrical balancing areas.
However, the issue has been less analysed from the demand side of the equation. This paper analyses
the scenario from the demand side and suggests measures to gainfully utilize RE generation that is
likely to be curtailed and to run thermal power plants at a PLF greater than 55 percent. This approach
has the inherent benefit of strengthening DISCOMs, which are in crisis due to poor financial health
and the loss of their high-paying customers as a result of open access and captive generation.
The marginal generation cost of the plant operating at between 55 and 100 percent PLF and the
curtailed RE cost are significantly lower than the average generation cost. This low-cost generation
should be utilized by DISCOMs to increase sales, which is their core business. As more solar power
is added to the grid, the day price on the Indian exchange will go down, which means DISCOMs will
not have the option to sell excess power to the exchange. For example, in 2019-2020, Assam sold
about 1,300 mega units (MU) of power to IEX at a loss of INR 0.06/kWh.
1.2. GREEN TIME OF DAY TARIFF
The PACE-D 2.0 RE program proposes the green time-of-day tariff as a demand-side solution for
absorbing the higher RE penetration in a cost-effective manner. One of the merits of the proposed
solution is a short gestation period for design and implementation. Under the green ToD tariff
structure, DISCOMs will provide a rebate to customers for the incremental electricity consumption
during the period with high RE generation or for shifting the demand from peak time to non-peak
hours. Such rebates have the potential to increase demand, which will improve the utilization of
thermal power plants and thus reduce the cost of generation by improving PLFs; reduce restarts of
4
From GREENING THE GRID: Pathways to Integrate 175 Gigawatts of Renewable Energy into India’s Electric Grid, Vol.
I—National Study EXECUTIVE SUMMARY, “Changing minimum generation levels of all coal plants, from 70% today to 55%
of rated capacity (consistent with the CERC regulations) reduces RE curtailment from 3.5% to 1.4% and annual operating
cost by 0.9%, or INR 2000 crore. Reducing minimum generation levels further, to 40%, reduces RE curtailment to 0.76%,
with negligible decreases to annual operating costs.”
13 | ACCELERATING USE OF RENEWABLE ENERGY BY GREEN TIME OF DAY TARRIF USAID.GOVthe plants; reduce need for running plants at technical minimum; and increased utilization of the fixed
costs of the thermal plants.
Green ToD tariffs provide gains to all the stakeholders:
1. Thermal Generators – Increased daytime demand can improve the PLFs and reduce the
variability in the generation pattern, which can increase the revenue from catering to increased
demand and cost of generation.
2. RE Generators – Increased demand can provide enough capacity for the grid to absorb
more RE and thus reduce the need for curtailment. A decrease in curtailment will increase
the revenue of the RE generators.
3. DISCOMs – Increased daytime demand can help flatten the load profile, allowing DISCOMs
to absorb more power at a lower cost. Adding new demand will increase the business and
profitability of the DISCOM.
4. Customers – With the rebate for incremental consumption, customers can consume more
electricity by adding new appliances and substituting other energy sources for electricity. This
can reduce their average cost of energy.
The paper suggests several demand-side interventions such as demand generation, demand shift,
electrical vehicle charging, storage before and after the meter, change in retail tariff design, and smart
devices to remotely control the operation of electric home appliances, water pumps, etc. The focus
will be on two main suggestions: demand shift and demand enhancement by the green ToD tariff. The
paper commences with a brief overview of the green tariff, as originally conceptualized, and how a few
states in India have adopted it in their tariff order as of March 2021. Subsequent chapters discuss case
studies on designing and implementing green ToD for Assam and Jharkhand. There is also a brief
description of various incentives provided by states such as Maharashtra, Madhya Pradesh, and
Rajasthan to increase the demand. Finally, the paper lists the key steps DISCOMs should follow in
designing and implementing green ToD tariffs.
14 | ACCELERATING USE OF RENEWABLE ENERGY BY GREEN TIME OF DAY TARRIF USAID.GOV2. GREEN TARIFF: AN OVERVIEW
Customers—from residential customers to large industrial ones—are increasingly procuring
renewable energy in an effort to reduce their electricity bills and avoid fuel price unpredictability.
Rising demand for RE is motivated by two factors—increasing pressure from customers, shareholders,
and employees for companies to achieve their sustainability targets and falling RE prices, which enable
customers to reduce their electricity costs and long-term electricity risks.5 Globally, the following
mechanisms have been adopted for RE procurement:
• Renewable Energy Certificates (RECs) – RECs are tradable certificates that represent the
environmental attributes of energy generated from RE sources. In India, RECs are used to achieve
the renewable purchase obligation (RPO) targets directed by various state electricity regulatory
commissions to large electricity customers.
• Power Purchase Agreements (PPAs) – PPAs are agreements signed between two parties, in
which one party purchases electricity produced by the second party at a specific tariff, subject to
terms and conditions.
• Virtual Power Purchase Agreements – In these agreements, the RE generator sells electricity
to the grid at a market price but passes on the RECs to the customer in exchange for the price
differential between the market price and a prefixed hedge price.6
One of the emerging RE procurement options for commercial and What Are Green Tariffs?
industrial (C&I) customers is the green tariff. Under a green tariff
arrangement, customers typically enter into a long-term agreement Green tariffs are tariff structures
offered by utilities that allow large
to purchase RE power provided by the utility and usually generated commercial and industrial
by a specific resource.7 The large customer pays the utility and customers to buy bundled
benefits from the cost savings that accumulate. The utility acts as renewable electricity from a
an intermediary between the electricity customer and the RE specific project through a special
utility tariff rate or a premium. This
generator. The arrangement involves the utility procuring RE from
provides these larger energy
the RE generator on behalf of the customer, who in turn pays a customers an option to meet their
utility green tariff rate for the RE service.8 sustainability and renewable energy
goals, reduce long-term energy
Traditional utilities seeking to compete in the changing electricity risks, and demonstrate
marketplace are exploring green tariffs. Building on their commitment to the development
longstanding capabilities, they may be able to offer many of the of new renewable energy projects.
features customers are looking for in renewable energy, along with
greater elasticity and lower transaction costs than those offered by
third parties.
Making the green tariff voluntary gives customers the choice to opt for green energy. The extra charges
for the procurement of renewable energy being charged to specific customers would not increase the
cost borne by other customers. In addition, this would also reduce hesitation on the part of DISCOMs
going for the high cost of power purchase from renewable sources, as it will not affect the general
tariff.
Green tariffs have emerged globally as an attractive option for corporate sourcing for a wide variety
of reasons. First, customers can source up to 100 percent of their electricity from renewable sources.9
Second, customers can save on upfront capital investment, and subsequent operations and
5 Barua 2017; Dingenen et al. 2018.
6 EPA 2016
7 Barua 2017; IRENA 2018
8 Bird et al. 2017
9 IRENA 2018
15 | ACCELERATING USE OF RENEWABLE ENERGY BY GREEN TIME OF DAY TARRIF USAID.GOVmaintenance costs, through green tariffs. Through green tariffs, the customer can diversify its power sources without the costs associated with managing an RE project. The cost of identifying a third-party producer can also be mitigated by approaching the local utility to enter into a green tariff arrangement. Third, considering that both solar and wind energy are cost competitive, long-term contracting for purchasing RE at a fixed or predictable price, through green tariffs, is an attractive option. Last but not least, the green tariff is an opportunity for the utility to prevent the loss of large C&I customers to cheaper RE, aid in meeting regulatory targets for renewable energy supply, and attract new customers. 2.1. GREEN TOD-INTERNATIONAL EXPERIENCE A review of the literature indicates that green tariffs are being used by large customers in Australia, China, the United States, United Kingdom, and many European countries. In the United States, as of November 2019, as many as 31 green tariffs were approved or awaiting approval in 18 U.S. states (Figure 5). Source: Bonugli 2019. Figure 2.1. Utility renewable energy deals in the United States Across Europe, RE electricity sources are generally accessible to residential customers and small-scale commercial customers. As of 2018, C&I green tariff deals have been reported across the United Kingdom, Spain, Germany, Sweden, Italy, Switzerland, and the Netherlands.10 In the United Kingdom, many retailers provide a green tariff option offering up to 100 percent of electricity from renewable generation. In Australia, GreenPower is the Australian government’s voluntary accredited program that enables customers to purchase RE in the retail electricity market. The program allows accredited energy providers to sell GreenPower products and thereby grant a customer large-scale generation certificates (LGCs) to ensure certain increments of RE in relation to a customer’s monthly electricity consumption. 10 IRENA 2018 16 | ACCELERATING USE OF RENEWABLE ENERGY BY GREEN TIME OF DAY TARRIF USAID.GOV
2.2. GREEN TOD APPLICATION IN INDIA
In India, DISCOMs have been mandated to meet RPOs under the Electricity Act 2003 and the National
Tariff Policy of 2006. Although some Indian corporations are increasingly looking to set sustainability
goals for their electricity procurement, India has seen limited experimentation with green tariffs,
namely‚ in the states of Karnataka and Andhra Pradesh.
2.2.1. ANDHRA PRADESH
In 2008-2009, for the first time, Andhra Pradesh announced an optional green power tariff for C&I
customers at a premium price of INR 6.7/kWh.11 In their 2017-2018 tariff order, this category was
detached by quoting the absence of sales since commencement. However, a petition was filed in 2016-
17 by customers who had subscribed to this tariff category. In response, Andhra Pradesh Electricity
Regulatory Commission (APERC) reintroduced the “HT Category VII-Green Power” tariff category
in 2018-2019 for HT customers “who wish to avail power from Non-conventional sources of energy
voluntarily and show their support to an environmental cause.”12 At INR 11.32 per kilovolt Ampere
hour (kVAh), subscription to this tariff category is elective and entitles the subscribing HT customers
to RECs as well. There is no constraint on the end use of this green energy, and no monthly minimum
charges are imposed under this category. This has been sustained in the tariff order dated February
10, 2020.
2.2.2. KARNATAKA
Starting December 2010, HT customers of Karnataka could opt for green power directly from the
utility by paying a premium of INR 1/kWh on their existing grid tariff (power thus procured would be
over and above their RPO), which was called a green tariff.13 In its petition requesting the green tariff,
Bangalore Electricity Supply Company Ltd. (BESCOM) specified that “there is [a] group of customers
who want to purchase power from green sources and would not mind paying more for such power.”
This tariff was changed to INR 0.50/kWh by Karnataka Electricity Regulatory Commission (KERC) in
2013 and was sustained in the most recent order on May 30, 2019.
2.2.3. MADHYA PRADESH
The Madhya Pradesh State Action Plan on Climate Change (MP SAPCC) states the intention to
structure green tariffs to incentivize the production of clean energy, per a 2013 directive from the
Government of Madhya Pradesh.
Andhra Pradesh and Karnataka both seem to have witnessed partial success in green tariff adoption.14
In both states‚ the green tariffs are simple premium pricing models based on surplus RE with the
utilities. Very low uptake of the green tariffs in these states may have prevented the evolution of more
sophisticated green tariffs in India.
2.2.4. MAHARASHTRA
However, in a recent order in 2021, the Maharashtra Electricity Regulatory Commission (MERC)
allowed a green power tariff for customers opting for 100 percent green energy. All customers
including extra high voltage, high voltage, and low voltage, are eligible to choose 100 percent RE power
with payment of the green power tariff. Per the order, the green power tariff of INR 0.66/kWh, which
is higher than the normal tariff of the respective category for tariff orders, will be levied on such
customers.

11 IDFC 2010
12 APERC 2018
13 KERC 2010
14 Andhra Pradesh and Karnataka seem to have only one single consumer of green tariff. The experiments of two Indian

states (Andhra Pradesh and Karnataka) with green tariffs have been largely ad hoc in nature than structured green tariffs
involving a long-term contract. General perception as mentioned in sources states that the uptake has been poor in both
states due to the premium charged on top of already high industrial/commercial tariffs.

17 | ACCELERATING USE OF RENEWABLE ENERGY BY GREEN TIME OF DAY TARRIF                                         USAID.GOV
The Tata Power Company Limited (Distribution) (TPC-D) filed a petition seeking approval for the
green power tariff for supply of RE to customers to meet the requirement to utilize 100 percent green
energy for their entire demand. MERC found the petition helpful to increase awareness amongst the
customers about the use of renewable energy. The state regulator observed that computing the cost
of the green power tariff based on the average cost of renewable energy sources was the correct
approach. MERC ruled that the tariff would be uniform for all DISCOMs in the state.
Although some large customers are increasingly looking to set sustainability goals, India has seen
limited experimentation with green tariffs. Creating the appropriate regulatory environment may
incentivize the uptake of utility-based green tariffs. The industry needs best practices to foster a
friendly environment, such as improved planning and forecasting mechanisms to better assess demand
and supply; consideration of cross-subsidy structures when formulating new tariffs for customers;
specification of electricity needs of large customer categories to produce exact tariffs; consultation
with regulators to ensure that other customer categories are not unfairly burdened; and transparent
promotion of relevant information. This report will inform future efforts to formulate green tariffs in
India. A central, consultative approach is needed to ensure that these tariffs result in a win-win
situation for all stakeholders.

18 | ACCELERATING USE OF RENEWABLE ENERGY BY GREEN TIME OF DAY TARRIF                      USAID.GOV
3. ESTIMATING SHIFT IN DEMAND DUE TO GREEN TOD
        TARIFF

Adding 100 GW of solar to the grid by 2022 will lead to surplus power generation during the day
(Figure 6), resulting in thermal backing,15 because RE has a must-run status. Since most DISCOMs have
long-term contracts with thermal generators, they will pay the fixed charges for the backed power.
Therefore, it is beneficial for the DISCOM to sell this surplus power during the day at a rate higher
than variable charges and losses due to transmission and distribution (T&D) of the thermal power
generation. Many DISCOMs purchase power during the evening from the power exchange to meet
their demand at a rate higher than the rate of thermal power generation (fixed plus variable).
Therefore, shifting some demand from evening to daytime will
       1. Reduce costly purchases from the IEX. Reduction in power purchase from IEX will make
          the DISCOM’s power portfolio more stable in terms of price (IEX price volatility avoided)
          and secure.
       2. DISCOMs will be able to make a profit by selling power at a rate much higher than the
          variable cost of thermal generation.
       3. DISCOMs will be able to draw higher power from thermal power plants, eliminating
          the risk of paying the minimum commitment charges to thermal generators, provided the
          demand shifted is higher than the surplus RE power.
       4. Thermal power plants will operate more economically at higher PLF.

The time-of-day tariff is an important tool for shifting demand from peak time to solar time (daytime)
This tariff is already in use in most states of India for industrial and commercial customers, where it is
used in the opposite way—the evening tariff is higher than the daytime tariff, which has a standard
rate. The green TOD tariff the program proposes would reduce the standard tariff during the day
since the DISCOMs’ cost of power purchase is low.
Figure 6 represents the demand curve of India for FY 2018-2019. Demand for power is the lowest in
the early morning hours and gradually increases as the day progresses, stabilizing in the 140 to 145
GW range during the day. Again, as evening approaches, it falls a little and then again picks up to reach
its peak, at around 7:45 p.m. The daytime demand falls within the solar generation hours—8 a.m. to 4
p.m., and some of the evening load can be shifted to this time period. The difference in demand
between the peak and valley times is about 8 to 10 GW. A reduced tariff in the form of a green ToD
tariff can encourage customers to shift some of their electricity use to daytime hours when supply is
greater, and the cost is cheaper.

15
     Thermal backing is exercised when the load of thermal power plants is reduced due to lower demand.

19 | ACCELERATING USE OF RENEWABLE ENERGY BY GREEN TIME OF DAY TARRIF                             USAID.GOV
Shifting of evening
demand
hours
Solar generation
Peak
hours
Source: Energy statistics 2019, Central Statistics Office, Ministry of Statistics and Programme Implementation,
Government of India
Figure 3.1. Demand curve for all of India
3.1. EXPERIENCE WITH TOD
The ToD tariff is not a new concept and has been used in almost parts of India. A good summary
presentation was made by Prof. Himanshu Jain from IIT Roorkee in a one-day capacity-building
program on green ToD, conducted jointly by PACE-D 2.0 RE and IIT Roorkee. The full presentation
is available at www.pace-d.com while the key lessons from the existing ToD programs are mentioned
below:
1. Mainly industrial and commercial customers participate. Limited residential customers can be
encouraged to participate by promoting smart devices to control their home appliances
remotely.
2. Price differential has significant impact on demand shift.
3. Smart metering and advance metering infrastructure (AMI) are critical.
4. Understanding customer behavior, reaching out to them, engaging with them, and making the
ToD program easier for them to understand are critical.
5. ToD tariffs have shown the potential for peak demand reduction but relatively modest energy
and customer bill savings in developed countries.
3.2. DEMAND SHIFTING
To examine the possibility of demand shifting, the program needs to understand load requirements.
For this, load can be classified into following three categories:
3.2.1. REGULATED LOAD
This load comprises a power supply that is regulated by the DISCOM to certain times of the day and
for certain purposes, such as an agricultural load. Such loads can be easily shifted by the DISCOMs to
the hours when there is surplus or low-cost power. Customers of these loads are accustomed to
regulated electricity supply, so changing their usage patterns is expected to be smooth.
20 | ACCELERATING USE OF RENEWABLE ENERGY BY GREEN TIME OF DAY TARRIF USAID.GOV3.2.2. DEFERRABLE LOAD
A deferrable load is an electrical load that requires a certain amount of energy within a given time
period, but the exact timing is not important; it can wait until power is available. Such loads just need
to maintain their operating cycle and their starting time can be changed. Customers can shift their
load easily to take advantage of the green ToD. One such example is a municipal water-pumping load.
3.2.3. ADAPTABLE LOADS
Certain customers, especially large industrial ones, can shift their operations, or some of their loads,
to hours when the electricity tariff is lower. Such loads are called adaptable loads. Large industrial
customers are already under existing ToD regimes and benefit by avoiding higher electricity tariffs in
the evening. The green ToD tariff will further encourage them to examine and shift operations and/or
load to take advantage of the lower tariff.
3.3. ESTIMATION OF DEMAND SHIFT
The electricity consumption of various categories of customers in FY 2017-2018 is provided in Table
3. Our observations and estimation of possible demand shift for each of the customer categories are
discussed next.
Table 3.1. All-India Electricity Consumption for Various Customer Categories
Customer Consumption % Share of
Categories (GWh) Consumption
Industry 468,825 41.48%
Agriculture 204,348 18.08%
Residential 273,519 24.20%
Commercial 96,184 8.51%
Traction & Railways 14,354 1.27%
Others 73,014 6.46%
Total 1,130,244 100.00%
Source: Energy statistics 2019, Central Statistics Office, Ministry of Statistics and Programme Implementation, Government of India
Estimating the shift in demand because of the tariff differential is a complex exercise and primarily
depends on two fundamental parameters:
1) Price differential between current tariff and ToD tariff, and
2) Cost for shifting the load, which can be financial costs or intangible costs resulting from
changes in behavior that occur to shift the load.
Other parameters involved in estimating demand shift are percentage of electricity expenditure in the
total budget, whether household or commercial, publicity by the DISCOM, metering infrastructure,
and simplicity of the procedure customer follows to opt in and opt out. Surveying each customer
category and class can be helpful, but initial surveys may require refinement over a period of time to
produce accurate results. Thus, conducting surveys was considered beyond the scope of this paper.
Instead, the program calculated rough estimates for possible demand shifts for each customer category
on an empirical basis, with an assumption of certain price differentials for each customer category.
Our results are in the following subsections.
21 | ACCELERATING USE OF RENEWABLE ENERGY BY GREEN TIME OF DAY TARRIF USAID.GOV3.3.1. AGRICULTURAL LOAD
The electricity requirement for the agricultural load is typically 5 to 6 hours per day for about 250 to
300 days per year, depending on the crops and geographical location of the farm. Presently, most
DISCOMs provide electricity to agricultural customers at night when there is a surplus. Though this
helps the DISCOMs to smooth out the demand curve, it also creates a lot of problems for farmers
who must brave the night to irrigate their fields, which raises safety concerns and increases the chance
of animal attacks. To mitigate these risks, many farmers keep their pump sets switched on. Many times
this leads to over-irrigation because anytime the power is available, the pumps start pumping water.
This not only wastes groundwater but also electricity. Because electricity for agriculture is either free
or heavily subsidized in most states, the wasted electricity does not affect the farmers much. Still, it
wastes taxpayers’ money and adversely affects the environment.
Karnataka is one state that has shifted 2,000 MW from the night-time agricultural load to solar
generation hours. The total power demand for the state is around 15,000 MW of which the agricultural
share is 34 percent.16 Figure 7 presents the load curve before and after shifting the agricultural load in
Karnataka.
Actual Load Curve of - April-2018
Demand (MW)
10000
5000
0
11:00
13:00
15:00
17:00
19:00
21:00
23:00
1:00
3:00
5:00
7:00
9:00
Demand Solar
Source: PACE-D presentation to Assam in August 2019
Figure 3.2. Load curve of Karnataka before and after shifting agricultural load
With separation of agricultural feeders being undertaken across the country, shifting of agricultural
loads to solar generation hours can be an option that the DISCOMs should explore. Some DISCOMs
already provide electricity for agricultural load for four hours during the day and four hours at night.
Thus, out of a total of 18% of agriculture consumption, it will be possible to shift only about 5% to the
daytime. Because agricultural load is regulated, it is not dependent on price differential and DISCOMs
can affect the shift.
3.3.2. INDUSTRIAL LOADS
Electricity tariffs for industrial customers in India, compared on a purchasing power parity (PPP) basis,
are among the highest in the world.17 The overall demand in this sector is also the highest in the
country, at about 41 percent (See Table 4). Various studies have highlighted that large industrial
customers are the most sensitive to tariff changes and thus can be a potential target for green ToD
tariffs, particularly the iron, steel, textile, cement, food processing, and chemicals industries, where
power cost is a significant fraction (>25 percent) of the total production cost. Such industries can
16 https://www.saurenergy.com/solar-energy-articles/pm-kusum-solar-saviour
17 https://www.iea.org/data-and-statistics/charts/industrial-electricity-prices-in-india-and-selected-countries-2005-2019
22 | ACCELERATING USE OF RENEWABLE ENERGY BY GREEN TIME OF DAY TARRIF USAID.GOVeasily shift load to green ToD time zones without compromising overall efficiency and production
capacity for appliances and processes such as industrial washing machines, dryers, freezers, cutting and
pressing water filtration, and reverse osmosis and desalination plants. These loads can take advantage
of a green ToD tariff structure to reduce their electricity expenses by shifting to green ToD hours,
when the DISCOM offers lower tariffs leading to cost savings for the industry.
In India, ToD tariffs for industrial customers started around early 2000 after establishment of
regulatory commissions. Most states have observed a 5 percent to 7 percent shift in the industrial
load. The program suggests that a modest additional 5 percent shift in industrial load will be possible
with the green ToD tariff, provided the price differential between the green ToD tariff and standard
normal tariff is above 10 percent.
3.3.3. COMMERCIAL, RAILWAY TRACTION, AND OTHER LOAD
Commercial activities are at their peak during the evening. In summers, weather is pleasant during the
evening and hot during the day. Thus, it is difficult for commercial establishments to shift their load
from the peak business time. Some shift is possible using storage, such as ice technology for air-
conditioning, but customer adoption of these strategies will take some time. For the purpose of this
study, the program assumes that no notable shift in commercial load will take place as a result of the
green ToD tariff.
Similarly, the program does not expect any significant demand shift in the railway traction load and
other categories (except the water-pumping load, which is described later in this section).
3.3.4. RESIDENTIAL LOAD
The shift in residential load is highly dependent on the price differential. In the residential category,
there is a class of customers who will not mind paying more but will not want to change their lifestyle
to shift demand. Lifestyle changes here mean shifting the water pumping, geyser, and washing and
dishwasher machine load to the daytime and adjusting temperatures for air-conditioning. Different
customer classes will have different tariff differential threshold levels for shifting load. Conversion of
home appliances into smart home appliances, which can be operated remotely, will support shifting
the load and will reduce the threshold tariff differential. The transition will take some time. Therefore,
the program does not expect more than a 2 percent shift in demand for residential customers as a
result of the green ToD tariff, only if the price differential is above 15 percent. This does not include
the water-pumping load for residential multi-story apartment buildings, which is considered in the
following subsection.
3.3.5. WATER-PUMPING LOAD
Urban local bodies (ULBs) are entrusted with supply of potable water to citizens. Pumping systems
for water supply are generally operated in the early morning and/or evening hours. Water supply is
the largest expenditure item among all municipal services of ULBs in India18 and can be shifted to the
solar generation hours, tapping the green ToD tariff, which will reduce the electricity bills of the ULBs.
Typically, the water-pumping cost, i.e., the cost of the electricity, is 30 percent to 35 percent of the
total cost that ULBs invest to supply water. Thus, a 10 percent to 15 percent reduction in electricity
costs to pump water will be significant savings for ULBs and can be channelled toward improving other
municipal services such as health, infrastructure development, and education.
With the rapid proliferation of multi-story apartments in metro and other big cities, water pumping
has increased significantly. To a great extent, this load can also be shifted to daytime.
18
Mukesh, Mathur. 2000. Municipal Finance and Municipal Services in India: Present Status and Future Prospects
23 | ACCELERATING USE OF RENEWABLE ENERGY BY GREEN TIME OF DAY TARRIF USAID.GOVThe water-pumping load, as depicted in Table 4, is divided into two categories—residential and others.
The program believes that the water-pumping load from ULBs and housing societies will be about 2
percent of the total electricity consumption. The program estimates 50 percent of the load can be
shifted to green ToD time zones, provided the green ToD tariff is at least 10 percent lower than the
normal tariff.
3.4. SUMMARY
Table 4 below provides a summary of the demand estimation for different customer categories at a
certain tariff differential (normal tariff minus green ToD tariff).
Table 3.2. Summary of Demand Shift by Green ToD
Consumption Estimated Demand Shift Price
Differential
between
Customer
% Total of % Total of Standard
Categories GWh GWh
Consumption Consumption Tariff and
Green
ToD
Industry 4,68,825 41.48% 23441.25 5% >=10%
Agriculture 2,04,348 18.08% 10217.4 5%
Residential 2,73,519 24.20% 5470.38 2% >=15%
Commercial 96,184 8.51% 0 NIL
Traction &
14,354 1.27%
Railways 0 NIL
Water Pumping
22,605 2.00%
load 11302.44 50% >=10%
Others 50,409 4.46% 0 NIL
Total 11,30,244 100.00% 50431.47 4%
The load factor is generally used to determine the MW demand from MWh. The load factor varies
between customer categories and DISCOMs. If a load factor of 0.5 is taken, the estimated demand
shift of 50,431.47 GWh will be about 11.51 GW
24 | ACCELERATING USE OF RENEWABLE ENERGY BY GREEN TIME OF DAY TARRIF USAID.GOVYou can also read