BC's Carbon Conundrum - Why LNG exports doom emissions-reduction targets and compromise Canada's long-term energy security - Canadian Centre for ...
←
→
Page content transcription
If your browser does not render page correctly, please read the page content below
BC’s Carbon Conundrum
Why LNG exports doom emissions-reduction targets and
compromise Canada’s long-term energy security

By J. David Hughes
JULY 2020
BC’s Carbon Conundrum
Why LNG exports doom emissions-reduction targets and
compromise Canada’s long-term energy security

By J. David Hughes
July 2020

This paper is part of the Corporate Mapping Project (CMP), a research and public engagement initiative
investigating the power of the fossil fuel industry. The CMP is jointly led by the University of Victoria, the
Canadian Centre for Policy Alternatives and the Parkland Institute. This research was supported by the
Social Science and Humanities Research Council of Canada (SSHRC).

For more information, visit www.corporatemapping.ca.

PUBLISHING TEAM
Marie Aspiazu, Shannon Daub, Emira Mears, Terra Poirier
Layout: Paula Grasdal
Copyedit: Grace Yaginuma
Cover photo: Wojciech Wrzesien / Shutterstock.com

ISBN 978-1-77125-506-6

This report is available under limited copyright protection. You may download, distribute, photocopy,
cite or excerpt this document provided it is properly and fully credited and not used for commercial
purposes. Figures copyright © 2020 by J. David Hughes. All rights reserved. Published July 2020.

The opinions and recommendations in this report, and any errors, are those of the author, and do not
necessarily reflect the views of the funders of this report.

                                               520 – 700 West Pender Street Vancouver, BC V6C 1G8
                                               604.801.5121 | ccpabc@policyalternatives.ca

                                               policyalternatives.ca

The CCPA–BC is located on unceded Coast Salish territory, specifically the lands belonging to the xwməθkwəýəm
(Musqueam), Skwxwú7mesh (Squamish) and səÍílwətaʔɬ /Selilwitulh (Tsleil-Waututh) Nations.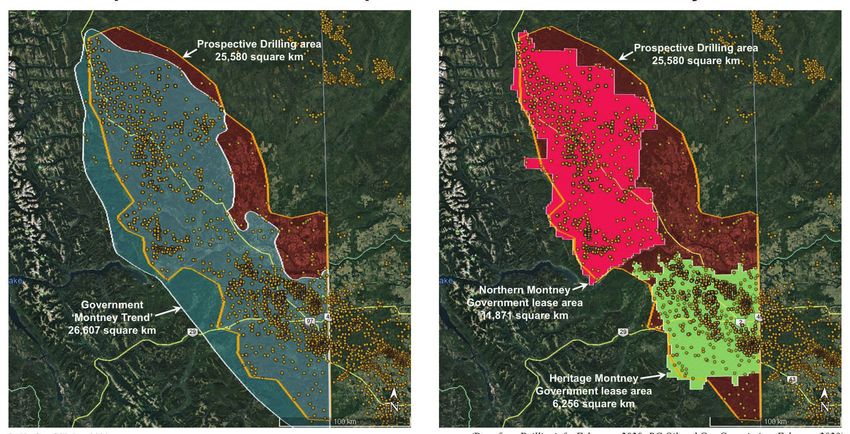
ABOUT THE AUTHOR
J. DAVID HUGHES is an earth scientist who has studied the energy resources of Canada for more than four
decades, including 32 years with the Geological Survey of Canada as a scientist and research manager. He
developed the National Coal Inventory to determine the availability and environmental constraints associated with
Canada’s coal resources. As Team Leader for Unconventional Gas on the Canadian Gas Potential Committee, he
coordinated the publication of a comprehensive assessment of Canada’s unconventional natural gas potential.

Over the past two decades, Hughes has researched, published and lectured widely on global energy and
sustainability issues in North America and internationally. In his work for the Canadian Centre for Policy
Alternatives, Hughes authored A Clear View of BC LNG in 2015, which examined the issues surrounding a proposed
massive scale-up of shale gas production in British Columbia for LNG export, Can Canada increase oil and gas
production, build pipelines and meet its climate commitments? in 2016, which examined the issues surrounding
climate change and the Trans Mountain pipeline expansion, and Canada’s Energy Outlook: Current realities and
implications for a carbon-constrained future in 2018. He has also authored multiple reports on unconventional oil and
gas development in the United States, consulted for the private sector on unconventional oil and gas, and served
as an expert witness on hearings for energy projects in the US and Canada.

Hughes is president of Global Sustainability Research, a consultancy dedicated to research on energy and
sustainability issues. He is also a board member of Physicians, Scientists & Engineers for Healthy Energy (PSE
Healthy Energy) and is a Fellow of Post Carbon Institute. His work has been featured in Nature, Canadian Business,
Bloomberg, and USA Today, as well as other popular press, radio, and television.

ACKNOWLEDGEMENTS
Special thanks to the Corporate Mapping Project, for providing a platform for this research, Marc Lee from the
CCPA, the substantive reviewer of this publication, Grace Yaginuma, who carefully copyedited this paper and
made helpful suggestions to improve the figures, Marie Aspiazu from the CCPA, who oversaw the review and
publication of the manuscript, and to the three anonymous reviewers who provided comments and suggestions
that substantially improved the report.
Contents

List of figures and tables..................................................................................................... 5

           List of figures......................................................................................................... 5

           List of tables........................................................................................................... 7

Summary........................................................................................................................... 9

Introduction..................................................................................................................... 14

Where will the gas come from?........................................................................................ 17

Does Canada have sufficient long-term gas supplies at reasonable prices?...................... 20

How many wells are needed, and what would their environmental footprint be?............ 24

           Land disturbance related to CER’s forecasted production.................................... 27

           Land disturbance related to LNG development................................................... 34

           Water consumption............................................................................................. 37

What are the emissions implications, and how do they relate to pledged targets?........... 39

Are government assertions on reducing global emissions by turning to LNG credible?... 47

Are LNG exports economically viable?............................................................................. 52

What about jobs and revenue for health care and schools?.............................................. 54

Conclusion....................................................................................................................... 56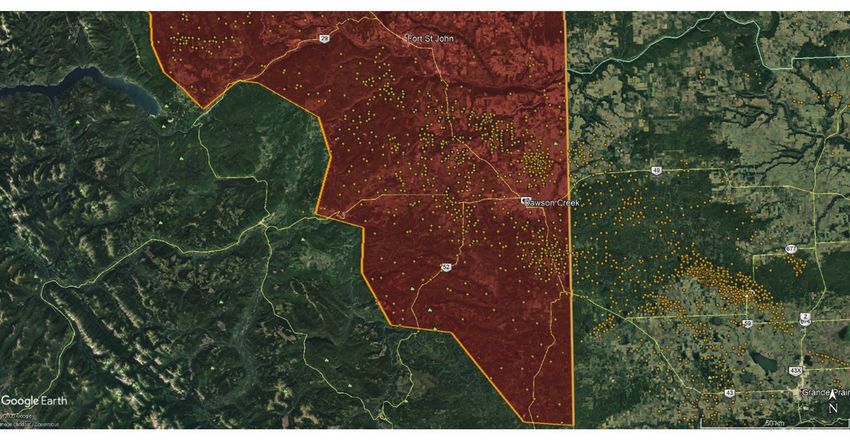
List of figures and tables

LIST OF FIGURES

Figure ES1: Projected oil and gas emissions in BC based on CER’s forecasted production, with
additional emissions to supply gas to the LNG Canada terminal and emissions from the
terminal itself.......................................................................................................................... 10

Figure ES2: Comparison of BC LNG for power generation in China with best-technology coal,
assuming fugitive methane emissions of 3.3 per cent.............................................................. 11

Figure 1: Marketable gas production in Canada with a breakdown by province, 2000–2019,
showing percentage change in production over the period......................................................15

Figure 2: Natural gas production in Canada with Canada Energy Regulator forecast from 2019
to 2040, including domestic demand and LNG exports............................................................17

Figure 3: Canadian gas production by formation and gas type with Canada Energy Regulator
forecast from 2019 to 2040. .................................................................................................... 18

Figure 4: BC gas production by formation, with Canada Energy Regulator forecast from 2019
to 2040 showing proportion that would be dedicated to LNG exports......................................19

Figure 5: Remaining established reserves of natural gas in Canada, 2010–2018, according to
CAPP. Also shown are the cumulative LNG export volumes over 40 years for the three projects
in Table 1................................................................................................................................. 21

Figure 6: Escalation of unproven marketable gas resources in Canada, 2007–2018, based on
estimates by the National Energy Board (now Canada Energy Regulator)............................... 22

Figure 7: Drilling rates by formation in BC with Canada Energy Regulator forecast from
2019 to 2040........................................................................................................................... 25

Figure 8: BC Montney production and historical drilling rates in terms of wells addedper
year, and projections of drilling rates needed to meet CER’s forecasted production from 2019
to 2040.................................................................................................................................... 26

A CORPORATE MAPPING PROJECT REPORT                                                                                                               5
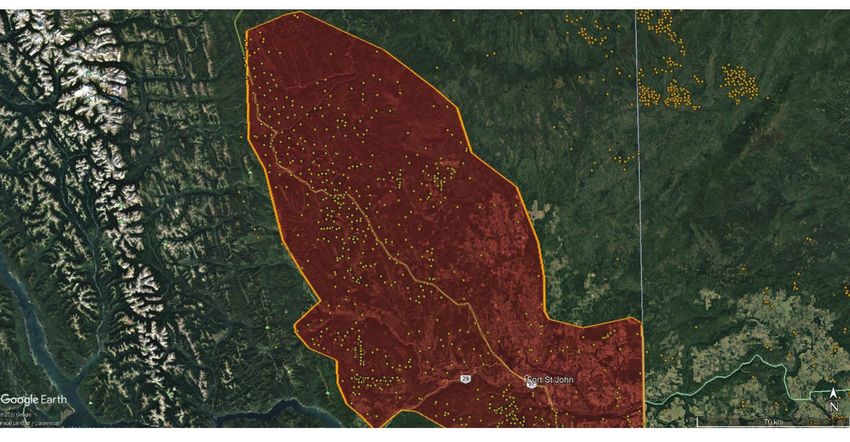
Figure 9: Distribution of Montney wells in BC and Alberta, and the prospective drilling area
    of the Montney in BC used to assess the impact of drilling the wells required to meet CER’s
    forecasted production............................................................................................................. 27

    Figure 10: Wells in the Northern Montney field, which is north of Fort St. John and the
    Peace River, and wells in the Heritage Montney field, which is south of Fort St. John and the
    Peace River. ............................................................................................................................ 28

    Figure 11: Close-up of multi-well pads and the gas production infrastructure in the central part
    of the Northern Montney field (north of Fort St. John), and wells in the Northern Montney field
    north of Hudson’s Hope. ........................................................................................................ 29

    Figure 12: Close-up of multi-well pads and the gas production infrastructure in the Heritage
    Montney field (southeast of Fort St. John), and close-up of a multi-well pad in the Heritage
    Montney field, which is 9 hectares with 18 wells. .................................................................... 30

    Figure 13: The various estimates of the areal extent of the Montney play from the BC Oil and
    Gas Commission and the “prospective drilling area” used in this study to assess the land
    disturbance impact of future drilling. ..................................................................................... 31

    Figure 14: There is a high degree of overlap between Blueberry River First Nation lands (left)
    and the prospective drilling area in the Montney (right). ....................................................... 34

    Figure 15: Water-injection volumes per well in BC, 2013–2019. .............................................. 36

    Figure 16: Total water-injection volumes for the drilling rates needed to meet CER’s forecasted
    production and to provide additional gas for Kitimat LNG and Woodfibre LNG....................... 37

    Figure 17: Emissions from natural gas production in BC calculated by Environment and
    Climate Change Canada and BC’s Greenhouse Gas Emissions Inventory................................. 40

    Figure 18: BC emissions by Canadian economic sector to 2018 (from Environment and Climate
    Change Canada), with a 2019–2050 projection of emissions from oil and gas production....... 42

    Figure 19: Projected oil and gas emissions in BC based on CER’s forecasted production,
    but without LNG exports..........................................................................................................43

    Figure 20: Projected oil and gas emissions in BC based on CER’s forecasted production, with
    additional emissions to supply gas to the LNG Canada terminal and emissions from the
    terminal itself.......................................................................................................................... 45

    Figure 21: Projected oil and gas emissions in BC based on CER’s forecasted production,
    including emissions to produce and supply gas to the LNG Canada, Kitimat LNG and
    Woodfibre LNG terminals, and emissions from the terminals themselves. ............................... 46

    Figure 22: Comparison of BC LNG for power generation in China with best-technology
    coal, assuming fugitive methane emissions of 3.3 per cent...................................................... 51

    Figure 23: BC gas production and total royalty revenue paid on BC natural gas sales,
    2000–2018. ............................................................................................................................. 55

6                                                                                                            BC’S CARBON CONUNDRUM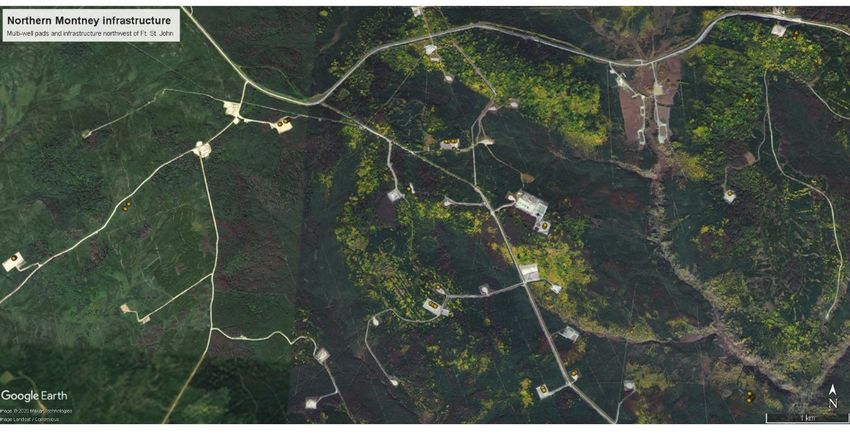
LIST OF TABLES

Table ES1: Cumulative land disturbance under various scenarios of LNG development in
the Montney............................................................................................................................ 12

Table 1: The status, annual throughput and 40-year export volume of LNG projects in BC
that may proceed. ................................................................................................................... 15

Table 2: Wells in the Montney and the rest of BC by well status, December 2019..................... 24

Table 3: Various estimates of the areal extent of the Montney play........................................... 31

Table 4: Land disturbance in the BC Montney play, to 2040..................................................... 33

Table 5: Land disturbance in the BC Montney play with and without LNG projects,
to 2070.................................................................................................................................... 35

Table 6: Cumulative land disturbance under various scenarios of LNG development in
the Montney............................................................................................................................ 36

Table 7: The global warming potential of methane compared with carbon dioxide
over 20 years and 100 years, according to the Intergovernmental Panel on Climate
Change (IPCC)........................................................................................................................ 41

Table 8: Life-cycle emissions from BC LNG-fuelled power generation in China compared
with best-technology coal generation, assuming upstream fugitive methane emissions of
two per cent............................................................................................................................ 49

Table 9: Life-cycle emissions from BC LNG-fuelled power generation in China compared
with best-technology coal generation, assuming upstream fugitive methane emissions
of 3.3 per cent......................................................................................................................... 50

A CORPORATE MAPPING PROJECT REPORT                                                                                                               7
Summary

ACCORDING TO THE INTERGOVERNMENTAL PANEL ON CLIMATE CHANGE (IPCC), global green-                        The emissions
house gas emissions must be reduced to net zero between 2040 and 2055 in order to limit                 created in producing
global warming to 1.5 Celsius above pre-industrial levels.1 The British Columbia government has         and liquefying
pledged to reduce emissions by 80 per cent from 2007 levels by 2050 through its CleanBC Plan            LNG have very
and the federal government has pledged that Canada will be net zero by 2050.                            real implications
This report assesses the emissions implications of the Canada Energy Regulator’s (CER) 2019 oil         for BC meeting its
and gas production forecast for BC, and the implications of ramping up gas production for liqui-        climate targets.
fied natural gas (LNG) export. Emissions data from the most recent Environment and Climate
Change Canada (ECCC) submission to the United Nations Framework Convention on Climate
Change (UNFCCC) are the basis for the emissions projections.

There are serious questions and considerations surrounding the current enthusiasm for develop-
ing a Canadian LNG export industry which are examined in this report. These include the impact
of increasing gas production on emissions; the land disturbance and water consumption from
the drilling required; the questionable benefits to taxpayers given reduced revenue from gas
production royalties and the cost of incentives offered by government; and the fact that full-cycle
analysis indicates that LNG exports to Asia will increase global emissions over the critical next few
decades. A further consideration is higher long-term gas prices for Canadians if the lowest-cost
portion of remaining resources is exported as LNG.

Emissions versus CleanBC and global targets

The emissions created in producing and liquefying LNG have very real implications for BC meet-
ing its climate targets. Even without any LNG exports, and assuming a 15 per cent reduction in
upstream emissions through reduced fugitive methane and electrification, emissions from oil and
gas production alone would exceed BC’s 2050 target by 54 per cent, given the CER forecast — and
that is if all other sectors of BC’s economy reached zero emissions by 2042. Increasing production
for LNG Canada would add a total of 13 megatonnes per year, including the company’s estimate
of 3.96 megatonnes from the terminal itself. Including LNG Canada, emissions from oil and gas
production would exceed BC’s 2050 target by 160 per cent, even if emissions from the rest of the
economy were reduced to zero by 2035 (Figure ES1). If Kitimat LNG and Woodfibre LNG were
also built (both of which have 40-year export licenses approved by CER), total LNG emissions

A CORPORATE MAPPING PROJECT REPORT                                                                      9
The industry            would amount to 22.6 megatonnes and BC’s 2050 target would be exceeded by 227 per cent,
   and government              even if all other sectors of BC’s economy reached zero emissions by 2031.
   narrative that BC
                               The industry and government narrative that BC LNG will contribute to a reduction in global
LNG will contribute
                               emissions by displacing coal-fired electricity in China and elsewhere in Asia2 lacks credibility if
   to a reduction in
                               a proper accounting of emissions is undertaken. While it is true that at the point of combustion
   global emissions            natural gas emits only 54 per cent of the emissions of coal per unit of heat provided, full-cycle
       by displacing           greenhouse gas emissions from LNG include emissions from production and processing of the
coal-fired electricity         gas, pipeline transportation, liquefaction, shipping, and regasification. As China replaces older,
       in China and            low-efficiency coal power plants, it has a choice of investing in several technologies, including
  elsewhere in Asia            renewable energy, LNG-fueled combined-cycle natural gas (CCNG), and best-technology coal.
lacks credibility if a
                               The climate impacts of emissions from BC LNG compared to best-technology coal in China also
 proper accounting
                               depend on the timeframe considered and the level of fugitive methane emissions from the pro-
     of emissions is
                               duction, processing and transportation of the gas or coal. Over 20 years, methane has a global
        undertaken.
                               warming impact 86 times greater than carbon dioxide, but this is reduced to 34 times over 100
                               years. Upstream methane emissions (from the well to the LNG terminal) are estimated at 3.3 per
                               cent of production for the unconventional gas that would supply LNG exports (based on studies
                               of comparable deposits in the US).

Figure ES1: Projected oil and gas emissions in BC based on CER's forecasted production, with additional
emissions to supply gas to the LNG Canada terminal and emissions from the terminal itself.

Sources: Data from Environment and Climate Change Canada, National Inventory Report 1990–2018: Greenhouse Gas Sources and Sinks in Canada; and
         Canada Energy Regulator’s Canada’s Energy Future 2019 report (CER’s 2040 production forecast is held flat through 2050).

                               2		 Peter Kenter, “LNG Canada’s Export Terminal Will Enable Coal-Reliant Customer Nations to Reduce GHG
                                   Emissions,” Vancouver Sun, December 13, 2018, https://vancouversun.com/sponsored/news-sponsored/
                                   lng-canadas-export-terminal-will-enable-coal-reliant-customer-nations-to-reduce-ghg-emisssions.

                     10                                                                                             BC’S CARBON CONUNDRUM
Figure ES2: Comparison of BC LNG for power generation in China with best-technology coal, assuming
fugitive methane emissions of 3.3 per cent.
Sources: Data about emissions from LNG terminals from Environmental Assessment Office, LNG Canada Export Terminal Project Assessment Report
(Victoria, BC: Environmental Assessment Office, 2015); and data about pipeline and ocean voyage distances (modified) from National
Energy Technology Laboratory, Life Cycle Greenhouse Gas Perspective on Exporting Liquefied Natural Gas from the United States (Washington,
DC: US Department of Energy, 2014).
Figure ES2 illustrates the full-cycle analysis of emissions from BC LNG in China versus best-tech- Emissions from LNG
nology coal. Emissions from LNG are 18.5 per cent greater than best technology coal over 20 years are 18.5 per cent
and 9.8 per cent less than coal over 100 years. Meaning that over the critical next few decades greater than best
LNG exports will make the global climate problem worse. Even if fugitive methane emissions technology coal
were reduced to 2 per cent (assuming supply came from conventional, not unconventional, over 20 years and
gas), LNG exports would make global warming worse over at least the next three decades.
9.8 per cent less
than coal over 100
Land and water impacts years. Meaning that
over the critical next
According to the CER, the Montney region in northeast BC and northwest Alberta is forecast
few decades LNG
to provide virtually all of the growth in Canadian gas production through 2040, when it will
exports will make
account for 64 per cent of Canadian production. Most of the gas for LNG exports will come from
the global climate
the BC portion of the Montney.
problem worse.
In order to meet both Canadian needs and LNG Canada exports, the number of wells in the BC
Montney would have to more than triple by 2040. Through the end of the three approved 40-
year LNG export licenses in 2070, the number of wells would have to increase by nearly 10-fold.
The land disturbance impact of doing this would increase the existing oil and gas footprint by
nearly four times, to 19.3 per cent of the BC Montney area (Table ES1).
A CORPORATE MAPPING PROJECT REPORT 11Table ES1: Cumulative land disturbance under various scenarios of LNG development in the Montney.
Cumulative disturbance as percentage
Cumulative area in hectares
of the BC Montney play
To 2020 129,568 5.07%
To 2040 without the 3 LNG projects 208,683 8.16%
To 2070 without the 3 LNG projects 325,060 12.71%
Plus LNG Canada to 2065 417,502 16.32%
Plus Kitimat LNG to 2070 485,614 18.98%
Plus Woodfibre LNG to 2070 494,773 19.34%
Note: The percentage of the land area disturbed in this table is based on the prospective drilling area which is 25,580 square kilometres.
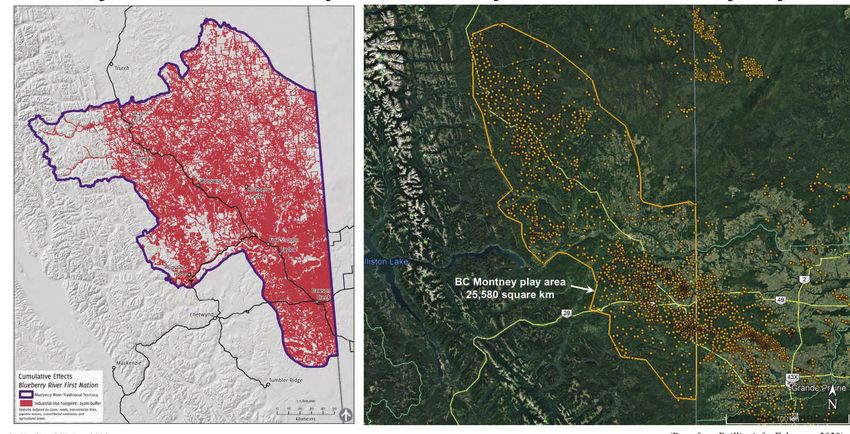
In 2015 the Blueberry River First Nation, whose lands overlie much of the BC Montney deposit,
filed a lawsuit over land disturbance and after a brief settlement returned to court in 2019. The
current footprint of well-pads, roads, pipelines and other infrastructure is, however, only 5.1 per
cent of the Montney area. A decision on this latest court case is expected in mid-2020, and may
severely restrict the capacity of the BC government to double land disturbance on Blueberry River
First Nation lands by 2040, let alone the additional land disturbance from drilling that would be
required to meet the needs of the three approved 40-year LNG export licenses from 2040-2070.
The existing footprint of the oil and gas industry on agricultural land is also a concern that
In fact, LNG export
has been raised by the BC Minister of Agriculture’s Advisory Committee for Revitalizing the
projects in BC are
Agricultural Land Reserve and the Agricultural Land Commission.
not economically
viable at current Water consumption by hydraulic fracking is also significant. If all three LNG export terminals
Asian prices were built, total water consumption would nearly triple from current levels, reaching 20 billion
according to studies litres per year after 2030, which for reference is roughly two months of consumption for the
by Canadian city of Vancouver. Contaminated water is produced both by flowback from the initial fracking
Energy Research operation and from formation water produced during gas production. Although some of this
Institute and the contaminated water is treated and reused, most of it is injected into disposal wells. Contaminated
water disposal would have to increase seven-fold from current levels by 2065 just with the LNG
Oxford Institute for
Canada project. If Kitimat LNG and Woodfibre LNG were also built, the water disposal problem
Energy Studies.
would become even worse.
Lack of benefits for taxpayers
Notwithstanding the climate and other environmental impacts of developing a BC LNG export
industry, government insists that LNG exports will provide a revenue and employment boom for
its citizens.
In fact, LNG export projects in BC are not economically viable at current Asian prices according
to studies by Canadian Energy Research Institute and the Oxford Institute for Energy Studies.
The prospect of much higher prices in 2025, when LNG Canada’s first phase comes online,
are highly uncertain, given the number of other LNG projects under development around the
world, the current global LNG glut, and lower-cost pipeline-based supply from Russia being
developed in China.
12 BC’S CARBON CONUNDRUMDespite the doubling of gas production in BC since 2005, the total royalty revenue has declined
by 84 per cent. Although increasing gas production may increase government revenues some-
what, this decline in royalty revenue, along with the other taxpayer funded incentives to spur
LNG exports, represents a giveaway of finite, non-renewable resources that Canadians will need
at some level in the future.
The argument that BC requires the jobs that LNG expansion will bring is also suspect. According
to LNG Canada, the number of permanent jobs that will be created by LNG Canada are half of
the 950 estimated by the government.
Natural gas is a finite, non-renewable resource, and Canada is a well-explored petroleum re- The argument that
gion. Although government estimates of unproven resources have been inflated drastically in BC requires the jobs
recent years, there have been no economic analyses to prove that these purported resources are that LNG expansion
economically viable. The three 40-year LNG export licenses already approved will alone exceed will bring is also
current proven Canadian gas reserves by 30 per cent. Although more drilling is likely to prove up suspect. According
additional reserves, the lack of credible economic analyses to show that Canada has enough gas to LNG Canada,
to meet its own needs for the foreseeable future before ramping up exports is troubling. the number of
Even assuming enough gas reserves can be proven up to meet projected demand, supplying permanent jobs
current approved LNG export licenses will likely result in much higher gas prices for Canadians that will be created
in the future. Industry always targets the lowest cost resources first in order to maximize profits. are half of the 950
Exhausting the lowest cost resources for LNG exports means that more remote, higher cost, estimated by the
resources will have to be used to meet the future needs of Canadians. government.
Need for a viable energy strategy
Government narratives have stated that reducing Canada’s emissions and expanding oil and gas
production go hand-in-hand. Unfortunately, no amount of wishful thinking can overcome the
math on the emissions generated from increased oil and gas production and the proposed LNG
exports. Nor can wishful thinking overcome the impacts on the land surface of the increase in
well-pads, roads, pipelines and other infrastructure that comes with increased production.
As outlined in my earlier research,3 Canada’s practice of ramping up oil and gas production in the
hope of financial gain is not a credible plan to meet the long-term energy needs and emissions
reduction goals of its citizens.
The projections of BC greenhouse gas emissions in this report are conservative, as they incorpor-
ate the older estimates of the 100-year global warming potential of methane used by Canada in
its emissions submission to the United Nations. The projections also assume that initiatives to
reduce fugitive methane and electrify upstream gas production will reduce emissions further
in the future. Even so, they demonstrate that growing oil and gas production is completely
incompatible with achieving promised emissions reduction targets. Growth in oil and gas
production for export is also incompatible with the long-term energy security of Canadians at
affordable prices, and the desire of First Nations to protect the environmental integrity of their
lands. Canada needs a viable energy strategy to address these issues and to have any hope of
meeting its emission reduction targets.
3 J. David Hughes, Canada’s Energy Outlook: Current Realities and Implications for a Carbon-Constrained Future
(Vancouver, BC: Canadian Centre for Policy Alternatives–BC Office, 2018), https://www.policyalternatives.ca/
energy-outlook.
A CORPORATE MAPPING PROJECT REPORT 13Introduction
Gas production in THE BC AND FEDERAL GOVERNMENTS HAVE EMBRACED EXPORTS of liquefied natural gas (LNG) as
Alberta, the largest- a means to create jobs and provide needed government revenue. There have also been claims
producing province, that LNG will reduce emissions by displacing coal burning for electricity when exported to Asia.
has declined by Others have raised concerns about the emissions created in producing, transporting, liquefying
24 per cent since and shipping gas to Asia, especially considering BC’s target of reducing emissions by 80 per cent
from 2007 levels by 2050.4
2000. Only BC
has increased Conventional wisdom taken up by the BC government and the Canada Energy Regulator (CER)
production, mainly is that Canada’s natural gas resources are, for practical purposes, essentially infinite and hence
owing to the should be monetized for the benefit of all. CER has produced a forecast of natural gas production
advent of fracking, and consumption in Canada, which is instructive in determining where the gas to fuel Canada’s
which has allowed economy and LNG exports will come from.5
access to previously
Western Canada, where most Canadian oil and gas is produced, is a mature exploration region,
uneconomic
with hundreds of thousands of wells drilled over the past 70-plus years. Natural gas production
resources.
in Canada peaked in 2001 and is down 4.7 per cent since 2000 (see Figure 1). Gas production
in Alberta, the largest-producing province, has declined by 24 per cent since 2000. Only BC has
increased production, mainly owing to the advent of fracking (hydraulic fracturing technology
that is coupled with horizontal drilling), which has allowed access to previously uneconomic
resources.
Although the federal government has approved more than 20 LNG export terminals over the
past few years, most of these appear unlikely to be built. In late 2018, however, LNG Canada
reached a final investment decision on its terminal in Kitimat, which is now under construction. It
also seems likely that Woodfibre LNG in Squamish, which also has a 40-year export license, may
reach a final investment decision in the near future, and CER has recently approved a 40-year
export licence for Chevron’s Kitimat LNG project. Table 1 summarizes the status and amounts of
gas that would be exported by these three projects.
4 Government of BC, CleanBC (Victoria, BC: Government of BC, 2019), https://blog.gov.bc.ca/app/uploads/
sites/436/2019/02/CleanBC_Full_Report_Updated_Mar2019.pdf.
5 Canada’s Energy Future 2019, Canada Energy Regulator, https://www.cer-rec.gc.ca/nrg/ntgrtd/ftr/2019/
index-eng.html.
14 BC’S CARBON CONUNDRUMFigure 1: Marketable gas production in Canada with a breakdown by province, 2000–2019,
showing percentage change in production over the period.
Source: Data from Canada Energy Regulator (accessed October 22, 2019).
Table 1: The status, annual throughput and 40-year export volume of LNG projects in BC that may proceed.
Average annual throughput 40-year export volume (trillion
Project Status
(billion cubic feet per day) cubic feet)
LNG Canada 3.61 52.73 Under construction
Awaiting final investment
Woodfibre LNG 0.32 4.72
decision
Awaiting final investment
Kitimat LNG 2.38 34.68
decision
Total 6.31 92.13
A CORPORATE MAPPING PROJECT REPORT 15Canada produces Canada is a major producer and exporter of oil and gas, ranking fifth and fourth, respectively,
far more oil and gas in global production in 2018.6 Although the energy sector’s contribution to Canadian GDP has
than it consumes, remained relatively constant over the past two decades at about 9 per cent, revenue to govern-
and this production ment per unit of oil and gas produced has declined by 77 per cent since 2008.7 Canada produces
comes at a high far more oil and gas than it consumes, and this production comes at a high cost in terms of
emissions and other environmental impacts.
cost in terms of
emissions and other Notwithstanding the fact that both the BC and federal governments have declared that new
environmental pipelines and export terminals are in the “national interest,” both levels of government have
impacts. committed to drastic reductions in emissions. Canada has declared it will have “net zero” emis-
sions by 2050, and BC has pledged to reduce emissions by 80 per cent by that date.
Emissions are just one aspect of evaluating a “national interest” case for LNG export terminals
and pipelines. Canadians also require long-term security of energy supply at reasonable prices
and protection of land and water resources. This report addresses the following key questions
that need to be answered before making a national-interest case for LNG exports:
• Where will the gas come from?
• Does Canada have sufficient long-term gas supplies at reasonable prices?
• How many wells would be needed, and what would their environmental footprint be?
• What are the implications for emissions, and how do they relate to pledged targets?
• Are government assertions on reducing global emissions by turning to LNG credible?
• Are LNG exports economically viable?
• What about jobs and revenue for health care and schools?
6 BP, BP Statistical Review of World Energy: 2019, 68th ed. (London, UK: BP, 2019).
7 My calculations are based on Statistics Canada, Financial and Taxation Statistics for Enterprises, by Industry
Type (table 33-10-0006-01); Canadian Association of Petroleum Producers’ Statistical Handbook (accessed
February 2020), https://www.capp.ca/publications-and-statistics/statistics/statistical-handbook;
Canada Energy Regulator (accessed October 2020), https://www.cer-rec.gc.ca/nrg/sttstc/ntrlgs/stt/
mrktblntrlgsprdctn-eng.html; and Bank of Canada’s inflation adjustment calculator.
16 BC’S CARBON CONUNDRUMWhere will the gas come from? FIGURE 2 ILLUSTRATES CER’S FORECAST OF CANADIAN NATURAL GAS PRODUCTION through 2040. Production is forecasted to be dominated by the three Western provinces, two of which would provide 98 per cent of 2040 Canadian production. Of these, BC is projected to grow by 87 per cent over the 2019–2040 period, whereas Alberta and Saskatchewan are projected to remain flat and the remainder of Canada to decline by 86 per cent. Canadian domestic demand is expected to grow gradually over the period, as shown in Figure 2. Figure 2: Natural gas production in Canada with Canada Energy Regulator forecast from 2019 to 2040, including domestic demand and LNG exports. Source: Canada Energy Regulator, Canada’s Energy Future 2019, December, 2019. A CORPORATE MAPPING PROJECT REPORT 17
The growth in BC gas production is almost entirely a result of the introduction of fracking in
                              the mid-2000s, which allowed the extraction of previously inaccessible tight and shale gas by
                              injecting large volumes of water and proppant (mainly sand with other additives) to fracture
                              rocks with low permeability and allow gas to be produced. Since 2014, 98 per cent of the wells
                              drilled in BC have been horizontal fracked wells.8

                              Figure 3 illustrates CER’s forecast of Canadian gas production by formation and type. Conventional
                              gas, which has provided most of Canada’s production since the 1950s, is forecasted to shrink to
                              almost nothing by 2040. Although minor amounts of shale gas are forecasted to be produced
                              from the Duvernay Formation in Alberta and the Horn River play in BC, a single formation — the
                              Montney, which occurs in northeast BC and northwest Alberta — is forecasted to provide virtu-
                              ally all of the growth in Canadian gas production through 2040. According to CER, the Montney
                              will provide 64 percent of Canadian production in 2040.

Figure 3: Canadian gas production by formation and gas type with Canada Energy Regulator forecast from 2019 to 2040.

Source: Canada Energy Regulator, Canada’s Energy Future 2019, December, 2019.
Note:   WC = Western Canada; ROC = rest of Canada.

                              The fact that Canadian gas production, which was once obtained from diverse fields and reser-
                              voirs in BC, Alberta and Saskatchewan, has become dependent for growth on one formation in a
                              small portion of Alberta and BC should be a red flag when planning increased exports. Although
                              some gas remains to be developed outside of the Montney, it is mainly in more remote, high-
                              er-cost deposits in the Western Canadian Sedimentary Basin, the Arctic and offshore. According
                              to CER, without the Montney, Canadian gas production would be down 20 per cent from 2019
                              levels by 2040, whereas with the Montney would increase by 32 per cent.

                              8    Enverus (formerly Drillinginfo) data (accessed February 2020).

                    18                                                                                 BC’S CARBON CONUNDRUM
Gas production for export by the LNG Canada project would come almost entirely from the BC Montney, given that it is the major source of production growth and that two of LNG Canada’s owners, Petronas (25 per cent) and Shell (40 per cent), are the second- and fourth-largest BC Montney producers, respectively. Although Shell has other assets in Alberta, Petronas is mainly focused on the BC Montney, and none of the other owners are gas producers. The forecasted growth of BC Montney production from nothing in 2007 to 96 per cent of the province’s production (which would be 44 per cent of Canada’s production) in 2040 is illus- trated in Figure 4, along with the proportion that would be exported as LNG. The volume of gas to be exported as LNG in the CER forecast is sufficient only to meet the requirements of the LNG Canada project (additional LNG projects would require production not included in the CER forecast). LNG Canada would be implemented in two phases — the first in 2025 with 14 million tonnes per year of export capacity and the second in 2030, bringing the total to 28 million tonnes per year, or 3.6 billion cubic feet per day. As domestic consumption in BC is a small fraction of the total forecasted production, the balance not exported as LNG would presumably be exported to Alberta and the northwest US. Figure 4: BC gas production by formation, with Canada Energy Regulator forecast from 2019 to 2040 showing proportion that would be dedicated to LNG exports. Source: Canada Energy Regulator, Canada’s Energy Future 2019, December, 2019. Note: Also shown is BC domestic gas consumption. A CORPORATE MAPPING PROJECT REPORT 19
Does Canada have
                        sufficient long-
                        term gas supplies at
                        reasonable prices?

         Issues such    IN ORDER TO APPROVE THE EXPORT LICENCES FOR LNG CANADA, Woodfibre LNG and Kitimat
       as emissions,    LNG, CER had to meet the requirements of section 118 of the National Energy Board Act which
     environmental      specifies that:
   footprint and the
                             On an application for a license to export oil or gas, the Board shall satisfy itself that
  longer-term price
                             the quantity of oil or gas to be exported does not exceed the surplus remaining after
Canadians may have
                             due allowance has been made for the reasonably foreseeable requirements for use in
   to pay for gas are        Canada, having regard to the trends in the discovery of oil or gas in Canada.9
    not considered.
                        Undefined in this regulation is how much gas is needed for the “reasonably foreseeable require-
                        ments for use in Canada” and what scientific data the board should use to make this calculation.
                        Issues such as emissions, environmental footprint and the longer-term price Canadians may
                        have to pay for gas are not considered.

                        The Canadian Association of Petroleum Producers (CAPP) defines established gas reserves as:

                             Those reserves recoverable under current technology and present and anticipated
                             economic conditions, specifically proved by drilling, testing or production, plus that
                             judgement portion of contiguous recoverable reserves that are interpreted to exist,
                             from geological, geophysical or similar information, with reasonable certainty.10

                        9		 National Energy Board Act, R.S.C., 1985, c. N-7, s. 118, https://laws-lois.justice.gc.ca/eng/acts/n-7/page-
                             27.html.
                        10		 Canadian Association of Petroleum Producers’ Statistical Handbook (Reserves: 02 Glossary of
                             Reserves; accessed February 9, 2020), https://www.capp.ca/publications-and-statistics/statistics/
                             statistical-handbook.

                   20                                                                                        BC’S CARBON CONUNDRUM
Figure 5 illustrates CAPP’s estimates of remaining established gas reserves in Canada from 2010
to 2018. Also shown is the required production over 40 years for the three LNG export terminals
approved by CER (listed in Table 1). These approvals total 92.1 trillion cubic feet (tcf), which ex-
ceed 2018 established gas reserves by 30 per cent. In addition, CER has forecasted that domestic
consumption in Canada will be 94 tcf between 2019 and 2040, and if domestic consumption
held constant after that at 2040 levels, domestic consumption would total 206 tcf by 2065, when
the LNG Canada export licence would end (assuming a 2030 start-up, the Kitimat LNG and
Woodfibre LNG export licenses would end in 2070). That would require a total of 298 tcf (206 tcf
for domestic consumption through 2065 and 92 tcf for the three LNG export terminals through
2070), or more than four times the current estimate of established gas reserves.
Figure 5: Remaining established reserves of natural gas in Canada, 2010–2018. Also shown are the cumulative LNG
export volumes over 40 years for the three projects in Table 1.
Source: Data from Canadian Association of Petroleum Producers’ Statistical Handbook (Reserves: 02 Glossary of Reserves; accessed February 2020).
Whereas established reserves are estimated based on drilling data with reasonable extrapolation
from these data, the National Energy Board (now the Canada Energy Regulator) and the prov-
inces developed unproven resource estimates, which have been used to justify the narrative that
Canada’s gas resources are extremely large and therefore justify LNG and other export approv-
als. These estimates are based on sparse data extrapolated over large areas. The Montney, for
example, was estimated to contain 449 tcf of “marketable gas” based on a 17-page report with
little documentation.11 The Liard play, which is penetrated by only four wells in northeast BC,
11 National Energy Board, The Ultimate Potential for Unconventional Petroleum from the Montney Formation of
British Columbia and Alberta — Energy Briefing Note (Calgary, AB: National Energy Board, 2013), https://
www.cer-rec.gc.ca/nrg/sttstc/ntrlgs/rprt/ltmtptntlmntnyfrmtn2013/ltmtptntlmntnyfrmtn2013-eng.html.
A CORPORATE MAPPING PROJECT REPORT 21was declared to have 167 tcf of “marketable gas” in a 16-page report with little documentation.12
One has to look in the appendixes of these reports to learn that “no study has been undertaken
to determine the economics for marketable resources.”
So, in approving large exports of gas, the National Energy Board has been basing its determin-
ations of “reasonably foreseeable requirements for use in Canada” on highly uncertain and
scantily documented estimates of unproven resources that have not been studied to see if they
may ever be economically recoverable.
Figure 6 illustrates the escalation since 2007 of National Energy Board’s estimates of marketable
gas resources. Notwithstanding that these resource estimates are unproven, have unknown eco-
nomics and are based on uncertain evaluations of sparse data, they have been used by the NEB,
CER and politicians to justify the narrative of virtually unlimited gas resources when approving
LNG and other exports.
13
Figure 6: Escalation of unproven marketable gas resources in Canada, 2007–2018, based on estimates by the National
Energy Board (now Canada Energy Regulator).13
Sources: Data from National Energy Board (accessed 2009, 2011, 2013, 2016 and 2018); and Canada’s Energy Future 2019 report.
12 National Energy Board, The Unconventional Gas Resources of Mississippian-Devonian Shales in the Liard Basin
of British Columbia, the Northwest Territories, and Yukon — Energy Briefing Note (Calgary, AB: National Energy
Board, 2016), https://www.cer-rec.gc.ca/nrg/sttstc/ntrlgs/rprt/ltmtptntlbcnwtkn2016/index-eng.html.
13 Tight gas reservoirs are less permeable than conventional gas reservoirs, but somewhat more permeable
than shale gas reservoirs. Both tight gas and shale gas are produced using fracking. Frontier includes
undeveloped resources offshore on the east and west coasts and in the Arctic.
22 BC’S CARBON CONUNDRUMThe cost of producing gas resources depends on their remoteness from infrastructure and on well productivity. In its most recent outlook (see Figures 2 and 3), CER forecasted declining pro- duction from conventional gas, given the depleted nature of these resources; stable to declining production from Eastern Canada, coal-bed methane and older tight-gas plays; little production from shale gas despite CER’s estimates of large unproven resources; no production from fron- tiers; and a vast ramp-up in tight gas production from the Montney. Industry always targets the lowest-cost resources first to maximize profits. The reason that the main growth in CER’s forecast is from the Montney (see Figure 3) is that it is the last perceived accumulation of low-cost gas, even though the quantity of accessible gas is highly uncertain, as outlined above. The future price of gas for Canadians is not a consideration in CER’s approval of LNG and other exports, even though these export approvals will almost certainly mean higher gas prices for Canadians in the future. By approving LNG and other export licences, CER is rel- egating Canadians to pay more in the future for gas from higher-cost resources that may or may not exist. A CORPORATE MAPPING PROJECT REPORT 23
How many wells are
                          needed, and what would
                          their environmental
                          footprint be?

    To increase field     TABLE 2 ILLUSTRATES THE NUMBER AND STATUS OF WELLS IN THE MONTNEY and the rest of BC as
production, enough        of December 2019. Of the 4,950 wells drilled in the Montney, 78 per cent are active, whereas
       wells must be      only 22 per cent of the 23,619 wells in the remainder of BC are active. Not every well drilled will
drilled to offset field   be productive due to the variability of geology and other factors, although the success ratio of
    decline and add       fracked wells using the latest technology is generally much higher than for older technology.

 production overall,
 and the higher the
                            Table 2: Wells in the Montney and the rest of BC by well status, December 2019.
 production grows,
      the more wells
                                        Well Status                     Montney (BC)                Rest of BC             Total
     must be added
    each year just to          Active                                      3,847                         5,074              8,921
 offset field decline.
                               Borehole completed                             148                        1,587              1,735

                               Inactive                                       497                        4,956              5,453

                               Plugged and abandoned                           70                        5,867              5,937

                               Suspended                                      388                        6,135              6,523

                               Grand total                                 4,950                        23,619             28,569

                          Source: Data from Enverus (formerly Drillinginfo) (accessed February 2020).

                    24                                                                                           BC’S CARBON CONUNDRUM
Once a well is drilled and completed, production begins to fall. This decline is steepest in early
months and gradually flattens out as the wells age. On average, Montney wells decline 45 per
cent in the first year, 62 per cent in the first two years and 69 per cent in the first three years.14 If
no wells were drilled, Montney production would fall at an average rate of 26 per cent per year,
which is termed the “field decline” (field production is made up of both older wells declining
slowly and newer wells declining more quickly). To increase field production, enough wells
must be drilled to offset field decline and add production overall, and the higher the production
grows, the more wells must be added each year just to offset field decline.
CER estimated that a total of 11,518 wells will need to be drilled in BC between 2019 and 2040 to
meet its forecasted production (illustrated in Figure 7).15 Of these, over 96 per cent are projected
to be drilled in the Montney. Notwithstanding the fact that CER estimated that the Horn River
and Liard plays of northeast BC contain very large (but unproven) shale gas resources (see also
Figure 6), CER has projected almost no production from them through 2040, confirming the
high cost and uncertain nature of these plays. By 2040, CER has projected that 96 per cent of BC
gas production will come from the Montney.
Figure 7: Drilling rates by formation in BC with Canada Energy Regulator forecast from 2019 to 2040.
Source: Data from Canada’s Energy Future 2019 report (Supplement: Natural Gas Production).
14 Enverus data (accessed February 2020).
15 Canada Energy Regulator December 2019, Canada’s Energy Future 2019 (Supplement: Natural Gas
Production), https://www.cer-rec.gc.ca/nrg/ntgrtd/ftr/2019ntrlgs/index-eng.html .
A CORPORATE MAPPING PROJECT REPORT 25Figure 8: BC Montney production and historical drilling rates in terms of wells added per year, and projections
of drilling rates needed to meet CER’s forecasted production from 2019 to 2040.
Source: Data from Enverus (accessed February 2020) and Canada’s Energy Future 2019 report.
Figure 8 illustrates CER’s forecasted production for the Montney, and drilling rates which come
from several sources. The number of completed wells and producing wells that were added
per year come from Enverus’s (formerly Drillinginfo) commercial database. (As expected, the
number of completed wells exceed the number of producing wells, as not all drilled wells are
In either the CER’s productive.) CER’s data for the historical number of wells are slightly different but of the same
or most likely cases, order of magnitude.
the number of wells
Also shown in Figure 8 are CER’s projected number of wells needed to meet its forecasted pro-
in the BC Montney
duction and a “most likely” number I calculated based on current well productivity, the field
would have to
decline rate, and the production increase required to meet forecasted production. The number
more than triple
of wells needed to offset field decline at current production levels is about 350 per year (the
the current levels
present drilling rate). The number of wells required to more than double production from 2019
(listed in Table 2) by levels (from 4.52 to 9.55 billion cubic feet per day in 2040) includes wells needed to increase
2040 to meet CER’s production and wells needed to offset progressively higher amounts of field decline as pro-
forecast production. duction grows. The “most likely” estimate assumed that productivity per new well would be
stable — that is, there would be no deterioration in well quality as wells become more crowded
and are extended into new areas.
CER has estimated that 10,831 Montney wells would need to be drilled in BC between 2020 and
2040 to meet its forecasted production, whereas my most likely forecast estimates 12,957 wells,
which is 20 per cent more. My most likely forecast should also be viewed as conservative as it
assumes that every well drilled will be successful and produce at the rate of recent wells. In either
the CER’s or most likely cases, the number of wells in the BC Montney would have to more than
triple the current levels (listed in Table 2) by 2040 to meet CER’s forecast production.
26 BC’S CARBON CONUNDRUMLand disturbance related to CER’s forecasted production
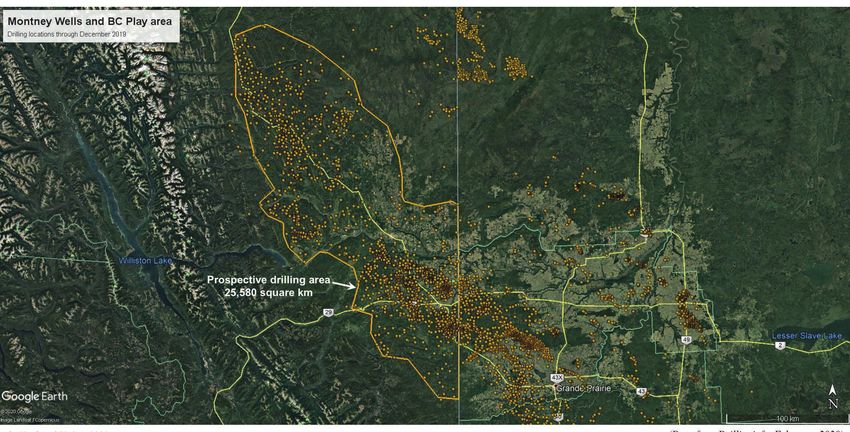
Figure 9 gives an overview of the distribution of Montney wells in BC and Alberta as of December
2019. Most of the locations shown are multi-well pads, which may have from two to 20-plus
wells. Also shown is the “prospective drilling area,” which is defined by wells that have significant
Montney production and which will most likely be the area of future production. The prospective
drilling area is used in the following section to determine the proportion of the area that would
be disturbed by drilling the wells required to meet CER’s forecasted Montney production.
Figure 10 provides a closer view of the Northern Montney field located north of Fort St. John and
the Peace River (upper) and the Heritage Montney field located to the south (lower).
Figure 9: Distribution of Montney wells in BC and Alberta and prospective BC drilling area.
Note: Distribution of Montney wells in BC and Alberta, and the prospective drilling area of the Montney in BC used to assess the impact of
drilling the wells required to meet CER's forecasted production. The scale bar is on the lower right. Well data from Enverus and map
data from Google Earth accessed February, 2020.
A CORPORATE MAPPING PROJECT REPORT 27Figure 10: (Upper) Wells in the Northern Montney field, which is north of Fort St. John and the Peace River. (Lower) Wells
in the Heritage Montney field, which is south of Fort St. John and the Peace River.
Note: The prospective drilling area (to assess the land disturbance impact of drilling the wells required to meet the CER’s forecasted
production) is shown in red. The scale bars are on the lower right. Well data from Enverus and map data from Google Earth accessed
February, 2020.
Figures 11 and 12 provide close-up views of multi-well pads and other infrastructure in the
Northern and Heritage Montney fields, respectively, to provide an understanding of the en-
vironmental footprint of the existing 4,950 wells in the BC Montney. These maps also provide
an appreciation of what development might look like if the number of wells is increased by an
additional 10,831 wells (the CER estimate) or 12,957 wells (my “most likely” estimate) by 2040,
in order to meet CER’s forecasted production.
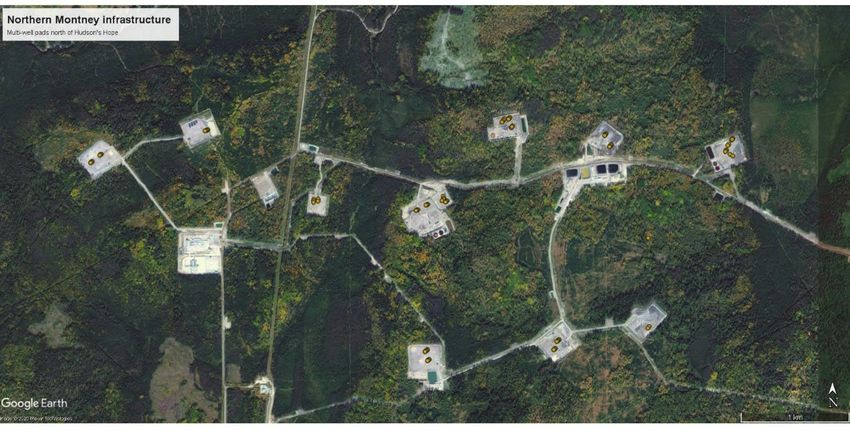
28 BC’S CARBON CONUNDRUMFigure 11: (Upper) Close-up of multi-well pads and the gas production infrastructure in the central part of the Northern
Montney field (north of Fort St. John). (Lower) Wells in the Northern Montney field north of Hudson’s Hope.
Note: The two southernmost pads in the lower figure are 13 and 11 hectares, and each contains seven wells. The scale bars are on the lower
right. Well data from Enverus and map data from Google Earth accessed February, 2020.
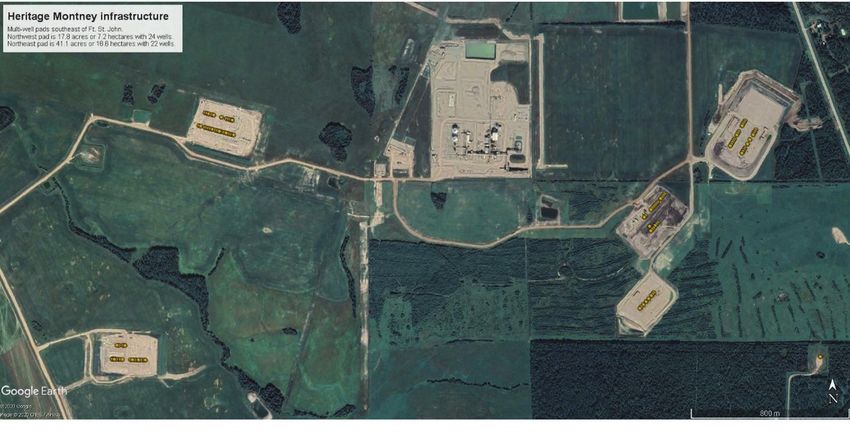
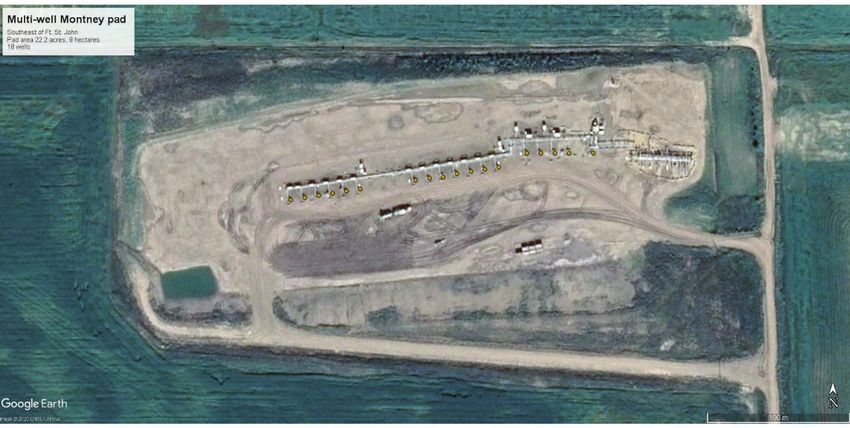
A CORPORATE MAPPING PROJECT REPORT 29Figure 12: Multi-well pads in the Heritage Montney field.
Note: (Upper) Close-up of multi-well pads and the gas production infrastructure in the Heritage Montney field (southeast of Fort St. John).
The northwest well pad is 7 hectares with 24 wells, and the northeast well pad is 17 hectares with 22 wells. (Lower) Close-up of a
multi-well pad in the Heritage Montney field, which is 9 hectares with 18 wells. The scale bars are on the lower right. Well data from
Enverus and map data from Google Earth accessed February, 2020.
There are discrepancies between the various estimates of the areal extent of the Montney play. In
2014, the BC Oil and Gas Commission (BCOGC) estimated that the area disturbed by Montney
oil and gas development covered 29,589 square kilometres.16 The regional field boundaries of
16 BC Oil and Gas Commission, Oil and Gas Land Use in Northeast British Columbia (Fort St. John, BC: BC Oil
and Gas Commission, 2014). https://www.bcogc.ca/node/12908/download.
30 BC’S CARBON CONUNDRUMthe Heritage and Northern Montney fields (which can be downloaded from BCOGC’s open
data website) have a combined area of 18,127 square kilometres,17 whereas the Montney un-
conventional play trend (also downloadable) has an area of 26,607 square kilometres.18 These
discrepancies are compiled in Table 3. In this study, a prospective drilling area of 25,580 square
kilometres (shown in Figure 9) is used to determine the area that will be impacted by drilling the
wells needed to meet CER’s forecasted production.
Table 3: Various estimates of the areal extent of the Montney play.
Source Area Estimate (km2)
BC Oil and Gas Commission Regional fields 18,127
BC Oil and Gas Commission Unconventional play trend 26,607
BC Oil and Gas Commission Disturbed area 29,589
This study Prospective drilling area 25,580
Figure 13: The various estimates of the areal extent of the Montney play from the BC Oil and Gas Commission.
Note: Left, “unconventional play trend”; right, the Heritage and Northern Montney regional fields, and the “prospective drilling area” used
in this study to assess the land disturbance impact of future drilling. The scale bar is on the lower right. Well data from Enverus and
map data from Google Earth accessed February, 2020.
17 BC Oil and Gas Commission Open Data Portal (GIS download of regional fields; accessed February 2020),
https://data-bcogc.opendata.arcgis.com/datasets/2e34e8d9065a46929a9dfdbf97ad3838_1/data.
18 BC Oil and Gas Commission Open Data Portal (GIS download of unconventional play trends; accessed
February 2020), https://data-bcogc.opendata.arcgis.com/datasets/1fa73f091aac4ff1b8b0deee2fa6ff39_1.
A CORPORATE MAPPING PROJECT REPORT 31You can also read