Communities in California - A Methodology for Geographically-Targeted Building Electrification for Environmental and Social Justice - Building ...
←
→
Page content transcription
If your browser does not render page correctly, please read the page content below
University of California, Berkeley

                   PUBPOL 290: Energy Regulation and Public Policy

                                     Spring 2021

                                      Practicum

A Methodology for Geographically-Targeted Building
Electrification for Environmental and Social Justice
                  Communities in California

 Prioritizing vulnerable communities in the transition away from natural gas

                            Isabelle Hens and Emily Lamon

                                  Steven Weissman

                          Building Decarbonization Coalition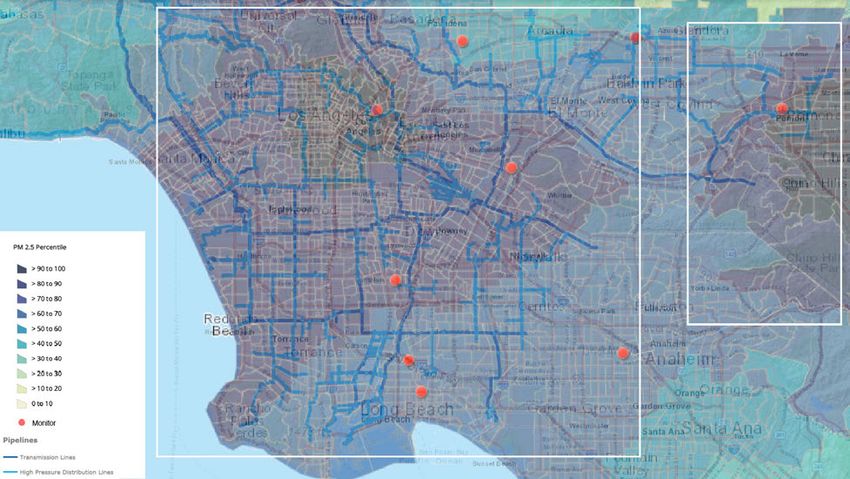
Isabelle Hens and Emily Lamon | PUBPOL 290: Energy Regulation and Public Policy | Spring 2021

Table of Contents
Introduction                                                                                         4

    What is building electrification and why is it important?                                        4

    Why do we need to focus on environmental and social justice communities?                         5

    Why a geographically-targeted approach?                                                          7

Existing Energy Programs for Low-Income Households                                                   7

Existing Decarbonization and Electrification Frameworks                                              9

    California Energy Commission - The Challenge of Retail Gas in California’s Low-Carbon Future      9

    The Greenlining Institute - Equitable Building Electrification                                   11

    RMI - eLab Accelerator 2020                                                                      11

    Common Spark Consulting - The Flipside Report                                                    12

Proposed Geographical Electrification Framework                                                      13

    Key Considerations                                                                               14

    Methodology                                                                                      15

    Input Parameters                                                                                 16

    Analysis of San Francisco Bay Area and Adjacent Central Valley                                   19

    Analysis of Los Angeles Area                                                                     26

Proposed Policies in Support of the Geographical Framework                                           33

    Avoid Expansion of the Gas System                                                                33

    Rent Protections for Tenants                                                                     34

    Provide Sufficient Funding for Building Owners                                                   34

    Create Synergies Among Incentive Programs                                                        35

    Support All-Electric Equipment and Provide Technical Assistance                                  35

    Redefine the Obligation to Serve                                                                 35

Suggestions for Future Work                                                                          36

Conclusion                                                                                           37

Acknowledgements                                                                                     38

References                                                                                           38

                                                                                                     1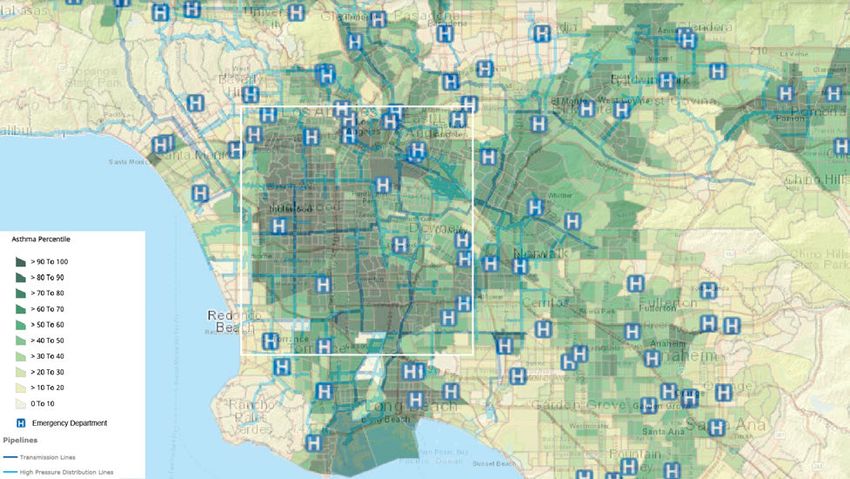
Isabelle Hens and Emily Lamon | PUBPOL 290: Energy Regulation and Public Policy | Spring 2021

List of Abbreviations
AB 1550          California Assembly Bill 1550

AEA              Association of Energy Affordability

AHSC             Affordable Housing and Sustainable Communities

CARE             California Alternate Rates for Energy

CCI              California Climate Investments

CDLAC            California Debt Limit Allocation Committee

CEC              California Energy Commission

CPUC             California Public Utilities Commission

CSE              Center for Sustainable Energy

CSGT             Community Solar Green Tariff

CSI              California Solar Initiative

DAC-GT           Disadvantaged Communities – Green Tariff

DAC-SASH         Disadvantaged Communities – Single-family Solar Homes

EPA              Environmental Protection Agency

ESAP             Energy Savings Assistance Program

ESJ              Environmental and social justice

HCD              California Department of Housing and Community Development

HUD              United States Department of Housing and Urban Development

LIFT             Clean Energy Low-Income Family and Tenants

LIHEAP           Low-Income Home Energy Assistance Program

LIHTC            Low-Income Housing Tax Credit

LIWP             Low-Income Weatherization Program

MASH             The Multifamily Affordable Solar Housing

MCE              Marin Clean Energy

NOAH             Naturally Occurring Affordable Housing

NPA              Non-pipeline alternative

NRDC             Natural Resources Defense Council

OEHHA            Office of Environmental Health Hazard Assessment

PG&E             Pacific Gas and Electric

                                                                                                       2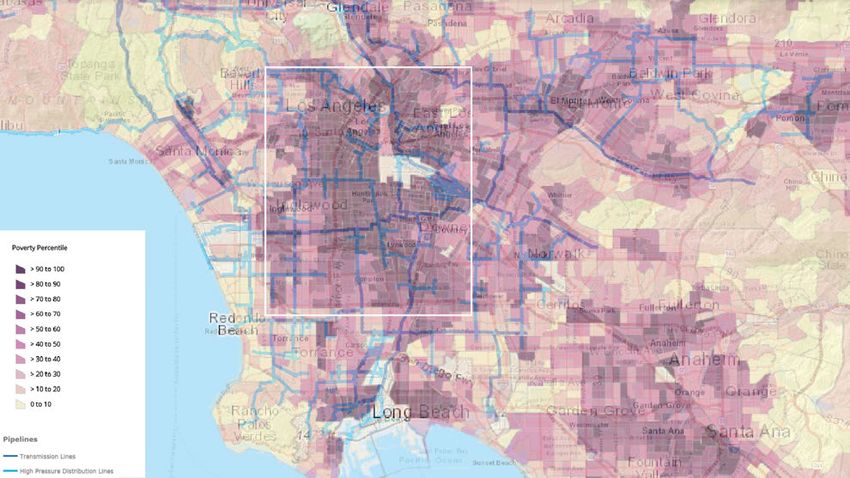
Isabelle Hens and Emily Lamon | PUBPOL 290: Energy Regulation and Public Policy | Spring 2021

PM              Particulate matter

PSPS            Public safety power shutoff

RNG             Renewable natural gas

SASH            Single-family Solar Affordable Solar Housing

SCE             Southern California Edison

SDG&E           San Diego Gas and Electric

SoCalGas        Southern California Gas Company

SOMAH           Solar on Multifamily Affordable Housing

TCAC            Tax Credit Allocation Committee

TCC             Transformative Climate Communities

USDA            United States Department of Agriculture

                                                                                                      3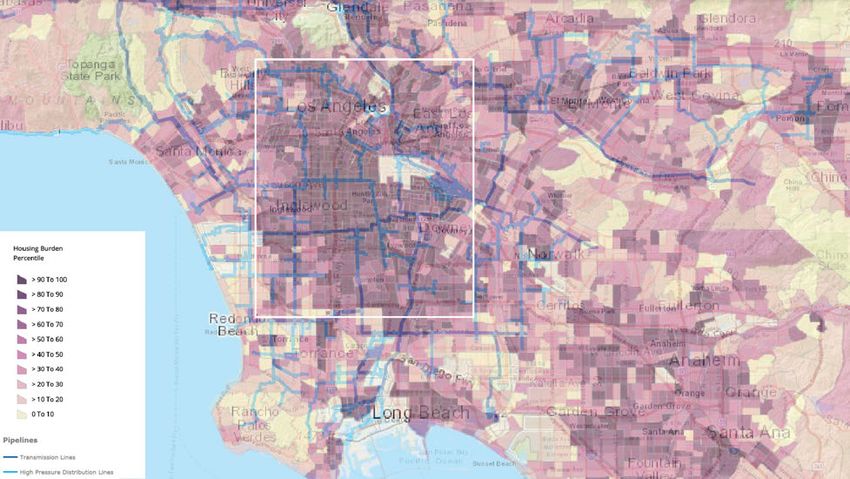
Isabelle Hens and Emily Lamon | PUBPOL 290: Energy Regulation and Public Policy | Spring 2021

Introduction
This report proposes a geographical decision framework for the transition of buildings away from on-site
natural gas combustion to all-electric infrastructure. Geographical electrification allows for a targeted
retirement of the gas distribution infrastructure, i.e. decommissioning entire communities or distribution
pipelines rather than individual households (Figure 1).1 If a geographical approach is implemented in a
cost-effective and equitable way, it can reduce utility expenditures on operations, maintenance, and
replacement of aging infrastructure2,3 while also alleviating the financial and pollution burdens of
environmental and social justice (ESJ) communities.4

     Figure 1: Untargeted vs targeted electrification (figure based on California Energy Commision, 2020).5

          What is building electrification and why is it important?

California’s building stock is responsible for 25% of the state’s greenhouse gas emissions.6 In 2018,
California established a goal for carbon neutrality by 2045.7 Because California’s electricity supply is among
the cleanest in the country, decarbonization experts agree that building electrification is one of the most
viable and cost-effective strategies to achieve carbon neutrality.8 So far, 42 cities in California have adopted

1
  Common Spark Consulting (2021). The Flipside Report: A White Paper on Targeted Geographic Electrification in California’s Gas
Transition.
2
  California Energy Commission (2020). The Challenge of Retail Gas in California’s Low-Carbon Future.
3
  Sierra Club (2019). Building Electrification Action Plan for Climate Leaders.
4
  Sierra Club (2019). Building Electrification Action Plan for Climate Leaders.
5
  California Energy Commission (2020). The Challenge of Retail Gas in California’s Low-Carbon Future.
6
  The Greenlining Institute (2019). Equitable Building Electrification: A Framework for Powering Resilient Communities.
7
  World Green Building Council (n.d.). Climate champion California joins the Net Zero Carbon Buildings Commitment.
8
  The Greenlining Institute (2019). Equitable Building Electrification: A Framework for Powering Resilient Communities.

                                                                                                                                  4
Isabelle Hens and Emily Lamon | PUBPOL 290: Energy Regulation and Public Policy | Spring 2021

building codes to limit natural gas use in new construction projects, including cities such as Berkeley and
San Jose.9 However, these regulations do not address existing California residential properties, nearly 80% of
which are currently connected to the natural gas system.10

In order to meet California’s carbon reduction goals, the state will need to make significant investment in
retrofitting existing housing stock. Many construction challenges are present in electrification retrofits,
including the availability of all-electric equipment, construction and installation expertise, and the existing
electrical infrastructure capacity in many California homes.11 Electrical breaker panels often do not have
sufficient amperage to run an entire home on electricity. In addition, homes built before 1978, when Title 24
came into effect, have a lower chance of being able to support the 240 volt electrical requirements of large
appliances such as ovens, stovetops, water heaters, and clothes dryers.12 When a natural gas appliance
breaks down and the owner needs to replace it, these electrical infrastructure upgrades make an electric
appliance replacement much less financially attractive than a natural gas appliance replacement. When an
appliance breaks down, it is often time sensitive to find a replacement and to get the system operating again
as normal. It is not always feasible to wait for electrical infrastructure upgrades to be carried out before
getting a new appliance. The construction challenges associated with electrification retrofits require the state
to plan ahead. Not replacing gas equipment upon failure slows down the transition to electricity and might
cause expensive early retirement in the future when climate goal deadlines are much closer.13

          Why do we need to focus on environmental and social justice
communities?

The California Public Utilities Commission defines environmental and social justice (ESJ) communities as
“communities where residents are: predominantly people of color or living on low incomes; underrepresented
in the policy setting or decision-making process; subject to disproportionate impact from one or more
environmental hazards; and likely to experience disparate implementation of environmental regulations and
socioeconomic investments”14. According to The Greenlining Institute, “these communities, often largely
composed of renters, have largely been left out of California’s push toward clean energy solutions”.15
Low-income ESJ communities might be exposed to financial risks caused by the costs of building upgrades
and increased electricity rates in market rate affordable housing. In addition, ESJ communities are

9
  Matt Gough (2021). California’s Cities Lead the Way to a Gas-Free Future. Sierra Club.
10
   California Energy Commission (2020). The Challenge of Retail Gas in California’s Low-Carbon Future.
11
   The Greenlining Institute (2019). Equitable Building Electrification: A Framework for Powering Resilient Communities.
12
   NRDC, Olivia Ashmoore (2020). Policy Pathways to Zero-Emissions Buildings.
13
   California Energy Commission (2020). The Challenge of Retail Gas in California’s Low-Carbon Future.
14
   The Greenlining Institute (2019). Equitable Building Electrification: A Framework for Powering Resilient Communities.
15
   The Greenlining Institute (2019). Equitable Building Electrification: A Framework for Powering Resilient Communities.

                                                                                                                           5
Isabelle Hens and Emily Lamon | PUBPOL 290: Energy Regulation and Public Policy | Spring 2021

disproportionately exposed to public health risks due to higher pollution burdens, caused by historic
decisions around locating shared infrastructure such as highways and power plants.

Environmental justice and community advocates have warned that landlords may pass on the cost of
building upgrades to tenants, therefore making housing less affordable and furthering gentrification in
communities. There is currently no regulatory or statutory protection to prevent building owners from evicting
current tenants in order to rent to more affluent tenants.16 The split incentive problem, in which building
owners pay for improvements but renters get the benefit of reduced utility bills, is exacerbated by California’s
housing crisis, where demand surpasses supply.17 In addition, the UCLA Institute of the Environment and
Sustainability found that “whole house electrification programs are likely to exacerbate daily peak electricity
loads and increase total household expenditures on energy”, and states that “low-income residents of
disadvantaged communities, who have the least flexible work schedules, the least access to high-efficiency
appliances and energy management systems, and inhabit the most poorly insulated housing stock, will be
most adversely affected by these changes”.18

According to The Greenlining Institute, in 2019, 45% of Californians were renters and about 25% of
Californians were renters living on low to extremely low incomes.19 Renters and low-income households
might experience additional financial burdens due to limited agency over when and how their households
transition to electricity.20 If electrification drives down demand for natural gas, ESJ communities could
become some of the last remaining customers served by the gas utility and could end up bearing the burden
of large utility bills to cover the high fixed costs of the natural gas infrastructure.21 Equitable electrification
policies must be put into place to protect low-income households from high and unpredictable utility bills as
infrastructure transitions from natural gas to electricity.

A final factor to take into account when designing equitable electrification policies is the potential impact on
public health, including outdoor and indoor air pollution. Burning natural gas indoors in an equipment closet
or on a stovetop releases nitrogen oxides and particulates, which can have long-term health effects
(especially for children and the elderly) such as triggering asthma attacks, decreasing overall lung function,
and increasing chances of serious respiratory illness.22

16
   The Greenlining Institute (2019). Equitable Building Electrification: A Framework for Powering Resilient Communities.
17
   The Greenlining Institute (2019). Equitable Building Electrification: A Framework for Powering Resilient Communities.
18
   Eric Daniel Fournier (2020). Implications of the timing of residential natural gas use for appliance electrification efforts. Environmental
Research Letters.
19
   The Greenlining Institute (2019). Equitable Building Electrification: A Framework for Powering Resilient Communities.
20
   California Energy Commission (2020). The Challenge of Retail Gas in California’s Low-Carbon Future.
21
   California Energy Commission (2020). The Challenge of Retail Gas in California’s Low-Carbon Future.
22
   The Greenlining Institute (2019). Equitable Building Electrification: A Framework for Powering Resilient Communities.

                                                                                                                                                 6
Isabelle Hens and Emily Lamon | PUBPOL 290: Energy Regulation and Public Policy | Spring 2021

According to the Natural Resources Defense Council (NRDC), “gas appliances in rental housing are older
than appliances in owned housing and many are far older than their predicted life expectancy”.23 For
example, half of space heating appliances in rental housing are 20 years old or older, while we assume a
usable life of 15-20 years.24 Heat pumps have advantages in terms of comfort, safety, and health, so
buildings with old gas equipment are good targets for electrification.25 The California Public Utilities
Commission (CPUC) developed an Environmental and Social Justice Action Plan in 2019, which lists among
its goals to improve local air quality and public health for ESJ communities.26 Prioritizing ESJ communities for
electrification could have a positive impact on community health, as well as indoor and outdoor air pollution.

          Why a geographically-targeted approach?

A geographically-targeted approach addresses exactly those communities who are most vulnerable to
financial risks and pollution. In addition, targeted electrification has well established cost benefits. For an
example targeted strategy, the California Energy Commission projects a reduction in gas system costs by $4
billion annually in 2050 and by $25 billion cumulatively in net-present value terms.27 Geographical
decommissioning and subsequent electrification reduces operation and maintenance costs of existing gas
infrastructure and reduces investments in new and replacement infrastructure that will result in stranded
assets.

Existing Energy Programs for Low-Income Households

There are many programs that address energy efficiency and building upgrades through financial incentives
for low-income households and affordable housing developments. These programs are critical in providing
financial support for vulnerable communities to deploy energy efficiency upgrades and to transition from
natural gas to electricity. Below is a non-exhaustive overview of programs in California, which illustrates the
plethora of programs at different levels with similar goals.

The Low-Income Weatherization Program (LIWP) is “the state’s first energy efficiency program that
includes electrification designed specifically for Californians with low-incomes living in disadvantaged
communities”.28 It delivers greenhouse gas emission reductions and health, safety, and comfort upgrades.29

The California Solar Initiative (CSI) was closed on December 31, 2016 because California did not deem it
necessary anymore to provide direct incentives because a drop of equipment prices had transformed the

23
   NRDC, Olivia Ashmoore (2020). Policy Pathways to Zero-Emissions Buildings.
24
   NRDC, Olivia Ashmoore (2020). Policy Pathways to Zero-Emissions Buildings.
25
   AEA, Nick Dirr & Sheetal Chitnis (2020). Multifamily Clean Heating Pilot: Summary of Project-level Analysis and Findings.
26
   CPUC (2019). Environmental and Social Justice Action Plan.
27
   California Energy Commission (2020). The Challenge of Retail Gas in California’s Low-Carbon Future.
28
   The Greenlining Institute (2019). Equitable Building Electrification: A Framework for Powering Resilient Communities.
29
   The Greenlining Institute (2019). Equitable Building Electrification: A Framework for Powering Resilient Communities.

                                                                                                                               7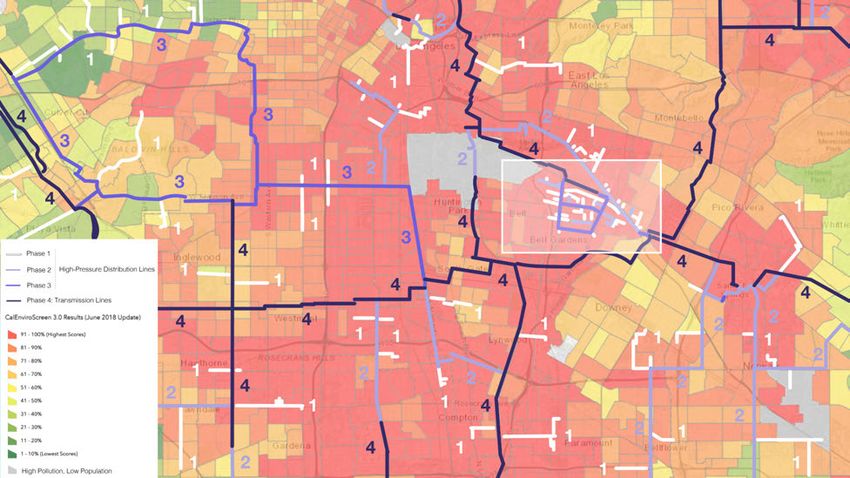
Isabelle Hens and Emily Lamon | PUBPOL 290: Energy Regulation and Public Policy | Spring 2021

solar market.30 However, CSI subprograms continue to provide incentives to low-income customers to install
solar PV systems and to all utility customers to install solar water heating systems. The California Solar
Initiative, along with the California Energy Commission’ New Solar Homes Partnership (NSHP) and various
solar programs offered through publicly owned utilities are part of Go Solar California.31 The CSI subprograms
consist of several components which are grouped into two funding streams, depending on whether they use
solar PV to reduce electricity consumption from the grid or solar thermal to reduce natural gas
consumption.32

PV solar programs include the following. The Single-family Solar Affordable Solar Housing (SASH) Program
provides solar incentives to single-family low-income housing (administered through a statewide Program
Manager, GRID Alternatives). The Multifamily Affordable Solar Housing (MASH) Program provides solar
incentives to multifamily low-income housing (administered by Pacific Gas and Electric (PG&E), Southern
California Edison (SCE), and the Center for Sustainable Energy (CSE), in San Diego Gas and Electric’s
(SDG&E) service territory). The Disadvantaged Communities – Single-family Solar Homes (DAC-SASH)
Program offers incentives for solar installations on owner-occupied, single-family homes. Other programs
within this category are the Solar on Multifamily Affordable Housing (SOMAH) Program, the Disadvantaged
Communities – Green Tariff (DAC-GT) Program, and the Community Solar Green Tariff (CSGT) Program. The
thermal program for low-income households is called the CSI-Thermal Low-Income Program and provides
incentives for solar thermal technologies to multifamily and single-family residential customers in PG&E,
Southern California Gas Company (SoCalGas), and SDG&E service territories.

The Energy Savings Assistance Program (ESAP) provides “no-cost energy efficiency services and
no-cost direct installation energy efficiency measures to income-eligible households via ratepayer funding”.33

The Low-Income Home Energy Assistance Program (LIHEAP) is “a federally funded program that
provides assistance to eligible low-income households with the goal of managing and meeting their energy
costs and immediate home heating and/or cooling needs”.34

The Clean Energy Low-Income Family and Tenants (LIFT) Pilot Program by Marin Clean Energy (MCE)
combines health, habitability, and energy upgrades. In combination with MCE’s existing Multifamily Energy
Savings program, property owners can have up to 80 percent of the total project costs covered through the
combined rebates.

30
   CPUC (n.d.). California Solar Initiative. https://www.cpuc.ca.gov/general.aspx?id=6043
31
   CPUC (n.d.). California Solar Initiative. https://www.cpuc.ca.gov/general.aspx?id=6043
32
   CPUC (n.d.). California Solar Initiative. https://www.cpuc.ca.gov/general.aspx?id=6043
33
   Southern California Gas Company (2019). Energy Savings Assistance (ESA) Program: Impact Evaluation Program Years 2015-2017.
34
   California Department of Community Services & Developments (n.d.). Programs. https://csd.ca.gov/programs/

                                                                                                                                 8
Isabelle Hens and Emily Lamon | PUBPOL 290: Energy Regulation and Public Policy | Spring 2021

The California Alternate Rates for Energy (CARE) Program provides low-income utility customers with a
30-35% discount on their electricity bill and a 20% discount on their natural gas bill. The program is available
for customers of PG&E, SCE, SDG&E, SoCalGas, and other smaller utility companies.35 According to
Common Spark Consulting, bill protection programs like CARE should be expanded to address near-term
rate impacts, and should increase the discount on electric rates over time to better support fully-electrified
households, and should increase the discount on gas rates over time to protect customers unable to
transition to electricity early.36

According to The Greenlining Institute, many of these programs receive limited funding and the lack of
program alignment creates a confusing landscape.37 For example, LIWP has no guaranteed funding from the
Greenhouse Gas Reduction Fund from year to year. In addition, LIWP is not coordinated with the
utility-administered ESAP, which makes it almost impossible to combine both sources of funding on a single
project.38 The disconnect between energy and health programs that treat homes is a missed opportunity, as
homes that need energy upgrades often also have other problems that need to be resolved before they can
be treated. A referral loop among programs would assist owners in managing complex project timelines and
requirements.39

Existing Decarbonization and Electrification Frameworks

A number of organizations have put forward frameworks to support ESJ communities through the transition
from natural gas infrastructure to electrified systems, including the Energy Research and Development
Division of the California Energy Commission (CEC),The Greenlining Institute, RMI, and Common Spark
Consulting. These frameworks provide crucial context to this report, as they illustrate the broad range of
considerations when designing electrification policies with a focus on equity. While this report focuses on a
few sub-strategies and guidelines of these frameworks, all considerations in these frameworks should be
incorporated into equitable policy design.

            California Energy Commission - The Challenge of Retail Gas in California’s
Low-Carbon Future

In The Challenge of Retail Gas in California’s Low-Carbon Future, the CEC evaluated two scenarios that
achieve an 80% reduction in California’s greenhouse gas emissions by 2050 from 1990 levels: a high building

35
     CPUC (n.d.). CARE/FERA Programs. https://www.cpuc.ca.gov/lowincomerates/
36
   Common Spark Consulting (2021). The Flipside Report: A White Paper on Targeted Geographic Electrification in California’s Gas
Transition.
37
   The Greenlining Institute (2019). Equitable Building Electrification: A Framework for Powering Resilient Communities.
38
   The Greenlining Institute (2019). Equitable Building Electrification: A Framework for Powering Resilient Communities.
39
   The Greenlining Institute (2019). Equitable Building Electrification: A Framework for Powering Resilient Communities.

                                                                                                                                   9
Isabelle Hens and Emily Lamon | PUBPOL 290: Energy Regulation and Public Policy | Spring 2021
electrification scenario and a no building electrification scenario. In their study, they focus on three areas:
technology options to decarbonize the natural gas system, implications for natural gas customers, and
outdoor air quality and public health.40 While the first area is out of the scope of this paper, we will also
discuss the implications of electrification on natural gas customers (specifically low-income communities) and
outdoor air quality and public health (specifically for areas vulnerable to public health risks). The CEC
concluded that “building electrification is likely to be a lower-cost, lower-risk long-term strategy compared to
renewable natural gas” and that “electrification across all sectors, including in buildings, leads to significant
improvements in outdoor air quality and public health”.41
Based on their evaluation of the two scenarios, the CEC developed a set of eight strategies, divided into gas
transition mechanisms and cost allocation mechanisms, which are laid out below. This paper will expand on
strategies three and four because they are closely related to considerations of how we manage the transition
from natural gas to electricity and which communities should transition first.
Gas transition mechanisms:
1) Reduce barriers to electrification. Current barriers include difficulty receiving permits and lack of
experience installing heat pumps among contractors. Strategies to address these barriers include
market transformation initiatives to lower costs and initiatives to enable low-income homeowners
and renters to adopt electric equipment.
2) Avoid gas system expansion. By building communities without gas, we prevent adding additional
obligations that will increase the cost of gas service for remaining customers.
3) Shut down uneconomic gas infrastructure to serve building loads. Targeted retirement of the gas
distribution system saves costs in operations, maintenance, and replacement of aging infrastructure.
It is difficult to identify geographies that are ripe for retirement and to successfully target
electrification efforts.
4) Reduce costs of the existing gas system while ensuring safety and reliability. This can be achieved
with geographically targeted electrification and gas system retirement. Derating of infrastructure
(operating segments at lower pressures) can save costs in operation, maintenance, and
reinvestment.
Cost allocation mechanisms:
5) Accelerated depreciation to recover investments in a shorter period of time. This can be justified
because depreciation schedules should reflect the useful life of an asset, which is shortened as
utilization decreases. The advantage is that this strategy reduces the remaining costs of the gas
40
California Energy Commission (2020). The Challenge of Retail Gas in California’s Low-Carbon Future.
41
California Energy Commission (2020). The Challenge of Retail Gas in California’s Low-Carbon Future.
10Isabelle Hens and Emily Lamon | PUBPOL 290: Energy Regulation and Public Policy | Spring 2021
system by recovering investments sooner than the traditional useful lifetime. A disadvantage is that it
increases near-time gas rates and gas utility revenue collection. Therefore, it needs to be combined
with reduction in gas system expenditures and a long-term gas transition plan.
6) Change cost allocation. Increasing rates for remaining gas customers might make gas
uncompetitive.
7) Recover gas system costs on the bills of electric ratepayers. This can be justified because the gas
system was built for a stable long-term customer base. Customers that switch to all electric do no
longer contribute to the system that was built on their behalf. Potential strategies are an exit fee or a
competitive transition charge that is applied to the bills of all electricity customers. While this strategy
promotes equity, it might discourage electrification, especially in the case of a lump sum exit fee.
8) Get additional funds from outside the gas system. Funding sources can be cap-and-trade revenues,
state general funds, or decreased returns for utility shareholders.
The Greenlining Institute - Equitable Building Electrification
The Greenlining Institute developed a five-step framework for equitable building electrification focused on ESJ
communities. This framework includes the following steps:42
1) Assess the communities’ needs, identify indicators, and set goals;
2) Establish community-led decision making;
3) Develop metrics and a plan for tracking clean energy benefits and community benefits;
4) Ensure funding and program leveraging;
5) Improve outcomes by setting up a continuous feedback loop and considering adjustments.
For each of these steps, The Greenlining Institute identifies a set of questions that policymakers should ask
and lays out recommendations. To assess the communities’ needs, identify indicators, and set goals, they
also explain how to set goals that are strategic, measurable, ambitious, realistic, time-bound, and equitable.
This framework provides important steps in addition to the framework developed in this report.
RMI - eLab Accelerator 2020
RMI is a nonprofit organization that works with businesses, policymakers, communities, and other
organizations to decarbonize energy systems.43 Their eLab (Electricity Innovation Lab) convenes energy
practitioners to discuss energy transition problems.44 The eLab Accelerator is a bootcamp where project
42
The Greenlining Institute (2019). Equitable Building Electrification: A Framework for Powering Resilient Communities.
43
RMI (n.d.). Get to Know Us. https://rmi.org/about/
44
RMI (n.d.). ELab: Electricity Innovation Lab. https://rmi.org/our-work/electricity/elab-electricity-innovation-lab/
11Isabelle Hens and Emily Lamon | PUBPOL 290: Energy Regulation and Public Policy | Spring 2021
teams bring their challenges and potential solutions to the table.45 In 2020, the topic of the eLab Accelerator
was electrification and natural gas decommissioning in Berkeley.46 The team included leaders and scientists
from the City of Berkeley, PG&E, the California Energy Commission, the California Public Utilities
Commission, the California Housing Partnership, and the Natural Resources Defense Council. The team
“developed draft criteria and methodology for identifying and prioritizing pilot locations with equity, emissions,
safety, health, and economic considerations in mind”.47 The pilot resulting from the bootcamp will include a
focus on low-income households, the utility’s obligation to serve, and financial barriers created by regulatory
constraints.48
First, the pilot will include at least one low-income neighborhood that best serves to identify financial and
nonfinancial costs, benefits, and barriers. The pilot will address the community buy-in process, create
transparency around regulatory financial barriers, and identify multiple funding mechanisms to scale. Second,
the pilot aims to address the limitations of decommissioning specific gas distribution lines due to the utility’s
obligation to serve, because it is not guaranteed that customers in decommissioned zones will not want to
resume service. Therefore, the team is considering a “No Reconnect Ordinance” for buildings that have
discontinued gas service. In addition, the city of Berkeley intends to work with the California Public Utilities
Commission to modernize the concept of “obligation to serve” to prioritize adequate service, instead of
obligation to provide both electricity and gas. Third, the team aims to identify where resources and funding
streams are misaligned due to regulations that prevent utilities from paying for electrification projects with gas
capital investments.49 As one of the first efforts in the United States to address the decommissioning of gas
distribution infrastructure and multi-building electrification,50 this multidisciplinary boot camp serves as a great
example of the potential challenges and solutions in designing a geographical electrification approach.
Common Spark Consulting - The Flipside Report
Common Spark Consulting is an independent firm that provides consulting services in public and stakeholder
engagement, policy research and advocacy, and organizational development and strategy.51 Common Spark
Consulting developed The Flipside Report: A White Paper on Targeted Geographic Electrification in
California’s Gas Transition for Building Decarbonization Coalition, an organization that “unites building
industry stakeholders with energy providers, environmental organizations and local governments to help
electrify California's homes and workspaces with clean energy”.52 The Flipside Report focuses on the flipside
45
RMI (n.d.). ELab Accelerator. https://rmi.org/our-work/electricity/elab-electricity-innovation-lab/elab-accelerator/
46
RMI (n.d.). ELab Accelerator 2020: Berkeley Electrification and Natural Gas Decommissioning Pilot.
47
RMI (n.d.). ELab Accelerator 2020: Berkeley Electrification and Natural Gas Decommissioning Pilot.
48
RMI (n.d.). ELab Accelerator 2020: Berkeley Electrification and Natural Gas Decommissioning Pilot.
49
RMI (n.d.). ELab Accelerator 2020: Berkeley Electrification and Natural Gas Decommissioning Pilot.
50
RMI (n.d.). ELab Accelerator 2020: Berkeley Electrification and Natural Gas Decommissioning Pilot.
51
Common Spark Consulting (n.d.). What We Do. https://www.common-spark.com/
52
Building Decarbonization Coalition (n.d.). https://www.buildingdecarb.org/
12Isabelle Hens and Emily Lamon | PUBPOL 290: Energy Regulation and Public Policy | Spring 2021
of gas decommissioning—the need to proactively map out and manage an aligned, equitable, and
cost-effective framework for targeted geographic electrification. The report proposes a three-phased
approach for geographically targeted electrification:
1) Phase 1: Vulnerable communities. These communities should be prioritized, even if they overlap with
the criteria of phases 2 and 3 or if they share distribution lines with industrial and large commercial
customers.
2) Phase 2: Urgent safety and need-to-repair threats. In this phase, priority should be placed first on
fully or nearly depreciated gas assets, then on assets with imminent and high-cost repairs and high
priority safety replacement. An example of infrastructure that would be decommissioned in this
phase is distribution lines that serve only residential and small commercial customers and that need
mitigation of earthquake risk or methane leaks.
3) Phase 3: Viable and cost-effective ways to trim infrastructure. In this phase, the avoided cost of early
decommissioning and discontinued maintenance should outweigh the upfront cost of proactive
electrification.
The approach should be guided by four core principles:53
a) Providing vulnerable communities with financial support for building upgrades, engaging them in the
decision making process, protecting them from eviction, and ensuring high performance of new
appliances.
b) Develop pilots that are cost-effective in the immediate future to quickly reduce ratepayer burdens,
that demonstrate their value as market transformation opportunities, and that help grow consumer
confidence in emerging technologies.
c) Develop a methodology to collect and analyze quantitative and qualitative data to inform future
programs.
d) Engaging upfront with labor unions and workforce advocates for a just transition of the gas
workforce and for full utilization of pilots as opportunities for training and workforce development.
Proposed Geographical Electrification Framework
In this report, we propose a methodology for the prioritization and selection of neighborhoods for a
geographically-targeted electrification approach. There are many challenges to creating a geographical
decision framework, including how to determine which neighborhoods should transition first, what
neighborhood characteristics or data will be used to select communities, how to identify distribution
53
Common Spark Consulting (2021). The Flipside Report: A White Paper on Targeted Geographic Electrification in California’s Gas
Transition.
13Isabelle Hens and Emily Lamon | PUBPOL 290: Energy Regulation and Public Policy | Spring 2021
branches of the natural gas system that are strong candidates for retirement,54 and how to successfully
achieve electrification projects in the selected areas.55 Our geographically-targeted framework draws upon
the physical natural gas transmission and distribution infrastructure, community health risk and pollution
burden, and low-income communities.
Key Considerations
In order to identify neighborhoods for prioritized electrification, we consider the physical infrastructure of the
investor-owned utility natural gas system and community characteristics such as pollution burden and
income level. We will use gas utility’s transmission and distribution pipeline maps, the California Housing
Partnership Affordable Housing map, and CalEnviroScreen to identify areas that are vulnerable to health risks
and financial impacts.
Gas Infrastructure
To achieve a geographically-targeted approach to electrification, natural gas branch infrastructure needs to
be identified that could be decommissioned independently of the natural gas system at large. We are
targeting natural gas distribution branches that serve dedicated neighborhoods or areas, and that do not
provide a through-path to other portions of the city. This approach is also called pruning, trimming, or zoning
of the gas infrastructure. Branches that meet this criterion are identified as good candidates for independent
decommissioning.
There are two types of gas pipelines: transmission lines and distribution lines. The crucial distinction between
these two types of pipelines is the type of customers they serve. Transmission lines are high-pressure
pipelines that mostly deliver gas to large-volume, noncore customers, such as electric generators, industrial
customers, and large commercial customers. These transmission lines supply gas to distribution lines, which
are lower-pressure pipelines that deliver gas to noncore customers who are not served by the transmission
network, and to core customers, such as residential and small commercial customers.56
Noncore customers are often more difficult to electrify than core customers. These “hard-to-decarbonize”
sectors might benefit from the use of renewable natural gas (RNG), a resource that will likely remain too
limited and expensive to decarbonize the building sector.57 Therefore, initial efforts to decommission gas
infrastructure are likely to be focused on distribution lines rather than transmission lines. However, limited
data is publicly available on the distribution infrastructure of PG&E and SoCalGas.
54
California Energy Commission (2020). The Challenge of Retail Gas in California’s Low-Carbon Future.
55
California Energy Commission (2020). The Challenge of Retail Gas in California’s Low-Carbon Future.
56
CPUC (n.d.). Natural Gas and California. https://www.cpuc.ca.gov/natural_gas/
57
RMI, Mina Lee & Sherri Billimoria (2021). Eight Benefits of Building Electrification for Households, Communities, and Climate.
14Isabelle Hens and Emily Lamon | PUBPOL 290: Energy Regulation and Public Policy | Spring 2021
While the San Francisco Bay Area in Northern California is served by PG&E, a utility company that provides
both gas and electric service, the Los Angeles Area in Southern California is served by SoCalGas, a utility
that provides exclusively gas service. As a result, both areas might experience different levels of adoption or
resistance from the utilities as efforts start to shift towards gas infrastructure decommissioning and
subsequent electrification, and therefore, they will require different strategies.
Public Health
This methodology considers communities with high health risks due to vulnerabilities caused by outdoor air
pollution. Communities with high exposure to outdoor pollutants will likely also experience increased levels of
air pollutants indoors, due to the direct connection between outdoor and indoor air quality.58 The
CalEnviroScreen pollution burden metrics are used to identify communities with significant pollution burdens.
Targeted funding for identified areas in support of the transition to electricity will reduce the production of
combustion pollutants in the outdoor and indoor environments, improving air quality and resulting in positive
impacts on community health.
Low-Income Communities
Additional funding needs to be provided to support low-income communities through the transition from
natural gas to all-electric infrastructure to prevent these communities from being the last remaining customers
served by the natural gas system. We are proposing to use CalEnviroScreen to identify qualified
communities.
Methodology
In this section, we will outline our methodology to identify priority neighborhoods during the electrification
transition. Our process includes the following steps:
1) Use CalEnviroScreen to identify areas of interest. This can be based on the overall CalEnviroScreen
results or specific indicators, such as prevalence of asthma, concentration of ozone and PM2.5, and
housing-burdened low-income households.
2) Use natural gas pipeline maps to identify branches that serve only a small, dedicated area and thus
could be decommissioned independent of the larger system.
3) Use the Affordable Housing Map to understand the locations of affordable housing developments
and prioritize the electrification of these tenants to prevent risk of high natural gas utility bills in the
future.
58
EPA (n.d.). Report on the Environment: Indoor Air Quality. https://www.epa.gov/report-environment/indoor-air-quality
15Isabelle Hens and Emily Lamon | PUBPOL 290: Energy Regulation and Public Policy | Spring 2021
4) Use the Affordable Housing Map to identify the vintage of an affordable housing development. Give
priority to older developments which may have older, less-efficient appliances resulting in increased
energy costs to tenants and higher risk of indoor air pollutants.
Input Parameters
We used the following input parameters to identify neighborhoods for priority electrification: natural gas
pipeline maps from two large investor-owned utility gas providers in California, Pacific Gas and Electric
(PG&E) and Southern California Gas Company (SoCalGas), the Affordable Rental Housing Benefits Map from
the California Housing Partnership, and CalEnviroScreen.
PG&E - Gas Pipeline Map
Pacific Gas and Electric (PG&E) is the company that delivers natural gas and electric service to approximately
16 million people in a 70,000-square-mile service territory throughout northern and central California, from
Eureka to Bakersfield.59 This report uses a map of PG&E’s gas transmission pipelines.60 While PG&E has a
map with electric distribution circuits that indicates the number of residential, commercial, and industrial
customers for each circuit,61 we could not find similar data on PG&E’s gas distribution infrastructure.
SoCalGas - Gas Pipeline Map
Southern California Gas Company (SoCalGas) is the company that delivers natural gas to approximately 21.8
million people in a 24,000-square-mile service territory throughout central and southern California, from
Visalia to the Mexican border.62 This report uses a map of SoCalGas’ gas transmission pipelines and
high-pressure distribution pipelines63 to locate current gas infrastructure in that area. The SoCalGas map
does not include low-pressure distribution lines, which would give a more detailed picture of how gas is
transported to individual homes.
California Housing Partnership - Affordable Rental Housing Benefits Map
The California Housing Partnership is a private nonprofit organization that acts as a trusted advisor for
nonprofit and local government partners as well as elected officials to create and preserve sustainable
affordable housing.64 The Affordable Rental Housing Benefits Map is a tool that provides “quantitative
estimates of social and economic benefits of affordable housing for individual residents and families,
59
PG&E (n.d.). Company Profile. https://www.pge.com/en_US/about-pge/company-information/profile/profile.page
60
PG&E (n.d.). Explore our Natural Gas Transmission Pipeline Map.
61
PG&E (n.d.). Solar Photovoltaic (PV) and Renewable Auction Mechanism (RAM) Program Map.
62
SoCalGas (n.d.). Company Profile. https://www.socalgas.com/about-us/company-profile
63
SoCalGas (n.d.). Gas Transmission Pipeline Interactive Map.
64
California Housing Partnership (n.d.). About Us. https://chpc.net/about-us/
16Isabelle Hens and Emily Lamon | PUBPOL 290: Energy Regulation and Public Policy | Spring 2021
taxpayers, and the local economy”.65 Affordable housing for low-income households is defined as housing for
which the cost is no more than 30% of the gross household income. The California Department of Housing
and Community Development defines low-income households as households who make less than 80% of
the area median income.66
The map contains detailed information on affordable housing with funding from the United States Department
of Housing and Urban Development (HUD), the United States Department of Agriculture (USDA), and
Low-Income Housing Tax Credit (LIHTC). The map also contains CalEnviroScreen 3.0, a Tax Credit Allocation
Committee (TCAC) and California Department of Housing and Community Development (HCD) Opportunity
Map, Federal Opportunity Zones, and California Assembly Bill 1550 (AB 1550) Low-Income Communities. At
the time of writing, the property-level data was last updated on September 1, 2020.67
CalEnviroScreen
CalEnviroScreen is a mapping tool developed by the California Public Utilities Commission that uses
environmental, health, and socioeconomic information to help identify California disadvantaged communities.
CalEnviroScreen defines disadvantaged communities as “areas throughout California which most suffer from
a combination of economic, health, and environmental burdens”.68
The tool uses data from state and federal government sources to produce scores for every census tract.
Scores are determined for two groups of indicators, population characteristics and pollution burden, and
higher scores indicate a higher prevalence of a given parameter.69,70 Population characteristics scores consist
of sensitive population indicators such as occurrence of asthma, cardiovascular disease, and
low-birth-weight infants; and socioeconomic factor indicators such as educational attainment,
housing-burdened low-income households, linguistic isolation, poverty, and unemployment.71
Population characteristics related to biological traits, health status, and community can result in increased
vulnerability to pollution.72 The pollution burden scores consist of indicators for exposure to ozone, particulate
matter (PM) 2.5, diesel particulate matter, drinking water contaminants, pesticide use, toxic releases from
facilities, traffic density, hazardous waste, and solid waste among others.73
65
California Housing Partnership (n.d.) Affordable Housing Benefits Map.
66
Housing and Community Development (n.d.). Income Limits. https://www.hcd.ca.gov/grants-funding/income-limits/index.shtml
67
California Housing Partnership (n.d.) Affordable Housing Benefits Map.
68
CPUC (n.d.). Disadvantaged Communities. https://www.cpuc.ca.gov/discom/
69
OEHHA (n.d.). Maps & Data: CalEnviroScreen 3.0 Maps. https://oehha.ca.gov/calenviroscreen/maps-data
70
OEHHA (n.d.). About CalEnviroScreen. https://oehha.ca.gov/calenviroscreen/about-calenviroscreen
71
CalEPA & OEHHA (2017). Update to the California Communities Environmental Health Screening Tool.
72
OEHHA (n.d.). Maps & Data: CalEnviroScreen 3.0 Maps. https://oehha.ca.gov/calenviroscreen/maps-data
73
OEHHA (n.d.). CalEnviroScreen Overall Results and Individual Indicator Maps.
17Isabelle Hens and Emily Lamon | PUBPOL 290: Energy Regulation and Public Policy | Spring 2021
In addition to looking at the overall pollution burden and overall population characteristics, this report focuses
on three health indicators related to natural gas and two income characteristics related to low-income
housing. The health indicators are asthma (nitrogen oxides and particulates released indoors due to burning
of natural gas can cause asthma attacks), ozone (volatile organic compounds from the natural gas chain
contribute to the formation of ozone)74, and PM 2.5 (particulate matter is released when natural gas is
burned). The income indicators are poverty (which means that the total income before taxes is less than the
poverty level defined by the U.S. Census Bureau)75 and housing burden (which means “households that are
both low-income and highly burdened by housing costs”).76
There are multiple definitions used by different utility and state government incentive programs to identify
low-income communities for investment. Some programs use CalEnviroScreen, others identify low-income
communities by the average area income. CalEnviroScreen has limitations and critiques, including the
high-level nature of the data presented and the non-capture of “hyperlocal impacts”77, the observation that
the tool “may deprioritize rural and tribal lands”78, the tool “does not incorporate climate impacts and
resilience considerations”79, and the tool omits “race and ethnicity indicators”.80 Perhaps most importantly,
some critics feel that the tool was developed without sufficient stakeholder engagement and discussion. This
has caused some communities to feel “left out or insufficiently prioritized” by the tool if their community has
not been identified as a qualified region for state investment.81
However, CalEnviroScreen is commonly used to allocate federal and state funds throughout the state of
California, including the reinvestment of proceeds from the cap-and-trade market through the California
Climate Investments (CCI) program broadly and the Transformative Climate Communities (TCC) program
specifically.82 Because of its widespread use in California, and its use as a template for a federal mapping tool
that the Biden administration is developing,83 CalEnviroScreen was deemed the appropriate classification
system to use for this study.
At the time of writing, CalEnviroScreen 4.0 was in the draft stage, so CalEnviroScreen 3.0 was used for the
analysis. CalEnviroScreen 4.0 will contain more recent data, improved calculations of some indicators to
74
Lesley Fleischman (2019). “How Does Natural Gas Production Contribute to Ozone Pollution?”. Clean Air Task Force.
75
OEHHA (n.d.). CalEnviroScreen Overall Results and Individual Indicator Maps.
76
OEHHA (n.d.). CalEnviroScreen Overall Results and Individual Indicator Maps.
77
Aimee Barnes (2021). Mapping Environmental Justice in the Biden-Harris Administration. Center for American Progress.
78
Aimee Barnes (2021). Mapping Environmental Justice in the Biden-Harris Administration. Center for American Progress.
79
Aimee Barnes (2021). Mapping Environmental Justice in the Biden-Harris Administration. Center for American Progress.
80
Aimee Barnes (2021). Mapping Environmental Justice in the Biden-Harris Administration. Center for American Progress.
81
Aimee Barnes (2021). Mapping Environmental Justice in the Biden-Harris Administration. Center for American Progress.
82
Aimee Barnes (2021). How the Biden Administration’s Environmental Justice Mapping Tool Can Identify and Target Benefits to
Disadvantaged Communities. Legal Planet.
83
Aimee Barnes (2021). How the Biden Administration’s Environmental Justice Mapping Tool Can Identify and Target Benefits to
Disadvantaged Communities. Legal Planet.
18Isabelle Hens and Emily Lamon | PUBPOL 290: Energy Regulation and Public Policy | Spring 2021
better reflect environmental conditions or pollution vulnerability, and a new indicator for children’s lead risk
from housing.84
Analysis of San Francisco Bay Area and Adjacent Central Valley
This section looks at the overall CalEnviroScreen results, the pollution burden, asthma, ozone, PM 2.5, the
population characteristics, poverty, and housing burden for the San Francisco Bay Area and the adjacent
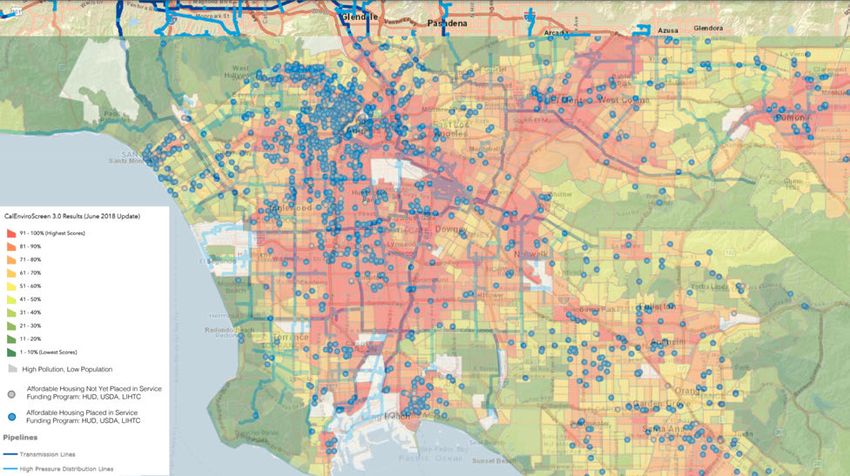
Central Valley region. Figure 2 shows the overall results of CalEnviroScreen, where red areas represent the
highest percentiles of the overall score (indicating the most disadvantaged areas) and green areas are the
lowest percentiles. The dots indicate affordable housing units funded by HUD, USDA, and LIHTC. Blue dots
indicate units that have been placed in service and grey dots indicate units that have not been placed in
service. The dark blue lines indicate the locations of PG&E’s natural gas transmission pipelines.
This map shows that disadvantaged areas are concentrated around the San Francisco Bay Area and in the
Central Valley, and affordable housing is mostly located around the San Francisco Bay Area. To identify areas
of interest, we can study indicators related to public health and income.
Figure 2: CalEnviroScreen overall results, affordable housing with funding from HUD, USDA, and LIHTC,
and PG&E gas transmission pipelines in the San Francisco Bay Area and the adjacent Central Valley.
84
OEHHA (n.d.). Draft CalEnviroScreen 4.0. https://oehha.ca.gov/calenviroscreen/report/draft-calenviroscreen-40
19Isabelle Hens and Emily Lamon | PUBPOL 290: Energy Regulation and Public Policy | Spring 2021
Public Health
Figures 3, 4, 5, and 6 show the CalEnviroScreen pollution burden, asthma occurrence, ozone concentration,
and PM 2.5 concentration. On all maps, the darkest areas are regions most burdened by a particular
indicator, and PG&E transmission pipelines are indicated by dark blue lines. In addition, Figure 4 shows the
location of emergency departments and Figures 5 and 6 show the location of monitors used to measure
ozone and PM 2.5 concentrations.
The pollution burden is highest for many of the same areas which have the highest overall CalEnviroScreen
scores (Figure 2). However, asthma occurrence is more concentrated in the East Bay (Berkeley, Oakland,
San Leandro, Hayward) and the northern Central Valley (from Vallejo in the west to Stockton in the east).
Ozone and PM 2.5 concentrations are highest around Stockton, Modesto, and Turlock. This indicates that
the Central Valley should not be overlooked in electrification efforts.
Figure 3: CalEnviroScreen pollution burden and PG&E gas transmission pipelines in the San Francisco Bay
Area and the adjacent Central Valley.
20Isabelle Hens and Emily Lamon | PUBPOL 290: Energy Regulation and Public Policy | Spring 2021
Figure 4: CalEnviroScreen asthma and PG&E gas transmission pipelines in the San Francisco Bay Area and
the adjacent Central Valley.
Figure 5: CalEnviroScreen ozone and PG&E gas transmission pipelines in the San Francisco Bay Area and
the adjacent Central Valley.
21Isabelle Hens and Emily Lamon | PUBPOL 290: Energy Regulation and Public Policy | Spring 2021
Figure 6: CalEnviroScreen PM 2.5 and PG&E gas transmission pipelines in the San Francisco Bay Area and
the adjacent Central Valley.
Low-Income Communities
Figures 7, 8, and 9 show the CalEnviroScreen population characteristics, poverty, and housing burden. On all
maps, the darkest areas are regions most burdened by a particular indicator, and PG&E transmission
pipelines are indicated by dark blue lines.
The population characteristics again show that the most disadvantaged communities are located around the
San Francisco Bay and in the Central Valley. However, the poverty and housing burden maps help us focus
on communities that are particularly disadvantaged in terms of income and housing. Figure 8 shows a
concentration of poverty around Stockton, Modesto, and Turlock in the Central Valley. Figure 9 shows that
the housing burden is largest for people living in a few concentrated areas, including Oakland, San Jose,
Stockton, and Modesto.
22Isabelle Hens and Emily Lamon | PUBPOL 290: Energy Regulation and Public Policy | Spring 2021
Figure 7: CalEnviroScreen population characteristics and PG&E gas transmission pipelines in the San
Francisco Bay Area and the adjacent Central Valley.
Figure 8: CalEnviroScreen poverty and PG&E gas transmission pipelines in the San Francisco Bay Area and
the adjacent Central Valley.
23Isabelle Hens and Emily Lamon | PUBPOL 290: Energy Regulation and Public Policy | Spring 2021
Figure 9: CalEnviroScreen housing burden and PG&E gas transmission pipelines in the San Francisco Bay
Area and the adjacent Central Valley.
Case Study Central Valley: Stockton
Figure 10 uses Stockton as a case study of a geographically-targeted approach for electrification. Red areas
are in the highest percentiles of the overall score (indicating the most disadvantaged areas) and green areas
are the lowest percentiles. The dark blue lines are PG&E’s gas transmission pipelines. The dots indicate
affordable housing units funded by HUD, USDA, and LIHTC. Blue dots indicate units that have been placed
in service (with the year they have been placed in service) and grey dots indicate units that have not been
placed in service. While some older units are located on the periphery of Stockton, there is a clear
concentration of affordable housing units in the center of the city, with years placed in service ranging from
1972 to 2019. This area has been indicated as a priority zone for electrification.
24You can also read