An Overview of Hydropower Reservoirs in Brazil: Current Situation, Future Perspectives and Impacts of Climate Change - MDPI
←
→
Page content transcription
If your browser does not render page correctly, please read the page content below
water
Review
An Overview of Hydropower Reservoirs in Brazil:
Current Situation, Future Perspectives and Impacts of
Climate Change
Viviane de Souza Dias 1 , Marta Pereira da Luz 2, *, Gabriela M. Medero 3 and
Diego Tarley Ferreira Nascimento 4
 1   Industrial and Systems Engineering Postgraduate Program-MEPROS, Pontifical Catholic University of
     Goiás, Av. Universitária 1.440, Setor Universitário, Goiânia CEP 74605-010, Goiás, Brazil;
     engvivianedias@gmail.com
 2   Eletrobras Furnas, Industrial and Systems Engineering Postgraduate Program-MEPROS, Pontifical Catholic
     University of Goiás, BR153, km 510, Zona Rural, Aparecida de Goiânia CEP 74923-650, Goiás, Brazil
 3   School of Energy, Geoscience, Infrastructure and Society, Heriot-Watt University, Edinburgh EH14 4AS, UK;
     G.Medero@hw.ac.uk
 4   Geography, Teacher and Humanities Training School, Pontifical Catholic University of Goiás,
     Av. Universitária 1.440, Setor Universitário, Goiânia CEP 74605-010, Goiás, Brazil; diego.tarley@gmail.com
 *   Correspondence: martaluz@furnas.com.br; Tel.: +55-062-3239-6550

 Received: 13 March 2018; Accepted: 25 April 2018; Published: 3 May 2018

 Abstract: Global climate change, related to the greenhouse gases emission, impacts hydroelectric
 power generation mainly due to the increase in air temperature and changes in the precipitation
 patterns. As a consequence, it affects basin evapotranspiration process, runoff, sediment transport
 as well as evaporation of reservoirs. This study analysed the current and future Brazilian context of
 hydroelectric reservoirs and investigated the potential impacts of climate change on hydropower
 generation and possible mitigation adjustments, giving relevant examples from around the world.
 Moreover, it is key to consider other factors that influence the availability of water resources such as:
 (a) upstream development of reservoirs, mainly the development of agricultural systems, which can
 contribute to increased water demand; (b) changes in land use, which can have an impact on soil
 degradation and sediment transport. Hydroelectric dams are a possible alternative to mitigate the
 impacts of climate change considering that those impacts could generate the need of adaptive actions.
 The assessment of climate change impacts’ projections anticipates possible future scenarios and can
 assist in strategic planning together with the definition of adaptive operational policies.

 Keywords: hydropower plants; climate changes; reservoirs; Brazil

1. Introduction
       Hydroelectric plants are the main sources of electricity in some countries (e.g., Paraguay, Norway,
Brazil, Austria and Canada). Hydropower contributes about 85% of global renewable electricity [1,2].
It is the main source of renewable energy in South America, followed by biofuels [3]. In several regions
of the world (e.g., Southeast Asia and South America), the hydroelectric plants are one of the pillars for
the production of renewable energy, but, at the same time, they are vulnerable to the impacts of climate
change [4]. These changes are causing the majority of the variations in hydroelectric potential [5].
Other factors, such as changes in land use and demand for upstream irrigation, can also influence
water availability for energy generation [5–7].
       Brazil has one of the largest hydroelectric potentials and it is believed that hydroelectricity will
continue to play an important role in the next ten years [8]. In the country, 80% of the energy generated

Water 2018, 10, 592; doi:10.3390/w10050592                                        www.mdpi.com/journal/water
Water 2018, 10, 592 2 of 18
comes from renewable sources [9]. The Brazilian energy matrix is composed mainly of hydroelectric
plants (60.9%), followed by fossil fuels (16.11%), biomass (8.74%), eolic (7.52%), import (4.91%), nuclear
(1.20%) and solar (0.61%) [10]. The 85 solar power plants account for 1,021,602 kW of the installed
capacity, and only 0.61% of the energy matrix [10]. Even though the country has areas with high
solar irradiation, there are no available technologies for its deployment, showing a clear need for
investments in national technologies [11]. Most of the equipment required for the installation of solar
photovoltaic and concentrated solar thermal plants is imported, which implies high costs [12].
Regarding energy sources, hydroelectric plants are likely to be more affected by changes in
annual and seasonal precipitation as well as temperature increase [13,14], with smaller impact on other
energy system sources [15]. Two opposite sides must be considered in terms of energy generation and
climate change: on one hand, there is energy generation producing emissions (including hydroelectric;
through the decomposition of organic matter in reservoirs), which requires mitigation strategies; and,
on the other hand, the impact of climate change on renewable energy sources, requiring adaptation
strategies [13].
Water resource use for generation of energy is dependent on hydrological and climatic
conditions [4–6,8,15–19]. Global warming may influence the intensity and duration of rainfall,
the discharge volume of rivers, the increased evaporation rate of reservoirs and the amount of
evapotranspiration of plants [20]. Thus, these factors interfere in the water availability for energy
generation and may trigger indirect effects such as changes in land use and an increased demand for
irrigation [18].
Several impacts of climate change on hydroelectric reservoirs can be considered: hydrological
changes, variation in sediment load due to flooding, variation in volume and river flow due to changes
in precipitation, and the occurrence of extreme events (e.g., droughts and floods) that can generate the
need for dam design and safety improvements [1–6,8].
Hydropower reservoirs are less susceptive to climate change than run-of-river schemes due to
its storage capacity as well as being less seasonal flow dependent [18]. This resilience depends on
dry season duration [13]. The changes in the flow affect the level of reservoir and, consequently,
the capacity of energy generation [18,19]. In Brazil, there are expectations that future hydroelectric
installations will be of run-of-river due to environmental restrictions for the construction of large
reservoirs, resulting in the use of the total installed capacity of water flow schemes only during the
rainy season. In the dry season, other plants, such as thermoelectric plants, would need to be used to
meet the energy demand [21].
Climate change must be taken into account in the process of water resources planning and
management, so that measures are taken to adapt to future climate scenarios [6]. Adaptation
strategies for the operation of reservoirs should be implemented [5,16,22], since hydroelectric plants
are fundamental for electricity in Brazil [19].
Through a review of the literature, this study aims:
• To provide an overview of the current state of hydroelectric plants in Brazil, focusing on reservoir
plant types, providing insights into recent policies for the development of hydropower (Section 2);
• To assess the potential for new hydroelectric plants in the country (Section 3);
• To put the current state of hydroelectric plants in Brazil into context in comparison with other
countries (Section 4);
• To present the possible impacts of climate change on hydroelectric power generation. To analyse
and compare methodologies and results of studies that evaluate the impact of climate change on
energy generation by hydroelectric reservoirs (Section 5);
• To identify measures to adapt to future climate scenarios that have been the focus of studies in
Brazil and in other countries. (Section 6);
• To present a framework directed to the study of climatic and environmental impact on the
generation of hydroelectricity (Section 7).Water 2018, 10, 592 3 of 18
2. Current Situation of Brazilian Hydroelectric Plants
Brazil has a great hydroelectric potential, totalling 101,268,561 kW, which corresponds to 60.9%
of the energy matrix. There are 1313 operating plants ranging from hydroelectric generation centrals
(with up to 1 MW of power installed), small hydropower plants (between 1.1 MW and 30 MW)
and hydroelectric power plants (with more than 30 MW). The 218 hydroelectric power plants (HPP)
are responsible for 60.5% of the total installed capacity in the country, adding up to 95,619,468 kW.
The small hydroelectric plants (SHP), 428 in total, answer for 3.2% of the total installed power. The 667
hydroelectric generation centrals (HGC) in operation account for only 0.4% of the installed power [23].
The largest Brazilian hydroelectric power plant is Itaipu, located in the Paraná River [8]. After its
construction, the Belo Monte hydroelectric in the Amazon basin will be the third largest hydroelectric
power plant in the world (11,233 MW). The second largest is Itaipu, producing 14,000 MW, and the
largest in the world is the Three Gorges hydroelectric plant in China, producing 22,500 MW [2,8].
The main Brazilian plants with regularization reservoirs are presented in Table 1 and sorted by region
and importance in useful volume.
Table 1. Main Brazilian hydropower plants with reservoirs—based on data from [24].
Useful Volume Storable Useful Volume
Region Name River Power (MW)
(km3 ) (km3 /GW)
North Tucurui Tocantins 8370 38.98 4.7
North Balbina Uatuma 250 10.22 40.9
Northeast Sobradinho São Francisco 1050 28.67 27.3
Southeast/Midwest Serra da Mesa Tocantins 1275 43.25 33.9
Southeast/Midwest Furnas Grande 1312 17.22 13.1
Southeast/Midwest Tres Marias São Francisco 396 15.28 38.6
Southeast/Midwest Emborcaçao Paranaiba 1192 13.06 11.0
Southeast/Midwest Itumbiara Paranaiba 2280 12.45 5.5
Southeast/Midwest Nova Ponte Araguari 510 10.38 20.4
South Foz do Areia Iguaçu 1676 5.80 3.8
South Passo Real Jacui 158 3.36 21.2
The Serra da Mesa hydroelectric power plant on the Tocantins River has the highest useful volume,
at 43.25 km3 ; followed by the Tucurui plant, in the same river, at 38.98 km3 , which stands out in terms
of installed power at 8370 MW [24]. Usually the levels of the reservoirs are higher in the summer,
from December to March (more abundant rainy period), and lower between April and November,
when there is the dry season [8].
Recent studies addressed the current situation of SHP in Brazil, exposing regulations and policies
for the growth of the number of plants and the perspectives for the sector [25]. Brazilian SHPs are
expanding due to their characteristics of small area occupancy and minor environmental impact,
besides the possibility of installation closer to the places of consumption, which reduces the loss of
energy in the transmission and, consequently, results in a reduction of costs for the consumer.
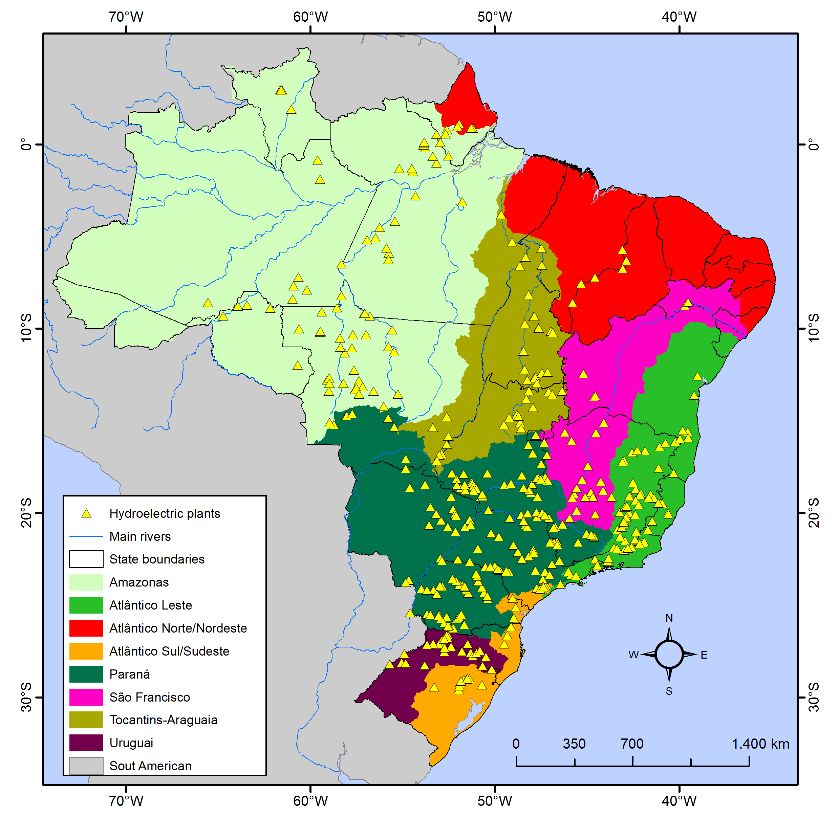
The main Brazilian hydroelectric reservoirs are in the Paraná river basin. The concentration
of hydroelectric power plants is higher in the Midwest, South and Southeast regions (Figure 1).
The Southwest region accounts for 70% of the energy storage capacity. The largest hydroelectric
reservoirs are installed near the regions of greatest demand. When full, these reservoirs can store
energy to meet the demands for five months, a much shorter period than that observed in the 1970s,
when the energy stored in the reservoirs, at maximum capacity, could meet the demand for three or
four years [26]. These changes arise as a result to the increase in energy demand caused by population
growth, in addition to climate and environmental changes.Water 2018, 10, 592 4 of 18
Water 2018, 10, x FOR PEER REVIEW 4 of 19
Figure
Figure 1.
1. Brazilian
Brazilian hydroelectric
hydroelectric plants by hydrographic
plants by hydrographic basin—based
basin—based on
on data
data from
from [27].
[27].
Recent Policies
Recent Policies for
for the
the Development
Development of
of Hydropower
Hydropower
In Brazil,
In Brazil,renewable
renewableenergy energysources
sources areare considered
considered fundamental
fundamental for sustainable
for sustainable development
development [28].
[28]. strategies
Two Two strategies with regard
with regard to thetoenergy
the energy
sectorsector
have have
been been incorporated
incorporated in Brazil,
in Brazil, one focusing
one focusing on a
on a clean
clean and renewable
and renewable energy energy matrix,
matrix, mainlymainly hydroelectric,
hydroelectric, andother
and the the other promoting
promoting efficient
efficient use
use and
and conservation [11]. However, the country needs to review current energy
conservation [11]. However, the country needs to review current energy policies in the context of policies in the context
of economic
economic growth
growth and to
and also also to consider
consider climateclimate
change,change, with investments
with investments in energyin energy renewable
efficiency, efficiency,
renewable
sources andsources and thetechnological
the necessary necessary technological
improvements improvements
[29]. [29].
Brazil has
Brazil has opted
opted to to increase
increase energy
energy security
security levels,
levels, increase
increase energy
energy generation
generation capacity,
capacity, and,
and,
with this
with this expansion,
expansion, environmental
environmental and and social
social problems
problems havehave arisen.
arisen. InIn order
order to avoid greater
to avoid greater
environmental impacts,
environmental impacts, the themain
mainstrategy
strategygoesgoestowards
towards newnewprojects for for
projects run-of-river.
run-of-river.However, this
However,
policy
this endsends
policy up affecting
up affectingthe generation of energy
the generation during
of energy dry dry
during periods, duedue
periods, to lesser river
to lesser flowflow
river [30].[30].
To
achieve
To achieveenergy
energy security,
security, thethe
country
countryhashasinvested
investedininhydroelectric
hydroelectricand andthermal
thermalplants,
plants, in in order
order toto
compensate for the lower generation of hydropower during
compensate for the lower generation of hydropower during dry periods [29]. dry periods [29].
In run-of-river
In run-of-riverschemes,
schemes,energyenergy costs
costs areare higher
higher due due
to thetopossibility
the possibility of inactivity
of inactivity in dry
in dry periods
periodsby
caused caused by theofabsence
the absence of a reservoir.
a reservoir. The construction
The construction timeon
time is shorter, is average
shorter, twoon average
years. With tworegard
years.
to environmental impacts, the cumulative effects of several run-of-river installed in the same in
With regard to environmental impacts, the cumulative effects of several run-of-river installed the
basin
same basin must be considered [8]. In addition, the implementation of run-of-river hydropowerWater 2018, 10, 592 5 of 18
must be considered [8]. In addition, the implementation of run-of-river hydropower plants can also
contribute to the increase of emissions indirectly, with the need to complement the hydroelectric
potential with thermoelectric plants [29].
In contrast, large reservoirs maximise electricity production, ensuring greater energy security
of the system during periods of drought [5,31]. However, some factors may affect the decision
on the construction of hydroelectric reservoirs such as: building time; greenhouse gas emissions;
fragmentation of the rivers; changes in water quality; relocating or displacing humans; interference in
migration and spawning fish.
The average building time of large dams is 8.6 years [32]. Since the 1990s, possible emissions from
reservoirs have attracted the attention of several researchers [33–36]. Even though it is a renewable
source of energy, there are potential greenhouse gas emissions from reservoirs, such as: methane
(CH4 ), nitrous oxide (N2 O), and carbon dioxide (CO2 ). Large amounts of organic matter remain in the
reservoir when the area is flooded, leading to the production of these gases. One of the major concerns
is the emission of methane [37]. According to Zarfl et al. [38], the quantitative emissions depend on
how water is released in dams. The release of deep water contributes most significantly for emissions.
Studies carried out in areas in riparian and grassland environments of the Belo Monte
hydroelectric complex (Pará) indicate that the most significant concentrations were CO2 with a daily
mean value of 10,448.41 ± 3036.48 mg m−2 for pasture and 8004.50 ± 1314.98 mg m−2 for forest [2].
The Belo Monte mill may produce 1 million tons of CO2 per year during the first ten years [12,39].
Dams such as Jirau and Santo Antônio will have lower emissions, due to the size of the reservoirs [40].
The amount of emissions varies according to the age of the reservoir, the type of land use before
impoundment, management practices, climatic conditions [1,2] and/or the location and morphometry
of the reservoir [38]. Moreover, it should also be noticed that greenhouse gas emissions in reservoirs
are higher in the first 10 years [39,40].
The construction of reservoirs also contribute to the fragmentation of the rivers, relocating or
displacing humans (especially of indigenous) [38], changes in water quality [41], interference in
migration and spawning fish, flooding and drainage of areas for fish production [42]. Pringle et al. [43]
relate some fish-related effects: population fragmentation and isolation, migration interference,
increases in exotic lentic-adapted species (non-native fishes) and the threat of extinction of some
species. Therefore, dams are fundamental for the maintenance of society; however, one must think
about environmental sustainability and socio-economic impacts, i.e., the best way to build, operate
and maintain dams [44].
3. The Potential for New Hydropower Plants in Brazil
Considering the focus of the hydroelectric expansion in the Amazon, due to the nearly exhausted
hydroelectric potential in other Brazilian regions [30], important environmental concerns are raised
regarding the hydroelectric potential in the Amazon region and studies reporting the impacts caused
by dams in this region, such as the emission of greenhouse gases due to flooding of forest areas, the loss
of conservation areas, changes in water quality, interference with the displacement and reproduction
of aquatic animals, a decline in biodiversity as well as social and cultural impacts [29,31].
The socio-environmental constraints and vulnerabilities of the use of hydroelectric potential,
for each Brazilian region, include flood risks in large areas (Northern region), few perennial rivers
(Northeast and South), border rivers, floods and agro-industrial pollution (Southeast) and border
rivers with high levels of sedimentation (Midwestern region) [30]. Most of the hydropower plants
under construction are located in the state of Mato Grosso and Parana (Table 2). The hydropower
reservoir (Sinop) and run-of-river (São Manoel) located in the Amazon basin are scheduled to start
operating in 2018 [45].Water 2018, 10, 592 6 of 18
Table 2. Hydroelectric plants: Under construction and planned—data from [23].
Under Construction Planned
Power Generated Power Generated
Plant River/State Plant River/State
(kW) (kW)
Sinop 400,000 Teles Pires/MT Pai Querê 292,000 Pelotas/RS e SC
Baixo Iguaçu 350,200 Iguaçu/PR Itaocara I 150,000 Paraíba do Sul/RJ
Colíder 300,000 Teles Pires/MT Santa Branca 62,000 Tibagi/PR
São Roque 141,900 Canoas/SC São João 60,000 Chopim/PR
Tibagi Montante 32,000 Tibagi/PR Itumirim 50,000 Corrente/GO
Ponte de Pedra 30,000 Ponte de Pedra/MT Cachoeirinha 45,000 Chopim/PR
Bom Retiro 35,180 Taquari/RS
4. Comparison to Other Countries
Most of the large dams around the world were built between the years of 1950–1989 and are
related to population growth and consequently increased energy consumption. Regarding their main
use, 39% were built for power generation, 29% for irrigation, 14% for flood control, 8% for water supply
and 10% for other uses [44]. The reduction in growth rate of number dams built since the 1990s is due
to social and environmental concerns, high financial costs and reduction of favorable locations [44].
In Brazil, there was an increase in the deployment of large hydroelectric plants in the 1960s and 1970s
due to changes in tax criteria, followed by a reduction in construction of new developments in the
1980s and 1990s due to higher inflation and two oil shocks [46].
The five largest producers of hydroelectricity in the world are: China, Canada, Brazil, the United
States and Russia [47]. According to estimates, hydroelectric production may double by 2050,
contributing to the reduction of CO2 emissions from fossil fuel plants [1]. When predicting population
growth, water, food, energy consumption and dam development from 2010–2050, Chen et al. [44]
foresee about 36,813 dams worldwide, with a total reservoir capacity of 9204 km3 in 2050, and, in 2010,
there were 32,473 dams with a capacity of 7975 km3 . In terms of energy consumption, the estimate is
an increase from 134,000 to 183,000 TW h.
Future dams will be concentrated in developing countries and emerging economies (Southeast
Asia, South America and Africa). Approximately 75% of the dams will be of medium and small
size (1–100 MW) and 93% of the future hydroelectric power capacity will be provided by large dams
(more than 100 MW). In Brazil, the dams under construction are concentrated in the North and South
regions and those planned are in the South and Southeast regions of the country [38].
5. Possible Impacts of Climate Change on the Generation of Hydroelectricity
The increase in greenhouse gas emissions and consequently climate change demonstrates
having an impact on energy production in Brazil, as well as in other countries that rely heavily
on hydropower [29]. Climate change affects the performance and safety of dams in various ways [14],
such as: increased sediment load of rivers, impacting turbine operation and loss of storage; increasing
reservoir surface evaporation, reducing the amount of water available; generating changes in rainfall
and river flows, interfering with the turbines full capacity operation; and increasing the magnitude of
floods that can lead to failures in dams. The main factors that interfere in the generation of hydroelectric
power globally [13] are:
• Reduction in average precipitation that implies a reduction in runoff (three to four times).
• Increase in average precipitation. Depending on storage and turbine capacity, increased
precipitation can lead to an increase in power generation potential. However, this does not
always occur, considering that plants are designed for a certain river flow, and the increase of this
flow would only lead to unproductive spills.
• Increase in average temperature. Rising temperatures will affect soil moisture levels, interfering
with the runoff and storage of water in dams. In addition, increase of temperature causes changes
in atmospheric pressure and wind patterns. These changes can alter the precipitation patterns [30].Water 2018, 10, 592 7 of 18
• Extreme droughts. Depending on the duration of the drought period, the reservoirs act as a buffer,
maintaining normal power generation capacity.
• Flooding. It entails sediment loads beyond what is expected, and depending on installed capacity,
they do not always bring benefits in terms of increasing the potential for generating power.
There are also the indirect impacts of climate change: water scarcity and competition among other
sectors (e.g., agriculture, industries, urban consumption); soil degradation and siltation, depending
on the vulnerability of the soil to the action of rainwater and river, scarcity of vegetation and soil
desiccation during periods of drought, promoting erosion and transport of sediments to reservoirs [13].
The most cited studies in the literature on the impact of climate change on hydroelectric power
production are that of Christensen et al. [48] and Lehner et al. [49]. Lehner et al. [49] analysed the effects
of global changes on Europe’s hydroelectric potential by applying the WaterGAP model (Water-Global
Assessment and Prognosis) [50] for runoff calculations and compared current climate and water use
conditions with future scenarios. The study pointed out severe future changes in the discharge regimes
that will lead to instability in the European hydroelectric potential that could be reduced by 6% by the
2070s. Christensen et al. [48] simulated future climatic conditions and their effects on the Colorado
River basin. The results of this study indicated warming, reduced precipitation, decreased runoff and
a significant reduction in annual hydroelectric power generation: 56% (2010–2039); 45% (2040–2069);
and 53% (2070–2098) in relation to the simulated history.
For South America, the projections indicate an increase in temperature and an increase
(or decrease) in precipitation up to 2100; for some regions, there are large uncertainties related to
precipitation. Warming varies from 1.7 to 6.7 ◦ C by 2100 and precipitation varies according to the
region (−22% in Northeastern Brazil, +25% in South-Eastern South America). In Brazil, the Amazon is
highlighted as a hotspot of global warming, a region most vulnerable to climate change [3].
In Brazil, few studies have evaluated the impacts of climate change on hydropower
reservoirs [21,51]. Some studies have more generally evaluated the impact on river basins, not directly
evaluating hydroelectric reservoirs [52,53]. Other studies analysed the vulnerability of hydroelectric
generation to changes in climate [30,54].
Soito and Freitas [30] reported the risks to energy security in Brazil; the generation of electricity
depends significantly on the hydrological availability that can be threatened by increasing water
demands (driven by demographic growth and economic development), droughts in the Northeast,
and degradation of rivers in the Southeast region (pollution, silting, etc.). In a more recent study,
Sorribas et al. [53] examined projections of climate change (2070–2099) and their impacts on discharges
from the Amazon basin and identified that, for some regions of the basin, there will be an increase
in river discharge (Northwest, annual mean +9%) and, for other regions (central Amazon, annual
minimum −15.9%), there will be a possible reduction of flow in dry seasons, which may impact the
generation of energy from future hydroelectric plants.
Lucena et al. [21] evaluated the impacts of climate change on Brazilian river basins. The results
point out a tendency for reduction in average annual flow in the period 2071–2100, mainly in the
Parnaíba (−10.3%), São Francisco (−26.4%) and Tocantins-Araguaia (−15.8%) basins (North and
Northeast regions of Brazil). In the South and Southeast regions, impacts will not be significant, so,
in these regions, reservoir management would mitigate the effects of climate change. According to
the results of an investigation by Ribeiro Júnior et al. [51], if climate change scenarios are confirmed,
Furnas reservoir levels may decline sharply. The authors proposed a methodology that considers the
determination of the length and transgression frequency of level to minimise the conflicts of water use
and the impacts on the generation of energy.
Analysis conducted by Nóbrega et al. [55] in the Grand river basin showed an increase in average
river flow at the Agua Vermelha reservoir (+10% in the A2 Scenario, from 2508 m3 s−1 to 2748 m3 s−1 ).
Still, according to the study, the increase of 3 ◦ C in global mean temperature can result in an increase
in average river flow by 24% (from 2475 m3 s−1 to 3070 m3 s−1 ) generating flood risks. However,
some projections indicate a reduction in average river flow by up to 20%.Water 2018, 10, 592 8 of 18
In assessment of climate change impacts on river basins, there are uncertainties about greenhouse
gas (GHG) emission scenarios and global circulation models (GCMs), as well as uncertainties
regarding downscaling and hydrological modelling [6]. GCMs produce climate projections, providing
information on climate uncertainties and water availability more roughly, and are used directly
in forecasting runoff in more general studies [14]. The simulations of climate change impacts are
generally carried out with a control period and future scenarios of 30 years, comprising three phases
of simulation, namely: model development, control simulation (base period), and simulation of future
scenarios [4], in addition to using different variables (Figure 2).
Global scale
Emission Global climate Global
scenario model climate
Regional scale Regional
Electricity
climate model market
model
Time series Regional Electricity
generator Climate prices
Local scale
Precipitation
temperature
Landuse Hydro.-hydraul.
model model
Water Streamflow,
Land use sediment, ...
levels, ...
Ecosystem Management
model model
Ecosystem Water Electricity
quality release production
Figure 2. Scheme for simulating the impact of climate change from Schaefli [4].Water 2018, 10, 592 9 of 18
Assessing the impact of climatic changes in impoundment schemes is rather complex [4,18],
requiring information such as inter-basin transfers and design specifications. The existing literature
generally evaluates single locations, not establishing how to include multiple sites at national or
regional levels, due to the need for detailed information on the operational behavior of each site.
As reservoirs can serve different uses (e.g., irrigation), the indirect impacts of climate change on
hydroelectric dams should also be evaluated [19].
The meteorological variables temperature and precipitation are important in climate change
studies for hydroelectric management [13,16,20,56,57]. Some authors only model precipitation,
considering it the higher impact factor on the availability of water for power generation [21].
Other authors propose a combined study between climatic changes and changes in land use [6,7] or
between climate changes and demands for irrigation [5]. The inclusion of sediment load assessment in
hydroelectric basins tends to be a significant contribution to the study of hydrological models. Another
approach complements the gap: the need for an analysis of water demand, mainly for irrigation.
Some studies adopt only one scenario, not considering the different views of the general
circulation models on the evolution of the climate and its repercussion in terms of the river basins,
different from the one done by Haguma et al. [6], López-Moreno et al. [7], Gaudard et al. [17] and
Parkinson et al. [57]. The use of several scenarios assists in the estimation of different uncertainties
involved in hydro-climatic modelling [57], such as parameter uncertainty and model structural
uncertainty. Climate models that consider a multi-model set, such as ENSEMBLES or CMIP5, provide
more reliable assessment since they include different uncertainties [4].
Table 3 presents some insights on the possible climatic changes and their consequences in the
runoff, flow of the rivers and generation of energy in hydroelectric reservoirs. The table includes the
methodology used in each study to evaluate how different uncertainties (observational uncertainty,
parameter uncertainty and model structural uncertainty) were included. A comparison between Brazil
and other countries was also carried out.
In order to assess the impacts of climate change on water resources, it is necessary to predict
the runoff of the basin. A model commonly used is the IHACRES, introduced by Jakeman
and Hornberger [58], which interfaces climate change input data (temperature and precipitation).
The IHACRES is a rainfall–runoff model used to calculate the flow of a river, considering
climatic changes.
In some regions, such as in Canada, Manic-5 and Toulnustouc reservoirs, studies indicated
positive effects in relation to climate change and power generation. These results are associated with
the specific characteristics of the basins; however, as highlighted by the authors, in the long-term,
global warming will provide potential negative effects on energy generation [6].Water 2018, 10, 592 10 of 18
Table 3. Methodologies and main results of studies on impacts of climate change on reservoir management.
Simulation and
Climate Model and Greenhouse Components of the
Study Local Downscaling Method Hydrologic Model Optimization Future Periods Main Results (Projected Changes)
Emission Scenarios (IPCC) Model
Approach
Non-dominated Temperature: −1.35, −1.45 and −2.20 ◦ C;
IHACRES 2025–2039
Karoon-4 reservoir a b Temperature and sorting genetic Precipitation: −18%, −0.4% and −30%;
[16] HADCM3 model (GCM), A2 Proportional approach rainfall-runoff 2055–2069
(Iran) precipitation algorithm II Inflow to the Karoon4 reservoir would
model c [58] 2085–2099
(NSGA-II) decline in the future periods.
Mauvoisin reservoir Temperature, Inflows are expected to decrease at average
10 regional climate models (RCM) Glacier Evolution
and Chanrion scenarios of energy Threshold by 18% from 2001–2010 to 2091–2100;
[17] Ensembles project Delta method Runoff Model 2011–2100
run-of-river power consumption and Accepting Power generation: −20%;
(ensembles-eu.metoffice.com), A1B (GERM) [59,60]
plant (Switzerland) prices Power generation after optimization: −16%.
Temperature increase;
Systems dynamics
Khersan 1, Karoon 3 2025–2039 Decrease of precipitation and inflow;
Temperature and (SD)/Nonlinear
[20] and Karoon 4 reservoirs HADCM3 model (GCM), A2 Proportional approach IHACRES model 2055–2069 Power generation (simulation
precipitation programming
(Iran) 2085–2099 multi-reservoir after optimization): −23%,
(NLP)
−7% and −34%.
Temperature increase; Increased
Downscaled climate precipitation trend in most seasons and
Reservoirs and Variable Infiltration
8 GCM with 23 downscaled projections of Pacific Temperature and Robust annually; More runoff available in the
[57] run-of-river schems Capacity (VIC) 2050
climate projections, A1B, A2 e B1 Climate Impacts precipitation optimization winter and spring seasons, and with drier
(Canada) model [61]
Consortium (PCIC) conditions in the summer; Hydropower
potential: +11%.
Reservoirs (Manic-5 Temperature, Temperature (2070–2099): +3 to +10 ◦ C;
Sampling
and Toulnustouc) and precipitation, relative Precipitation in the winter (2070–2099): +5
Climate model ensemble Downscaling method Soil and Water Stochastic 2010–2039
run-of-river humidity, solar to +60%; Annual inflow volume: +4.3%,
[6] (13 GCM) proposed by Assessment Tool Dynamic 2040–2069
hydropower plant radiation, wind speed, +9.1% and +13.5%; Average annual power
A1B, A2 and B1 Widmann et al. [62]. (SWAT) Programming 2070–2099
(Manic-1, Manic-2 and topography and soil generation: +4.2%, +8.7% and +14.1%);
(SSDP)
Manic-3) (Canada) types and land uses Unproductive Spills increase.
Temperature, Temperature: +1 to +2 ◦ C; Annual average
precipitation, rainfall: −10%; Annual streamflow: −13.8%;
Hydro-Ecologic
Climate model ensemble (12 reservoir inflows and Annual runoff (considering evolution of
[7] Yesa reservoir (Spain) Delta method Simulation System - 2021–2050
RCM), A1B outflows, storage land cover): −16%; Annual runoff
(RHESSys)
level, soil types and (combined effects of climate and land cover
land cover change): −29.8%.
Major existing and Higher average temperatures; Potentially
planned new reducing average electricity generation (12%
Temperature,
hydropower plants Water Evaluation in the Kariba reservoir); Reduction in the
2 GCM (CNRM-CM3 and Direct use of regional precipitation and
[5] (reservoir and and Planning - 2050–2070 average annual generation in usual
ECHAM5 MPI-M) d , A2 models irrigation
run-of-river) of (WEAP) [63–65] irrigation growth (6%); Reduction in the
development
Zambezi river basin average anual generation when irrigation is
(Southern Africa) prioritized (20% in Cahora Bassa)
Mean annual temperature: +1.1 ◦ C and
Temperature, +3.38 ◦ C under RCP4.5 and RCP8.5
Soil and Water HEC-ResPRM 2011–2040
Tekeze reservoir CORDEX-Africa (RCM), RCP4.5 precipitation, scenarios; Mean annual precipitation: +45%;
[66] - Assessment Tool Optimization 2041–2070
(Ethiopia) and RCP8.5 climate scenarios e topography and soil Results showed increase in annual and
(SWAT) Model f 2071–2100
types and land uses monthly inflow into the reservoir except in
dry months from May to June.Water 2018, 10, 592 11 of 18
Table 3. Cont.
Simulation and
Climate Model and Greenhouse Components of the
Study Local Downscaling Method Hydrologic Model Optimization Future Periods Main Results (Projected Changes)
Emission Scenarios (IPCC) Model
Approach
Firm power (A2 and B2 emission scenarios,
respectively): −1.58% and −3.15%; General
PRECIS (Providing
Linear rainfall–flow negative trend in flow with varying
Regional Climates for
[21] Reservoirs (Brazil) HADCM3 model (GCM), A2 e B2 Precipitation model for SUISHI-O g 2071–2100 seasonal impacts; São Francisco basin
Impacts Studies) model
elasticities seemed to be the most affected (decrease in
(Hadley Centre, UK)
energy production would reach more than
7% in the B2 scenario).
Temperature, Increased trend of rain rates, not reflecting
Regional ETA model precipitation, relative on flow; Period 2041–2070: prolonged
h 2011–2040
Furnas reservoir (National Institute for humidity, solar MGB-IPH model Frequency and drought, the reservoir can be emptied
[51] HADCM3 model (GCM), A1B 2041–2070
(Brazil) Space Research—INPE, radiation, wind speed, [67]. duration model completely so that the energy demand is
2071–2099
Brazil) topography and soil met; Increase in generation by 32% while
types and land uses maintaining the fullest reservoir.
a Hadley Centre Coupled Model, version 3 (Met Office Weather Centre—UK); b IPCC’s Special Report on Emissions Scenarios (SRES) contains data on the scenarios of greenhouse
gas emissions (GHG) and presents different trends, such as low emission or optimistic scenario (B2), moderate emissions (A1B) and high emissions or pessimistic scenario (A2) [68];
c IHACRES model—Identification of unit Hydrographs and Component flows from Rainfall, Evaporation and Streamflow data; d Drawn from the European Union (EU) WATCH3
dataset of statistically downscaled climate models; e IPCC’s Fifth Assessment Report—CMIP5: established new scenarios of climate change: high emission scenario (RCP 8.5), medium
stabilization scenarios (RCP 4.5 and RCP 6.0) and mitigation scenario (RCP 2.6) [69]; f HEC-ResPRM—US Army Corps of Engineer’s Reservoir Evaluation System Perspective Reservoir
Model; g SUISHI-O—Modelo de Simulação a Usinas Individualizadas de Subsistemas Hidrotérmicos Interligados developed by CEPEL—Centro de Pesquisas de Energia Elétrica (Electric
Power Research Centre), Brazil; h MGB-IPH—Modelo Hidrológico de Grandes Bacias (Hydrological Model of Large Basins) developed by IPH—Instituto de Pesquisas Hidráulicas
(Institute of Hydraulic Research) of the Federal University of Rio Grande do Sul, Brazil.Water 2018, 10, 592 12 of 18
6. Adaptations to Reduce Vulnerability and Increase Resilience
Soito and Freitas [30] suggested that, in addition to the management of Brazilian reservoirs in
terms of optimisation and adaptation to climate change, other measures should be taken into account
for planning, execution and control phases of the plants, namely: establishment of an orderly use of
the soil in the drainage basin; conservation of vegetation growth; regulation of the rivers flow and their
tributaries; and the controlled disposal of industrial waste. It should also be considered the monitoring
of sediment transport [70]. An overview of different adaptation strategies to reduce vulnerability of
hydroelectric reservoirs to climate change is given in Table 4.
Table 4. Adaptations to reduce vulnerability of hydroelectric reservoirs to climate change.
Study Adaptations to Reduce Vulnerability of Hydroelectric Reservoirs to Climate Change
Obtaining information on the climatic impacts (monitoring of the climate and the runoff of the basins)
in the hydroelectric generation and incorporating climatic risks in its management;
Investments in adequate infrastructure, with equipment designed to operate in different climate
conditions (e.g., turbine types);
[13] Modernization of plants to enable long-term sustainability;
Development of drought management plans to deal with water competition;
Modifications to operating rules;
Management of land use to reduce soil erosion in the basin and reservoir;
Consideration of the diversification of the energy matrix.
[22] Dynamic management with water allocation adjustments.
Controlled disposal of industrial waste;
[30] The conservation of vegetation growth;
Regulation of flows of rivers and their tributaries.
[57] Adaptations between hydroelectric and alternative scenarios involving other sources of energy.
Adaptation of the operational policy to the future hydrological regime with adjustments in reservoir
[6]
levels in seasons.
Simplified water management schemes based on the operational history of the dam, applying
[7]
restrictions to the releases of water from the dam.
[17] Operational rules optimized for balancing power generation (optimization through hydraulic loading).
[4] Flexibility in the storage of water obtained through pump-storage HPP systems.
[51] To apply restrictions to the releases of water from the dam.
Store energy by pumping water to a new reservoir during the wet period and generate energy by
[26]
releasing the stored water during the dry period (Enhanced-Pumped-Storage).
The adaptability of hydroelectric schemes to climate change is dependent on local characteristics,
specifically: project specifications; storage volume; morphological regime and environmental
legislation [4,18]. For example:
• Reservoirs with smaller surface area and greater depth tend to be less affected by global warming,
which increases evaporation rate of reservoir (according to previous study, 1.1 m depth on average
per year) [13].
• Some hydropower systems offer flexibility of water storage, pump-storage HPP. In periods of
lower demands, the water is rebounded to a reservoir with higher elevation, and, in periods of
higher demand, the water is released by the turbines. In this case, the generation of hydroelectricity
is less dependent on changes in the hydrological regime [4]. The limitations for the construction
of these hydroelectric schemes in Brazil are related to the establishment of regulatory bases and
economic viability.
• Optimised operating rules can balance power generation [7,16,17,20,57]. An example of
such operational policies would be raising and lowering reservoir level during some seasons.
Haguma et al. [6] proposed as adaptive operational policies for Manicouagan Reservoir (Canada)Water 2018, 10, 592 13 of 18
the lowering in reservoir water level during winter and raising during spring. For the Furnas
HPP reservoir (Brazil), Ribeiro Júnior et al. [51] proposed an operative rule that contemplates the
time and the cycle of attendance to a certain level of the reservoir, to attend to the generation of
energy and to guarantee the sustainability of multiple uses of water for the future climate.
Analyses indicate that hydroelectric managers usually consider historical hydro-meteorological
data in the planning and design of new hydropower stations, but data should be also included on
the possible impacts of climate change [14]. In Brazil, this new strategy is also necessary. With the
inclusion of climate change impacts in planning, even if there are changes in flows, the plant can act in
a balanced way, reducing losses in energy generation.
According to Lumbroso et al. [14], this strategic management leads to a set of possible options
for hydroelectric schemes and impacts the amount of energy generated and future economic return.
In Brazil, there is a need for climate and hydrological forecasting to anticipate hydrological risks
and to assess the impacts and vulnerability of hydroelectric plants considering changes in climate
and adaptation measures [30,51]. However, the influence of the actions taken is greater during the
hydroelectric planning and design phases [14].
The diversification of the energy mix is considered a form of adaptation [13]. Thus, in Brazil,
different sources of renewable energy can be managed in parallel:
• Encouraging the use of solar and wind energy can contribute to the reduction of greenhouse
gases and to Brazilian social and economic development [28]. Biomass as an energy source is also
interesting due to the amount of waste from agriculture and forest products industries, extracted
mainly from the sugar and alcohol industry [11,12].
• Sources such as biomass (from bagasse and sugar cane straw) and wind power can contribute
significantly to the generation of energy in periods with lower rainfall intensity, as it coincides
with the more intense potential of these sources [8]. It can complement the generation of
hydroelectricity in the period of greater fragility, especially the run-of-river hydropower plants.
• The great annual variability in the hydrological conditions and the intense rain seasonality can
put at risk the Brazilian hydrothermal energy generation system. However, a complementarity
between hydroelectric, wind and solar photovoltaic systems could contribute to the stability of
production and a decrease in thermoelectric generation [71].
7. Discussion
The assessment of projections of climate change allows better understanding of the magnitude of
water and energy risks as well as the adoption of adaptation measures to meet future energy demands.
The vulnerability and resilience of each hydroelectric plant depends on specific characteristics such as
the type of plant (reservoir, pumped-storage or run-of-river), operating strategies, turbine resistance to
sediments and the vulnerability of the hydrological regime.
Studies of the impact of climate change on the hydrological regime anticipated possible future
developments, but interpretation should cover modelling uncertainties, especially related to climate
change scenarios. These studies provided an overview of the trends and enable the establishment
of hydroelectric reservoir management strategies. The impacts on the availability of water to the
reservoirs can be predicted, which facilitates the designation of a plant operation strategy in order to
mitigate the effects throughout the year or the adoption of other measures to guarantee demand to
be met.
When establishing adaptive strategies, it is also necessary to investigate the impacts of adaptive
actions on ecological integrity of rivers downstream of the reservoir, and there should be concerns
related to maintenance of environmental flows, as highlighted in Spalding-Fecher et al. [5].
The analyses of the temperature and precipitation variables are fundamental in projections
of climatic changes and in the evaluation of impacts on the generation of energy by hydroelectric
plants. Precipitation directly influences the refilling of aquifers and river flow, i.e., the availability ofbe met.
When establishing adaptive strategies, it is also necessary to investigate the impacts of adaptive
actions on ecological integrity of rivers downstream of the reservoir, and there should be concerns
related to maintenance of environmental flows, as highlighted in Spalding-Fecher et al. [5].
The analyses of the temperature and precipitation variables are fundamental in projections
Water 2018, 10, 592
of
14 of 18
climatic changes and in the evaluation of impacts on the generation of energy by hydroelectric
plants. Precipitation directly influences the refilling of aquifers and river flow, i.e., the availability of
water resources.
water resources. Temperature
Temperature influences
influences thethe evaporation
evaporation of of the
the reservoir
reservoir and
and thethe evapotranspiration
evapotranspiration
of the vegetation—also impacting the availability of water in the reservoir. Variations inVariations
of the vegetation—also impacting the availability of water in the reservoir. temperature in
also impact also
temperature theimpact
behavior of otherofclimatic
the behavior variables
other climatic (wind
variables speed,
(wind speed, humidity,
humidity,precipitation).
precipitation).
Investigations also
Investigations alsohighlighted
highlightedthe theneed
need forfor
joint evaluation
joint evaluation of temperature
of temperature and precipitation, since
and precipitation,
evapotranspiration and evaporation may counterbalance precipitation [5,6,30]. That is, even if there
since evapotranspiration and evaporation may counterbalance precipitation [5,6,30]. That is, even if
is an increase
there in rainfall
is an increase in in some in
rainfall regions,
some higher
regions,temperature would increase
higher temperature would theincrease
rates of evaporation
the rates of
of the reservoir
evaporation andreservoir
of the evapotranspiration in the basin, in
and evapotranspiration generating
the basin,loss of waterloss
generating to the atmosphere.
of water to the
Other variables
atmosphere. that variables
Other can complement
that canthe analysis: demand
complement for irrigation
the analysis: demandand forland use—related
irrigation and land to
the silting of river
use—related to thebanks
siltingand changes
of river banksin and
evapotranspiration rates.
changes in evapotranspiration rates.
In Brazil,
In Brazil, climate
climate change
changetrends
trendsindicate
indicatethatthatthe
theregions
regionsthatthat will
will suffer
suffer thethe most
most changes
changes willwill
be
be the
the Amazon
Amazon andandthethe Northeast.
Northeast. Considering
Considering thethe Amazon,
Amazon, strategies
strategies should
should be be implemented,
implemented, due dueto
to the
the clear
clear tendency,
tendency, forfor
thethe region,
region, ofof constructionofofrun-of-river
construction run-of-riverplants,
plants,thethekind
kindofof power
power plant
plant in in
which the impacts of global warming are most significant. Considering the Northeast, in strategic
which the impacts of global warming are most significant. Considering the Northeast, in strategic
terms, the
terms, the country
country cancan opt
opt for
for complementarity
complementarity with with the
the development
development of of other
other renewable
renewable sources
sources of of
energy, such
energy, suchasaswind
windand and solar,
solar, given
given its enormous
its enormous potential
potential for generation,
for generation, as evaluated
as evaluated in the in the
study
study
of JongofetJong et al. [12].
al. [12].
Based on
Based on the
the study
study ofof several
several articles
articles dealing
dealing with
with thethe impact
impact of of climate
climate change
change on on the
the
management of
management hydropower reservoirs
of hydropower reservoirs and and other
other related
related articles,
articles, aa framework
framework was was elaborated
elaborated
(Figure 3).
(Figure 3).
Figure 3. Framework—Climate
Figure 3. Framework—Climate change
change and reservoir management.
and reservoir management.
This research provides several conclusions related to climate and environmental changes in the
This research provides several conclusions related to climate and environmental changes in
context of hydropower reservoirs, which are useful for the academic and industry communities. A
the context of hydropower reservoirs, which are useful for the academic and industry communities.
summary of the relationship between different variables is presented (see also Figure 3):
A summary of the relationship between different variables is presented (see also Figure 3):
• Global climate change affects power generation in hydropower reservoirs;
•• Global climate change affects power generation in hydropower reservoirs;
The increase in temperature causes changes in atmospheric pressure and wind patterns and
• The
consequently in
increase in temperature
precipitation causes changespatterns;
and humidity in atmospheric pressure and wind patterns and
consequently in precipitation and humidity patterns;
• The combination of changes in precipitation and temperature affect the moisture levels of soil;
• Increase of temperatures results in an increase in potential evaporation;
• Changes in wind speed and humidity may compensate for or amplify the increase in temperature,
which may interfere with the evaporation rate of the basin and reservoirs;
• Precipitation is the climatic variable that most affects the flow of rivers;Water 2018, 10, 592 15 of 18
• Increased precipitation can lead to a rise in river flow; however, the increase in temperature may
counterbalance the effect of this rise, as it increases the rate of evaporation of the reservoirs and
the evapotranspiration in the basin;
• Global warming increases the demand for water for agricultural exploitation (mainly irrigation)
and other socio-environmental demands;
• Changes in land cover alters the rate of evapotranspiration, which may imply changes in
runoff characteristics;
• Some changes in land cover can lead to soil degradation (silting), which can affect both the
basin and the reservoir level due to sediment transport—aggravating the negative impacts of
climate change;
• Hydrological impacts vary according to: precipitation intensity, basin characteristics, type of
vegetation and/or changes in land cover;
• As a chain effect, changes in runoff can affect the production of electricity.
8. Conclusions
In summary, climatic and environmental variables impact the volume of water available for the
generation of energy in hydropower reservoirs, hence the need for combined studies (considering
these different variables) to develop reliable scenarios for the future availability of water resources for
hydroelectric power generation and for the establishment of rules for flexible reservoir operation.
Author Contributions: Viviane de Souza Dias, Marta Pereira da Luz and Gabriela M. Medero performed the
studies and wrote the paper. Diego Tarley Ferreira Nascimento has developed the maps and assisted in the
paper preparation.
Acknowledgments: The work was supported by the National Council of Scientific and Technological
Development (CNPq) through the program Science without Borders, and National Agency of Electric Power
(ANEEL)—Project and Development code 0394-1014-2010, through Eletrobras Furnas Company, both from Brazil’s
government. The authors are also grateful to Coordination for the Improvement of Higher Education Personnel
(CAPES) for the granting of the master’s degree grant that maintained the first author.
Conflicts of Interest: The authors declare no conflict of interest.
References
1. IEA. International Energy Agency. Technology Roadmap: Hydropower. Available online: http://www.iea.org/
publications/freepublications/publication/2012_Hydropower_Roadmap.pdf (accessed on 21 April 2016).
2. Lessa, A.C.; dos Santos, M.A.; Maddock, J.E.; dos Santos Bezerra, C. Emissions of greenhouse gases in
terrestrial areas pre-existing to hydroelectric plant reservoirs in the Amazon: The case of Belo Monte
hydroelectric plant. Renew. Sustain. Energy Rev. 2015, 51, 1728–1736. [CrossRef]
3. IPCC. Intergovernmental Panel on Climate Change. Climate Change 2014: Impacts, Adaptation and
Vulnerability—Fifth Assessment Report—Part B: Regional Aspects. Available online: http://www.ipcc.ch/
pdf/assessment-report/ar5/wg2/WGIIAR5-Chap27_FINAL.pdf (accessed on 17 June 2016).
4. Schaefli, B. Projecting hydropower production under future climates: A guide for decision-makers and
modelers to interpret and design climate change impact assessments. Wiley Interdiscip. Rev. Water 2015, 2,
271–289. [CrossRef]
5. Spalding-Fecher, R.; Chapman, A.; Yamba, F.; Walimwipi, H.; Kling, H.; Tembo, B.; Nyambe, I.; Cuamba, B.
The vulnerability of hydropower production in the Zambezi River Basin to the impacts of climate change
and irrigation development. Mitig. Adapt. Strateg. Glob. Chang. 2014, 19, 1–22. [CrossRef]
6. Haguma, D.; Leconte, R.; Côté, P.; Krau, S.; Brissette, F. Optimal hydropower generation under climate
change conditions for a Northern water resources system. Water Resour. Manag. 2014, 28, 4631–4644.
[CrossRef]
7. López-Moreno, J.I.; Zabalza, J.; Vicente-Serrano, S.M.; Revuelto, J.; Gilaberte, M.; Azorin-Molina, C.;
Moran-Tejeda, E.; Garcia-Ruiz, J.M.; Tague, C. Impact of climate and land use change on water availability
and reservoir management: Scenarios in the Upper Aragon River, Spanish Pyrenees. Sci. Total Environ. 2014,
493, 1222–1231. [CrossRef] [PubMed]You can also read