Climate change impacts on the Water Highway project in Morocco - HESS
←
→
Page content transcription
If your browser does not render page correctly, please read the page content below
Hydrol. Earth Syst. Sci., 24, 1467–1483, 2020
https://doi.org/10.5194/hess-24-1467-2020
© Author(s) 2020. This work is distributed under
the Creative Commons Attribution 4.0 License.

Climate change impacts on the Water Highway project in Morocco
Nabil El Moçayd1 , Suchul Kang2 , and Elfatih A. B. Eltahir2
1 International
              Water Research Institute, University Mohammed 6 Polytechnic,
Lot 660 Hay Moulay Rachid Benguerir 43150, Morocco
2 Ralph M. Parsons Laboratory, Department of Civil and Environmental Engineering,

Massachusetts Institute of Technology, Cambridge, MA 02139, USA

Correspondence: Nabil El Moçayd (nabil.elmocayd@um6p.ma)

Received: 15 May 2019 – Discussion started: 24 July 2019
Revised: 27 January 2020 – Accepted: 10 February 2020 – Published: 30 March 2020

Abstract. The hydrology of Morocco is characterized by sig-        regions like Morocco should develop new policy in order
nificant spatial variability. Precipitation follows a sharp gra-   to adapt to climate change (Kahil et al., 2015; Batisani and
dient, decreasing from the north to the south. In order to re-     Yarnal, 2010; Lioubimtseva and Henebry, 2009). As reported
distribute the available water, a project has been proposed        by Greve et al. (2018), different policies could be adopted, in-
to transfer 860 × 106 m3 yr−1 from the wet north to the arid       cluding investments in structures for transferring water from
southern regions, namely the “Water Highway” project. The          one basin to another.
present study aims to address the viability of the project            Hydrology in Morocco is characterized by strong spatial
after accounting for the impacts of climate change in the          and temporal variability (Driouech et al., 2010; Tramblay
watersheds located in the north. We perform regional cli-          et al., 2013). This uneven distribution of water has led the
mate model (RCM) simulations over the study region us-             Moroccan government to develop hydraulic infrastructure to
ing boundary conditions from five different global circula-        improve the local management of water resources throughout
tion models (GCMs) and assuming two different emissions            the country. In 1967, King Hassan II launched a project to ir-
scenarios – RCP4.5 (with mitigation) and RCP8.5 (business          rigate 1 × 10⁶ ha by the year 2000. More precisely, the plan
as usual). The impact on precipitation and temperature are         was to build a dam every year. The outcomes of this strategy
assessed, and the decrease in the available water quantity is      helped to achieve food security, increase cash crop produc-
estimated. Under RCP8.5, the project is likely not feasible.       tion for export, and improve the social and economic level
However, under the RCP4.5, a rescaled version of this project      of local farmers. More implicitly the construction of these
may be feasible depending on how much water is allocated           infrastructures has helped communities to adapt to climate
to satisfy the local water demand in the north.                    variability. Previous studies (Doukkali, 2005) have shown
                                                                   that although these efforts resulted in the significant opti-
                                                                   mization of water resource management in Morocco, they
                                                                   remain insufficient to ensure water and food security. A new
1   Introduction                                                   policy is needed to complement these efforts. By 2020, only
                                                                   the watersheds in the north of Morocco will have a water
In many regions in the world, water scarcity is a critical is-     excess compared with the demand (Minoia and Brusarosco,
sue that should be seriously addressed by stakeholders. Greve      2006). The proposed north–south water transfer project (Wa-
et al. (2018) define water scarcity as the ratio between the       ter Highway) aims to supply water to the arid southern re-
natural water supply and the local water demand. As a re-          gions from the watersheds in the north (see Fig. 2). The pro-
sult, water scarcity mainly depends on two factors: hydro-         jected quantity of water to be transferred by this project is
climatology and the socioeconomic situation (Wada et al.,          860 × 106 m3 yr−1 (Water-Office, 2017).
2014). While a study has shown that Morocco is not re-                Other countries have adopted similar policies in order to
ally threatened due to population growth (Boke-Olén et al.,        alleviate water scarcity problems. In China (Gu et al., 2012),
2017), several studies have suggested that arid and semiarid

Published by Copernicus Publications on behalf of the European Geosciences Union.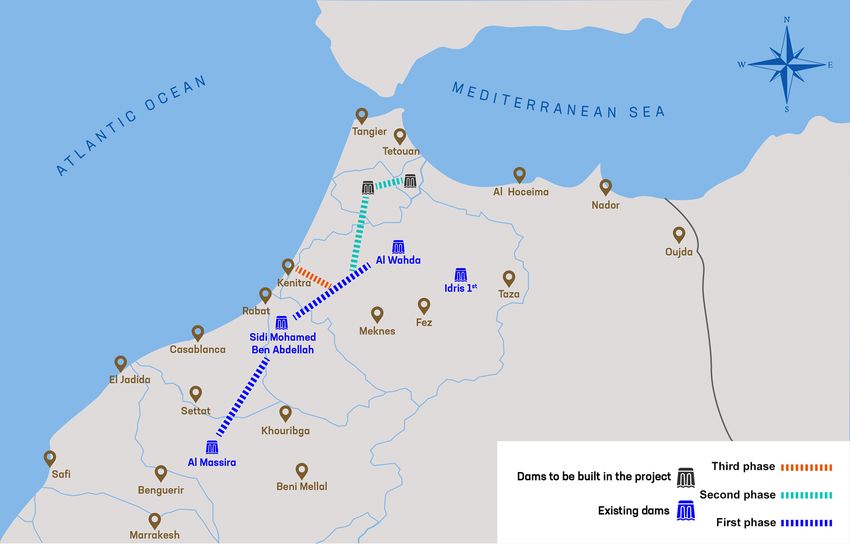
1468                             N. El Moçayd et al.: Climate change impacts on the “Water Highway” project in Morocco

water is transferred from the tropical southern region to the         other hand, improved irrigation schemes have certainly in-
very dense, industrialized, arid north as a result of the South–      tensified cash crop production in Morocco, but they have
North Water Transfer Project (SNWTP). The goal of this                also increased the water demand. Indeed, Ward and Pulido-
project is to transfer 44.5 km3 yr−1 from the Yangtze River           Velazquez (2008) show that the increase in efficiency in-
basin. Although the economic benefit of the project is appre-         creases water use. Furthermore, climate change projections
ciated in the region (Feng et al., 2007), it has raised some          predict that Morocco will experience a dry future (Giorgi and
controversy (Berkoff, 2003). First, transferring water in open        Lionello, 2008; Kang et al., 2020) and a decrease in precip-
channels increases the risk of pollution (Tang et al., 2014).         itation (Patricola and Cook, 2010). For all of the abovemen-
Traffic accidents, especially those involving trucks, represent       tioned reasons, among others, the country is becoming in-
a threat to water quality. Moreover, the risk of the saliniza-        creasingly vulnerable to global change; therefore, adaptation
tion of both basins (due to the transfer of salts in the receiving    policies are a required for the development of the country
basin and due to sea water intrusion in the source basin) has         under such conditions (Schilling et al., 2012).
been highlighted by Zhang (2009). Therefore, significant ef-             The purpose of the present work is to study the viability
forts need to be made in order to improve watersheds’ man-            of the north–south water transfer project, considering the im-
agement (Zhang et al., 2009). The Water Highway project               pact of climate change. More precisely, the study aims to as-
could also lead to a dramatic increase in the water cost. These       sess the effect of climate change on water availability in the
concerns have been raised with respect to the SNWTP in                northern basins. In order to evaluate the impact of climate
China by two studies (Wei et al., 2010; Yang and Zehnder,             change on this project, multi-model climate simulations were
2005). In fact, the SNWTP relies significantly on the water           performed. Forcing boundary conditions from five global cir-
availability in the south of China, and, as has been suggested        culation models (GCMs), including MPI, GFDL, IPSL, CSM
by Liu and Zheng (2002) and Li et al. (2015), the water quan-         and ACCESS, were considered in order to quantify the un-
tity will decrease in the donor watersheds due to global cli-         certainty in future climate projections (Tebaldi and Knutti,
mate change. However, this decrease will not affect the via-          2007). The simulations were performed using MRCM (MIT
bility of the project in the China. In contrast, it is not clear if   Regional Climate Model) and plausibly recreated the impact
the change in precipitation would impact the viability of the         of global change on precipitation and temperature (Eltahir
project in Morocco. Therefore, the goal of the present study          et al., 2013). We choose to assess the impact of climate
is to assess the viability of the Water Highway, including the        change for a 30-year duration for two main reasons. The first
impact of climate change.                                             motive is linked to climate change; in fact, this project has
   Global change is impacting the African climate. Indeed,            been designed in order to face future climate change im-
many studies have shown that the regional climate of Africa           pacts on southern Moroccan areas. If the project could po-
is likely to change during the upcoming decades (Sowers               tentially jeopardize the water security of the northern region,
et al., 2011). This change is expected to have considerable so-       how can it also satisfy the southern region’s water demand?
cioeconomic and environmental impacts. A recent study that            The second reason is purely from a feasibility perspective.
used the IPCC AR4 (Fourth Assessment Report of the Inter-             The project will take more than 10 years to fully construct,
governmental Panel on Climate Change) emission scenarios              not to mention that the project has not started yet (construc-
to predict climate change in Africa reported that the northern        tion was planned to start in 2018). In addition, the Moroc-
part is more likely to suffer from an increase in temperature         can government has only made the budget for the first phase
and a decrease in the amount and frequency of precipitation           available. The second and the third phases are still waiting on
(Vizy and Cook, 2012). As a result, North Africa will be vul-         the necessary funds, which will certainly delay the project for
nerable to climate change (Döll, 2009).                               another 10 years. The impact on runoff and, in turn, on water
   Over the last few decades, Morocco has built one of                availability is assessed using the runoff elasticity (Sankara-
the strongest economies in Africa (USD 101 billion in                 subramanian and Vogel, 2003; Tang and Lettenmaier, 2012)
gross domestic product, GDP, as reported by the World                 based on available data and RCM simulations. Such method-
Bank, https://data.worldbank.org/country/morocco, last ac-            ology can be used to evaluate the impact of climate change
cess: 20 March 2020), although this economy, however ef-              on water availability in regions where hydrological modeling
ficient compared to other developing countries, depends sig-          may not be feasible. We confronted the results of our work
nificantly on water availability (agriculture represents 15 %         with other published works on the assessment of the impact
of the GDP). Water imbalance between supply and demand                of climate change on water availability in the region.
is growing (Hellegers et al., 2013). In Morocco, water de-               The article is presented as follows: Sect. 2 describes the
mand is affecting water scarcity more intensely than climate          north–south water transfer project in Morocco, the northern
change (Vörösmarty et al., 2000). On the one hand, the ur-            region that ought to supply water to the arid regions in the
ban population is expected to increase by about 270 thou-             south and the available datasets needed to perform the anal-
sand inhabitants per year due to urbanization, as reported            ysis. Section 3 is dedicated to presenting the methodologies
by the Moroccan High Commission for Planning website                  used in order to assess the expected loss of water in the north-
(http://www.hcp.ma/, last access: 5 March 2019). On the

Hydrol. Earth Syst. Sci., 24, 1467–1483, 2020                                       www.hydrol-earth-syst-sci.net/24/1467/2020/
N. El Moçayd et al.: Climate change impacts on the “Water Highway” project in Morocco 1469
ern watersheds. Finally, Sect. 4 presents the results, and the 2.3 Description of watersheds of interest
conclusions and perspectives are described in Sect. 5.
The purpose of this study is to analyze the effect of climate
change on the project. In order to address the viability of
2 North–south water transfer project the project, the global climate change impact on the hydrol-
ogy of the donor watersheds needs to be assessed. Figure 3
2.1 Water distribution in Morocco
presents the three watersheds that will supply the project,
Morocco is located in the northwest of Africa. Given the namely Loukkos, Oued Laou and Mjara (presented using a
country’s geographical position, the climate is characterized red contour). The latter is a sub-watershed of the Sebou wa-
by strong spatial variability. Indeed the southern part of the tershed, supplying most of the Sebou water. The three water
country is affected by the extreme dry climate of the Sahara basins are located in the northern region of Morocco, where
Desert, and the northwestern part benefits from the moderate the precipitation levels are relatively high. There is a spatial
climate of the Mediterranean Sea and Atlantic Ocean. In ad- gradient of elevation from the northeast to the southwest due
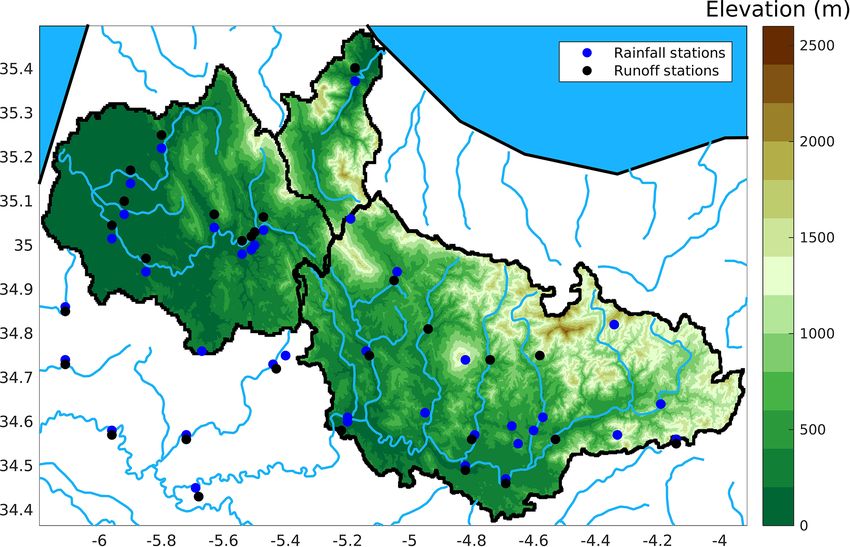
dition, the topography of Morocco also varies in space. The to the presence of Rif Mountains (see Fig. 4).
coastal region is flat, whereas the topography is shaped by
the Rif Mountains and Atlas Mountains in the north and the
east, respectively. Therefore, the climate can vary from sub- 3 Datasets and methodologies
humid to arid over the country (Born et al., 2008). As a re-
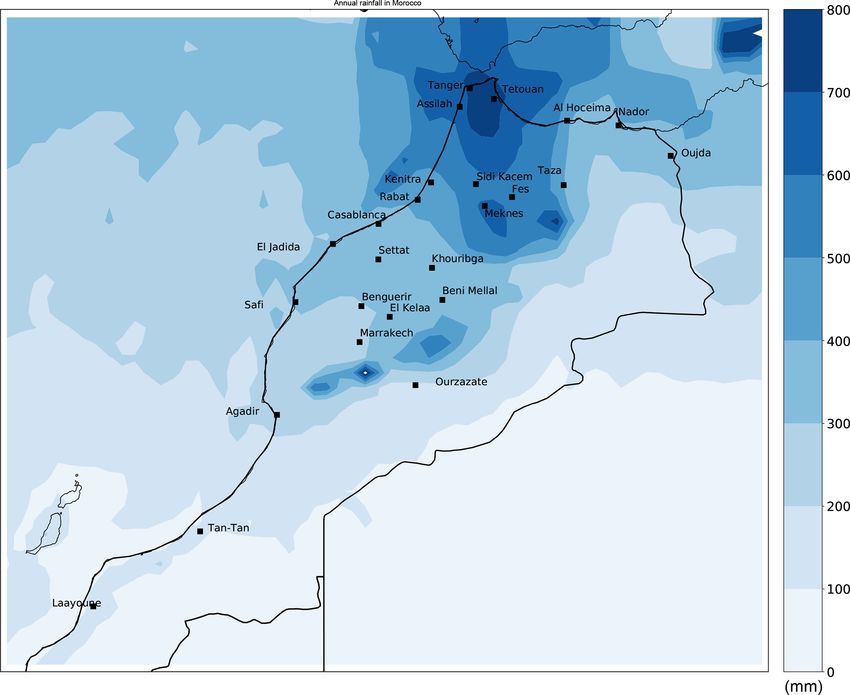
sult, the precipitation over Morocco varies strongly in space. 3.1 Datasets
Figure 1 displays the annual mean precipitation over Mo-
rocco using TRMM (Tropical Rainfall Measuring Mission) In order to perform this study, we accessed several datasets.
data (Huffman and Bolvin, 2013). The annual precipitation Table 2 summarizes the available data. Each dataset is avail-
reaches 800 mm yr−1 in the north, whereas the south barely able at a monthly time step.
receives 100 mm yr−1 . As a result, only the extreme north-
western part of the country enjoys an excess water supply. 3.1.1 Spatial data
2.2 The general features of the project Spatial data help to understand the temporal as well as the
spatial variability of precipitation. For the present case, we
As reported by the Moroccan department in charge of wa- use the data from the space mission TRMM (Tropical Rain-
ter, plans are ready to launch the north–south water trans- fall Measurement Mission) (Huffman and Bolvin, 2013). We
fer project (Water-Office, 2017). The water balance anal- also downloaded remote sensing data specifically for the re-
ysis prepared in the studies carried out by the Moroccan gion of Morocco and extracted it for the three watersheds
Department of Water shows that southern basins, notably considered in this analysis.
the Tensift and Oum Er-Rbia, are in deficit. In contrast, the
northern basins discharge excess water to the sea. A transfer 3.1.2 Gauge station data
from the northern basins, which are much better equipped
with respect to hydraulic structures, would relieve these Gauging station data were also used. The sources of the data
deficits and consolidate national water management integra- used here are the respective river basin agencies of Sebou and
tion. The preliminary pre-feasibility studies conducted by Loukkos. In Morocco, river basin agencies (ABH “Agence
the Moroccan Department of Water have shown that roughly du bassin hydraulique”) are in charge of the evaluation, the
860 × 106 m3 yr−1 could be transferred on average from the planning and the general management of water resources
Oued Laou, Loukkos and Mjara basins (see Fig. 3) to the within a watershed. In our case, the Mjara watershed is man-
Bouregreg, Oum Er-Rbia and Tensift basins (see Fig. 2). The aged by ABH Sebou (shown using a black contour in Fig. 3).
project implementation schedule as well as the institutional For this watershed, 17 rainfall stations and 24 runoff stations
and financial setup will be defined by the studies in progress are available. Loukkos and Oued Laou, in comparison, are
by both of the ministerial departments concerned, namely managed by ABH Loukkos. This agency made 11 rainfall
water and agriculture. and runoff stations available for the purpose of this study.
The project, following three phases as described in Ta- All of the gauge stations used in this study are displayed in
ble 1, will involve the construction of nine pumping sta- Fig. 4.
tions,two new dams, and 500 km of channels and pipes These data have the advantage of being more accurate than
to transfer water from Oued Laou, Loukkos and Sebou to the spatial data, but they are more likely to include missing
Al Massira Dam. values. In order to use them, one method of filling the missing
values (∼ 5 %–10 %) is to replace them with their long-term
mean. There are other methods that can also be used to fill
the missing values, but only the abovementioned method will
www.hydrol-earth-syst-sci.net/24/1467/2020/ Hydrol. Earth Syst. Sci., 24, 1467–1483, 2020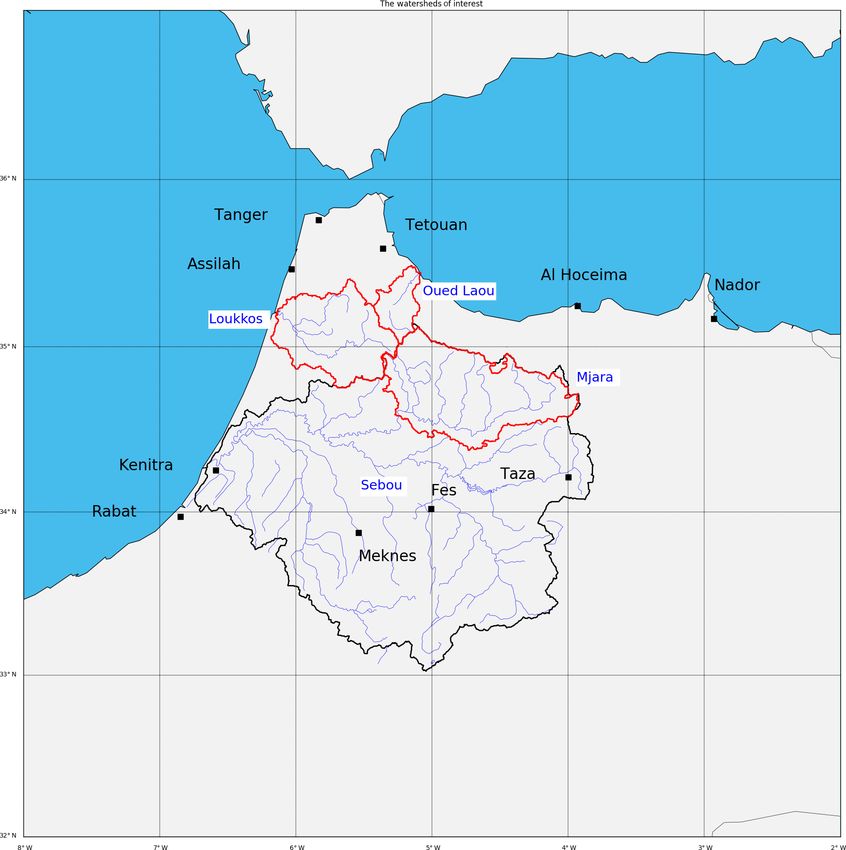
1470                             N. El Moçayd et al.: Climate change impacts on the “Water Highway” project in Morocco

Figure 1. Annual precipitation (in millimeters) in Morocco using Tropical Rainfall Measurement Mission (TRMM) data.

Figure 2. The planned water transfer project.

Hydrol. Earth Syst. Sci., 24, 1467–1483, 2020                                      www.hydrol-earth-syst-sci.net/24/1467/2020/
N. El Moçayd et al.: Climate change impacts on the “Water Highway” project in Morocco                                                 1471

Table 1. The three phases of the project. These numbers are given as an indication, and the remaining amount of the budget will be dedicated
to the rehabilitation of existing hydraulic infrastructures.

              Phase      Start point                 End point              Water amount               Cost              Cost
                                                                          (×106 m3 yr−1 )    (billion MAD)     (billion USD)
              Phase 1    Kodiat al Borna             Al Massira Dam                   392               16.3             1.63
                         (near Al Wahda Dam)
              Phase 2    Beni Mansour                Al Makhazine        726 = 334 + 392                 13               1.3
                         (Oued Laou)                 Dam
              Phase 3    Oued Sebou                  Phase 1 pipeline    860 = 726 + 134                 1.7             0.17
                                                     route
              Project    Oued Sebou,                 Al Massira Dam                   860                40                 4
                         Loukkos and Oued Laou

Figure 3. Watersheds of interest.

be used in this study, as it seemed accurate enough for our             mate Model Version 3 (RegCM3, Pal et al., 2007) but in-
purposes.                                                               cludes several improvements. A detailed description of the
                                                                        MRCM is given by Im et al. (2014a). There are substan-
3.2   Regional climate modeling                                         tial differences between MRCM and RegCM3. In particular,
                                                                        based on the simulations using MRCM-IBIS over the West
The present study used the MIT Regional Climate                         Africa, the use of IBIS as the land surface scheme results in
Model (MRCM), which is based on the ICTP Regional Cli-

www.hydrol-earth-syst-sci.net/24/1467/2020/                                           Hydrol. Earth Syst. Sci., 24, 1467–1483, 2020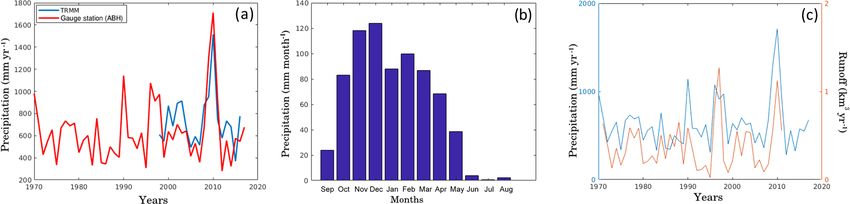
1472 N. El Moçayd et al.: Climate change impacts on the “Water Highway” project in Morocco
Figure 4. Mapping of the elevation and the position of gauge stations in the Oued Laou, Loukkos and Mjara watersheds.
Table 2. Datasets used for the study.
Data source Nature Period Period
(precipitation) (runoff)
TRMM 3B43 Remote sensing observation 1998–2016 –
ABH Loukkos (Loukkos) River gauge stations 1961–2017 1971–2017
ABH Loukkos (Oued Laou) River gauge stations 1964–2017 1971–2012
ABH Sebou (Mjara) River gauge stations 1978–2017 1959–1996
the better representation of surface energy and water budgets ios, respectively. We refer the reader to the companion paper
in comparison with RegCM3-BATS. Furthermore, the addi- (Kang et al., 2020) for a detailed discussion of the RCM sim-
tion of a new irrigation scheme in IBIS makes it possible ulations and model performance.
to investigate the effects of irrigation over West Africa (Im
et al., 2014b; Alter et al., 2015). 3.3 Runoff elasticity
Building on the good performance of MRCM in previ-
ous studies, we project multi-model ensemble regional cli- The issue of the sensitivity of runoff to climate change
mate change using this model to advance our understand- has been investigated in different studies. There are several
ing of the future conditions in response to anthropogenic methodologies to address this issue as reported by Sankara-
GHGs (greenhouse gases) over Morocco. To achieve this, a subramanian et al. (2001). One of the most common ap-
total of fifteen 31-year projections under multi-GCM (IPSL- proaches is the use of a calibrated hydrological model. Then,
CM5A-LR, GFDL-ESM2M, CCSM4, MPI-ESM-MR and with the help of RCM simulations of future climate, one is
ACCESS1.0; see Table 3) and multiple emission scenario able to study the sensitivity of runoff. The major difficulty
(Historical, RCP4.5 and RCP8.5) situations are dynamically involved in this method lies in the calibration of model pa-
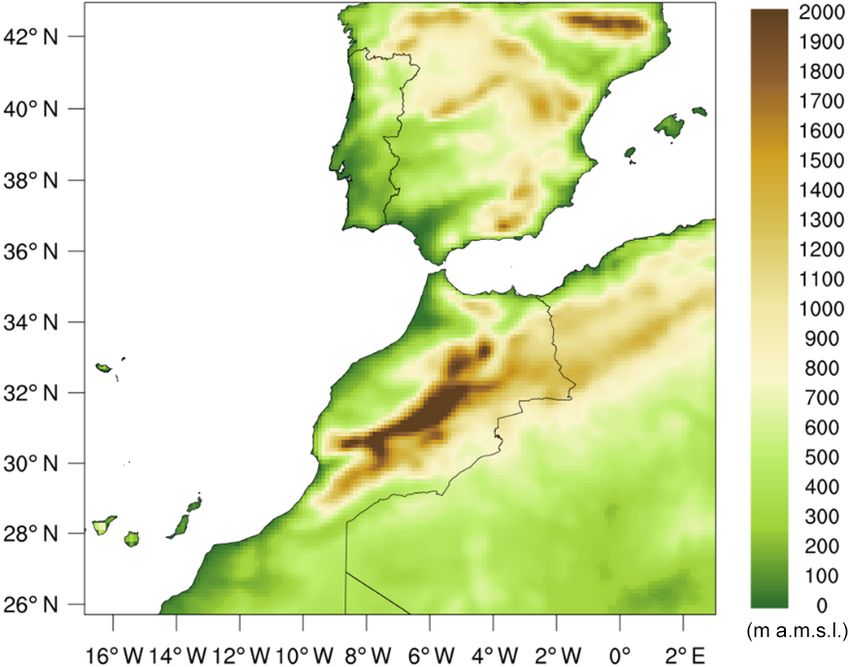
downscaled using MRCM with a 12 km horizontal resolution rameters from a finite set of observations. One assumes that
over Morocco (Fig. 5). The first year of MRCM simulations the parameters’ values do not change through time. This as-
in both the baseline and future periods is used for model spin- sumption has been extensively discussed in the community,
up and has been discarded in the analysis. Five GCMs are se- and several studies have demonstrated the importance of a
lected based on a rigorous evaluation (NRMSE, normalized dynamical correction of model parameters (Reichle et al.,
root-mean-square error; PCC, pattern correlation coefficient; 2002; Moradkhani et al., 2005).
and annual cycle) of their performance with respect to sim- Another approach is the application of simple water bal-
ulating regional climate over Morocco, while RCP4.5 and ance models and to analytically derive the elasticity coeffi-
RCP8.5 represent mitigation and business-as-usual scenar- cient. One could also explain the sensitivity of runoff to all
Hydrol. Earth Syst. Sci., 24, 1467–1483, 2020 www.hydrol-earth-syst-sci.net/24/1467/2020/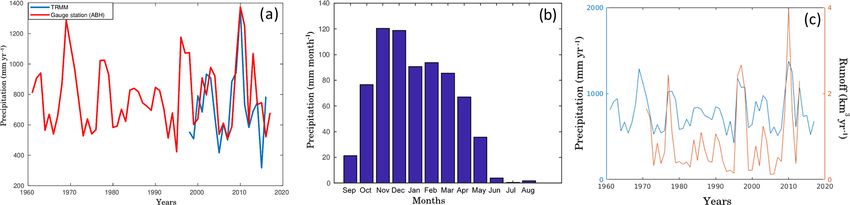
N. El Moçayd et al.: Climate change impacts on the “Water Highway” project in Morocco                                           1473

Table 3. Description of global climate models selected as lateral boundary forcings for MRCM simulation in the study.

                           Model name          ATM resolution    OCN resolution         Main reference
                                               (lat × long)      (lat × long)
                           ACCESS 1.0          1.25◦ × 1.875◦    1/3–1◦ × 1/3–1◦        Bi et al. (2013)
                           CCSM4               0.9◦ × 1.25◦      1.11◦ × 0.27–0.54◦     Gent et al. (2011)
                           GFDL-ESM2M          2◦ × 2.5◦         1◦ × 1/3–1◦            Dunne et al. (2012)
                           IPSL-CM5A-LR        1.875◦ × 3.75◦    2◦ × 0.5–2◦            Dufresne et al. (2013)
                           MPI-ESM-MR          T63 (∼ 1.875◦ )   0.4◦ × 0.4◦            Giorgetta et al. (2013)

                                                                       mean climatic variables. This approach has been tested in
                                                                       Risbey and Entekhabi (1996) and Sankarasubramanian et al.
                                                                       (2001). The first study showed that Sacremento River runoff
                                                                       is insensitive to changes in temperature, while it is more sen-
                                                                       sitive to precipitation. In the second study, the authors used
                                                                       a similar methodology in the major rivers in the US. They
                                                                       showed that when the rivers are located in dry areas, the sen-
                                                                       sitivity of runoff is mostly explained by precipitation. How-
                                                                       ever, when the rivers are located in areas with an important
                                                                       contribution from snowpacks to the water balance, runoff is
                                                                       less sensitive to precipitation.
                                                                          In the present study, as we lack sufficient data to develop
                                                                       a well-calibrated hydrological model, we choose to evaluate
                                                                       the potential change in runoff using the last two approaches
                                                                       described above. First, we evaluate the potential change in
                                                                       runoff using empirical equations first defined by Dooge et al.
Figure 5. MRCM simulation domain and topography (in m a.m.s.l.
                                                                       (1999) and Arora (2002). Following these studies, the long-
– meters above mean sea level).                                        term change in runoff is mainly driven by the long-term
                                                                       change in precipitation and the long-term change in potential
                                                                       evapotranspiration (PET). Therefore, this can be expressed
                                                                       as follows:
climatic variables as in Yang and Yang (2011). Indeed, this
                                                                       1Q    1P        1E0
study concludes that the hydrological cycle is influenced by              =    − PET     ,                                      (1)
climatic variables other than precipitation and temperature             Q     P         E0
and computes runoff sensitivity to net radiation and wind
                                                                       where 1Q     1P       1E0
                                                                                Q , P and E0 are long-term normalized changes
speed at a height of 2 m above the ground. In contrast, fol-
                                                                       in runoff, precipitation and potential evapotranspiration, re-
lowing the Budyko hypothesis, the long-term mean runoff
                                                                       spectively. Consequently, the evaluation of runoff sensitiv-
is mainly driven by the long-term mean of precipitation and
                                                                       ity to climate change requires the estimation of  (the runoff
the potential evapotranspiration rate. Therefore, runoff elas-
                                                                       sensitivity to precipitation) and PET (the runoff sensitivity
ticity coefficient should be an explicit function of precipita-
                                                                       to PET). In Arora (2002) and Yang and Yang (2011) these
tion and the potential evapotranspiration rate. Following this
                                                                       coefficients are computed using empirical equations:
idea, different studies have developed empirical relationships
(Schreiber, 1904; Ol’Dekop, 1911; Turc, 1953; Pike, 1964;               = 1 + β · PET = β,                                      (2)
Zhang et al., 2001). Niemann and Eltahir (2005) demon-
                                                                                    φF 0 (φ)
strated that the estimation of the runoff elasticity coefficient       where β = 1−F (φ) . Therefore, the estimation of the runoff
with these analytical formulas is consistent with the coeffi-          sensitivity coefficients are a function of the aridity index φ
cient calculated from a physically based hydrological model            and the mathematical function F (φ) that relates the runoff
(Niemann and Eltahir, 2004).                                           ratio to precipitation (or PET) to the aridity index. These
   Another method of deriving the runoff sensitivity to cli-           functions have been defined as empirical relations in differ-
mate change is the use of observational datasets. One is able          ent studies. Although these formulas have been developed
to examine how runoff changes as climatic variables change.            to find the ratio of the evapotranspiration rate to the poten-
This assumes that the response of annual runoff to the vari-           tial evapotranspiration rate, they could be rearranged to uti-
ability in annual climatic forcing is the same as the response         lize runoff sensitivity to climate change as in Niemann and
of the long-term mean runoff to the changes in the long-term           Eltahir (2005) and Yang and Yang (2011) (see Table 4).

www.hydrol-earth-syst-sci.net/24/1467/2020/                                           Hydrol. Earth Syst. Sci., 24, 1467–1483, 2020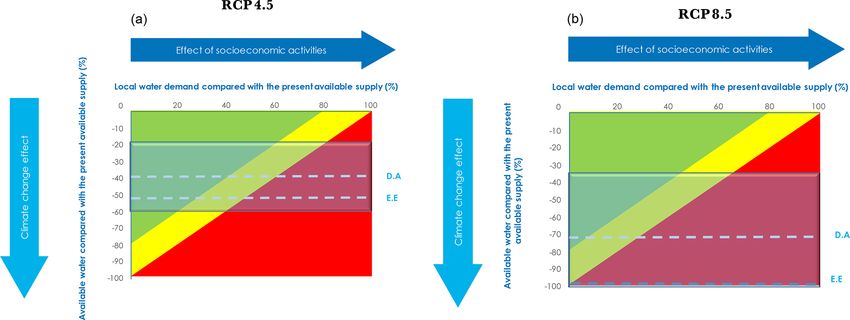
1474                             N. El Moçayd et al.: Climate change impacts on the “Water Highway” project in Morocco

Table 4. Mathematical form of F 0 (φ), where φ refers to the aridity index, and F (φ) is a mathematical function relating the runoff ratio to
precipitation (or PET) to the aridity index.

                                Functional form                                   Name          Source
                                F 0 (φ) = e−φ                                     Schreiber     Schreiber (1904)

                                F 0 (φ) = tanh( φ1 ) −           4
                                                                 1      1         Ol0 dekoop    Ol’Dekop (1911)
                                                                −φ
                                                          φ(e        +e φ )2

                                F 0 (φ) = −            1                          Turc–Pike     Turc (1953)–Pike (1964)
                                                      3/2
                                                          2
                                              φ3    1+ φ1

                                              2    1
                                              φ + φ2
                                F 0 (φ) =                                         Zhang         Zhang (2009)
                                            (1+φ+ φ1 )2

   In the present work, we compare the results from different                           The strong interannual variability in precipitation leads to
empirical relationships. The long-term change in precipita-                          a strong interannual variability in runoff (see Fig. 6c). The
tion is estimated using RCMs (regional climate model) sim-                           pattern of runoff is similar to that of precipitation. The an-
ulations, and the long-term change in potential evapotranspi-                        nual mean runoff is 1 km3 yr−1 . Given its topography, this
ration is derived from the Penman–Monteith equation (Mon-                            watershed represents a good site for Morocco to store water.
teith, 1965) and using RCM simulation results. This method                           However, this region lacks the infrastructure needed to store
is preferred over the Thornthwaite equation (Thornthwaite                            water and to optimize water resource management.
and Mather, 1957) for the reasons described in Yang et al.
(2017).                                                                              3.4.2     Oued Laou
   The second approach utilized here is to evaluate the
changes in runoff as a result of climate change using data                           The Oued Laou watershed is the smallest watershed consid-
analysis. The sensitivity of runoff to climate change is com-                        ered in this analysis. However, due to its geographical posi-
puted via the runoff elasticity coefficient. First we use the                        tion, the region receives a large amount of precipitation com-
definition given by Yang and Yang (2011) and references                              pared with other areas in the country. The annual mean pre-
therein. The runoff elasticity, (Q), is defined as the frac-                        cipitation is about 740 mm, which represents a large quantity
tional change in runoff, Q, due to a fractional change in pre-                       of water falling over a relatively small area (919 km2 ). How-
cipitation, P , as shown in the following equation:                                  ever, the variability in the precipitation received is tremen-
                                                                                     dous, as shown by the coefficient of variation of 43 % (see
          ∂Q P                                                                       Fig. 7), which makes forecasting water availability very dif-
(Q) =      · .                                                             (3)      ficult. Figure 7c presents the variability in the runoff and pre-
          ∂P Q
                                                                                     cipitation over Oued Laou. The variability of runoff seems to
In the present case, the estimation is carried out with the fol-                     follow that of precipitation. The annual mean runoff in Oued
lowing parameters: P is the annual mean precipitation, Q is                          Laou is 0.4 km3 .
the annual mean runoff and ∂Q ∂P is estimated using linear re-
gression.                                                                            3.4.3     Mjara

3.4     Presentation of study areas                                                  The hydrology in Mjara is also characterized by signifi-
                                                                                     cant monthly variability. The annual mean precipitation is
3.4.1    Loukkos                                                                     655 mm, and the coefficient of variation is about 43 %.
                                                                                     Thanks to the gauge station at Mjara, we were able to esti-
The Loukkos watershed is one of the wettest regions in Mo-                           mate runoff. As seen in Fig. 8c, the variability in water avail-
rocco. The annual precipitation is around 790 mm, and the                            ability at Mjara follows the variability in precipitation. This
hydrological regime is characterized by a wet winter and a                           statement is especially true during drought years, such as
dry summer with a precipitation maximum during Novem-                                those that Morocco experienced during the 1990s, when the
ber and/or December (see Fig. 6a). However, precipitation in                         variability of runoff follows that of precipitation very tightly.
the region varies significantly from year to year. The annual                        All in all, the annual average runoff from Mjara, which is
precipitation can reach 1400 mm in some years (see Fig. 6b).                         considered to be the wettest region in Morocco and is the lo-
Indeed, the coefficient of variation of annual precipitation                         cation of the largest (namely Al Wahda) dam in the country,
computed using the ABH Loukkos data is 28 %. Given this                              is 3 km3 yr−1 .
variability, water resource management is a challenging task.

Hydrol. Earth Syst. Sci., 24, 1467–1483, 2020                                                       www.hydrol-earth-syst-sci.net/24/1467/2020/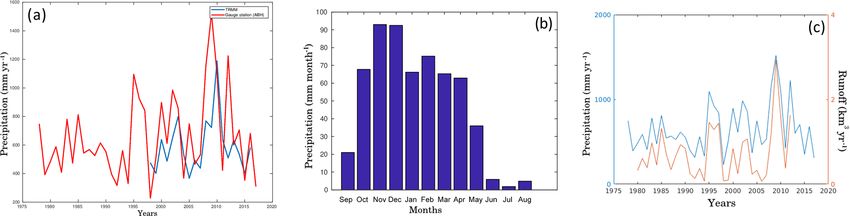
N. El Moçayd et al.: Climate change impacts on the “Water Highway” project in Morocco                                           1475

Figure 6. The hydrology of the Loukkos watershed. (a) Interannual variability of precipitation and comparison with TRMM. (b) Monthly
variability of precipitation. (c) Annual precipitation vs. annual runoff.

Figure 7. The hydrology of the Oued Laou watershed. (a) Interannual variability of precipitation and comparison with TRMM. (b) Monthly
variability of precipitation. (c) Annual precipitation vs. annual runoff.

Figure 8. The hydrology of the Mjara watershed. (a) Interannual variability of precipitation and comparison with TRMM. (b) Monthly
variability of precipitation. (c) Annual precipitation vs. annual runoff.

4     Results                                                        results are summarized in Table 5. There is a large uncer-
                                                                     tainty regarding the amount of precipitation in the future in
4.1    Future changes in precipitation                               the study region. As has been shown in earlier studies (Déqué
                                                                     et al., 2007), the largest source of uncertainties in RCM simu-
                                                                     lations is boundary condition forcing. This would explain the
In order to assess the impact of climate change on water             difference in results in our case when we change the forc-
availability, we have performed numerical simulations (Kang          ing GCMs, even for the same scenario. However, for fixed
et al., 2020), as described in Sect. 3.2. Overall, the resulting     boundary conditions and the same scenario, the level of pre-
simulations forced by the five GCMs agree that precipitation         cipitation decrease is similar over the three watersheds. Fol-
will decrease in the future in the region of interest. However,      lowing RCP4.5, the minimum decrease is simulated when the
depending on the boundary conditions and the scenario con-           forcing GCM is CCSM: the estimated amount of change is
sidered, the magnitude of the decrease differs. All of these

www.hydrol-earth-syst-sci.net/24/1467/2020/                                        Hydrol. Earth Syst. Sci., 24, 1467–1483, 2020
1476 N. El Moçayd et al.: Climate change impacts on the “Water Highway” project in Morocco
Table 5. A summary of the potential changes in precipitation fol- Table 6. Elasticity of the runoff to precipitation estimation and
lowing the RCP4.5 and RCP8.5 simulations with MRCM for the quantification of the uncertainty compared with the analytical for-
five different GCMs’ forcing. mulas given in Table 4.
Oued Laou Mjara Loukkos Oued Laou Mjara Loukkos
MPI
RCP4.5 −16 % −17 % −19 % Elasticity 1.65 1.6 1.7
RCP8.5 −32 % −34 % −33 %
Range of uncertainty 1.12–2 1.4–1.8 1.3–1.8
IPSL GFDL
RCP4.5 −27 % −28 % −27 % in elasticity
RCP8.5 −40 % −44 % −43 %
Turc Pike 1.8 1.6 1.6
RCP4.5 −36 % −31 % −36 %
Ol’Dekoop 1.6 1.4 1.4
RCP8.5 −69 % −71 % −69 %
Zhang 1.9 1.7 1.7
CSM
RCP4.5 −16 % −0.5 % −11 %
RCP8.5 −36 % −37 % −36 % Schreiber 1.8 1.6 1.6
ACCESS
RCP4.5 −34 % −36 % −36 %
RCP8.5 −50 % −54 % −52 %
4.2 Future changes in runoff
4.2.1 Using data analysis
roughly −10 %. The maximum decrease is simulated when
the model is forced with ACCESS: the amount is roughly The first approach used here to assess the climate change
equal to −35 %. As a result, following RCP4.5, the projected impact on water availability is the estimation of the runoff
precipitation change is between −35 % and −10 % for this elasticity coefficient via the analysis of available data. We
region. In contrast, following RCP8.5, the minimum decrease follow the definition described in Sect. 3.3. The objective is
is achieved when the boundary conditions are described by to estimate the potential loss of water that would result from
MPI and is roughly equal to −33 %; however, the maximum the decrease in precipitation using available precipitation and
decrease is simulated when the RCM is forced by IPSL and runoff data over each watershed. We assume that the relation-
is estimated to be around −7 0%. As a result, if the future is ship between precipitation and runoff is well represented by
driven by RCP8.5, precipitation is expected to decrease by past data. This relationship is first described by the slope of
33 % in the best-case scenario and by 70 % in the worst-case the runoff–precipitation relationship as documented in obser-
scenario. On average, following RCP4.5, precipitation is go- vations (see Fig. 9). We then normalize this relationship by
ing to decrease by 24 %, whereas under the scenario RCP8.5, dividing by the ratio of long-term runoff to long-term precip-
the decrease would be 47 %. To summarize, precipitation is itation.
likely going to decrease in the future for this region; however, For the specific case of Oued Laou, only one precipita-
the magnitude of the decrease is uncertain. Nevertheless, the tion gauge station is present. In order to alleviate bias cre-
range of uncertainty has been quantified. ation in the calculation of the elasticity coefficient, we use
These simulations results concur reasonably well with TRMM observations. Figure 9 shows the estimation of the
those from other studies (Patricola and Cook, 2010; Droogers runoff elasticity coefficient for the study region. The three
et al., 2012; Marchane et al., 2017). For example, Tramblay watersheds seem to behave in the same manner when forced
et al. (2018) adopted a multi-model simulation strategy us- by precipitation variability. In general, the elasticity coeffi-
ing different RCMs with a high resolution (12 km) to assess cient is around 1.6; thus, a change of 10 % in precipitation
the climate change impact on water resources in the Maghreb would lead to 16 % change in runoff. When using linear re-
region. Simulations converge towards a decrease in precipi- gression, the uncertainty range could be quantified. In the
tation over Morocco; however, the amount of the decrease is present case, a confidence range was added to the elasticity
subject to a similar uncertainty as that demonstrated in our value, as presented in Table 6. The uncertainty range is large
simulations. The decrease in precipitation is generally mani- for Oued Laou due to the complex topography of this very
fested by a decrease in rainy days and the intensity of precip- small watershed. Mjara and Loukkos have the same range of
itation (Tramblay et al., 2013). Nonetheless, the occurrence uncertainty.
of heavy rain events is identified as the main uncertainty (Fi- Based on the calculation of the runoff elasticity coeffi-
lahi et al., 2017). cients and given the projected decrease in precipitation de-
scribed in the previous section, we are able to estimate the
potential total available water in the three watersheds in the
future. Table 7 summarizes the results. As a metric of the
vulnerability of water availability in the region impacted by
Hydrol. Earth Syst. Sci., 24, 1467–1483, 2020 www.hydrol-earth-syst-sci.net/24/1467/2020/N. El Moçayd et al.: Climate change impacts on the “Water Highway” project in Morocco 1477
Figure 9. Elasticity coefficient estimation for the three watersheds using a regression method.
the project, we show the ratio of the total amount of water to cal equations (see Table 6), the results are similar. The sen-
be transferred (0.86 km3 yr−1 ) to the total available water. In sitivity of runoff to precipitation is around 1.6. In the work
the current climate, about 20 % of the total available water is of Tang and Lettenmaier (2012), the authors estimate runoff
allocated to the Water Highway based on the initial design. sensitivity to changes in precipitation for the major global
On average, following the RCP4.5 projection, it is expected rivers worldwide. We found a good agreement between their
that only 40 % of the actual available water will be lost in the results for this particular region and ours. According to the
future compared with the current climate. As a result, 33 % results reported in Table 8, the change in runoff is largely
of the available water will be allocated to the project if the sensitive to precipitation. If we compute the sensitivity index
design remains the same as in the current climate. of precipitation changes SP according to the index defined
2
Based on the latest reports from the Moroccan High by Saltelli (2002), we find SP = 2 2 = 0.88. This means
+PET
Commission for Planning (http://www.hcp.ma/, last access:
that 88 % of the changes in runoff due to climate change are
5 March 2019), a 27 % increase in demography along with
attributed to changes in precipitation. Ultimately, changes in
an agricultural intensification, which has already lead to seri-
PET only contribute to 12 % changes in runoff.
ously increase water consumption (Molle and Tanouti, 2017),
Following Eq. (1) and in order to fully evaluate changes
is expected. As a result, and assuming that current policies
in runoff due to climate change, an assessment of changes in
extend into the future, water demand will increase by 25 %.
PET is needed, as the changes in precipitation have already
Consequently, the project will probably turn the region
been discussed in a previous section. Using the Penman–
into a water-scarce area. Thus, based on this analysis, the
Monteith equation and RCM results, we plot Fig. 10, where
amount of water transferred should be rescaled in order to en-
we show changes in PET according to RCP4.5 and RCP8.5,
sure that the project does not negatively impact the region. In
respectively. The watersheds of interest are shown using
contrast, following RCP8.5, only 27 % of the actual quantity
black contours in the map. Following RCP4.5, PET is go-
of water is expected to be left in the region, meaning that the
ing to increase by 11 % on average, whereas the increase will
total available water in the region would be 1.19 km3 yr−1 . If
reach 22 % under RCP8.5. These results are summarized in
the project remains in its current form, 72 % (= 0.86
1.19 ) of the Table 8.
total available water in the region will be transferred. Given
Based on this analysis, we are able to say that future wa-
this result, the project becomes infeasible, as local precip-
ter availability is very likely to decrease in the region. This
itation would probably be unable to satisfy the local water
decrease is mainly explained by the two factors that are de-
demand.
scribed in Eq. (2): (1) precipitation, which is the main water
supplier in the region, will likely decrease significantly; and
4.2.2 Using empirical formulas and RCMs (2) the increase in PET will lead to an increase in the loss of
available water by evapotranspiration due to the presence of
As described in Sect. 3.3, we consider the effect of climate significant energy at the surface, which is described by the
change on runoff here. First and PET are estimated us- increase in temperature in the simulations.
ing empirical formulas according to Table 4. Table 8 reports As a result, we are able to quantify the future potential
the values of and the comparison with the corresponding changes in available water in the region, as reported in Ta-
values from regression analysis, we remind the reader that ble 8. Following RCP4.5, the study area will likely lose 44 %
PET = 1 − . These results are similar to previous conclu- of its actual available water, meaning that the region will have
sions on sensitivity changes in runoff in arid and semiarid a supply of only 2.44 km3 yr−1 . Therefore, assuming the cur-
areas (Sankarasubramanian and Vogel, 2003). Moreover, as rent scale of the project, 35 % of the total available water will
we compare the results of the data analysis with the empiri- be transferred. Following RCP8.5, the region is very likely
www.hydrol-earth-syst-sci.net/24/1467/2020/ Hydrol. Earth Syst. Sci., 24, 1467–1483, 20201478 N. El Moçayd et al.: Climate change impacts on the “Water Highway” project in Morocco
Table 7. A summary of the expected loss of water in the three watersheds, and how the project will affect water availability. We assume the
current project design of transferring 0.86 km3 yr−1 . The available water refers to how much water is available in the whole study region.
Project
( Total ) is the ratio of the amount of water that will be allocated to the project, if the project remains in its current form, over the potential
total available water in the study region following each simulation. Based on the uncertainty range given by the regression in the estimation,
we could quantify the uncertainty in our results, as presented in the right-hand column.
Project
Oued Mjara Loukkos Available Total Range of
Laou (km3 yr−1 ) (km3 yr−1 ) water (%) uncertainty
(km3 yr−1 ) (km3 yr−1 )
Present 0.4 3 1 4.4 20 %
MPI
RCP4.5 0.3 2.2 0.68 3.18 27 % 25 %–28 %
RCP8.5 0.19 1.4 0.44 2.33 42 % 35 %–50 %
IPSL GFDL
RCP4.5 0.22 1.4 0.5 2.12 40 % 31 %–40 %
RCP8.5 0.14 0.81 0.27 1.22 70 % 47 %–92 %
RCP4.5 0.16 1.47 0.39 2.02 43 % 34 %–48 %
RCP8.5 0 0 0 0 – –
CSM
RCP4.5 0.3 2.76 0.82 3.88 22% 20 %–22%
RCP8.5 0.16 1.23 0.39 1.78 48 % 38 %–59 %
ACCESS
RCP4.5 0.17 1.26 0.39 1.82 47 % 38 %–56 %
RCP8.5 0.07 0.42 0.12 0.62 139 % 70 %–140 %
Table 8. Summary of runoff sensitivity to precipitation and PET under climate change using the mean of the multi-model simulations and
the estimation of the future total available water in the region.
Oued Laou Mjara Loukkos
RCP4.5 RCP8.5 RCP4.5 RCP8.5 RCP4.5 RCP8.5
β 0.8 0.6 0.6
1P −25 % −45 % −22 % −48 % −26 % −47 %
P
1E0
E0 11 % 22 % 11 % 25 % 10 % 21 %
1P
P −45 % −81 % −35 % −77 % −42 % −75 %
PET 1E
E0
0 9% 18 % 7% 11 % 6% 13 %
1Q
Q −54 % −99 % −42 % −92 % −48 % −88 %
Future available water (km3 yr−1 ) 0.18 0.04 1.74 0.24 0.52 0.12
to suffer water scarcity, as the supply will be dramatically under RCP4.5, the decrease in runoff in the region ranges
reduced. from −40 % to −20 %, and from −60 % to −50 % under
In this study, we were not able to perform hydrological RCP8.5. The main differences in our study come from the
modeling due to the lack of data. In their report, RICCAR fact that the hydrological modeling was performed on the
(RICCAR, 2017) were able to assess the vulnerability of wa- global scale.
ter resources throughout the entire Arab region to climate
change. More specifically, they used RCM results to force 4.2.3 The feasibility of the Water Highway project
two hydrological models (VIC and HYPE) in order to assess
changes in runoff over the Arab region. Their conclusions Based on the previous analysis, we are able to address the
for the Moroccan highlands, where the sensitivity of runoff problem of the viability of the Water Highway project. The
to other parameters such as vegetation have been taken into project aims to transfer 0.86 km3 yr−1 from the northern wa-
account, are similar to the findings of our research: all of the tersheds considered in this analysis (Oued Laou, Loukkos
coupled climate–hydrological model simulations agree that and Mjara) to the southern regions. Numerical simulations
the region is subject to a decrease in runoff due to a decrease have proven that the donor watersheds are going to lose a
in precipitation and an increase in temperature. Moreover, significant amount of precipitation due to global warming;
Hydrol. Earth Syst. Sci., 24, 1467–1483, 2020 www.hydrol-earth-syst-sci.net/24/1467/2020/N. El Moçayd et al.: Climate change impacts on the “Water Highway” project in Morocco 1479 Figure 10. Future changes in PET computed using the Penman–Monteith equation and RCMs following RCP4.5 (a) and RCP8.5 (b), respectively. The three watersheds of interest are shown using contours. Figure 11. Mapping of the vulnerability function of local water demand and supply following RCP4.5 (a) and RCP8.5 (b). The green region is where the project is feasible, the yellow region is where it should be rescaled and the red region is where it is infeasible.The shadowed regions represent the uncertainty levels. “D. A”refers to data analysis, and “E. E” refers to empirical equations. therefore, water availability will also decrease. Following tle water available in rivers. Furthermore, in the latter case RCP4.5, the results based on the estimation of runoff elas- the uncertainty related to analysis is considerably large. In- ticity from data analysis shows that the expected (average deed, the confidence level of the ratio of the expected water from the different simulations) decrease in water availabil- allocation for this project to the total available water in the ity is 40 %, whereas the second study based on the empirical region ranges from 35 % to 100 %. This is even more reason equations shows that the decrease could reach 44 %. As the to advocate phased implementation of the project. uncertainty has also been quantified, the best-case scenario To make things worse, climate change is not the only lim- given by Table 8 is achieved when the project takes only 20 % iting factor in the region. The northern part of Morocco has of the total available water. In this case, the only limiting fac- recently experienced an intensification in water-demanding tor will be the local water demand. This is the primary reason activities, such as agriculture. Therefore, the feasibility of why the feasibility of such project should be examined in a the project also depends on the amount of water allocated phased manner. Alternatively, the worst-case scenario shows to satisfy local demand. Figure 11 maps the regions where that the project could take 56 % of the available water from the project could be feasible (green), where it needs to be the donor region. In this case, there is a clear necessity to rescaled (yellow) and where it is infeasible (red), according rescale the project. Conversely, following RCP8.5, the first to an assumed level of water demand (computed on the basis analysis forecasts a 73 % loss, whereas the second shows that of the present available water) and the supply given by each the region would suffer from severe water scarcity with lit- scenario and each method used to estimate water availabil- www.hydrol-earth-syst-sci.net/24/1467/2020/ Hydrol. Earth Syst. Sci., 24, 1467–1483, 2020
1480                             N. El Moçayd et al.: Climate change impacts on the “Water Highway” project in Morocco

ity. While the vertical axis corresponds to the stress caused         decrease is expected to be in the range between −70 % and
by climate change, the horizontal axis shows how socioeco-            −34 %.
nomic activities will affect the feasibility of the project. The         In order to assess the water quantities that will be lost, we
horizontal line in the figure, corresponding to zero on the ver-      used two different approaches: data analysis and sensitivity
tical axis, represents the present state. Under the current cli-      analysis using empirical equations. In the first approach, we
mate, the design of the Water Highway project requires the            computed the runoff elasticity coefficients based on field ob-
allocation of 20 % of the total available water ( 0.86  4.4 ). This   servations. Overall this analysis shows that a 10 % change
leaves 80 % of the available water to satisfy local water de-         in precipitation will lead to a 16 % change in runoff. Com-
mand. We also plot lines corresponding to the projected wa-           pared with the results of the expected decrease in precipi-
ter quantities that will be lost following RCP4.5 and RCP8.5,         tation, the elasticity analysis indicates that runoff is going
respectively. Following the mitigation projection (RCP4.5),           to be even more sensitive to climate change. In the second
the northern regions are going to lose 40 % (based on data            approach, we assessed the sensitivity of runoff to climate
analysis study) and 44 % (based on the second analysis) of            change using different empirical relationships. The conclu-
the actual available water. This means that if the project re-        sions are similar to previous results. We found that changes
mains in its current form with 4.4 km3 yr−1 of available wa-          in runoff are mainly driven by the decrease in precipitation.
ter, the water demand in the region should not exceed 45 %            Furthermore, we estimated that the potential amount of loss
(20 % + 45 % + 35 % = 100 %) of the present available wa-             following RCP4.5 will result in runoff decreasing by 44 %;
ter. In contrast, if the future is driven by the business-as-usual    however, under RCP8.5, a very little water is likely to flow in
projection (RCP8.5), the project is unlikely to be feasible, as       rivers, as more than 90% of the total available water is likely
the supply would definitely not be sufficient to satisfy local        to be lost.
demand. Little water is likely to flow in streams, as more than          Finally, we have developed a map of vulnerability given
90 % of the total actual available water will likely be lost.         each climate simulation and the future local water demand.
                                                                      This analysis helps to assess the viability of the project based
                                                                      on assumed water demand in the donor watersheds. Un-
                                                                      der RCP8.5, the project is likely unfeasible. However, under
5   Conclusions                                                       RCP4.5, a rescaled version of this project may be feasible de-
                                                                      pending on the level of local water demand that is assumed.
The north–south water transfer project (Water Highway) in             Our results generally agree with the conclusions of Greve
Morocco aims to supply vulnerable regions in the south with           et al. (2018), who discussed the issue on a global scale. Given
water. The project will benefit from the excess water in the          the uncertainties introduced by climate change and reported
northern regions and will transfer 0.86 km3 yr−1 to the south.        in this study, the water transfer project, as an example of wa-
This water transfer will follow three phases, and it will in-         ter resource planning, needs to be carried out carefully and
clude the building of two dams, several pumping stations              implemented in a phased manner.
and 500 km of pipes from the northern region southward                   Based on this work, there are several questions that still
to Al Massira Dam. The project will contribute to alleviat-           need to be addressed. First, given the large uncertainties in
ing water stress in the south, especially supporting the sus-         the climate model simulation results and the climate scenar-
tainability of agriculture. However, despite its great potential      ios, further research is needed to assess the uncertainty. Sec-
positive impacts, the project is largely sensitive to the amount      ond, given the complex hydrological behavior of the water-
of water that will be available in the future. Therefore, its         sheds, there is a need to perform hydrological modeling in
feasibility remains unclear given climate change, which is            order to more accurately assess how climate change will af-
going to affect precipitation over Morocco in general. Re-            fect runoff. Finally, in order to address a global critical anal-
gional climate models (RCMs) agree in predicting that the             ysis of the feasibility of the project, the future local water
future will bring less water; however, there is significant un-       demand driven by the expected population growth and the
certainty regarding the quantity of water that will be lost.          future water-demanding activities should be quantified.
There are several reasons behind this uncertainty in the sim-
ulation results; boundary conditions given by GCMs (global
circulation models) are main contributors to the uncertainty.         Data availability. The data used in this study were provided by
Furthermore, the future simulations are also driven by dif-           the ABH. We are unable to made them publicly available; how-
ferent greenhouse gas emission scenarios, which lead to dif-          ever, the data can be made available upon request (Nabil El Moçayd,
ferent climate projections. In the present study, we used two         nabil.elmocayd@um6p.ma).
projections: RCP4.5 (with mitigation) and RCP8.5 (business
as usual). Following each of the aforementioned scenarios,
                                                                      Author contributions. SK performed the MRCM numerical simu-
the precipitation will decrease in the northern water basins.
                                                                      lations, NEM analyzed the data, and EABE designed the study. The
Following RCP4.5, the decrease is expected to be between
                                                                      three authors contributed equally to writing the paper.
−33 % and −10 %. In comparison, following RCP8.5, the

Hydrol. Earth Syst. Sci., 24, 1467–1483, 2020                                       www.hydrol-earth-syst-sci.net/24/1467/2020/
N. El Moçayd et al.: Climate change impacts on the “Water Highway” project in Morocco 1481
Competing interests. The authors declare that they have no conflict Döll, P.: Vulnerability to the impact of climate change on renewable
of interest. groundwater resources: a global-scale assessment, Environ. Res.
Lett., 4, 035006, https://doi.org/10.1088/1748-9326/4/3/035006,
2009.
Acknowledgements. This work was undertaken in the framework of Dooge, J., Bruen, M., and Parmentier, B.: A simple model for esti-
the UMRP project with financial support from OCP. We are grateful mating the sensitivity of runoff to long-term changes in precipita-
to Alexandre Tuel, Catherine Nikiel, Timothy Adams and the rest tion without a change in vegetation, Adv. Water Resour., 23, 153–
of the Eltahir Research Group for their helpful comments. The au- 163, https://doi.org/10.1016/S0309-1708(99)00019-6, 1999.
thors would like to thank Abdellah Bourak from ABH Sebou for his Doukkali, M.: Water institutional reforms in Morocco, Water Pol-
help with data acquisition. We would also like to acknowledge Ab- icy, 7, 71–88, 2005.
delouahed El Kouri, Rachid Chahri and Salah Eddine Dahbi from Driouech, F., Déqué, M., and Sánchez-Gómez, E.: Weather
ABH Loukkos for their help and beneficial discussions. Finally, we regimes Moroccan precipitation link in a regional cli-
gratefully acknowledge comments and suggestions from the anony- mate change simulation, Global Planet. Change, 72, 1–10,
mous reviewers and the editor. https://doi.org/10.1016/j.gloplacha.2010.03.004, 2010.
Droogers, P., Immerzeel, W. W., Terink, W., Hoogeveen, J.,
Bierkens, M. F. P., van Beek, L. P. H., and Debele, B.:
Financial support. This research was undertaken within the frame- Water resources trends in Middle East and North Africa
work of UMRP with financial support from OCP. towards 2050, Hydrol. Earth Syst. Sci., 16, 3101–3114,
https://doi.org/10.5194/hess-16-3101-2012, 2012.
Dufresne, J.-L., Foujols, M.-A., Denvil, S., Caubel, A., Marti, O.,
Aumont, O., Balkanski, Y., Bekki, S., Bellenger, H., Benshila,
Review statement. This paper was edited by Pieter van der Zaag
R., Bony, S., Bopp, L., Braconnot, P., Brockmann, P., Cadule,
and reviewed by two anonymous referees.
P., Cheruy, F., Codron, F., Cozic, A., Cugnet, D., de Noblet,
N., Duvel, J.-P., Ethé, C., Fairhead, L., Fichefet, T., Flavoni,
S., Friedlingstein, P., Grandpeix, J.-Y., Guez, L., Guilyardi, E.,
Hauglustaine, D., Hourdin, F., Idelkadi, A., Ghattas, J., Jous-
References saume, S., Kageyama, M., Krinner, G., Labetoulle, S., Lahel-
lec, A., Lefebvre, M.-P., Lefevre, F., Levy, C., Li, Z. X., Lloyd,
Alter, R. E., Im, E.-S., and Eltahir, E. A.: Rainfall consistently en- J., Lott, F., Madec, G., Mancip, M., Marchand, M., Masson, S.,
hanced around the Gezira Scheme in East Africa due to irriga- Meurdesoif, Y., Mignot, J., Musat, I., Parouty, S., Polcher, J., Rio,
tion, Nat. Geosci., 8, 763–767, 2015. C., Schulz, M., Swingedouw, D., Szopa, S., Talandier, C., Terray,
Arora, V. K.: The use of the aridity index to assess climate P., Viovy, N., and Vuichard, N.: Climate change projections us-
change effect on annual runoff, J. Hydrol., 265, 164–177, ing the IPSL-CM5 Earth System Model: from CMIP3 to CMIP5,
https://doi.org/10.1016/S0022-1694(02)00101-4, 2002. Clim. Dynam., 40, 2123–2165, 2013.
Batisani, N. and Yarnal, B.: Rainfall variability and trends in semi- Dunne, J. P., John, J. G., Adcroft, A. J., Griffies, S. M., Hallberg,
arid Botswana: implications for climate change adaptation pol- R. W., Shevliakova, E., Stouffer, R. J., Cooke, W., Dunne, K.
icy, Appl. Geogr., 30, 483–489, 2010. A., Harrison, M. J., Krasting, J. P., Malyshev, S. L., Milly, P. C.
Berkoff, J.: China: the South–North water transfer project – is it D., Phillipps, P. J., Sentman, L. T., Samuels, B. L., Spelman, M.
justified?, Water Policy, 5, 1–28, 2003. J., Winton, M., Wittenberg, A. T., and Zadeh, N.: GFDL’s ESM2
Bi, D., Dix, M., Marsland, S. J., O’Farrell, S., Rashid, H., Uotila, global coupled climate–carbon earth system models. Part I: Phys-
P., Hirst, A., Kowalczyk, E., Golebiewski, M., Sullivan, A., Yan, ical formulation and baseline simulation characteristics, J. Cli-
H., Hannah, N., Franklin, C., Sun, Z., Vohralik, P., Watterson, I., mate, 25, 6646–6665, 2012.
Zhou, X., Fiedler, R., Collier, M., Ma, Y., Noonan, J., Stevens, L., Eltahir, E. A., Winter, J. M., Marcella, M. P., Gianotti, R. L., and Im,
Uhe, P., Zhu, H., Griffies, S. M., Hill, R., Harris, C., and Puri, K.: E.-S.: Introducing the MIT Regional Climate Model (MRCM),
The ACCESS coupled model: description, control climate and in: vol. 15, EGU General Assembly 2013, 7–12 April 2013, Vi-
evaluation, Aust. Meteorol. Oceanogr. J., 63, 41–64, 2013. enna, Austria, EGU2013-4124, 2013.
Boke-Olén, N., Abdi, A. M., Hall, O., and Lehsten, V.: High- Feng, S., Li, L. X., Duan, Z. G., and Zhang, J. L.: Assessing the
resolution African population projections from radiative forc- impacts of South-to-North Water Transfer Project with decision
ing and socio-economic models, 2000 to 2100, Scient. Data, 4, support systems, Decis. Support Syst., 42, 1989–2003, 2007.
160130, https://doi.org/10.1038/sdata.2016.130, 2017. Filahi, S., Tramblay, Y., Mouhir, L., and Diaconescu, E. P.: Pro-
Born, K., Christoph, M., Fink, A., Knippertz, P., Paeth, H., and jected changes in temperature and precipitation indices in Mo-
Speth, P.: Moroccan climate in the present and future: combined rocco from high-resolution regional climate models, Int. J. Cli-
view from observational data and regional climate scenarios, Cli- matol., 37, 4846–4863, 2017.
matic changes and water resources in the Middle East and North Gent, P. R., Danabasoglu, G., Donner, L. J., Holland, M. M., Hunke,
Africa, Springer, Berlin, Heidelberg, 29–45, 2008. E. C., Jayne, S. R., Lawrence, D. M., Neale, R. B., Rasch, P.
Déqué, M., Rowell, D., Lüthi, D., Giorgi, F., Christensen, J., J., Vertenstein, M., Worley, P. H., Yang, Z.-L., and Zhang, M.:
Rockel, B., Jacob, D., Kjellström, E., De Castro, M., and van den The community climate system model version 4, J. Climate, 24,
Hurk, B.: An intercomparison of regional climate simulations for 4973–4991, 2011.
Europe: assessing uncertainties in model projections, Climatic
Change, 81, 53–70, 2007.
www.hydrol-earth-syst-sci.net/24/1467/2020/ Hydrol. Earth Syst. Sci., 24, 1467–1483, 2020You can also read