Level(s) indicator 3.1: Use stage water consumption - User manual: introductory briefing, instructions and guidance (Publication version 1.1) ...
←
→
Page content transcription
If your browser does not render page correctly, please read the page content below
Level(s) indicator 3.1:
Use stage water
consumption

                  User manual: introductory
                  briefing, instructions and
                  guidance
                  (Publication version 1.1)

                  Shane Donatello, Mauro Cordella,
                  Nicholas Dodd (JRC, Unit B.5)

                  January 2021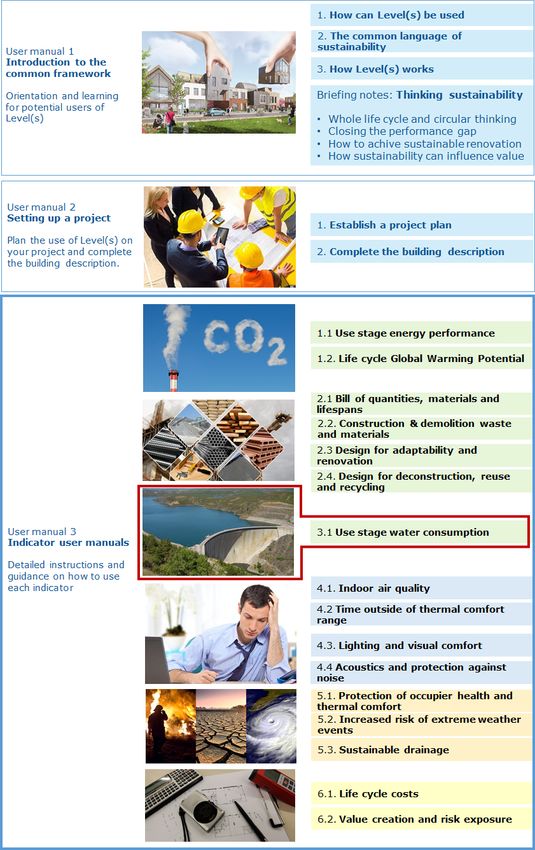
European Commission
Joint Research Centre
Directorate B, Growth and Innovation
Unit 5, Circular Economy and Industrial Leadership

Contact information
Shane Donatello
Address: Edificio Expo. c/ Inca Garcilaso, 3. E-41092 Seville (Spain)
E-mail: jrc-b5-levels@ec.europa.eu

https://ec.europa.eu/jrc
https://susproc.jrc.ec.europa.eu/product-bureau/product-groups/412/home

Legal Notice
This publication is a Science and Policy Report by the Joint Research Centre, the European Commission’s in-house science
service. It aims to provide evidence-based scientific support to the European policy-making process. The scientific output
expressed does not imply a policy position of the European Commission. Neither the European Commission nor any person
acting on behalf of the Commission is responsible for the use which might be made of this publication.

How to cite: Donatello S., Dodd N. & Cordella M., 2021. Level(s) indicator 3.1: Use stage water consumption user manual:
introductory briefing, instructions and guidance (Publication version 1.1)

Title
Level(s) indicator 3.1: Use stage water consumption user manual: introductory briefing, instructions and guidance (Publication
version 1.1)

Abstract

Developed as a common EU framework of core indicators for assessing the sustainability of office and residential buildings,
Level(s) can be applied from the very earliest stages of conceptual design through to the projected end of life of the building. As
well as environmental performance, which is the main focus, it also enables other important related performance aspects to be
assessed using indicators and tools for health and comfort, life cycle cost and potential future risks to performance.

Level(s) aims to provide a common language of sustainability for buildings. This common language should enable actions to be
taken at building level that can make a clear contribution to broader European environmental policy objectives. It is structured
as follows:

     1.    Macro-objectives: An overarching set of 6 macro-objectives for the Level(s) framework that contribute to EU and
           Member State policy objectives in areas such as energy, material use, waste management, water and indoor air
           quality.

     2.    Core Indicators: A set of 16 common indicators, together with a simplified Life Cycle Assessment (LCA) methodology,
           that can be used to measure the performance of buildings and their contribution to each macro-objective.

In addition, the Level(s) framework aims to promote life cycle thinking. It guides users from an initial focus on individual aspects
of building performance towards a more holistic perspective, with the aim of wider European use of Life Cycle Assessment (LCA)
and Life Cycle Cost Assessment (LCCA) methods.
Contents
Contents .................................................................................................................................... 1
The Level(s) documentation structure ...................................................................................... 2
How this indicator user manual works ...................................................................................... 3
Technical terms and definitions used........................................................................................ 4
Introductory briefing ................................................................................................................. 5
Instructions on how to use the indicators at each level ........................................................... 7
   Instructions for Level 1 .......................................................................................................... 7
   Instructions for Level 2 .......................................................................................................... 9
   Instructions for Level 3 ........................................................................................................ 11
Guidance and further information for using the indicator ..................................................... 13
   For using level 1 ................................................................................................................... 13
       L1.4. Checklist design concept 1: Reduce water demand from sanitary fittings ............ 13
       L1.4. Checklist design concept 2: The relative importance of regional water scarcity ... 14
       L1.4. Checklist design concept 3: Consider rainwater harvesting and greywater reuse. 16
       L1.4. Checklist concept 4: Water efficient vegetated areas ............................................ 21
       L1.4. Checklist design concept 5: Potential metering plans ............................................ 23
   For using level 2 ................................................................................................................... 24
       L2.2. Step 3: Filling out cells in columns G and I:............................................................. 24
       L2.2. Step 4: (optional) Estimating minimum irrigation water requirements ................. 25
       L2.2. Step 5: Rainwater harvesting and greywater reuse inputs .................................... 27
       L2.2. Step 7: Comparing results for different options ..................................................... 28

                                                                      1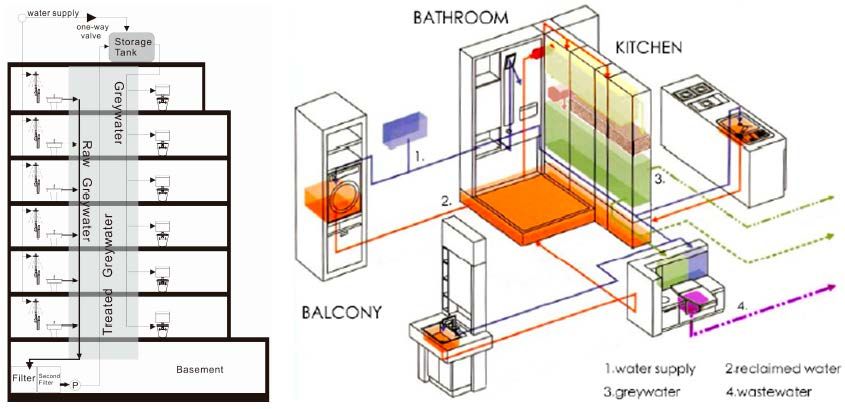
The Level(s) documentation structure

                            Figure 1. The Level(s) document structure

                                               2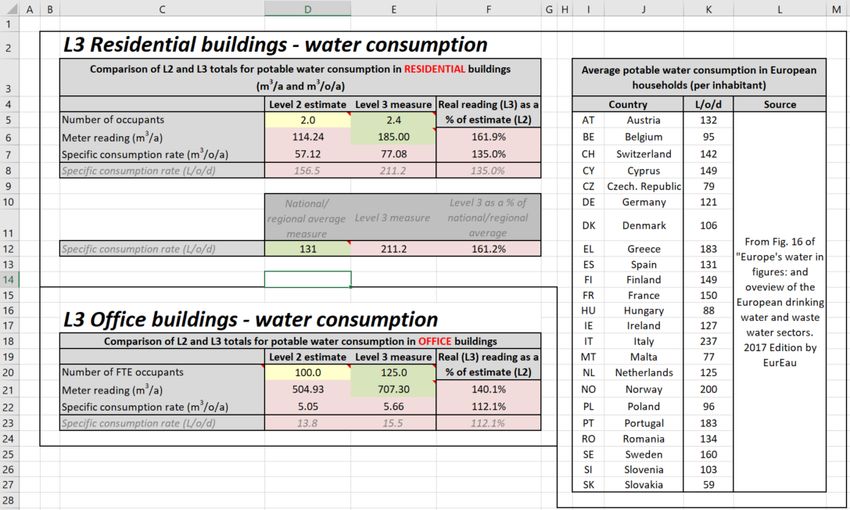
How this indicator user manual works
Level(s) is a framework of core indicators of sustainability that can be applied to building projects in order to
report on and improve their performance. The supporting documentation has been designed to be accessible
to all the actors that may be involved in this process.
If you are new to the assessment of building sustainability, we recommend reading the first part of the Level(s)
user manual. This will provide you with an introduction to the basic concepts behind Level(s) and how you can
apply it to a building project.
If you haven’t yet set up your building project to use Level(s), including completing the project plan and the
building description, then we recommend reading the second part of the Level(s) user manual.
This indicator user manual forms part of the third part of the Level(s) user manual where you will find
instructions on how to use the indicators themselves. It is designed to help you apply your chosen indicator to
a building project. It will help you to do this in the following way:
• Introductory briefing: This section provides an overview of the indicator, including:
why you may wish to measure performance with it,
what it measures,
at which stages in a project it can be used,
the unit of measurement, and
the relevant calculation method and reference standards.
• Instructions on how to use the indicators at each level: This section provides:
step by step instructions for each level,
what is needed to make an assessment,
a design concept checklist (at Level 1), and
the reporting formats.
The instructions often refer to the guidance and further information section, which can be found after
the instructions.
• Guidance and further information for using the indicator: This section provides more background
information and guidance to support you in following specific steps in the instructions, including the
design concepts introduced at Level 1 and the practical steps to calculate or measure performance at
Levels 2 and 3. They are all cross-referenced to specific instruction steps at either level 1, 2 or 3.
This indicator user manual is structured so that once you are familiar with using the indicator and you know how
to work with it, you may no longer need to refer to the guidance and background information, but only work
directly with the instructions at the level of your choice.
3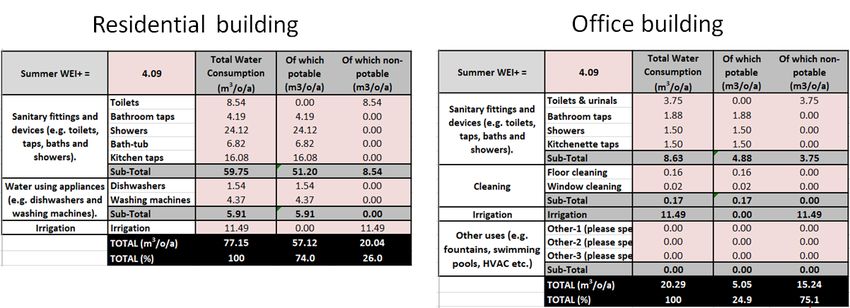
Technical terms and definitions used
       Term                                               Definition
                  A vertical structure where climbing or hanging plants are directly or indirectly supported
  Green facade    to grow up or down the structure. The growing media for these plants is ground-based
                  for climbing plants and plant-trough-based for hanging plants.
                  A vegetated landscape installed on a roof surface in a loose-laid or modular format.
  Green roof      Green roofs may be further classified as extensive, semi-intensive or intensive depending
                  on the depth of the substrate installed and vegetation planted.
                  A vertical structure that is normally fitted with modular, pre-planted panels that contain
  Green wall
                  wall-bound growing media.
                  Domestic wastewater, excluding wastewater from WCs and urinals. This term is
                  normally applied to wastewater from sinks, wash basins, showers, baths, washing
  Greywater       machines and dishwashers. A sub-division into “light greywater” may be used for
                  domestic wastewater from showers, baths and wash-basins, due to their inherently
                  lower organic loads.
                  The practice of supplying water to an area of land through pipes, sprinklers or channels
  Irrigation
                  so that vegetation will grow.
                  Water, in its original state or after treatment, that is wholesome and clean and therefore
  Potable water   suitable for human consumption for drinking, cooking, food preparation and other
                  domestic purposes. The term can be considered as synonymous with “drinking water”.
                  The collection and storage of rainwater to partially or fully meet current and future
  Rainwater       water demand. Rainwater is normally collected from roofs but may also be collected
  harvesting      from other impermeable or pervious ground surfaces depending on the risk of
                  contamination and the intended end use.

                                                     4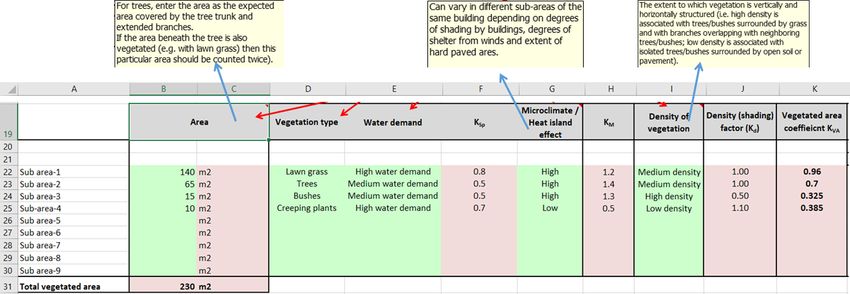
Introductory briefing
Why measure performance with this indicator?
Around 21% of all water abstracted in the EU is used for public supply, the majority of which is used in buildings.
On average, each EU citizen directly uses 160 L/day of water. The trend towards larger urban populations is
placing more pressure on water supply in urban areas. Water consumption is also an operational cost to building
owners/users.
Reducing water consumption will reduce the embodied environmental impacts of delivering water to the point
of demand (i.e. from water abstraction, treatment and pumping through the distribution network). In the case
of hot water, better efficiency also delivers significant energy savings for consumers. A more efficient use of
water will reduce pressure on freshwater resources, especially in river basins that experience continual or
seasonal water scarcity. In areas where desalination is necessary for water supply (especially in southern
Europe), the cost and environmental benefits of efficient water use are significantly higher because much more
energy is needed to treat that water.
The objectives of this indicator are therefore:
• to allow users to understand the main sources of water consumption associated with their building;
• to be aware of the relative importance of water scarcity in the region where the building is located;
• to be able to estimate potential water savings in building design due to rainwater harvesting and
greywater reuse;
• to be able to estimate potential water savings in building fit-out due to the choice of water efficient
sanitary fittings/devices, and
• to assess and optimise the potential impact of irrigation of vegetated areas.
What does it measure?
The total consumption of water is measured for an average building occupant, with the option to split this value
into potable and non-potable water.
At what stage of a project
Level Activities related to the use of indicator 3.1
In the conceptual design, information is provided to prompt discussion and decision
1. Conceptual design (following
making for the project about aspects that will directly or indirectly affect the
design principles)
consumption of water, especially potable water, during the use of the building.
2. Detailed design and
During the detailed design and construction stages, the influence of different design
construction (based on
features and purchases of different devices on estimates of use stage water
calculations, usage rates and
consumption can be made using the excel-based Level(s) water calculator.
occupancy rates)
3. As-built and in-use (based on
Awareness and information relating to circular design features and their potential
product specifications,
future value.
monitoring and metering)
Unit of measurement
Water consumption during the use phase of the building life cycle is measured in units of m3 per occupant per
year, allowing for comparison to buildings of different sizes and occupancy rates.
System boundary
The indicator is focused on the B7 stage (operational water use) of the building life cycle, as per EN 15978. It
includes water used inside the building (i.e. for drinking, for sanitation and for heating, cooling, ventilation and
humidification) and outside the building (e.g. irrigation of vegetated areas, fountains etc.) so long as the outdoor
uses fall within the curtilage of the building area.
Scope
5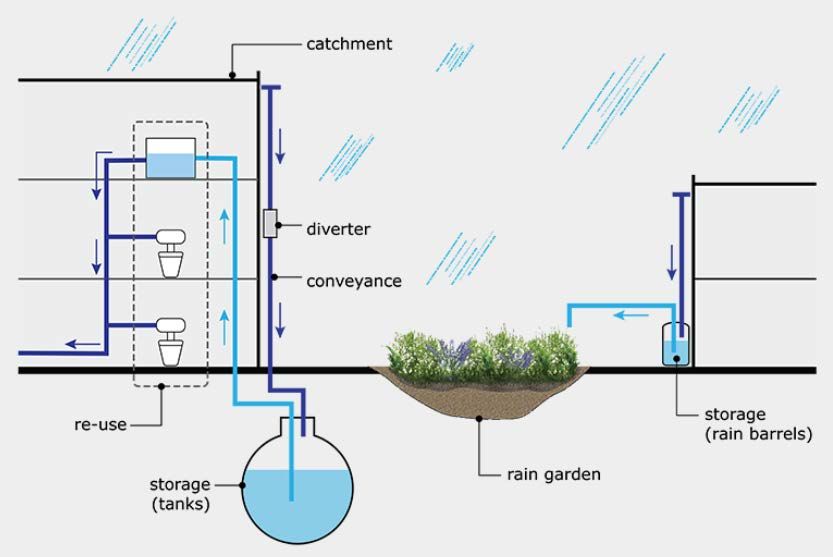
The scope for making estimates of use stage water consumption under Level 2 reporting is slightly different
depending on the building type.

                                  Table 1. Comparison of scopes for residential and office buildings

                                             Residential buildings                                       Office buildings
                                  Toilets, bathroom taps, showers, bath-tubs                  Toilets (incl. urinals), bathroom taps,
 Sanitary fittings
                                                and kitchen taps.                                showers and kitchenette taps.
 Water using appliances               Dishwashers and washing machines                                             -
 Other*                                              Irrigation                            Irrigation, floor cleaning, window cleaning

For real meter readings taken for Level 3 reporting, all sources of water consumption from mains water will be
measured and there is the option to factor in consumption from other sources such as borehole abstraction
onsite, collected rainwater and reused greywater. Attention must be paid to occupancy rates as any inaccuracies
here directly impact results for the unit of measurement used.
Calculation method and reference standards
The calculation used for Level 2 is defined in a bespoke excel calculation sheet 1. The excel sheet is populated
with default occupation rates and default values for water consumption for different water using appliances and
sanitary fittings/devices. These default values should be used in cases where users do not have specific data to
insert. Level 3 measurements should be taken from actual water meter readings and estimates of actual
occupation rates should be made.

1
  See specific indicator 3.1 documents (Word file for instructions and further guidance) and excel file for data input at:
https://susproc.jrc.ec.europa.eu/product-bureau//product-groups/412/documents

                                                                      6
Instructions on how to use the indicators at each level
Instructions for Level 1
L1.1. The purpose of Level 1
The focus of Level 1 is to make the reader aware of 5 highly relevant aspects for reducing and optimising
use stage water consumption, regardless of whether they intend to make estimates at Level 2 or report
real meter readings at Level 3. Users should briefly describe how these Level 1 aspects were considered
(or not) during discussions and decision-making at the concept design stage in a summary table
provided in L1.4.
L1.2. Step-by step instructions
These instructions should be read in conjunction with the accompanying Level 1 technical guidance and
supporting information (see page 13).
    1.   Consult the checklist under L1.4 of water efficient design concepts and read the background
         descriptions in the Level 1 technical guidance.
    2.   Within the design team, review and identify how water efficient design concepts can be
         introduced into the design process.
    3.   Once the design concept is finalised with the client, record the water efficient design concepts
         that were taken into account using the L1 reporting format (see L1.5).
L1.3. Who should be involved and when?
At the concept design stage, the main actors would be the concept architect, the building owner and
the relevant building authority that grants the permit for the construction or renovation activity. If
relevant, a specialist in the design and planning for novel vegetated areas such as green roofs and
vertical gardens should be involved (either directly with the architect or being sub-contracted by the
architect).
Especially for larger building projects, part of the permitting process will involve the relevant water
utility company for the sake of ensuring that a connection to the mains drinking water and mains sewer
networks can be made. Their involvement may be required even if existing connections are in place.
For example if the occupancy rate will increase significantly and if overflow connections for greywater
and rainwater are needed are planned.
Later in the project and as appropriate, the contractor and any specialist sub-contractors will be
responsible for the procurement of efficient water using devices/fittings and the design and installation
of rainwater harvesting systems, greywater reuse systems, landscaping of vegetated areas, irrigation
systems and any additional water metering beyond the mains connection.
L1.4. Checklist of relevant design concepts
The following water efficient design concepts have been identified from best practice and literature
reviewed by the Joint Research Centre as proxies for achieving better performance.

  Level 1 design concept                                       Brief description
 1. Specification of water      Consider the ranges of performance for different choices of sanitary devices and
 efficient sanitary devices     fittings (e.g. tap and showerhead flow rates in L/min, toilet flush volumes in
 and fittings                   L/flush etc.). Consult national or international labelling schemes.
                                Cross-check water exploitation index (WEI+) data for the river basin in which the
 2. The relevance of water
                                building will be located and compare this to other European river basins. Any
 scarcity as a driver for
                                average summer WEI+ value >20% should be flagged as water scarcity being a
 reducing water demand.
                                definite concern.
 3. Examine the potential to    Consider the potential of the building and site for:
 use non-potable water to
 substitute for potable water        -    rainwater harvesting (i.e. look at collection area available and rainfall
 demand.                                  patterns)

                                                        7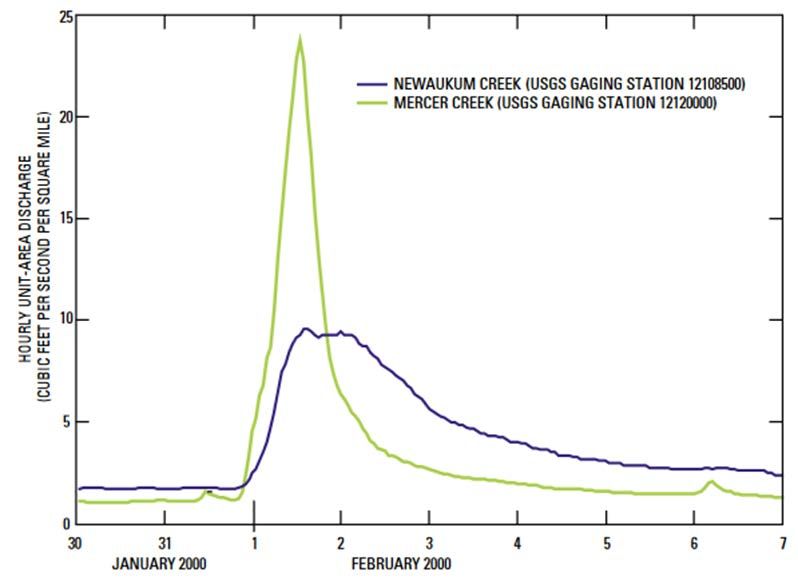
Level 1 design concept                                        Brief description
                                       -    greywater reuse (i.e. consider relevant uses such as toilet flushing and
                                            irrigation together with relevant sources of greywater such as
                                            showers and bathroom wash basins).
                                  When assessing whether or not to have vegetated areas at the building site,
                                  consider how the following aspects can reduce irrigation water demand:
 4. Water efficient vegetated         -    the choice of low water demand plants
 areas                                -    the use of efficient irrigation techniques
                                      -    staging of vegetation and other factors that can create
                                           microenvironments that reduce evaporation rates.
                                  To install multiple meters onsite to better monitor where water consumption is
                                  happening in the building, to better quantify the significance of irrigation and
 5. Metering plan
                                  any contributions of harvested rainwater and reused greywater to total water
                                  consumption.

L1.5. Reporting format

 Water consumption          Addressed?          How has it been incorporated into the building project?
  design concept             (yes/no)                           (provide a brief description)
                                              The use of low-flush toilets with dual buttons (5L full flush and 3L
                                              partial flush) have been specified for replacing the original 7L flush
 1. Specification of                          toilets in the bathrooms.
 water efficient sanitary   Yes
 devices and fittings                         All original bathroom taps were found to have a flow rate of 12
                                              L/min and will be replaced by taps with a flowrate of no more than
                                              8 L/min.
                                              The building project is located in the Ebro river basin in Spain with
 2. Consider the
                                              an average summer WEI+ value of 30,44% during the years 2002-
 importance of water
                                              2014. According to the Level(s) excel tool, this is the 10th most
 scarcity in the river      Yes
                                              water scarce river basin in Europe (out of 105). Hence, water
 basin where the
                                              scarcity is definitely a strong driver for reducing water
 building is located.
                                              consumption.
                                              Greywater reuse (from bathroom wash basins) has been
 3. Potential of
                                              considered for irrigation only. The potential of rainwater
 rainwater harvesting       Yes
                                              harvesting is low, but any rainwater falling on the roof or paved
 and greywater reuse
                                              areas will be diverted to the sump for irrigation water.
                                              The building will include an interior patio garden to be populated
                                              with a lawn area and flowers, which is fed via a closed loop
                                              irrigation system that also includes a fountain and zen water
                                              feature. Spray irrigation during early morning hours is foreseen,
 4. Consider water                            with programmable timing and manual override controls.
 efficiency aspects in      Yes
 any vegetated areas                          The outer curtilage of the building site and car park will be
                                              surrounded by a green border of native shrubs and trees with low
                                              water demand suited to the local climate. Sub-surface drip
                                              irrigation is planned to be installed in these parts. The detailed
                                              design shall be sub-contracted to specialist consultants.
                                              Apart from the normal billing meter for the whole building,
                                              separate meters will be installed to monitor: (i) greywater flows to
 5. Consider a metering
                            Yes               the irrigation system; (ii) the intermittent flows of rainwater to the
 plan
                                              irrigation system and (iii) any necessary potable water flows to the
                                              irrigation system.

                                                         8
Instructions for Level 2
L2.1. The purpose of Level 2
The purpose of Level 2 is to allow users to estimate the per person water consumption in the building
as a function of the water consuming devices, appliances and irrigated areas via an excel-based
calculator. The minimisation of potable water consumption can be evaluated by the specification of
more efficient devices and appliances and by rainwater harvesting and/or greywater reuse.
L2.2. Step-by-step instructions
These instructions should be read in conjunction with the accompanying Level 1 technical guidance and
supporting information (see page 24).
1. Download the Level(s) water calculator.
2. Generate the average summer WEI+ value (a measure of water scarcity) in the “L2 estimate”
worksheet by selecting the country (cell B1) and the river basin (cell B2) in which the building
is located.
3. Fill out the green cells in columns G and I (also in columns J and L for office buildings) to
generate estimates of the total water consumption of the sanitary devices and water using
appliances.
4. If there are any vegetated areas to be irrigated, use the “Irrigation Calc.” worksheet or enter
a direct estimate provided by the specialist contractors.
5. If any rainwater is to be harvested or greywater to be reused, provide an answer for each of
the green cells in columns M, N and Q.
6. A full breakdown of the results is presented in cells F21 to J33 for residential buildings (F75 to
J90 for office buildings). A graphical output of water consumption is also provided in cells M33
to R47 for residential buildings (M90 to R104 for office buildings).
7. If the results generated are just one option and the user wishes to compare them to other
design options for minimising potable water consumption, the cells from O24 to O31 for
residential buildings (O78 to O87 for office buildings) should be copied and pasted as values
into the “L2 comparison” worksheet.
L2.3. What do you need to make an assessment?
The main items needed are as follows:
A completed Level(s) building description.
The excel-based Level(s) water calculator.
The design details that relate to water consuming devices, fittings and appliances that will be
used in the building.
As far as possible, further details that influence water consumption (e.g. toilet flush volumes,
maximum flow rates for taps, size of irrigated areas etc.). In the absence of these details,
default values are suggested in the calculator.
L2.4. Who should be involved and when?
The specification of sanitary devices and fittings should be agreed between the building owner and the
contractor. Fittings should be sought that match the estimates entered into the water calculator as far
as possible. If such fittings cannot be sourced, the data entered into the Level(s) water calculator should
be adjusted to match the devices/fittings that are purchased.
Any architecturally significant building features that relate to water consumption (e.g. gardens, green
roofs, green walls etc.) should involve the architect and specialist consultants/landscapers. When it
comes to construction and installation, it is vital that the contractor/sub-contractor is aware of all
relevant specifications and instructions. Consultation with planning authorities will normally be
necessary to ensure that local, regional or national standards are complied with. The local water utility
may need to be consulted about where to direct any rainwater or greywater overflows.
9L2.5. Ensuring the comparability of results
Between design options for the same building: the “L2 comparison” worksheet has been developed to
allow for different design options of the same building to be compared side by side.
Between different buildings: Not all buildings will have irrigated areas and there may be significant other
uses included for some buildings but not for others (e.g. some offices with showers, some without). By
breaking the results down into individual sanitary fittings and devices etc., and by normalising the
estimates to a per occupant level, it is possible to compare these results between buildings with
different occupation rates.
L2.6. Going a step further
The following steps can be taken in order to make the water consumption estimations more accurate:
• Obtain specific water consumption rate data from suppliers/manufacturers of sanitary
devices, fitting and appliances to be procured – ideally using information based on standard
labelling schemes.
• Where more than one variety of (e.g. toilets with different flush volumes) is to be installed in
the building, take a weighted average flush volume and consider in the weighting if some
toilets will be used more than others based on anticipated building use patterns.
• Where urinals are to be installed, check if the flushing system is automatically triggered by a
timer, automatically triggered by presence sensors or manual triggered.
• Where an office building has shower facilities, consider the likelihood of bicycle access, local
climate and the likelihood of physical activities onsite (e.g. classes for yoga, pilates etc.) that
may influence usage rates of onsite showering facilities.
• Try to separately meter other significant sources of water consumption onsite that cannot be
accurately estimated (e.g. canteen, swimming pool etc.).
L2.7. Format for reporting the results of an assessment
The Level(s) water calculator provides a more detailed breakdown of the total value, which is slightly
different for residential and office buildings.
Figure 2. Level(s) water calculator output for indicator 3.1 use stage water consumption
A separate entry is available for office cleaning and undefined “other uses”. The residential buildings
have a specific entry for washing machines and dishwashers. The calculator output provides a result in
common units for both residential and office buildings (of m3/o/a).
10Instructions for Level 3
L3.1. The purpose of Level 3
Taking measures of actual water consumption requires little more effort than reading the water bill
(presuming that the supply is metered) over the course of one year. However, because the meter
readings do not account for occupancy rates (units are m3/annum), and the Level(s) reporting does
(units are m3/occupant/annum), it is important that some guidance is provided about how to: (i)
estimate occupation rates of the building, and (ii) compare Level 2 estimates with Level 3 measures.
L3.2. Step-by-step instructions
The following instructions are provided for converting the meter readings (in m3/annum) to an average
per occupant consumption rate (in m3/occupant/annum). These instructions are written with a focus
on office buildings, but the same principles can be generally applied to residential buildings as well:
1. Estimate the number of days that the building is occupied for normal use (e.g. offices may
close for weekends and national holidays, residents may go on holiday).
2. Estimate the number of full time equivalent staff in the office. This may be based on
information relating to human resources and employee contracts. Personal holiday
entitlements should also be factored into the calculation. A full time-equivalent day is
considered as 8 hours in the office for one person.
3. Consider if visitor numbers are significant compared to the office employees. When assessing
visitor numbers, it should also be considered against full time equivalents (e.g. 4 visitors
staying for 2 hours could be equivalent to 1 person working 8 hours).
4. From the information in steps 2 and 3, calculate the full time equivalent occupants in the office
building and enter it into cell E20 (or cell E5 for residential buildings) of the “L3 measure”
worksheet..
5. Enter the actual meter reading (m3/a) into cell E21 for office buildings (or cell E6 for residential
buildings) of the “L3 measure” worksheet.
6. (optional comparisons) If users want to convert the Level 2 estimate into an estimated meter
reading, for direct comparison with the actual Level 3 meter reading, they should fill out the
estimated occupancy rate (yellow cells D5 or D20 in the “L3 measure” worksheet). For
residential buildings, there is the additional option to compare values to national per capita
water consumption averages in households.
L3.3. What do you need to make an assessment?
The main items needed are as follows:
A completed Level(s) building description
Meter readings of potable water consumption (from the water utility) and, potentially, meter
readings of supplied rainwater and/or greywater.
A calculation to estimate the occupancy rate of the building (average full time equivalent
occupants in the building per day).
L3.4. Who should be involved and when?
The building owner, occupier or whoever pays the water bill must provide the real potable water
consumption data over a one year period. The occupier(s) of the building should be responsible for
estimating the occupancy rate. With this data, any user can then carry out the Level 3 measure (in units
of m3/o/a).
The water utility may be able to provide additional background data about normal consumption
patterns in the local or regional area in similar types of building (or in the old building in cases of
renovation projects).
L3.5. Ensuring the comparability of results
11By normalising the water meter readings to a per occupant basis (i.e. m3/o/a), the Level 3 result can be
compared between different buildings.
L3.6. Format for reporting the results of an assessment
The calculator output provides a final result in common units for both residential and office buildings
(of m3/o/a). The result is also expressed as L/o/d to allow for direct comparison with national averages
for residential buildings. Unlike Level 2 reporting, no breakdown of water consumption for different
devices and appliances is provided, because meter readings will not provide such detail.
Figure 3. Screenshot of “L3 measure” reporting format.
The number of equivalent occupants (for Level 2 or 3) is always an estimate, but should be as accurate
as possible. It is clear that the difference in Level 2 estimates and Level 3 measured values is influenced
directly by any differences in occupancy rate. If users wish to cancel these differences out, they could
see what happens when matching the occupancy rates for Level 2 to those that were calculated for
Level 3.
12Guidance and further information for using the indicator
For using level 1
Additional background guidance and explanations are provided for 3 key concepts introduced in the
Level 1 design concept checklist, namely:
• L1.4. Checklist design concept 1: Considering how to reduce water demand from sanitary
fittings
• L1.4. Checklist design concept 2: Understanding water scarcity in the context of building
location
• L1.4. Checklist design concept 3: Consider rainwater harvesting and greywater reuse
• L1.4. Checklist design concept 4: Consider the incorporation of vegetation on building
surface(s)
• L1.4. Checklist design concept 5: Potential metering plans
L1.4. Checklist design concept 1: Reduce water demand from sanitary fittings
The three main sources of water consumption in buildings all relate to sanitary fittings: toilets,
showers/baths and bathroom/kitchen taps.
Figure 4. Split of water consumption in households in England and Wales
Source: Environment Agency, 2010 2.
In residential buildings, the use of toilets, bathroom taps and showers accounts for around 61% of total
household water consumption. A check of products listed on the European Water Label website 3 shows
the following ranges of performance of tap, shower, bathtub, urinal and toilet performance.
Table 2. Ranges of performance reported under the European water label catalogue.
General
No. products Most Least General range of
Type of product improvement
(Sept. 2020) efficient efficient performance
potential
WC suite ca. 3700 1.5 L/flush 9.0 L/flush 2.95-6.0 L/flush Factor of 2
Bath-tub ca. 3700 11 L 360 L 80-185 L Factor of 2.3
Shower controls ca. 530 4.0 L/min 8.0 L/min 4.0-8.0 L/min Factor of 2
Shower handsets ca. 800 4.0 L/min 50.0 L/min 6.0-12.0 L/min Factor of 2
Wash basin tap ca. 3700 1.3 L/min 150.5 L/min 4.0-12.0 L/min Factor of 3
2
Environment Agency, 2011. Greywater for domestic users: an information guide.
3
http://www.europeanwaterlabel.eu/findaproduct.asp?country=&category=4&rating=&manufacturer=&order=2#page=1
13Kitchen sink tap ca. 820 1.3 L/min 106.4 L/min 4.0-12.0 L/min Factor of 3
For all types of product listed above, a minimum improvement factor of 2 in specific water consumption
can be achieved for activities relating to personal washing and toilet flushing if values reported in the
catalogue are considered (ignoring extremely high and low consumption products listed in the
catalogue).
L1.4. Checklist design concept 2: The relative importance of regional water scarcity
While improving the water efficiency of buildings via design choices is important in all cases for the
environmental benefits it can deliver, it is even more important in areas that suffer from continuous or
seasonal water scarcity. Water scarcity is measured by the EEA via a measurement known as the Water
Exploitation Index (WEI+).
What is the Water Exploitation Index (WEI+)?
The basic conceptual model of the WEI+ indicator is shown below.
Figure 5. Conceptual model of the WEI+ indicator
Source: https://www.eea.europa.eu/data-and-maps/indicators/use-of-freshwater-resources-3/assessment-4
The WEI+ value over a defined period of time is essentially the net quantity of water abstracted from a
defined river basin by human activity divided by the average renewable freshwater resources present
in that basin during that time. The four main abstraction types relate to agriculture, electricity
production, manufacturing and public water supply. Water consumption is one part of the public water
supply.
According to Raskin et al. (1997) 4, when human abstraction exceeds 20% of freshwater resources, the
river basin is suffering from water scarcity. When abstraction exceeds 40%, severe water scarcity is
assumed. The EEA has produced an interactive map of European river basins where WEI+ values are
colour coded depending on what percentage range they lie in.
4
Raskin, P., Gleick, PH., Kirshen, P., Pontius, RG. Jr., Strzepek, K., 1997. Comprehensive assessment of the freshwater
resources of the world. Stockholm Environmental Institute, Sweden.
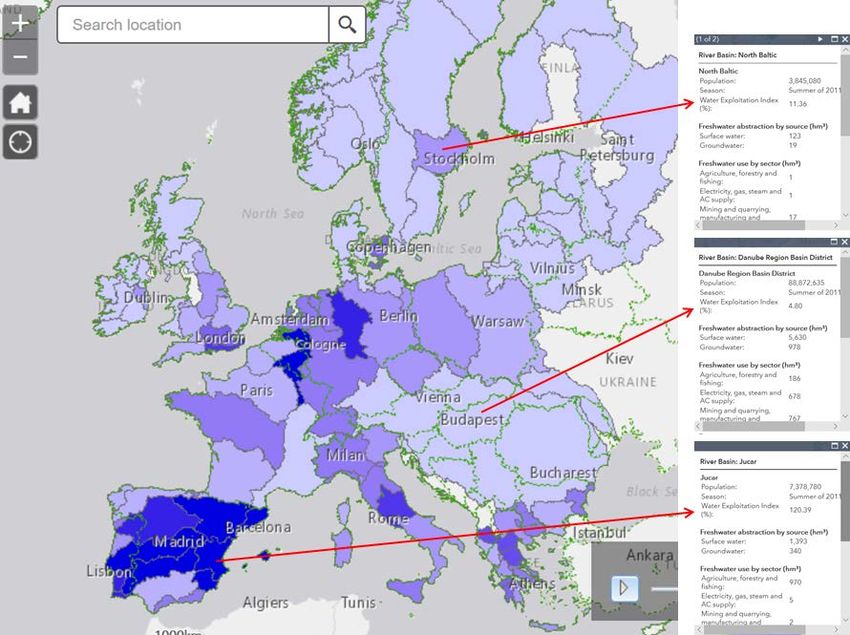
14Figure 6. A snapshot of the EEA WEI+ map of European river basins (summer 2011)
Source: https://www.eea.europa.eu/data-and-maps/indicators/use-of-freshwater-resources-3/assessment-4
In the Figure above it is clear that the WEI+ values vary considerably from one river basin to another in
the summer of 2011. Summer water scarcity is notably higher in most of the southern European river
basins, especially in Spain, Greece, Cyprus and Malta. However, summer water scarcity can also occur
in other parts of Europe due to prolonged periods of low rainfall in basins where there is major
agricultural activity and/or where there are high density urban populations.
For convenience, the Level(s) water calculator allows users to see the annual average summer WEI+
index for their river basin simply by selecting the relevant options from two dropdown menus.
Furthermore, the specific summer WEI+ value is averaged over 12 years of data (from 2002 to 2014)
and is ranked with the other 104 river basins for which average summer WEI+ values could be generated
(see below).
15Figure 7. Screenshot of the input (cells B1 and B2) and output (cells B3, B4 and the red line on the graph) of WEI+
in the Level(s) water calculator
In the river basin chosen above, the Level(s) water calculator output (on the “L2 estimate” worksheet)
shows that the average summer WEI+ is 4.09%, implying that the river basin is not subject to water
scarcity. Compared to other river basins in Europe, it ranks 55th out of 105. The graph also shows that
18 of the 105 river basins have average summer WEI+ values that exceed 20% (i.e. suffer from summer
water scarcity).
L1.4. Checklist design concept 3: Consider rainwater harvesting and greywater reuse
Even if rainwater harvesting or greywater reuse is not to be carried out for in the new/renovated
building, there is the possibility for construction/renovation activities to leave sufficient space in service
conduits for additional piping to be installed in the future. This way, any future renovation could be
carried out with relatively little additional complication and disruption. Given the potentially long life
times of buildings, potential future changes in regional water scarcity and different attitudes of
potential future owners/occupiers, making provision for future rainwater harvesting and greywater
reuse infrastructure is to be encouraged.
Rainwater harvesting
The two crucial factors to take into account when considering rainfall harvesting potential are: (i) the
total annual rainfall data and (ii) the area available for collecting rainfall. If one factor is limited, the
other would need to compensate to harvest a given amount of rainwater.
In cases where rainwater harvesting is of potential interest, it is worth considering the direct and
indirect impacts listed below.
Table 3. Potential benefits and inconveniences of rainwater harvesting and greywater reuse systems
Potential benefits Potential inconveniences
Reduced potable water demand from public supply Need for periodic inspection and maintenance of
– associated environmental benefits. filters and first-flush devices.
16Potential benefits Potential inconveniences
Reduced potable water demand from public supply Need for tank(s)/pond(s) volume to store rainwater.
– associated cost benefits.
Increased potential for water features and vegetated Rainwater may be contaminated by bird droppings,
areas onsite – aesthetic, biodiversity, well-being and turn stagnant or attract insects if not filtered and
evaporative cooling benefits. stored adequately.
Reduced storm runoff rates to natural watercourses Reduced intensity of storm-related flushing of mains
or combined sewers – reduced flood risk or reduced sewerage network in areas where combined sewers
risk of sewer overflow are installed.
If rainwater is stored on a green roof, improved Green roofs need to be quite flat and require careful
cooling of roof on outer surface. structural design to account for varying loads and
impermeablisation.
Rainwater harvesting systems are low-tech and can be installed completely external to the building,
(e.g. collecting water from the roof for garden irrigation) or it can be integrated into the building
plumbing in cases where it can be used as a source of water for flushing toilets.
Figure 8. Illustration of rainwater collection for toilet flushing (left) and garden irrigation (right)
Source: https://www.next.cc/journey/design/rain-water-harvesting
Rainwater is generally free of impurities but it may pick up dust, bird droppings and leaf litter as it flows
across collection surfaces. There are no standard quality requirements for harvested rainwater. If used
for irrigation or toilet flushing, simple filtration or first-flush diversion may be all that is needed.
However, if used for other sanitary purposes, the harvested rainwater might need to be disinfected, for
example via exposure to UV light.
Treatment of rainwater can be applied upstream (e.g. screening >1mm), within (e.g. sedimentation) or
downstream (e.g. filter and/or disinfection) of the rainwater storage device.
The main design considerations for rainwater harvesting are presented in EN 16941-1. The location of
rainwater storage tanks is an important consideration to make. It is recommended that collection
rainwater always flows by gravity or siphonic action to the collection tank. Tanks are normally the most
expensive part of the harvesting system. The choice of material (e.g. polyethylene, metal, fibreglass,
concrete etc.) and whether it is above or below ground will influence the cost. Underground storage is
more expensive but leaves free space on the ground and the stored rainwater will be subject to less
17diurnal temperature variation. In more creative solutions, some or all of the rainwater harvesting
capacity could be incorporated into surface ponds.
The sizing of the storage tank(s) will depend on how much rainwater can be harvested and how much
potable water demand the designer wishes to substitute. In climates with prolonged dry seasons, the
storage capacity should ideally be sufficient to cover the targeted needs during the dry months.
However, a larger storage capacity will increase the cost.
Harvesting rainwater also reduces the risk of flooding in downstream areas. Such risks have increased
in many areas due to the development of floodplain sites and the general impermeablisation of the
ground. In urban areas with standard drainage systems, storm water is much more rapidly conveyed
from the surface to the nearest watercourse than in an equivalent greenfield area.
Figure 9. Specific runoff rates in an urban stream (green) and a rural stream (purple) that are located in the same
area.
Source: Konrad, 2003. 5 USGS Fact Sheet FS-076-03. Effects of urban development on floods.
Due to short-medium term storage of rainwater in the rural catchment, a lower peak flow in
downstream watercourses (purple line) is observed, translating into a reduced risk of flooding for a
given storm event or sequence of events. The exact same hydrographic tendency in the Figure above
can be applied to combined sewers (i.e. sewers which collect both sewage and stormwater).
Peak flow in combined sewers is important because sewage works are designed only to accept a
maximum hydraulic flow of wastewater. If this flow is exceeded, the excess flow is diverted to overflow
tanks, which in turn drain back to the works inlet or to the nearby watercourse. In catchment areas
where rainwater is collected, the peak flow arriving at the sewage treatment plant is lower and so the
probability of sewage overflowing directly to the local watercourse is reduced. In extreme cases, in
some areas, parts of the sewerage network can become saturated, leading to the backflow of sewage
out of manholes and into the street. In areas where the sewerage network is prone to such backflows,
rainwater harvesting and the decoupling of stormwater flows from combined sewers should be a
priority for local authorities.
In cases where rainwater storage capacity is exceeded, an overflow device must be in place to divert
the excess rainwater away from the site (e.g. to a natural watercourse, storm drains or sewer network.
Conversely, in cases where rainwater supply is insufficient, a back-up supply of potable water or non-
5
Konrad CP., 2003. USGS Fact Sheet FS-076-03. Effects of urban development on floods.
18potable water from other sources should be available for the relevant water using devices and
appliances.
Greywater reuse
The reuse of greywater is relevant for all building types, regardless of climate and building morphology.
Greywater is basically domestic wastewater that comes from wash basins, showers, bathtubs, washing
machines, dishwashers and kitchen sinks. Normal building use activities are constantly generating
greywater but as soon as it is mixed with the flushings of toilets, it can no longer be considered as such.
Consequently, for greywater reuse to be feasible, it is necessary to:
• Have separate collection networks for greywater and for other domestic wastewater.
• Have a treatment system for greywater installed onsite.
• Have a distribution network to take the treated greywater to the point of reuse.
Design considerations
Volumetric demand and supply: The demand for greywater should dictate how many sources should
supply greywater. The number and type of supplying sources should be considered together with their
total daily volumetric inputs, their usage patterns and their peak flowrates.
Greywater storage capacity: The standalone storage of untreated greywater is not recommended. Any
storage prior to treatment should be linked to directly to the inlet of the treatment system. The
necessary storage volume for treated greywater will be influenced by the demand and supply patterns.
However, as a general rule of thumb, storage capacity of no more than 1 day of greywater supply is
normally sufficient. To remedy any excess of supply, greywater storage tanks must have an overflow
that diverts excess greywater to the sewer or other suitable outlet. For situations of excessive
greywater demand, potable water inputs to the greywater tank (or directly to the devices or appliances
accepting greywater) should be possible via installed connections.
Organic load of the greywater: Organic matter will be metabolised by bacteria and can lead to the
water turning anoxic or anaerobic, with subsequent formation of odorous gases. There is a higher
organic load in greywater from kitchen sinks and dishwashers (due to fats, oils, grease and food waste)
than greywater from washing machines, showers and bathroom wash basins. For this reason, the
preferred sources of greywater inputs are in the following order (lowest organic load first): shower and
bathtubs < bathroom wash basins < washing machines < kitchen sink and dishwasher.
Treatment of greywater: There are a variety of treatment options available which, in order of increasing
complexity are generally as follows:
- direct reuse systems with no treatment (only recommended for sub-surface and non-spray
irrigation);
- short retention systems with basic skimming and limited sedimentation of large particles;
- basic filtration and disinfection systems where suspended solids are removed and disinfection
may be carried out by the addition of chemicals and/or exposure to UV light.
- biological systems where bacteria metabolise dissolved organic material
- bio-mechanical systems, which operate under the same principles as biological systems, but
which also include mechanical aeration and the separation of solids (e.g. via sedimentation,
filtration or floatation)..
The extent of treatment required is also influenced by the source and intended use of the greywater.
Toilet flushing and non-spray irrigation with greywater from showers will lead to fewer concerns about
greywater treatment level than laundry or spray-irrigation applications with greywater from kitchen
sinks.
19Although Regulation (EU) 2020/741 6 sets minimum requirements for treated urban wastewater prior
to reuse in agriculture, there are no such EU level requirements set for the reuse of greywater. Any
quality requirements for greywater reuse should be checked at the local, regional or national level (e.g.
BS 8525-1 7 in the UK and various regulations in Spain 8). For example in the UK, guideline values for
monitoring of the performance of greywater systems refer to Ecoli, intenstinal enterococci, legionella
pneumophila, total coliforms, turbidity, pH and residual chlorine/bromine.
Figure 10. Examples of a multi-dwelling (left) and single dwelling (right) greywater system.
Source: Juan et al., 2016. 9
In the multi-dwelling approach shown above, greywater from showers and bathroom wash basins is
fed by gravity to a greywater filtration system in the basement. The filtered greywater will then be
collected in a sump and pumped to a treated greywater storage tank in the attic or roof area of the
building. From this tank, greywater is fed exclusively to toilets in the dwelling by gravity. The sump in
the basement, the pump and the attic storage tank need to be carefully sized to ensure that there is
normally enough greywater to meet most or all of the toilet flushing needs. If the greywater supply
exceeds toilet flushing demand (e.g. residents taking long showers and using low-flush volume toilets,
then a secondary use for the excess greywater overflow should be sought (e.g. irrigation of communal
gardens or periodic street cleaning. While the centralised multi-dwelling system is relatively simple and
space efficient, it could be argued that it is not energy efficient for greywater to flow down from the
top floor to the basement before being pumped back up to the roof again. This could have notable
impacts on the carbon footprint associated with water consumption 10.
In the single dwelling example above, the potable water supply comes via the blue line to the shower,
toilet, wash basin, kitchen sink and washing machine. Greywater from the shower, wash basin, kitchen
sink and washing machine is fed by gravity along the orange lines to an underfloor greywater collection
sump. From there it is pumped through a vertical standing filtration system, producing a treated
greywater (green line) that is fed to the toilet and other potential outlets (e.g. irrigation). Toilet
flushings are sent to the mains sewer via the purple line.
6
Regulation (EU) 2020/741 of the European Parliament and of the Council of 25 May 2020 on minimum requirements for
water reuse. OJ L 177, 5.6.2020, p.32-55
7
BS 8525-1:2010. Greywater Part 1 – a code of practice, see www.standardsuk.com
8
Domenech L. and Valles M., 2014. Local regulations on alternative water sources: greywater and rainwater use in the
metropolitan region of Barcelona. Investigaciones Geograficas, 61, pp. 87-96. DOI: 10.14198/INGEO2014.61.06
9
Juan Y-K., Chen Y., Lin J-M., 2016. Greywater reuse system design and economic analysis for residential buidings in Taiwan.
Water, 8, 546; doi:10.3390/w8110546
10
Environment Agency 2010. Energy and carbon implications of rainwater harvesting and greywater recycling. Report
SC090018. ISBN: 978-1-84911-198-0.
20Adequate labelling of pipes and values is highly recommended when installing any greywater reuse
system and the same cost arguments apply about greywater storage tanks as for rainwater storage
tanks. However, the scale of rainwater storage capacity should be much greater than that of greywater
due to the regular production of greywater, the concerns about greywater turning anaerobic and the
need to optimise rainwater supply for prolonged dry periods.
L1.4. Checklist concept 4: Water efficient vegetated areas
Irrigation water is required for vegetated areas to compensate for water that is lost by
evapotranspiration. This term accounts for losses of water by evaporation from the soil, and from
transpiration by plants. Evaporation rates depend on climatic conditions like wind speed, humidity, air
temperature and soil temperature. Transpiration rates depend very much on the plant species in
question, its anatomy, physiology and biochemistry, which in turn determine how it responds to the
given environmental conditions.
Plants transpire water since it is the medium by which mineral nutrients are absorbed by roots, and
transported throughout the plant (via xylem) and released to the air via special pores in leaves/shoots
and flowers called “stomata”. The release of water by transpiration generates to pressure drop
necessary for more water to be taken up by the roots. The water demand of vegetated areas depends
on a number of factors which can broadly be grouped as follows:
• Plant species: the inherent amount of water for the physiological functions of the plant to be
correctly maintained. Under any given set of conditions, one plant species will need more or
less water than another. This is basically the plant water demand.
• Below ground factors: such as the water absorption capacity of the soil, soil cover, soil
temperature and soil permeability.
• Above ground factors: basically microclimatic conditions like exposure to wind, sunlight, other
heat sources and humidity.
• Irrigation system efficiency: this depends on how precisely the water is delivered to the point
of demand (i.e. to the soil surrounding the plant roots).
These factors act in combination as well. For example, using spray irrigation at 3pm in the afternoon
will reduce irrigation efficiency both due to a certain fraction of the water not reaching the plant roots
and due to the increased evaporation rate of the water since it is being sprayed at the hottest part of
the day.
Choice of plant species
The careful consideration of plants that are well adapted for the local climate will mean that they are
unlikely to require any additional irrigation. The natural variations in rainfall throughout the seasons
should suffice for native plants most of the time. Perhaps only intermittent irrigation would be needed
during periods of prolonged drought.
Especially in areas with low annual rainfall in general, xeriscaping principles could be applied.
Xeriscaping is a term commonly used for the landscaping of areas with low or very low water demand
plants. It should be noted that xeriscaped areas may differ significantly from an aesthetic point of view
when compared to more heavily irrigated areas such as a grass lawn. Such plants are especially relevant
in Mediterranean climates, where a number of low water demand plant varieties have been reviewed 11.
Regardless, users should be aware of the wide range of different water demands across different plant
types (e.g. trees, bushes, creeping plants, lawn grass etc.), herbaceous perennials, annual flowering and
bedding plants, turfgrass) and individual species within each plant type. A method for determining
plant water demand, specifically for landscaping plants is set out in: “ANSI/ASABE S623.1: Determining
11
Baltzoi P., Fotia K., Kyrkas D., Nikolaou K., Paraskevopoulou AT., Accogli AR., Karras G., 2015. Low water-demand plants for
landscaping and agricultural cultivations – a review regarding local species of Epirus/Greece and Apulia/Italy. Agriculature and
Agricultural Science Procedia 4, 250-260.
21landscape plant water demands”, published by the American Society of Agricultural and Biological
Engineers in 2017.
If large plant species are to be incorporated, attention must be paid to the space needed for proper
root anchorage and to any potential conflicts between root systems, nearby infrastructure and nearby
hardscaped areas, for the benefit of all three. A variety of considerations are presented by Watson et
al. (2014) 12.
Below ground factors
In the conceptual design, attention should be paid to aspects such as the impermeable liners in bedding
areas where vegetation shall be established. The benefit here would be that water is not lost during
excessive irrigation or rainfall, but can be conveyed to a desired point or retained in the soil profile.
The incorporation of organic matter into the soil will improve its water retention capacity. The
application of a mulch layer at the surface (e.g. a layer of bark chips, pine needles, grass cuttings, leaves
and/or straw) provides an input of organic matter that can be periodically replenished and also serves
to reduce evaporative losses from the underlying soil.
Above ground factors
The location of any vegetated areas can be considered in the conceptual design. For the sake of
minimising soil evaporation, microclimate factors such as wind barriers (e.g. from walls), the potential
heat island effect and exposure to direct sunlight should be considered. The staging of vegetation (e.g.
bushes or grass under trees) should be considered too. In addition to the use of a surface mulch layer,
these factors can also help reduce soil erosion.
Efficient irrigation systems
At the Level 1 stage, it is enough to consider the range of efficiencies of different irrigation techniques.
The most appropriate technique will be partly influenced by the uniformity of water distribution
necessary. For example, lawn grass will have a dense but shallow root zone equally spread across the
vegetated area. The simplest way to cover the entire area is via spray irrigation techniques, but these
are not so uniform in their distribution and often the way to compensate for poor uniformity is to
increase the area covered, the number of spraying points or the irrigation time, all of which will lead to
higher specific irrigation water consumptions. For larger plants with deeper and more extensive root
systems, uniformity is not important and drip-fed subsurface irrigation is particularly useful.
In order to be able to evaluate the efficiency of the planned irrigation system, the possibility of controls
that are easy to reprogram based on observations of the state of the vegetation and soil should be
foreseen. In a similar vein, control features such as soil moisture sensors or rainfall monitoring to
automatically determine if irrigation is actually necessary on a given day would be beneficial 13 (e.g. no
point irrigating after a thunderstorm in the summer). Other features that can improve the operability
of the system, such as strainers/filters, electrically actuated valves, one-way valves, pressure release
valves, air bleeding valves and drain/flush valves should be considered in the conceptual design.
There are a number of different types of irrigation system, all of which can have their own irrigation
efficiency. Broadly speaking, the following systems can be considered:
• Drip irrigation via buried pipes.
• Drip irrigation via pipes on ground surface.
• Bubblers and micro-sprinklers.
• Sprinklers (stationary type, pop-up type, rotary type, with varying operating pressures).
12
Watson GW., Hewitt AM., Custic M., Lo M., 2014. The management of tree root systems in urban and suburban settings II:
A review of strategies to mitigate human impacts. Arboriculture & Urban Forestry, 40(5) p.249-271.
13
Myriounis C., Tsirogiannis IL., Malamos N., Barouchas P., Babilis DI., Chalkidis I., 2015. Agricultural and urban green
infrastructure irrigation systems auditing – A case study for the region of Epirus. Agriculture and Agricultural Science Procedia
4, p.300-309.
22You can also read