Thailand Room Air Conditioner Market Assessment and Policy Options Analysis
←
→
Page content transcription
If your browser does not render page correctly, please read the page content below

Thailand Room Air Conditioner Market
Assessment and Policy Options Analysis
June 26, 2019
CLASP
This report has been produced by CLASP and Niwat Phansilpakom, June 2019.

CLASP makes no representations or warranties implied. The work presented in this report represents our best efforts and judgments based
on the information available at the time this report was prepared. CLASP is not responsible for the reader’s use of, or reliance upon, the
report, nor any decisions based on the report. Readers of the report are advised that they assume all liabilities incurred by them, or third
parties, as a result of their reliance on the report, or the data, information, findings and opinions contained in the report.

Contents

List of Figures 1
List of Tables 2
Executive Summary 3

Market Assessment 6
1 Background and Introduction 7
2 Methodology 8
3 Room AC Industry at a Glance 10
 3.1 Supply Chain Analysis 10
 3.2 Major brands 11
 3.3 Other Key Players 14
4 Room AC Market Characteristics 15
 4.1 Room AC Types Available 15
 4.2 Refrigerants and Inverter Technology 15
 4.3 Prices 16
 4.4 Energy Efficiency and Performance Metrics 17
 4.5 Energy Labeling Practices 18
 4.6 Consumer Practices and Preferences 20
5 Power Sector 21
 5.1. Utilities 21
 5.2. Power Sector Goals and Challenges 22

Policy Options and Impacts Assessment 24
6 Legal & Regulatory Framework Overview 25
7 Room AC Policy Framework (S&L) 27
8 Introduction & Methodology for Policy Analysis 30
 8.1. Cost-Efficiency Relations 30
 8.2. PAMS Analysis 32
9 Policy Options & Results 34
 9.1 Policy Options 34
 9.2 Outputs 36
10 Impacts Assessment Results 40
 10.1 Impacts to Consumers 40
 10.2 Impacts to Manufacturers 40
Contents

 10.3 Impacts at the National Level 41
11 Conclusions and Recommendations 43
Appendix A: EGAT No. 5 Labeling Impacts 45
 A.1: Policy Options 45
 A.2: Outputs 46
 A.3: Impacts to Consumers 47
 A.4: Impacts to Manufacturers 48
 A.5: Impacts at the National Level 49
Appendix B: Regression Analysis Results 51
1

List of Figures

Figure 1: Products on the Thai AC market and recommended policies 4
Figure 2: Thai AC export destinations 10
Figure 3: Thai market share by brand country of origin 12
Figure 4: Thai market share by brand, 2017 13
Figure 5: Country of origin for ACs available in Thailand 13
Figure 6: Room AC types (N=2146) 15
Figure 7: Cooling capacities available in (in Btu/hr) (N=2146) 15
Figure 8: AC refrigerants in Thailand (N=2146) 16
Figure 9: AC compressor types in Thailand (N=2146) 16
Figure 10: Cooling capacity vs. price by compressor type (N=1806) 16
Figure 11: Price Ranges for Fixed Speed ACs (N=1185) 17
Figure 12: Price Ranges for Inverter ACs (N=621) 17
Figure 13: Cooling Capacity vs. Efficiency (SEER) by Compressor Type (N=1804) 18
Figure 14: Market Share of Labeled ACs (N=2146) 18
Figure 15: EGAT No. 5 label for inverter units as of 2018 19
Figure 16: EGAT No. 5 label for fixed speed units as of 2018 19
Figure 17: 2019 EGAT No. 5 label with stars 19
Figure 18: Top AC selection factors for Thai consumers 20
Figure 19: Thai power sector structure as of 2017 21
Figure 20: Thai standards and labeling institutions 25
Figure 21: Voluntary and mandatory TISI certification marks 27
Figure 22: Cost-efficiency curves for MEPS analysis 31
Figure 23: Cost-efficiency curves for labeling analysis 32
Figure 24: MEPS at 20% above EGAT No. 5 label level one (N=1804) 35
Figure 25: 20% Increase to EGAT No. 5 label threshold over current inverter level 5 (N=1804) 36
Figure 26: Energy savings in 2030 under different scenarios 42
Figure 27: Avoided CO2 emissions over time and in 2030 42
Figure 28: Policy scenario for MEPS and EGAT No. 5 label 43
Figure 29: 20% increase to EGAT No. 5 label threshold over current inverter level 5 (N=1804) 46
Figure 30: Energy savings in 2030 under different labeling scenarios 49
Figure 31: Avoided CO2 emissions over time and in 2030 under different labeling scenarios 50
2

List of Tables

Table 1: Data Sources 8
Table 2: Residential electricity rates in Thailand 22
Table 3: Planned generation mix in Thailand 23
Table 4: Thai grid-average emissions factor 23
Table 5: Kigali amendment phase out schedule for Article 5 Group 1 countries 26
Table 6: Thai MEPS levels 27
Table 7: EGAT No. 5 label levels 28
Table 8: EGAT No. 5 star requirements 28
Table 9: Baseline models for PAMS analysis 31
Table 10: Scenario 1 MEPS levels 34
Table 11: Scenario 2 EGAT No. 5 level 5 35
Table 12: Best available technology for four representative cooling capacities 36
Table 13: PAMS output summary for unlabeled 12,000 Btu/hr room ACs 37
Table 14: PAMS output summary for labeled 12,000 Btu/hr room ACs 37
Table 15: PAMS output summary for unlabeled 24,000 Btu/hr room ACs 37
Table 16: PAMS output summary for labeled 24,000 Btu/hr room ACs 38
Table 17: PAMS output summary for unlabeled 36,000 Btu/hr room ACs 38
Table 18: PAMS output summary for labeled 36,000 Btu/hr room ACs 38
Table 19: PAMS output summary for unlabeled 48,000 Btu/hr room ACs 39
Table 20: PAMS output summary for labeled 48,000 Btu/hr room ACs 39
Table 21: Consumer benefits of a MEPS and EGAT No. 5 label increase 40
Table 22: Share of Thai companies' products achieving the EGAT No. 5 label 41
Table 23: Scenarios for EGAT No. 5 label 45
Table 24: PAMS output summary for labeled 12,000 Btu/hr room ACs 46
Table 25: PAMS output summary for labeled 24,000 Btu/hr room ACs 47
Table 26: PAMS output summary for labeled 36,000 Btu/hr room ACs 47
Table 27: PAMS output summary for labeled 48,000 Btu/hr room ACs 47
Table 28: Consumer benefits of an EGAT No. 5 label Increase 48
Table 29: Share of Thai companies' products achieving the EGAT No. 5 label 48
3 Executive Summary The world is poised to install 700 million new room air conditioners (ACs) by 2030 and 1.6 billion by 2050. 1 In terms of greenhouse gas (GHG) emissions, that is like adding several countries to the planet. Millions of households and commercial entities in developing and emerging economies - from Thailand to Nigeria to Brazil - have the financial resources to control their indoor climate for the first time. These same countries are getting hotter with climate change, contributing to the massive wave of both space cooling and refrigeration, and accelerating global GHG emissions. Ambitious international agreements like the Kigali Amendment to the Montreal Protocol (MP) are essential to successfully address the cooling crisis and limit warming – as are stringent and well-enforced energy performance standards for cooling products. According to a recent CLASP analysis, transitioning to energy-efficient ACs in 150 countries would cut 620 TWh of electricity and 480 MT of CO2 annually in 2030 – and save consumers $56 billion USD on their electricity bills. 2 A simultaneous hydrofluorocarbon (HFC) phasedown under the MP could avoid another 100 billion tons of CO2 equivalent.3 The Kigali Cooling Efficiency Program (K-CEP) focuses on the energy efficiency of cooling to increase and accelerate the climate and development benefits of the Kigali amendment to phase down HFCs. K- CEP is a philanthropic initiative to support the Kigali Amendment of the Montreal Protocol. CLASP has received a grant to support the implementation of K-CEP in priority countries in Southeast Asia, including Thailand. The goal of CLASP’s K-CEP program is to raise efficiency standards, improve testing efforts, provide training and other capacity building activities targeted to local needs, and implement national market transformation initiatives where appropriate. CLASP, in collaboration with Niwat Phansilpakom, conducted a comprehensive characterization of the room AC market in Thailand, and analyzed impacts from various energy efficiency policy scenarios. Niwat Phansilpakom collected product-level data for 2,146 AC models, conducted a review of government reports, and interviewed relevant stakeholders, such as manufacturers, importers, end-users and representatives from government agencies. The data gathered on the room AC market includes size, product characteristics, usage, supply chains, and the power sector. CLASP analyzed three policy scenarios and estimated potential energy savings and avoided emissions at the national level, and lifecycle cost (LCC) savings for consumers under each scenario: business-as-usual under current minimum energy performance standard (MEPS) and labels; a policy scenario where MEPS are increased by 20% over the current level one criteria of the EGAT No. 5 label4 for fixed speed units, the criteria for level five of the EGAT No. 5 label is increased by 20% over the current level five criteria for inverter units, and both policies are extended to apply to all units under 60,000 Btu/hr; and a market transition to the best available technology. Revising the MEPS and EGAT No. 5 label could reduce energy consumption from ACs by approximately 18% in 2030 and accelerate a market transformation to high-efficiency ACs. The room AC market assessment and policy analysis report provides the technical evidence to support a revision of MEPS in Thailand, and assesses national impacts, benefits to consumers, and effects to local manufacturers. Overall findings and recommendations Thailand has a highly developed AC industry with a deep local supply chain. The Thai Room AC industry is one of the largest in the world, with only China producing more ACs.5 Thailand accounts for approximately 1 Lawrence Berkeley National Laboratory (LBNL). (2015). Benefits of Leapfrogging to Superefficiency and Low Global Warming Potential Refrigerants in Room Air Condition. LBNL-1003671. Available at: https://eta.lbl.gov/publications/benefits-leapfrogging-superefficiency 2 Accelerating the Global Adoption of Climate-Friendly and Energy Efficient ACs, https://united4efficiency.org/products/room-air- conditioners/ 3 Harris, J. A Climate Victory in the Making. The Negotiations over the Montreal Protocol. Council on Foreign Relations. 4 The No.5 Label is a comparative label with ratings from 1 to 5, with No. 5 being the most efficient and No.1 being the least efficient. However, since the program is voluntary, manufacturers only opt to obtain the EGAT No. 5 label if their products achieve the fifth level. 5 Euromonitor 2018
4

9% of global room AC production and 22% of world AC exports. 67 Approximately 91% of the models sold on
the Thai market are made in Thailand, and approximately 70% of the components for these models are sourced
domestically. However, Thai AC manufacturers have found the production of inverter units to be a challenge,
as many local manufacturers lack the capacity to design products that make optimal use of the inverter
compressor. This has led to stiff competition from imported Chinese compressors and assembled units, as they
are often able to outcompete the Thai-made highly efficient products on price.
The Thai AC market has evolved rapidly over the past six years. The market share of inverter units has at
least doubled since 2013, from 16% to 32% of available models, with manufacturers stating that inverter units
now make up a majority of sales for products under 25,000 Btu/hr. At the same time, AC manufacturers have
transitioned away from R-22, a high global warming potential (GWP), ozone-depleting substance, which was
used in 79% of products on the market in 2013. R-410A, which is used in 62% of available models, and R-32,
which is used in 34% of available models, now dominate the market.
Highly efficient products are cost-effective in Thailand. Moving to the best available technology is cost-
effective for consumers for all AC unit capacities. The lifecycle energy performance benefits outweigh the
increased costs of these high-efficiency units by at least 2:1, with even higher benefit-to-cost ratios at the higher
capacities. Similarly, the payback period for purchasing the most efficient 48,000 btu/hr AC unit is just over six
months, though the payback periods for the most efficient 12,000 btu/hr AC units are closer to four years.

Figure 1: Products on the Thai AC market and recommended policies

 Inverter Fixed Speed Increased MEPS EGAT No. 5 with 20% Increase

 33.00

 28.00
 SEER (BTU/HR/W)

 23.00

 18.00

 13.00

 8.00
 6,000 12,000 18,000 24,000 30,000 36,000 42,000 48,000 54,000 60,000
 Cooling Capacity (Btu/hr)

Increasing MEPS and the EGAT No. 5 label requirements and expanding product coverage to all
products under 60,000 Btu/hr would provide benefits at the national level as well as to consumers.
Consumers of small and large capacity ACs would receive lifecycle cost savings under a scenario in which
MEPS are increased by 20% over the current EGAT No. 5 label’s level one for fixed speed units; the modelling
used for this analysis does not account for potential decreases in the upfront purchase price of ACs that occurs
over time, which would increase benefits for consumers. Similarly, consumers who prioritize purchasing
products with the EGAT No. 5 label would receive lifecycle benefits and rapid payback periods from a 20%

6
 COMTRADE 2015
7
 Euromonitor 2018
5

increase in the label requirements over the current requirements for inverter units. These lifecycle benefits from
both MEPS and labeling are particularly large for consumers of currently unregulated products with capacities
between 40,944 Btu/hr and 60,000 Btu/hr. At the national level, by revising AC MEPS and EGAT No. 5 label
requirements, Thailand can reduce annual energy consumption from ACs and make progress towards the NDC
target of 25% emissions reduction in 2030 compared to business as usual. A 25% reduction would be
equivalent to 138.8 MT CO2, of which AC MEPS and labeling revisions alone can provide 8.4 MT CO2 or 6%
of the intended reduction. Of this 8.4 MT CO2, 6 MT can come from a labeling revision and 2.4 MT can come
from a MEPS revision.
Some locally manufactured products would be eliminated by increasing MEPS and many others will no
longer be eligible for the EGAT No. 5 label. 32% of all Thai-produced AC units on the market would be
eliminated by the increase in MEPS and only 26% of the models on the market, nearly all of which are inverter
units, would still be eligible for the EGAT No. 5 label. Given the strong preference for the EGAT No. 5 label,
this means that local manufacturers would need to upgrade their production lines to produce high efficiency
inverter units in order to remain competitive. A World Bank technology transfer project is currently underway to
support this upgrade for several local manufacturers.
Recommendation 1: Increase MEPS for ACs by 20% above the current EGAT No. 5 label level one
requirement for fixed speed units. The vast majority of products on the Thai market already significantly exceed
the MEPS, which shows that the market has evolved rapidly since the last MEPS revision in 2010. The MEPS
increase would yield significant lifecycle cost savings for consumers, with the consumer benefits outweighing
costs by more than 4:1 for lower capacity units and more than 14:1 for higher capacity units. Furthermore, the
MEPS increase would reduce CO2 emissions by 4.3 MT through 2030. Although the increased MEPS would
remove 31% of products from the market, including 32% of Thai-made products, all Thai manufacturers
currently make several models that would be able to comply with the new MEPS, indicating that the necessary
technology and production lines already exist.
Recommendation 2: Increase the EGAT No. 5 label requirement by 20% over the current requirement for
inverter units and apply this requirement to both fixed speed and inverter units. Under the current system with
different labeling requirements for inverter and fixed speed units, a fixed speed unit with the EGAT No. 5 label
and one star might be less efficient than an inverter unit that cannot achieve the EGAT No. 5 label at all. This
system encourages consumers to purchase less efficient fixed speed units, as the label can cause them to
believe such units to be more efficient than inverter units. Moving to a technology-neutral approach with a single
set of requirements for all types of AC units would allow consumers to make better-informed purchasing
decisions and would cost-effectively reduce CO2 emissions by approximately 32.4 MT through 2030.
However, given the challenges that some Thai manufacturers have faced in producing high efficiency inverter
units, only 26% of models currently on the market would be able to achieve the EGAT No.5 label, including
relatively few units made by Thai companies. Therefore, it may be best to implement the EGAT No. 5 labeling
requirement revisions after the World Bank technology transfer program is complete, as it will support Thai
manufacturers in building their capacity to produce such high efficiency inverter units.
Recommendation 3: Expand MEPS and EGAT No. 5 label coverage to all products under 60,000 Btu/hr.
Expanding policy coverage to these products provides substantial consumer benefits, as the MEPS would
provide consumers with a payback period of under 4 months and the EGAT No. 5 label would provide
consumers with a payback period of under 6 months. In addition, expanding these policies to higher capacity
products would yield substantial national benefits of approximately 13.7 TWh of electricity savings and 8.6 MT
of CO2 emissions reductions through 2030.
6

Market Assessment
7 1 Background and Introduction The Kigali Cooling Efficiency Program (K-CEP) is a philanthropic initiative to support the Kigali Amendment of the Montreal Protocol. K-CEP focuses on the energy efficiency of cooling products to increase and accelerate the climate and development benefits of the Kigali Amendment to phase down hydrofluorocarbons (HFCs). CLASP received a grant to support the implementation of K-CEP in priority countries in Southeast Asia, including Thailand. CLASP has developed a strategy to deliver maximum CO 2 reductions through targeted policy and market interventions that are most likely to yield impacts and/or generate momentum for energy efficiency within the Montreal Protocol process. The goal of CLASP’s K-CEP program is to raise efficiency standards, improve product testing practices, provide training and other capacity building activities targeted to local needs, and implement national market transformation initiatives where appropriate. Over the past few decades, Thailand’s energy demand has drastically increased as a result of fast economic and population growth, and is expected to rise further in the future. Due to limited availability of domestic energy resources, Thailand’s strong dependence on costly energy imports poses a serious threat to Thailand’s energy security. As a net energy importer, over 60% of Thailand’s energy consumption comes from imports. 8 As such, energy efficiency is a significant part of the country’s energy policies and Thailand has been on the forefront of standards and labeling programs for energy-using products, starting from 1995 when the first standard for refrigerators and freezers was developed. The labeling program for appliances has been very successful over the years, and the number of products covered by the program has increased steadily. By 2014, the Thai labeling program covered more than 24 product categories, delivering significant energy savings and CO2 reductions. This market assessment was conducted to evaluate the Thai market for room ACs, the status of existing AC energy efficiency policies, and the potential for cost-effective revisions to these policies. CLASP, together with a local partner, Niwat Phansilpakom,9 conducted a comprehensive characterization of the room AC market in Thailand. This market assessment includes a detailed account of the room AC market size, product characteristics, usage, and the energy sector. Niwat Phansilpakom collected product-level data during in-person visits to retail stores, conducted a review of government reports, and reached out to stakeholders, such as manufacturers, importers, and representatives from government agencies. CLASP estimated the potential energy savings and avoided emissions at the national level, and the lifecycle cost (LCC) savings for consumers from various policy scenarios. Sections 1 through 5 of the report discuss the activities and findings related to the room AC market assessment: Section 1 provides an introduction, background and the project objectives; Section 2 describes the approach including the scope and key activities; Section 3 provides the overview of the market including the key players and a discussion on supply chain; Section 4 describes the market assessment findings; and Section 5 provides background information on the energy sector. Sections 6 through 11 discuss the analysis of various policy scenarios, including impacts: Section 6 provides an overview of energy policies and frameworks in Thailand; Section 7 provides an overview of the S&L policies and program for room ACs; Section 8 describes the methodology and analysis for different scenarios; discusses different policy options considered for the analysis; Section 9 discusses the policy scenarios and results of the impact analysis; Section 10 discusses impacts to consumers, manufacturers and the country as a whole under three scenarios; and Section 11 provides recommendations for policy revisions based on these impacts. 8 Source: Asian Development Bank. 2015. Fossil Fuel Subsidies in Thailand Trends, Impacts, and Reforms 9 Niwat Phansilpakom is an expert in the field of appliance energy efficiency in Thailand and participated in this project independent of his affiliation with any other organizations.
8 2 Methodology Understanding the characteristics and energy consumption of ACs on the market is fundamental to revising the AC efficiency program in Thailand. CLASP engaged Niwat Phansilpakom to conduct on the ground data collection activities and provide insights on the room AC market. CLASP’s analysis of the primary and secondary data collected by Niwat Phansilpakom forms the basis of the recommendations for efficiency targets identified in this report. CLASP and Niwat Phansilpakom applied the following approach to data collection and analysis. Step 1 - Primary retail data collection. Niwat Phansilpakom conducted interviews with manufacturers and in- person visits to retail stores to collect product-level data of models available for sale. The data collected for each AC model includes the manufacturer, model number, country of manufacture, energy consumption, size, price, and other relevant information. In some cases, some of the product attributes were not reported, and as a result, analysis of particular product attributes excludes models for which data on that particular attribute was not reported.10 The resulting dataset includes 2,146 unique AC models. Product types covered included floor/ceiling, cassette, standing, and single split room ACs (which are either wall-mounted or concealed). Step 2 - Secondary data collection. To supplement and verify results from the primary data collection, as well as to collect information to provide a comprehensive overview of the room AC sector, Niwat Phansilpakom collected secondary data. Niwat Phansilpakom conducted a review of government reports and interviewed relevant stakeholders, such as the Electricity Generating Authority of Thailand (EGAT), the Electrical and Electronics Institute (EEI), and the Customs Department. The information collected included market share by AC type, domestic sales volumes, testing facilities in the country, imports and exports of AC units, AC usage statistics, and the details on the power sector Niwat Phansilpakom supplemented this data with data from EGAT and product catalogs, and then compared the collected data with market data from GFK Market and Euromonitor. The purpose of this review and comparison was to control data quality and ensure that the data collected did not represent a radical departure from data collected by other entities. Table 1: Data Sources Source of secondary data Data collected Electricity Generating Authority of Thailand Room AC product data and efficiency for cooling (EGAT) capacities up to 60,000 BTU/hr Electrical and Electronics Institute (EEI) The number of manufacturers and details Domestic sales volume Testing facilities Customs Department Import/Export value 10 For all of the figures in this market assessment, the number of models for which relevant data was available is reported using the format: (N = ##).
9 Source of secondary data Data collected Manufacturers and distributors Thai Companies Bitwise Thailand Ltd. - Tasaki Supreme CNB. Ltd. - Supreme PPJ engineering Ltd. – Star Aire Central Air Ltd. Eminent Air Ltd. Foreign Companies Daikin industry Ltd. Mitsubishi Electric Consumer Products Ltd. LG Electronics Ltd. Haier Electric Thailand Ltd. Fedders Thai Ltd. Toshiba-Carrier Ltd. Marketplace Complete market site visit Modern trade store Power Buy (Central Department Store) Power Mall (The Mall Department Store) Home Pro Tesco Lotus Big C AC or Home appliance retail store Future shop/Modern Air/Wiset Air Sahapat TV/Thaimart/Ekchanachaikij Online market place Lazada/ Shopee Room AC Market Research Checks Review of room AC data GFK market, Euromonitor Step 3 – Market and impact analysis and policy recommendations The data collected by Niwat Phansilpakom was the basis for the Thailand room AC market analysis, the formulation of policy analysis, and the impacts analysis conducted using the Policy Analysis Modeling System (PAMS). Data collected for this project and used in the policy impacts analysis is complemented by data from Euromonitor and the World Bank. The methodology for PAMS analysis is outlined in detail in Section 9.
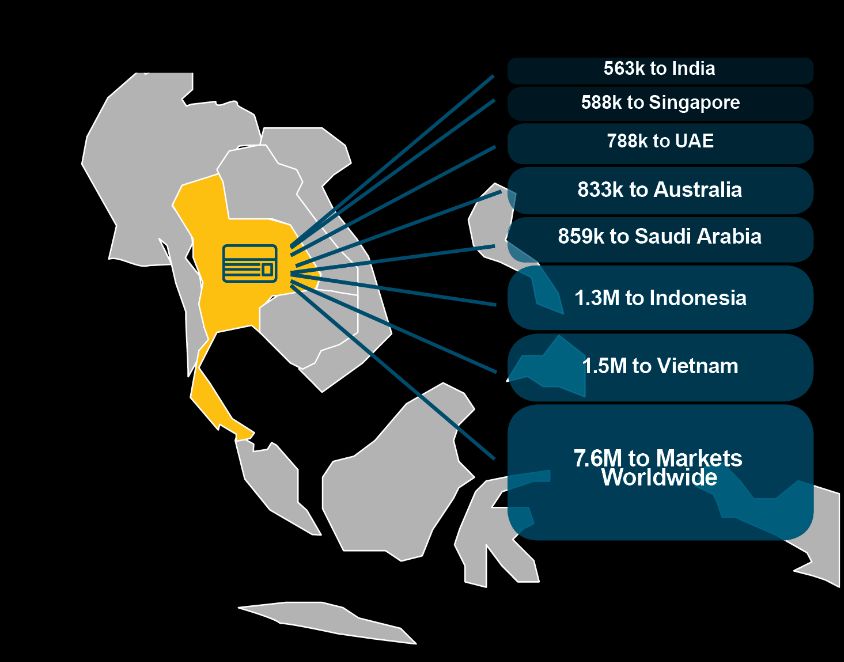
10

3 Room AC Industry at a Glance

The Thai Room AC industry is one of the largest in the world, with only China producing more air conditioners. 11
Thailand accounts for approximately 9% of global room air conditioner production and 22% of world AC
exports.12 Thailand exports AC units to many countries around the world, though its largest export markets,
Vietnam and Indonesia, are within the Association of Southeast Asian Nations (ASEAN) and apply preferential
tariffs for Thai ACs under the ASEAN Free Trade Area. Figure 2 highlights the main export destinations for
Thai-made ACs.

Figure 2: Thai AC export destinations

3.1 Supply Chain Analysis
AC Production
The Thai room AC industry has a well-developed domestic supply chain. A total of 177 companies ranging from
large multinational corporations to local small and medium enterprises are involved in the production of AC
components in Thailand. Of these companies, 53% are Thai-owned, while the remainder are either joint
ventures between multinationals and local companies or are fully foreign-owned. These companies
manufacture a full range of AC components, including compressors and their components, heat exchangers,
fans and fan motors, and AC electronics such as printed circuit boards (PCBs) and sensors.
Similarly, Thailand also has 56 companies producing finished ACs. Of these, 39 are Thai-owned, while the
remaining 17 are foreign-owned. The Thai-owned producers of finished AC units primarily operate as original
equipment manufacturers (OEMs) for major international brands, though these Thai producers may also market
products under their own brand names. Products sold under Thai brand names may be produced by the
company that owns the Thai brand or by other OEMs. Nearly all inverter AC units sold under Thai brands are
imported fully-assembled from China.
Manufacturing inverter AC units has proven a major challenge for Thai manufacturers. While the multinational
AC companies operating in Thailand have been very successful at producing inverter AC units, the local Thai
manufacturers often lack the capacity to design and produce inverter AC units that properly make use of the
inverter compressor for maximum efficiency. These Thai companies often instead opt to import their inverter

11
 Euromonitor 2018
12
 COMTRADE 2015
11

AC units from China. Addressing this issue is a key goal of an ongoing World Bank technology transfer program
for Thai manufacturers.13
Approximately 70% of the components used in AC units assembled in Thailand are sourced domestically, while
approximately 30% are imported. Compressors (both fixed speed and inverter), coils and heat exchangers,
motors, cases and fans are all primarily sourced domestically. The Thai AC component industry does not only
supply AC assemblers in Thailand, but throughout the world. In 2018, Thai exports of AC components were
valued at more than $725M.14
Electronic components such as PCBs and sensors, remote controls, as well as crucial metals such as aluminum
and copper, are primarily imported. The PCBs and sensors are particularly important for the production of
inverter air conditioners. There has also been a trend of growing component imports, particularly compressor
imports from China for products sold under Chinese, Japanese, and Korean brands. This trend has been
attributed to the Chinese compressors being able to compete on price at higher energy efficiency levels.
Additionally, this increased competition from Chinese compressors has manifested itself in increasing imports
of assembled condensing units, as these often cost less than the condensing units assembled in Thailand with
imported compressors.15 In 2015, total Thai imports of AC components were valued at just over $200M.16

AC Imports, Distribution, and Retail
Despite being the world’s second largest AC producer, manufacturing over 10 million AC units in 2017
compared to a domestic market of under 1.7 million units, Thailand continues to import finished AC units. In
2017, Thailand imported just under 700,000 finished AC units from China, Malaysia, South Korea, and
Vietnam.17 If all of these AC units are sold in Thailand, they would account for approximately 41% of the market,
though it is likely that some are re-exported to other countries, and AC imports vary significantly from year to
year.
Major retailers of AC units in Thailand include both large department stores and smaller specialty shops focused
solely on air conditioners. Retail sales for ACs differ from retail sales for other appliances, as the split ACs that
dominate the Thai market require installation by trained technicians. This need for proper installation has led
many AC manufacturers to invest in technical training for installation and maintenance staff. In addition, this
has meant that AC sales occur primarily in specialty retail shops that provide AC installation and maintenance
services as opposed to in large department stores.
Sales to real estate projects and government agencies also constitute an important part of Thai AC
manufacturers’ sales strategy. While these sales typically offer a lower margin than retail sales, they provide
an opportunity to sell a large volume of products in a single sale. These bulk purchases, particularly those
made by the government, often specify efficiency criteria such as the EGAT No. 5 label as mandatory for all
bids.18 Some manufacturers prefer not to make bids directly but rather to leave the bidding to their distributors
who may have a better understanding of government procurement. In addition, manufacturers will often keep
a substantial inventory of AC units ready to ship out in case they win a bid and need to fulfill the order
immediately.

3.2 Major brands
According to the data gathered from manufacturers and retail stores, there are 55 brands available in the Thai
market, with the top ten brands accounting for 55% of available products. The following brands are present in
the Thai market, with the top 10 brands noted in bold:

13
 Based on conversations with the World Bank Montreal Protocol Team, March 2019.
14
 COMTRADE 2018
15
 Based on Information from EEI
16
 COMTRADE 2015
17
 Thai Customs Department 2018
18
 The No.5 Label is a comparative label with ratings from 1 to 5, with No. 5 being the most efficient and No.1 being the least efficient.
However, since the program is voluntary, manufacturers only opt to obtain the EGAT No. 5 label if their products achieve the fifth level.
12 Thai brands (29%): Bacchus, Casper, Cokan, Cosmos, Daisenko, Daimond, Dipanabishi, Earth, Energyworld, Focus, Furano, Fusion, Hanjo, HICLASS, Kent, Kindai, King Cool, Mavell, Memory, Mitsui Chofu, Mitsushita, Mitsuta, Nikkokendo, Panabishi, Power Aire, PSI, Saijo Denki, Skyworth, Sova, Tienfong, Vekin, Vertex, Weather Cool, and Wilson. Japanese brands (28%): Daikin, Fujitsu, Hitachi, Mitsubishi, Mitsubishi Heavy Industry, Panasonic, Sharp, and Toshiba. American brands (26%): Carrier, Fedders, Singer, Trane, and York South Korean brands (8%): Samsung and LG Chinese brands (6%): Gree, Haier, Midea, and TCL European brands (3%): Aircool (Dutch), Electrolux (Swedish) and Beko (Turkish) Figure 3: Thai market share by brand country of origin19 3% 6% 8% 29% 26% 28% Thai Japanese American South Korean Chinese European Although foreign brands dominate the market, units produced under these brands are primarily manufactured in Thailand. In some cases, local subsidiaries of the multinational AC companies that owns the foreign brands manufacture ACs sold under these brands. In other cases, Thai OEMs manufacture units sold under these brands in accordance with their contracts with multinational AC companies. The only brands that exclusively import products are Gree (from China), TCL (from China), and Panasonic (from Malaysia). Several other brands, including Thai brands, market a mix of locally manufactured and imported products. 19 Based on CLASP Data, 2018
13

Figure 4: Thai market share by brand, 201720

 1.4%
 1.5% 0.5%
 1.9%
 0.5% 0.2%
 3.2%
 3.2%
 3.4%
 3.5% 24.6%

 4.2%

 7.9%

 19.6%
 10.2%

 14.2%

 Mistsubishi Samsung Daikin Panasonic
 LG Trane Mitsubishi Heavy Industry Carrier
 Hitachi Saijo Denki Sharp Others
 Haier Central Air Electrolux Amena

Overall, more than 90% of ACs available on the Thai market are manufactured or assembled in Thailand.
Approximately 65% of the available imported products are from China, with smaller shares from Malaysia,
Vietnam, and South Korea.

Figure 5: Country of origin for ACs available in Thailand21
 2.56% 0.65%
 0.05%
 6.01%

 90.73%

 Thailand China Malaysia Vietnam South Korea

20
 Euromonitor, 2017
21
 Based on CLASP Data, 2018
14

3.3 Other Key Players
The Thai Industrial Standards Institute (TISI), in collaboration with Department of Alternative Energy
Development and Efficiency (DEDE), runs the minimum energy performance standards (MEPS) program. The
Electricity Generating Authority of Thailand (EGAT) runs the labeling program. Section 7 provides further
details on these programs.
The Electrical and Electronics Institute (EEI) conducts AC testing for the MEPS and labeling programs. EEI
possesses three AC test chambers with which they can test nine fixed speed or six inverter AC units each day.
EEI also conducts some testing for manufacturers to support research and development as well as exports.
15

4 Room AC Market Characteristics

4.1 Room AC Types Available
Split units dominate the Thai AC market. These include both wall-mounted split units and concealed split units.
At larger capacities, standing, cassette, and floor/ceiling units are more common. Window and portable units
are not present in the market. The figures below represent models available on the market, without weighting
according to the sales per model or the frequency with which models appear on store shelves.

 Figure 6: Room AC types (N=2146) Figure 7: Cooling capacities available in (in Btu/hr) (N=2146)

 Cassette 48000
16

 Figure 8: AC refrigerants in Thailand (N=2146) Figure 9: AC compressor types in Thailand (N=2146)

 R22
 3.9% Inverter
 32%

 R32
 33.9%

 Fixed
 R410A R407C
 Speed
 61.7% 0.5%
 68%

Fixed speed ACs continue to make up the majority of the ACs available, despite significant growth in the market
share of inverter ACs in recent years. In interviews, manufacturers stated that inverter ACs make up the majority
of sales for units under 25,000 Btu/h, though they were unable to provide exact figures. Even the 32% share
of available models, without weighting according to sales or how frequently models appear on store shelves,
represents a significant increase in the share of inverter models as compared with 2013, when inverter models
comprised 16% of the market.24

4.3 Prices
The cooling capacity of ACs has a significant impact on overall price – as the size of the AC increases, so too
does the purchase price. The linear relationship between price and cooling capacity is consistent across both
fixed speed and inverter ACs.

Figure 10: Cooling capacity vs. price by compressor type (N=1806)

 Fixed Speed Inverter

 120,000

 100,000
 Price (THB)

 80,000

 60,000

 40,000

 20,000

 0
 6,000 12,000 18,000 24,000 30,000 36,000 42,000 48,000 54,000 60,000
 Cooling Capacity (Btu/hr)

24
 ASEAN-SHINE. (2015). Promotion of higher efficiency air conditioners In ASEAN: A regional policy roadmap.
https://storage.googleapis.com/clasp-siteattachments/ASEAN_SHINE_AC_Regional_Roadmap__Report_Final-new-2.pdf
17

The compressor type does have some impact on price - inverter ACs have higher prices, by 28% on average.
These higher prices for inverter units may partially explain the lower inverter market share in Thailand as
compared to some other ASEAN countries, such as Vietnam.

 Figure 11: Price Ranges for Fixed Speed ACs (N=1185) Figure 12: Price Ranges for Inverter ACs (N=621)

4.4 Energy Efficiency and Performance Metrics
Since 2015, Thailand has labeled inverter ACs using the Seasonal Energy Efficiency Ratio (SEER), which
represents the ratio of the total cooling output over the year to the total energy consumption for cooling over
the year. In 2017, Thailand began moved the labels for fixed speed ACs to SEER. However, as the EGAT No.
5 label is voluntary, only 89% of the models in the dataset reported their efficiency level in SEER, with the
remaining 11% reporting their efficiency levels using other metrics, such as energy efficiency ratio (EER) and
co-efficient of performance (COP). Where possible, CLASP converted these metrics into SEER.25

25
 Conversion into SEER is only possible for fixed speed AC units reporting in EER. The conversion is based on the formula EER =
SEER x 0.875
18

Figure 13: Cooling Capacity vs. Efficiency (SEER) by Compressor Type (N=1804)

 Inverter Fixed Speed

 33.00
 SEER (Btu/Hr/W)

 28.00

 23.00

 18.00

 13.00

 8.00
 6,000 12,000 18,000 24,000 30,000 36,000 42,000 48,000 54,000 60,000
 Cooling Capacity (Btu/hr)

While there are a range of efficiencies for both compressor types, the inverter units generally have a higher
efficiency. Inverter unit efficiencies range from SEERs of 9.97 to 27.33, with an average of 18.32, while the
efficiency range for fixed speed units is 8.69 to 18.08, with an average of 12.85.

4.5 Energy Labeling Practices
 Energy performance labeling is Figure 14: Market Share of Labeled ACs (N=2146)
 voluntary in Thailand. The voluntary
 label is implemented by the
 Electricity Generating Authority of
 Thailand (EGAT), with five levels.
 Because the label is voluntary,
 manufacturers only choose to label 28.5%
 products achieving the fifth labeling
 level (EGAT No. 5). However, the
 vast majority of products in the 71.5%
 market are labeled and achieve this
 fifth labeling level.

 EGAT #5 Label No Label

The EGAT No. 5 label has different versions for inverter and fixed speed models, with different requirements
for each AC type. The EGAT No. 5 label displays the product’s energy rating, estimated electricity bill cost (in
THB per year), electricity consumption (in kWh per year), SEER, brand, model, and capacity. In January 2019,
EGAT updated the label to include 3 stars that go beyond the level 5. The full details of the labeling
requirements and the label update are explained in Section 7. The labels as of 2018 appear in Figures Figure
15 and Figure 16. The new 2019 label with the additional stars appears in Figure 17.
19

 Figure 15: EGAT No. 5 label for inverter units as of 2018 Figure 16: EGAT No. 5 label for fixed speed units as of 2018

Figure 17: 2019 EGAT No. 5 label with stars
20

4.6 Consumer Practices and Preferences
Energy efficiency is an important factor in consumers’ choice of ACs, both for individual consumers as well as
for procurement by the government and real estate developers. After energy efficiency, the most commonly
cited factor in consumers’ purchasing decision is rapid cooling, as can be seen in Figure 18.26

Figure 18: Top AC selection factors for Thai consumers

 4%
 7%

 8%
 35%

 10%

 14%

 22%

 Energy Efficiency Rapid Cooling Reliability Healthy Function
 Comfort of Use Quiet Operation Other

Given that AC unit prices are high relative to average Thai incomes, most distributors offer payment plans. At
department stores, these payment plans often involve low- or no-interest loans. On the other hand, AC specialty
retailers often include free AC servicing for the first year in order to attract customers.
The market for bulk purchases, either by government or by real estate developers, is also significant. These
bulk purchases often specify a requirement that the ACs receive the EGAT No. 5 label in order to be considered.
Some AC models are even developed specifically for such bids and not released to the retail AC market.

26
 Based on a 2018 Marketeer study conducted for LG Electronics and shared with Niwat Phansilpakom during an interview.
21

5 Power Sector

Thailand’s power sector is organized into an enhanced single buyer model, with the Electricity Generation
Authority of Thailand (EGAT) purchasing or producing around 92% of all power generated in Thailand before
selling the power on to the distribution utilities or large consumers. The remaining 8% of power generation is
from small power producers (SPPs) and very small power producers (VSPPs), who sell their power directly to
large customers or to the distribution utilities, without going through EGAT’s transmission system. EGAT itself
accounts for 36% of installed generation capacity, while independent power producers (IPPs) account for 33%,
SPPs and VSPPs account for 22%, and imports (primarily from Laos) account for 9%. This system is diagramed
in Figure 19.

Figure 19: Thai power sector structure as of 201727

5.1. Utilities
EGAT is the largest state-owned enterprise in the Thai power sector, though its role has decreased since the
1990s. Until 1994, EGAT owned all power generation in the country and EGAT continued to own a majority of
power generation until 2006.28 The key liberalizations that led to this decrease in EGAT’s dominant role in
power generation were the introduction of IPPs in 1994 and the introduction of SPPs and VSPPs in the 2000s.
However, despite these liberalizations, EGAT maintains total control of the transmission system and system
operations, which has preserved its role as the central player in the electricity sector and the off-taker of the
vast majority of electricity generated.
The electricity distribution utilities are also state-owned. These are the Metropolitan Electricity Authority (MEA),
whose service territory consists of Bangkok and its suburbs, and the Provincial Electricity Authority (PEA), who
serves the rest of the country. In 2017, MEA had approximately 3.7 million customers who consumed 51 TWh
of electricity. By comparison, PEA had 19 million customers who consumed 130 TWh of electricity. 29 MEA and
PEA both charge the same electricity rates, which appear in Table 2.

27
 DBS Bank. “Thai Power Industry.” 2017. Available online at:
https://www.dbs.com/aics/pdfController.page?pdfpath=/content/article/pdf/AIO/042017/170426_insights_neutral_on_thai_power_sector.p
df
28
 DBS Bank. “Thai Power Industry.” 2017. Available online at:
https://www.dbs.com/aics/pdfController.page?pdfpath=/content/article/pdf/AIO/042017/170426_insights_neutral_on_thai_power_sector.p
df
29
 Data provided to Niwat Phansilpakom by MEA and PEA
22

Table 2: Residential electricity rates in Thailand
 Rate
 Residential Customer Group
 (THB)
 Electricity use not over than 150 kWh per month:

 First 15 units (Unit 1-15) 2.3488

 Next 10 units (Unit 16 -25) 2.9882

 Next 10 units (Unit 26 -35) 3.2405

 Next 65 units (Unit 36 -100) 3.6237

 Next 50 units (Unit 101 -150) 3.7171

 Next 250 units (Unit 151 - 400) 4.2218

 Over 400 units (Unit 401 -> ) 4.4217

 Monthly Service Charge 8.19

 Electricity use over 150 kWh per month:

 First 150 units (Unit 1-150) 3.2484

 Next 250 units (Unit 151- 400) 4.2218

 Over 400 units (Unit 401 ->) 4.4217

 Monthly Service Charge 38.22

EGAT, MEA, and PEA all have played roles in promoting energy efficiency through their demand side
management programs. For the appliance sector, EGAT’s role has been the most significant, as they manage
the EGAT No. 5 label program. However, MEA and PEA have both also played significant roles in energy
efficiency at times. For instance, PEA has led a streetlight replacement program over the past four years. 30 In
addition, the 2011 Energy Efficiency Development Plan includes the implementation of an energy efficiency
resource standard (EERS) that would require that these utilities invest in specified amounts of energy efficiency
measures each year; the EERS has, however, not yet been implemented. 31

5.2. Power Sector Goals and Challenges
Thailand is seeking to diversify its generation mix away from its longstanding heavy dependence on natural
gas-based generation. Specifically, the Thai Power Development Plan (PDP) targets decreasing the share of
natural gas generation from 64% in 2014 to 30%-40% in 2036 by increasing the shares of imported hydro
power, coal-fired generation, renewable generation, and, potentially, nuclear generation. The increase coal-
fired generation is intended to consist of clean coal technologies, though these may prove prohibitively
expensive as has been the case with clean coal pilot projects in North America.32

30
 LEDInside. “PEA Aims to Complete Thailand LED Streetlight Upgrade Project by 2018.” 2014. Available online at:
https://www.ledinside.com/news/2014/11/pea_aims_to_complete_thailand_led_streetlight_upgrade_project_by_2018
31
 EPPO. “Thailand 20-Year Energy Efficiency Development Plan (2011-2030).” 2011. Available online at:
http://www.eppo.go.th/images/POLICY/ENG/EEDP_Eng.pdf
32
 Kristi E. Swartz. “Southern Co.’s clean coal plant hits a dead end.” E&E News. June 22, 2017. Available online at:
https://www.eenews.net/stories/1060056418
23

Table 3: Planned generation mix in Thailand

Fuel Share in 2014 Share in 2036

Imported Hydro Power 7% 15%-20%

Clean Coal 20% 20%-25%

Renewables, including 15%-20%
 8%
Hydro

Natural Gas 64% 30%-40%

Nuclear 0% 0%-5%

Petroleum 1% 0%

One of the major challenges for the Thai electricity grid has been transmission to the South of the country. With
the imported hydro power coming across the northern border from Laos and the thermal power plants
concentrated in the Central region, most of the South’s power must be transmitted to the region through a
handful of transmission lines. This transmission bottleneck has led to serious problems, most notably the
country’s worst ever blackout in 2013.33 The PDP aims to address this problem through the construction of two
new coal-fired power plants in the South.34
Another key challenge for the Thai power sector is integrating increasing amounts of variable renewable
generation onto the grid. Because technologies such as wind and solar generation may suddenly decrease the
amount of electricity they are generating based on weather conditions, the electricity grid must have the
flexibility to quickly increase other generation or decrease demand in order to avoid disruptions. With the large
share of hydro power and natural gas-fired generation on the Thai grid, this flexibility should not be a major
challenge, as these types of generation can ramp up quickly. However, as the share of natural gas-fired
generation decreases, additional options for flexibility must be added, including demand side management in
general and demand response in particular.35
The environmental impacts of electricity generation are yet another main challenge. Although Thailand currently
has a relatively low grid-average emissions factor due to the high share of hydro power and natural gas-fired
generation, this emissions factor may increase as coal-fired generation increases. This increase in emissions
may be avoided if the clean coal technology is successfully implemented, though such technology may prove
extremely expensive, as noted above. Thailand’s current grid-average emissions factor appears in Table 4.

Table 4: Thai grid-average emissions factor36

 Emissions
 Tool Weight Unit
 Factor
 Operating Margin 0.5 0.5426 tCO2/MWh
 Build Margin 0.5 0.6367 tCO2/MWh
 Combined Margin 0.5897 tCO2/MWh

33
 Bangkok Post. “South power restored after Thailand’s worst-ever blackout.” 22 May 2013. Available online at:
https://www.bangkokpost.com/learning/learning-news/351298/south-power-restored-after-thailand-s-worst-ever-blackout
34
 Energy Planning and Policy Office. “Thailand 20-Year Energy Efficiency Development Plan (2011-2030).” 2011. Available online at:
http://www.eppo.go.th/images/POLICY/ENG/EEDP_Eng.pdf
35
 IEA. “Thailand Renewable Grid Integration Assessment.” 2018. Available online at: https://webstore.iea.org/partner-country-series-
thailand-renewable-grid-integration-assessment
36
 Based on data collected by Niwat Phansilpakom from the Thailand Energy Regulatory Commission
24

Policy Options and Impacts
Assessment
25

6 Legal & Regulatory Framework Overview

Thailand has longstanding energy efficiency policies, including standards and labels for energy consuming
products, which were initiated in the early to mid-1990’s and have been expanded and strengthened over the
years. Additionally, in 1989, Thailand ratified the Montreal Protocol and since then has been steadily working
to phase out ozone depleting substances.
The Thai Energy Conservation Promotion Act, B.E. 2535 (1992) was the cornerstone policy that established
energy efficiency as an important means to address future energy challenges. This Act was revised most
recently in 2007. The adoption of the Thai Energy Conservation Promotion Act provided the Ministry of Energy
with the power to set energy efficiency regulations as well as MEPS and labeling programs.
The Thai Energy Policy and Planning Office under the Ministry of Energy developed a 20-year Energy Efficiency
Development Plan (EEDP), approved in 2011, to provide a national policy framework and guidelines on energy
conservation in the long term. The EEDP targets a 25% reduction in energy intensity by 2030, over a 2005
baseline. Two of the key strategies identified for meeting this target are MEPS and energy performance
labeling.
The Department of Alternative Energy Development and Efficiency (DEDE) under the Ministry of Energy is
responsible for the development, implementation and enforcement of national energy efficiency policy. DEDE’s
duties include energy efficiency promotion and energy conservation regulation. DEDE is responsible for
developing MEPS and high efficiency performance standards (HEPS), which designate the top performing
products in the market. There is no HEPS for AC units.
Although DEDE develops MEPS, the Thai Industrial Standards Institute (TISI), under the Ministry of Industry,
is responsible for regulating MEPS. On the other hand, DEDE is responsible for regulating HEPS. The Electrical
and Electronics Institute (EEI), which possesses three AC test chambers, conducts AC testing for the MEPS
and labeling program.

Figure 20: Thai standards and labeling institutions

Thailand has a long history of energy labeling. Upon the adoption of the Thai Energy Conservation Promotion
Act in 1992, the first voluntary labeling program for refrigerators was launched in 1994. The Electricity
Generating Authority of Thailand (EGAT) was the key government organization responsible for regulating the
26

voluntary labeling program: the Label No. 5 program. EGAT’s Label No.5 program has expanded steadily over
the years, and now covers a wide range of household appliances and energy-using products.
EGAT is also responsible for monitoring and enforcing the voluntary labelling program. EGAT’s requirements
for the most efficient products (No. 5) are generally in line with HEPS, though there is currently no HEPS for
ACs.
Thailand ratified the Montreal Protocol on July 7, 1989. 37 The National Ozone Protection Division of the
Department of Industrial Works in the Ministry of Industry is the focal point of Montreal Protocol implementation
in Thailand and the World Bank is the Thailand implementing agency for the Multilateral Fund of the Montreal
Protocol.38 Thailand has made significant progress towards meeting its obligations under the Montreal Protocol,
having already fully phased out CFCs and having decreased HCFC consumption by approximately 65% since
2012.39
As of the publication date of this report, Thailand had yet to ratify the Kigali Amendment to the Montreal
Protocol. If ratified, Thailand will follow the phase-down schedule for countries under Article 5 Parties Group 1,
summarized in Table 5.

Table 5: Kigali amendment phase out schedule for Article 5 Group 1 countries

 Baseline Years 2020, 2021, & 2022
 Average product/consumption of HFCs in 2020, 2021, and 2022
 Baseline Calculation +
 65% of HCFC baseline production/consumption
 2024 Freeze consumption/production levels

 2029 10% reduction in consumption/production of HFCs and HCFCs

 Reduction Steps 2035 30% reduction in consumption/production of HFCs and HCFCs

 2040 50% reduction in consumption/production of HFCs and HCFCs

 2045 80% reduction in consumption/production of HFCs and HCFCs

37
 UNEP. “Montreal Protocol Ratification Status.” 2014. Available online at:
http://ozone.unep.org/new_site/en/treaty_ratification_status.php
38
 UNEP. “National Ozone Unit Contacts.” 2019. Available online at: https://www.unenvironment.org/ozonaction/national-ozone-unit-
contacts
39
 Viraj Vithoontien. “Thailand: HCFC Phase-out Management Plan Stage II.” World Bank. 2018. Available online at:
https://www.ozonediw.org/attach/159/ThailandStageIIPreparation.pdf
27

7 Room AC Policy Framework (S&L)

Current Thai Policy
Thailand has mandatory minimum energy performance standard (MEPS) for ACs and refrigerators, and
voluntary MEPS for 13 other products. The Thai Industrial Standards Institute (TISI) implements the MEPS
program in collaboration with the Department of Alternative Energy Development and Efficiency (DEDE). The
certification schemes include mandatory and voluntary certification options for different product classes. Only
products meeting the certification requirements are eligible to bear the certification marks as shown below. 40
Figure 21: Voluntary and mandatory TISI certification marks

The MEPS for ACs was last revised in 2010, and is set out in TIS 2134-2553 (2010). Thailand, as a member
of the Association of Southeast Asian Nations (ASEAN), endorsed the 2015 ASEAN-SHINE target to harmonize
MEPS for ACs below 3.52 kW (12,032 Btu/hr) cooling capacity to a cooling season performance factor (CSPF)
of 3.08 W/W (10.51 Btu/hr/W) by 2020. Meeting this target will require that Thailand revise its MEPS to a
seasonal metric, which could be SEER in order to align MEPS requirements to the metric used in the labeling
program. Thailand will also need to increase the MEPS over the current levels.

Table 6: Thai MEPS levels

 Type Capacity EER

 Window Type ≤8,000W ≥9.6 (Btu/hr/W)
 ≥2.82 (W/W)

 ≥8,000W ≤12,000W ≥8.6 (Btu/hr/W)
 ≥2.53 (W/W)

 Split Type ≤8,000W ≥9.6 (Btu/hr/W)
 ≥2.82 (W/W)

 ≥8,000W ≤12,000W ≥9.6 (Btu/hr/W)
 ≥2.82 (W/W)

In addition to the MEPS program, Thailand also has a well-recognized labeling program. EGAT is responsible
for implementing the voluntary Label No. 5 program for ACs. The No.5 Label is a comparative label with ratings
from 1 to 5, with No. 5 being the most efficient and No.1 being the least efficient. However, since the program
is voluntary, manufacturers only opt to obtain the EGAT No. 5 label if their products achieve the fifth level. This
has meant that the label had no longer been able to differentiate products, as only one labeling level is ever
used. In order to address this problem, EGAT introduced three additional stars that products can achieve
beyond the fifth level in January 2019.

40
 Asia Pacific Energy Research Center (APERC). 2017. Compendium of Energy Efficiency Policies of APEC Economies
28

The EGAT No. 5 label measures energy efficiency in SEER and has different requirements based on whether
the AC unit is an inverter unit or a fixed speed unit. These levels appear in Table 7. In addition, the new star
rating levels appear in Table 8.

Table 7: EGAT No. 5 label levels

 Level Capacity Inverter SEER (Btu/hr/W) Fixed Speed SEER (Btu/hr/W)

 Level 5 ≤8,000W ≥15.00 ≥12.85

 ≥8,000W ≤12,000W ≥14.00 ≥12.40

 Level 4 ≤8,000W 14.20 – 14.99 12.45 – 12.84

 ≥8,000W ≤12,000W 13.20 – 13.99 12.10 – 12.39

 Level 3 ≤8,000W 13.40 – 14.19 12.00 – 12.44

 ≥8,000W ≤12,000W 12.40 – 13.19 11.80 – 12.09

 Level 2 ≤8,000W 12.60 – 13.39 11.60 – 11.99

 ≥8,000W ≤12,000W 11.70 – 12.39 11.45 – 11.79

 Level 1 ≤8,000W 12.00 – 12.59 11.15 – 11.59

 ≥8,000W ≤12,000W 11.00 – 11.69 11.15 – 11.44

Table 8: EGAT No. 5 star requirements

 Stars Capacity Inverter SEER (Btu/hr/W) Fixed Speed SEER (Btu/hr/W)

 Three Stars ≤8,000W ≥22.50 ≥15.85

 ≥8,000W ≤12,000W ≥21.50 ≥15.40

 Two Stars ≤8,000W 20.00 – 22.49 14.85 – 15.84

 ≥8,000W ≤12,000W 19.00 – 21.49 14.40 – 15.39

 One Star ≤8,000W 17.50 – 19.99 13.85 – 14.84

 ≥8,000W ≤12,000W 16.50 – 18.99 13.40 – 14.39

 No Stars ≤8,000W 15.00 – 17.49 12.85 – 13.84

 ≥8,000W ≤12,000W 14.00 – 16.49 12.40 – 13.39

EGAT has a compliance framework in place for its Label No.5 program and has continuously implemented
compliance activities since 2005. A compliance unit within EGAT is responsible for the program, and routinely
carries out random sampling and verification testing. EGAT assigned the Electrical and Electronics Institute
You can also read