Retail Sustainability Assessment - Whitfords Activity Centre Prepared for: Scentre Group - City of Joondalup
←
→
Page content transcription
If your browser does not render page correctly, please read the page content below
Retail Sustainability Assessment
                       Whitfords Activity Centre

                                     October 2014

            Prepared for: Scentre Group
URBIS STAFF RESPONSIBLE FOR THIS REPORT WERE:

Director                    Jeff Armstrong
Consultant                  Nick Cadle
Job Code                    MPE1-2257

© Urbis Pty Ltd
ABN 50 105 256 228

All Rights Reserved. No material may be reproduced without prior permission.

You must read the important disclaimer appearing within the body of this report.

URBIS
Australia Asia Middle East
urbis.com.au
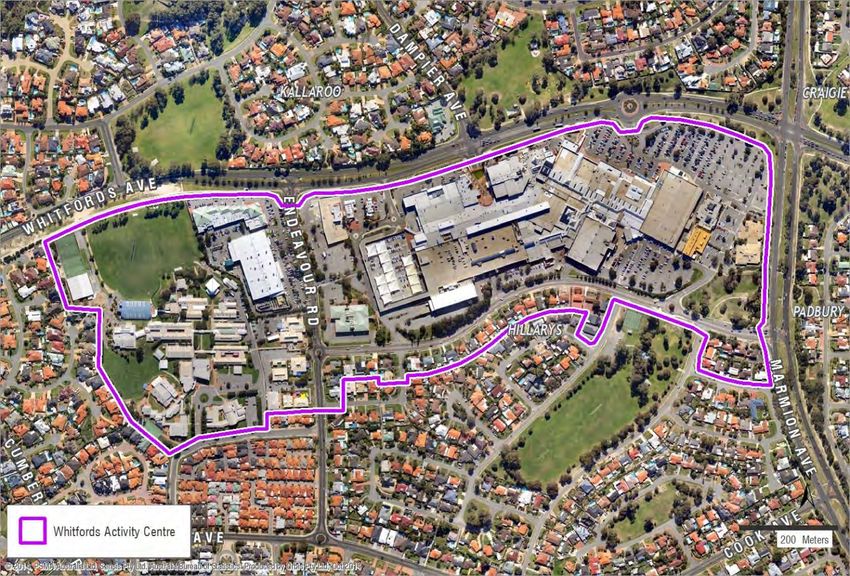
TABLE OF CONTENTS

Executive Summary ..................................................................................................................................... i

Introduction .................................................................................................................................................. 1

1          Centre Description .......................................................................................................................... 3
1.1        Regional Context ...............................................................................................................................3
1.2        Local Context .....................................................................................................................................3
1.3        Whitfords Composition and Layout....................................................................................................3
1.4        Current Development Application ......................................................................................................4

2          Market Analysis ............................................................................................................................... 7
2.1        Trade Area Definition .........................................................................................................................7
2.2        Population Trends........................................................................................................................... 10
2.2.1      North-West Sub-Region and Joondalup Municipality ..................................................................... 10
2.2.2      Main Trade Area ............................................................................................................................. 12
2.2.3      Socio-Economic Characteristics ..................................................................................................... 13
2.3        Retail Spending .............................................................................................................................. 18
2.3.1      Methodology and Definitions .......................................................................................................... 18
2.3.2      Retail Spending Per Capita Rates .................................................................................................. 18
2.3.3      Retail Spending Volume ................................................................................................................. 19

3          Retail Supply ..................................................................................................................................21
3.1        Centres Policy................................................................................................................................. 21
3.1.1      Joondalup Local Commercial Strategy ........................................................................................... 21
3.2        Centres Hierarchy ........................................................................................................................... 22
3.3        Strategic Metropolitan Centres ....................................................................................................... 26
3.4        Secondary Centres ......................................................................................................................... 26
3.5        District Centres ............................................................................................................................... 27
3.6        Local Centres.................................................................................................................................. 27
3.7        Proposed Developments ................................................................................................................ 28

4          Existing Centre Performance .......................................................................................................30
4.1        Turnover Performance .................................................................................................................... 30
4.2        Market Share Performance ............................................................................................................ 30

5          Market Demand and Turnover Potential .....................................................................................32
5.1        Future Retail Development ............................................................................................................. 32
5.2        Assumptions ................................................................................................................................... 32
5.3        Market Demand Assessment ......................................................................................................... 33
5.4        Turnover Potential Assessment...................................................................................................... 34
5.4.1      Whitfords with Current DA (54,420 sq.m) ....................................................................................... 34
5.4.2      Whitfords With an Additional 20,580 sq.m (75,000 sq.m) .............................................................. 34
5.4.3      Whitfords With an Additional 2,500 sq.m (77,500 sq.m) ................................................................ 36

6          Impact Assessment .......................................................................................................................37
6.1        Centre Specific Impacts .................................................................................................................. 37
6.2        Expansion by 20,580 sq.m to 75,000 sq.m .................................................................................... 38
6.3        Expansion by 2,500 sq.m (to 77,500 sq.m) .................................................................................... 40
6.4        Sensitivity Testing ........................................................................................................................... 40

7          Community Benefits ......................................................................................................................41

URBIS
WHITFORDS ACTIVITY CENTRE RSA OCTOBER 2014
8          Conclusions .................................................................................................................................. 42

Disclaimer .................................................................................................................................................. 43

Appendix A             PLUC 5 Categories

APPENDIX B                 Sensitivity Analysis

                                                                                                                                                      URBIS
                                                                                                                  WHITFORDS ACTIVITY CENTRE RSA OCTOBER 2014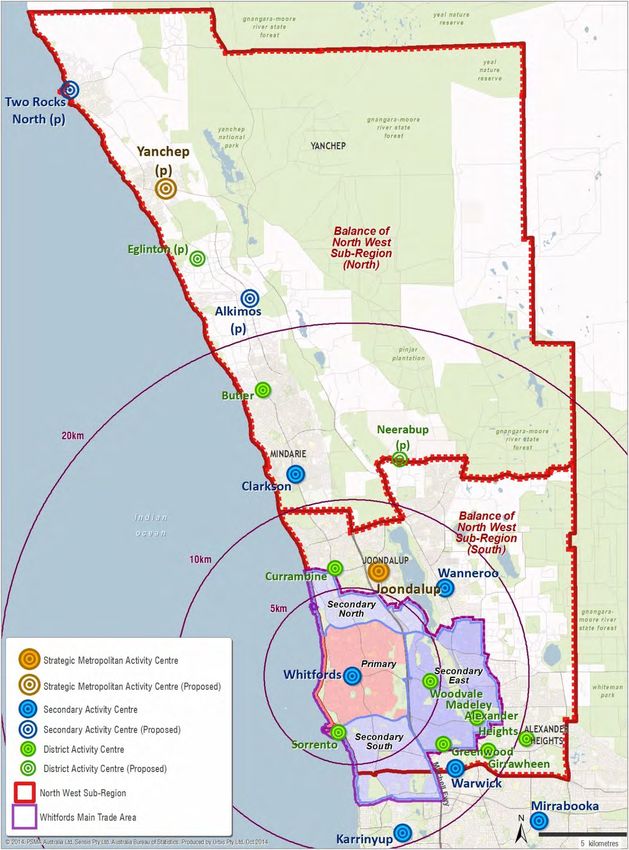
Executive Summary
The main findings and conclusions in relation to the Retail Sustainability Assessment outlined in this
report are as follows:
The Whitfords Activity Centre, by way of the Westfield Whitford City shopping centre, has been
performing an important shopping function for residents of the middle and outer northern coastal
suburbs of Perth since it opened in 1978. Whitfords Activity Centre serves as a key destination for
both convenience and discretionary shopping needs.
Whitfords Activity Centre is strategically located at the intersection of two main arterial roads, namely
Marmion Avenue and Whitfords Avenue. This high profile location enables the centre to be easily
accessible from the existing and developing northern coastal suburbs of Perth. The centre is well
served by the suburban bus network, with several routes linking with the Whitfords railway station.
The retail facilities within the Whitfords Activity Centre draw trade from throughout the North West
Sub-Region of Perth and beyond this area, notably the immediate suburbs to the south. Based on
exit survey information and key trade area definition parameters, the main trade area served by the
Whitfords Activity Centre extends between 5 and 7 km from the centre. Reflecting the centre’s usage
by consumers and the typical dispersed nature of shopping patterns, some 25% of retail turnover at
Whitfords Activity Centre is sourced from markets outside the main trade area. This is and will
continue to be an important market in support of retail facilities at the Whitfords Activity Centre.
As of June 2013, the main trade area of the Whitfords Activity Centre contained approximately
151,280 people. Over the period to 2031, the main trade area population is forecast to increase to
174,700 people. In the North West Sub-Region of Perth, resident population is forecast to increase
by approximately 158,020 between 2013 and 2031, to 504,120 by 2031.
Ongoing population growth and real growth in retail spending per capita will increase the size of the
retail market available to Whitfords Activity Centre and other centres throughout the region. Within
the main trade area, the retail spending market is forecast to increase by $152 million between 2014
and 2017 and $716 million between 2014 and 2031 (or $51 million per annum). Retail spending by
residents in the study area (main trade area and balance of the North West Sub-Region) is forecast to
increase by about $3.4 billion (or $197 million per annum) to 2031 (all expressed in constant $2014
excluding GST). This growth in retail spending will increase demand and market capacity for more
retail floorspace at Whitfords and other centres in the region.
Joondalup serves as the Strategic Metropolitan Centre for the middle to outer northern coastal region
of Perth. There is also several Secondary Centres in the general area, including Wanneroo, Clarkson
and Warwick. These centres are smaller in scale and do not have as prominent a retail role as the
Whitfords centre. Within and on the border of Whitfords’ main trade area there are five District
Centres which complement Whitfords as one of the highest order centres in the area. The
assessment allows for new retail development at several centres including Joondalup; Clarkson,
Madeley and Currambine Central.
Whitfords is a popular centre and trades well with an average retail turnover productivity around 20%
higher than comparable centre benchmarks. The centre’s market share however is low at 13.2% of
main trade area retail spending. This premium trading performance but low market share indicates
there is market capacity for a broader range of retailing at the Whitfords centre.
The market demand in support of the proposed expansion of Whitfords Activity Centre is as follows:
For at least the past 10 years, the growth in market demand has significantly outpaced the
increase in supply of PLUC 5 shop floorspace in Whitfords’ main trade area and the wider North-
West Sub-Region of Perth. The amount of PLUC 5 shop floorspace provided in these areas
does not adequately meet the needs of the market.
The outcome is currently abnormally high levels of turnover productivity at most higher order
shopping centres in the region and an undesirable level of expenditure escaping the main trade
area and wider North-West Sub-Region. The potential benefits that could be realised through
greater levels of retail activity at Whitfords and other activity centres in the region are being lost.
URBIS
WHITFORDS ACTIVITY CENTRE RSA OCTOBER 2014 EXECUTIVE SUMMARY i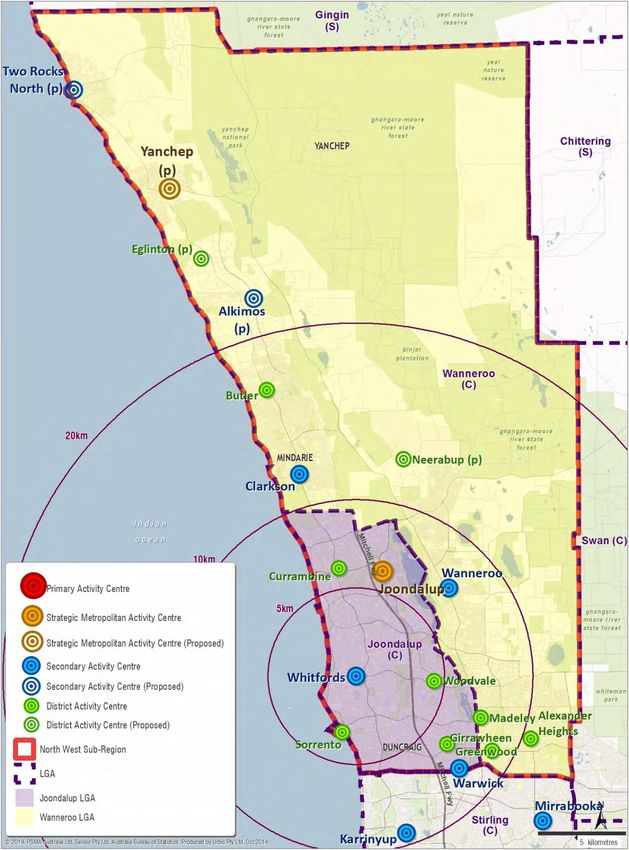
Population growth and in turn PLUC 5 shop floorspace demand growth has increased
substantially in recent years in the Whitfords main trade area. The continual regeneration and
gentrification of existing households coupled with ongoing population and retail spending growth
will drive demand for more floorspace and an improved range and quality of shops, services and
built form environments.
The scale and mix of uses proposed for Whitfords Activity Centre is supportable by market
demand. The market shares required to support the proposed expansion of PLUC 5 shop
floorspace at Whitfords is within benchmarks for a department store anchored centre. Whitfords
therefore will capture its fair share of the market for a Secondary Centre while leaving sufficient
market demand to support the intended role of the centres in the surrounding hierarchy.
Except for a small format supermarket, the Whitfords expansion is not adding anchors that would
be required to support the expansion of lower order neighbourhood and District Centres (e.g.
DDSs and supermarkets). The Whitford expansion is adding mostly F&B and discretionary retail
uses which are under-provided in the region generally and the main trade area.
There is a need for significant improvements to the Whitfords Activity Centre to bring it in-line with
the expectations of consumers today (who are seeking an enhanced experience through an
improved retail offer, amenities and environments) and deliver a more vibrant and diverse town
centre for the community. Retail expansion is a critical component in delivering the required
improvements.
Currently the Whitfords Activity Centre provides 49,847 sq.m of PLUC 5 shop floorspace. Including
the current DA, which would add 4,573 sq.m, the Whitfords Activity Centre would have approximately
54,420 sq.m of PLUC 5 shop floorspace by 2015.
The Whitfords Activity Centre Structure Plan contemplates an additional 23,080 sq.m of PLUC 5 shop
floorspace which would increase PLUC 5 shop floorspace to 77,500 sq.m. This additional floorspace
has a sunset date of 2026 with:
An additional 20,580 sq.m by 2017 as part of a major redevelopment of the Westfield property.
PLUC 5 shop floorspace would increase to 75,000 sq.m.
An additional 2,500 sq.m between 2018 and 2020, provided in the Endeavour Road and Banks
precincts. PLUC 5 shop floorspace would increase to 77,500 sq.m.
The turnover potential of the additional PLUC 5 shop floorspace is as follows:
An additional 20,580 sq.m in 2017 would have the potential to achieve retail turnover of
approximately $120 million. This turnover increase would require capturing a 3.8% market share
of Whitfords’ main trade area market. Overall, with 75,000 sq.m, Whtifords’ would have the
potential to achieve a retail turnover of $516 million in 2017, representing a 18% market share
across the main trade area. Other centres in the region would still have access to 82% of the
available main trade area market. The market share captured by Whitfords is within the range of
similar types of centres, highlighting a sustainable position for the Whitfords centre and the
broader centre hierarchy.
An additional 2,500 sq.m by 2020 would have the potential to achieve a retail turnover of $19
million and capture a 0.7% market share of main trade area retail expenditure. This is a minor
additional market share that can be easily supported by market demand.
Detailed impact modelling has been undertaken to determine the potential impact of the proposed
expansion of PLUC 5 shop floorspace at Whitfords Activity Centre. Centre specific impacts are
assessed using a ‘turnover allocation approach’ which estimates the extent to which turnover at one
centre will be diverted to another centre based on the estimated usage of centres.
This modelling indicates that the expansion of PLUC 5 shop floorspace to 77,500 sq.m at Whitfords
Activity Centre would not have an adverse impact on any one centre in the region. The impact on
any one centre is manageable and the proposed expansion of floorspace at Whitfords would not
compromise the role, function and viability of other activity centres.
ii EXECUTIVE SUMMARY
URBIS
WHITFORDS ACTIVITY CENTRE RSA OCTOBER 2014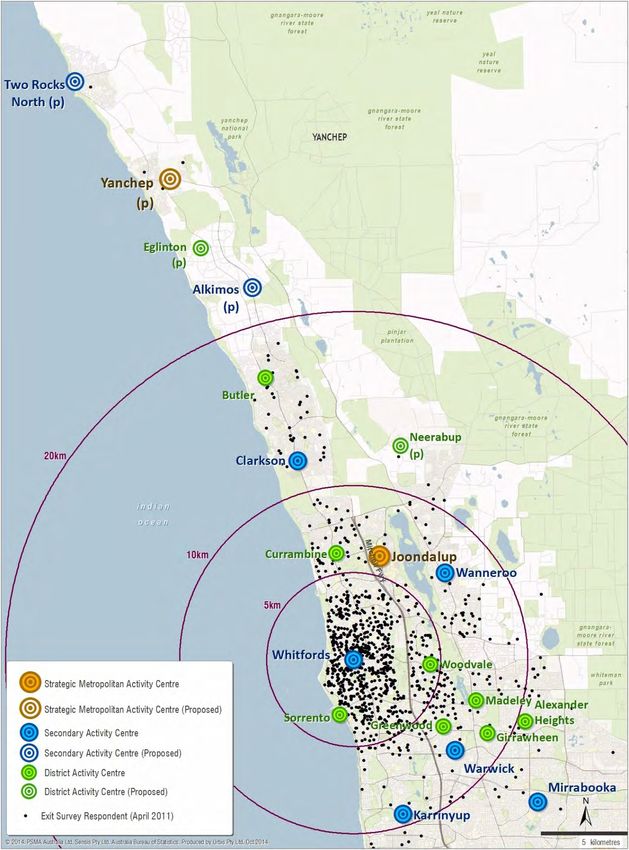
Key findings from the impact analysis are as follows:
In terms of expansion to 75,000 sq.m, the one-off impacts on individual centres ranging from
-0.3% to -4.2% are well within an acceptable range and substantially less than 10%, which is the
notional benchmark for when impacts may be an issue.
The effect of market growth and resulting turnover productivity levels are the most relevant
considerations when assessing trading impacts. The resulting trading levels for most centres are
expected to remain above industry averages and therefore remain at sustainable levels.
The addition of 2,500 sq.m and expansion to 77,500 sq.m would have negligible impacts on other
centres.
The level of impacts and share of the market captured by the proposed expansion of Whitfords
would not impede the potential for other centres to expand or new centres to be developed.
In terms of the Joondalup Activity Centre this centre’s primacy in the centre hierarchy will be
preserved given:
The Joondalup activity centre will continue to maintain its role as the highest order retail
destination in the Joondalup municipality. In 2017, the Joondalup city centre has the potential to
achieve a retail turnover volume of approximately $747 million, around $230 million higher than
Whitfords, making Joondalup easily the largest and highest turnover volume retail centre in the
hierarchy.
The proposed expansion of Whitfords would not impact the important unique non-retail functions
and uses of the Joondalup Activity Centre which support its highest order role in the area. In
addition to retail, the Joondalup Activity Centre is the focus for commercial, educational and
community activity for the region (e.g. Edith Cowan University and health campus, Joondalup
Council municipal offices, as well as other office uses and services).
Strong market growth will support the ongoing retail expansion of Joondalup Activity Centre as
well as development of non-retail uses.
Given the level of impacts would not result in adverse outcomes at any one centre, the proposed
expansion of Whitfords is also not threatening planning policy and the existing and planned centre
hierarchy. Rather the development will:
Improve a shopping centre for the benefit of the community. This is place where people meet
and socialise and is an important piece of infrastructure for the community.
Improve the public realm for the benefit of the local community.
Expand the range and improving the accessibility of retail facilities and services.
Increase the opportunity for linked trips through a more diverse range of retail and services in one
location, which can have social and environmental benefits.
Provide more jobs and employment opportunities.
Inject significant investment into the local and broader regional economies.
Strengthen the competitive landscape which can:
bring greater levels innovation, choice and better prices; and
be a catalyst for more investment as other businesses look to co-locate and access the
increased number of shoppers/visitors to the Whitfords centre and affected centres respond
to the new competition.
In conclusion, the proposed expansion of the Whitfords Activity Centre to 77,500 sq.m is supportable
by market demand and will not impact the role and viability of other centres in the hierarchy and the
community will benefit from enhanced access to retail goods and services over time. A sustainable
centre hierarchy will be preserved and enhanced through a broader range of shops and services.
URBIS
WHITFORDS ACTIVITY CENTRE RSA OCTOBER 2014 EXECUTIVE SUMMARY iii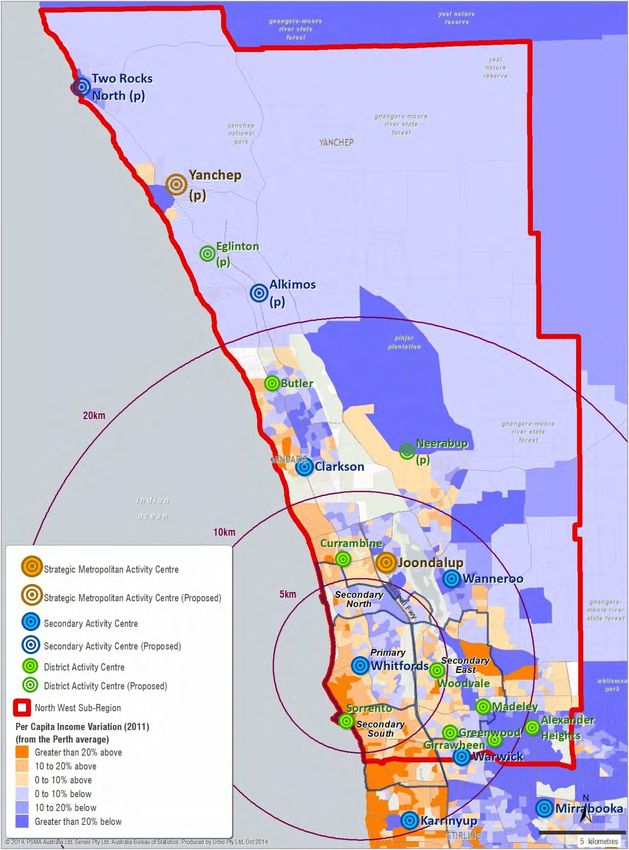

Introduction REPORT OBJECTIVE The Scentre Group has commissioned Urbis to prepare a Retail Sustainability Assessment (RSA) for inclusion in the Whitfords Activity Centre Structure PLan as required under Section 6.5 – Retail Sustainability Assessments of the State Planning Policy 4.2 (SPP 4.2) – Activity Centres for Perth and Peel. The objective of this RSA is to estimate market demand and resulting impacts of an assumed increase in PLUC 5 shop floorspace at Whitfords Activity Centre and to ultimately determine whether the sustainability of the centre hierarchy is preserved. The RSA assumes a maximum PLUC 5 shop floorspace of 77,500 sq.m is provided at Whitfords Activity Centre, with the additional floorspace being delivered by means of a single development application or multiple development applications. RETAIL SUSTAINABILITY ASSESSMENT The Activity Centres Policy states that a Retail Sustainability Assessment is required for a ‘major development and scheme amendment or structure plan that provides for a Major Development’ which is defined as “Development of any building or extension/s to an existing building where the building or extensions are used or proposed to be used for shop-retail purposes and where the shop-retail nla of the: proposed building is more than 10,000 sq.m; or extension/s is more than 5,000 sq.m.” As described in the Activity Centres Policy, “A Retail Sustainability Assessment (RSA) assesses the potential economic and related effects of a significant retail expansion on the network of activity centres in a locality. It addresses such effects from a local community access or benefit perspective, and is limited to considering potential loss of services, and any associated detriment caused by a proposed development. Competition between existing businesses of itself is not considered a relevant planning consideration.” WHITFORDS DESIGNATION The Westfield Whitford City shopping centre accounts for more than two-thirds of PLUC floorspace in the Whitfords Activity Centre which currently provides a total of 77,300 sq.m of leasable floorspace. PLUC 5 shop floorsapace amounts to 49,847 sq.m. Whitfords Activity Centre is classified as a Secondary Centre within SPP 4.2, which was gazetted on 31 August 2010. Under the SPP 4.2, Secondary Centres are intended to “perform an important role in the city’s economy, and provide essential services to their catchments”. In terms of retail, they can include department stores, discount department stores, supermarkets and specialty shops. In this regard, Secondary Centres are expected to serve a higher order retail role in the centres hierarchy and be a key destination for both discretionary and convenience based shopping needs. The main trade area population for Secondary Centres is designated as up to 150,000 persons, however the policy does recognise that this parameter is indicative and will vary between centres. FUTURE DEVELOPMENT The development proposal involves the addition of 23,080 sq.m of PLUC 5 shop floorspace within the Whitfords Activity Centre, post the current Development Application which is adding around 4,573 sq.m. Under the development proposal, Whitfords Activity Centre’s PLUC 5 shop floorspace would increase from around 54,420 sq.m to 77,500 sq.m. A minimum 2,000 sq.m of the additional 23,080 sq.m of PLUC 5 shop floorspace will be provided in the Endeavour Road precinct and/or Banks precinct within the Whitfords Activity Centre. URBIS WHITFORDS ACTIVITY CENTRE RSA OCTOBER 2014 INTRODUCTION 1
The additional PLUC 5 shop floorspace has a sunset date of 2026, however the intention is for 20,580
sq.m of the floorspace to be added to the Whitfords Activity Centre by 2017. The balance (or 2,500 sq.m)
of PLUC 5 floorspace would be added over the 2018-2020 timeframe.
The RSA outlined in this report addresses the following:
1. The market demand and turnover potential for the proposed additional PLUC 5 shop floorspace
at Whitfords Activity Centre.
2. The impact of expansion of PLUC 5 shop floorspace at Whitfords Activity Centre on the existing
and planned centres hierarchy.
3. The community benefits that would be realised from the development proposal.
REPORT OUTLINE
The report has eight sections as follows:
Section 1 discusses the local and regional context of Whitfords Activity Centre, including the Whitford
City shopping centre, the centre’s current composition and the key features of the additional PLUC 5
shop floorspace.
Section 2 presents an analysis of the trade area market, including forecast population growth, retail
spending by residents and the socio-economic profile of residents.
Section 3 outlines an overview of the retail supply in the region of relevance to the Whitfords Activity
Centre.
Section 4 outlines a summary of the current performance of Whitford City.
Section 5 outlines an assessment of the market demand and turnover potential of the proposed
PLUC 5 shop floorspace at Whitfords Activity Centre.
Section 6 outlines the potential trading impacts from additional PLUC 5 shop floorspace at Whitfords
Activity Centre.
Section 7 outlines the potential range of community benefits that could be realised from the
expansion of PLUC 5 shop floorspace at Whitfords.
Section 8 outlines the key conclusions of the Retail Sustainability Assessment.
2 INTRODUCTION
URBIS
WHITFORDS ACTIVITY CENTRE RSA OCTOBER 20141 Centre Description 1.1 REGIONAL CONTEXT As shown in Map 1.1, Whitfords Activity Centre is located within the municipality of Joondalup, approximately 20 km from the Perth Central Business District (CBD). The centre is located within the North-West Sub-Region of Perth as specified within Directions 2031. Whitfords Activity Centre is classified as a Secondary Centre and is one of five of this type of centre in the North-West Sub-Region. Joondalup and Yanchep are designated as Strategic Metropolitan Centres in this Sub-Region of Perth. Whitford City shopping centre, which comprises the majority of PLUC 5 floorspace within the activity centre, has been performing an important shopping function for residents of the middle and outer northern coastal suburbs of Perth since it opened in 1978. Over the past 35 years, the centre has undergone a number of expansions and refurbishments in response to growing and evolving market demand in the region. The last significant development of the centre was completed 10 years ago in 2004 which added new mini-majors and specialty shops. 1.2 LOCAL CONTEXT Whitfords Activity Centre is located at the south-western corner of the Marmion Road and Whitfords Avenue intersection, as shown in Map 1.2. This gives the centre a high profile and accessible location in the region. Marmion Road is a major north-south arterial linking with the West Coast Highway and Stirling Highway in the south that provides access between the developing outer northern suburbs and established coastal suburbs of Perth. Whitfords Avenue connects with the Mitchell Freeway and Wanneroo Road in the east. The grid like main road network in the region facilitates access to the centre. In terms of public transport, Whitfords Activity Centre is served by the Perth suburban public transport network, with at least three bus routes connecting Whitfords Train Station with the Whitfords Activity Centre. Also within the Whitfords Activity Centre there is a range of bulky goods retailing, including a Bunnings store, commercial offices and community facilities, including medical suites. Whitford City shopping centre also includes a six screen cinema complex adding to the centre’s role as a leisure and entertainment destination in the region. The area surrounding Whitfords is characterised by mainly detached housing in established suburbs. Some dwellings along the southern side of Banks Avenue are used for commercial purposes. The area is maturing and higher density development that is occurring throughout the region is attracting a different demographic to the mainly family based households prevalent today. 1.3 WHITFORDS COMPOSITION AND LAYOUT The Whitfords Activity Centre currently provides 77,700 sq.m of PLUC land uses, including 49,847 sq.m of PLUC 5 shop floorspace (refer to Table 1.1). All of this PLUC 5 shop floorspace is provided on the Scentre Group’s land holding, including shops within the main shopping centre and various freestanding uses in the balance of the activity centre. The main shopping centre is anchored by Big W and Target discount department stores and Woolworths and Coles supermarkets. The centre also includes a range of mini-majors, including JB Hi Fi, Best & Less, Rebel Sport, City Beach, Kathmandu, Dick Smith, Lincraft, Chemist Warehouse and Terry White Chemist. The centre serves both convenience and discretionary shopping needs. URBIS WHITFORDS ACTIVITY CENTRE RSA OCTOBER 2014 CENTRE DESCRIPTION 3
The shopping centre is a well maintained centre that is popular with the local community. However,
reflecting the lack of significant improvements for over 10 years, the presentation of the centre is
appearing dated and in need of renewal (both from ambience/environment and offer perspectives) to
provide a shopping experience that aligns with the expectations of consumers today. The centre is
essentially fully leased and trading well above industry benchmarks.

The centre is predominantly one level, with a small upper level. Undercroft and on-grade customer
carparking are also provided.

The shopping centre is oriented in an east-west direction on the site bounded by Whitfords Avenue,
Marmion Avenue, Banks Avenue and Endeavour Road. On the western side of Endeavour Road there
are several retail and commercial uses, including a Bunnings Warehouse and Chipmunks play centre, as
well as the St Mark’s Anglican Community school.

TABLE 1.1 – WHITFORDS ACTIVITY CENTRE PLUC FLOORSPACE, CURRENT

 PLUC                                                                         FLOORSPACE

 PLUC 1 to 4 –Primary, Manufacturing, Storage and Service                        150 sq.m

 PLUC 5 – Shop                                                                  49,847 sq.m

 PLUC 6 – Other Retail                                                          8,500 sq.m

 PLUC 7 - Office                                                                6,000 sq.m

 PLUC 8 to 11 – Other (Health, Entertainment, etc.)                             13,203 sq.m

 TOTAL                                                                         77,700 sq.m

Source: PLUS; Urbis

1.4         CURRENT DEVELOPMENT APPLICATION
A small development application (DA) is currently before Joondalup Council for review. This DA
proposes to add around 4,573 sq.m of PLUC 5 shop floorspace at Westfield Whitford City, bringing the
Whitfords Activity Centre’s total PLUC 5 shop floorspace to approximately 54,400 sq.m.

The 54,400 sq.m of PLUC 5 shop floorspace provides the base upon which the proposed expansion of
Whitfords Activity Centre to 77,500 sq.m is assessed in this RSA report (refer to Table 1.2). This addition
of 4,573 sq.m of PLUC 5 shop floorspace is expected to be completed by 2015.

TABLE 1.2 – WHITFORDS ACTIVITY CENTRE PLUC FLOORSPACE, EXISTING AND CURRENT DA

 PLUC                                     EXISTING            INCREMENTAL –             POST CURRENT DA
                                                               CURRENT DA

 PLUC 5 Shop                             49,847 sq.m             4,573 sq.m                  54,420 sq.m

 Other Leasable Floorspace               27,853 sq.m               0 sq.m                    27,853 sq.m

 Total Leasable Floorspace               77,700 sq.m             4,573 sq.m                  82,273 sq.m

Source: PLUS; Scentre Group; Urbis

4   CENTRE DESCRIPTION
                                                                                                                  URBIS
                                                                              WHITFORDS ACTIVITY CENTRE RSA OCTOBER 2014
REGIONAL CONTEXT MAP 1.1 URBIS WHITFORDS ACTIVITY CENTRE RSA OCTOBER 2014 CENTRE DESCRIPTION 5
LOCAL CONTEXT MAP 1.2
6 CENTRE DESCRIPTION
URBIS
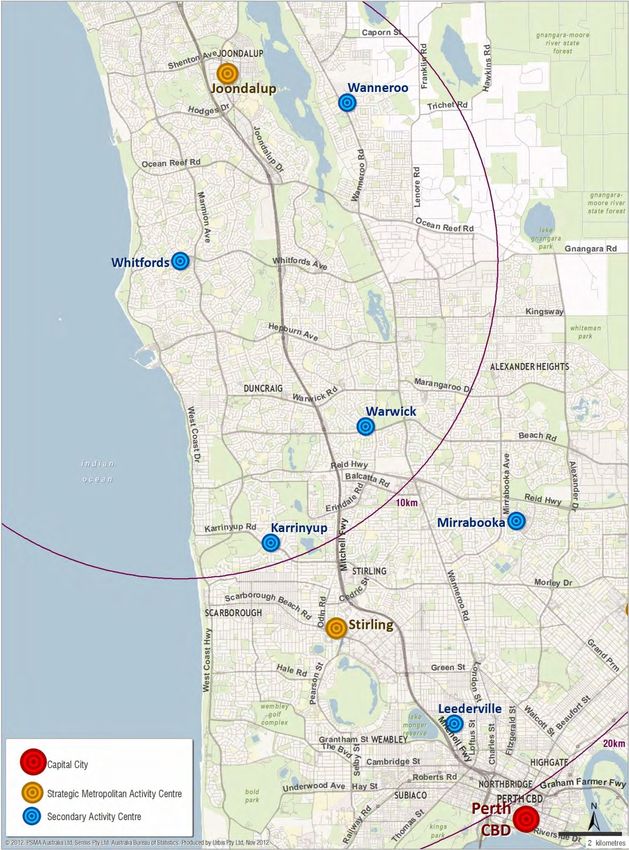
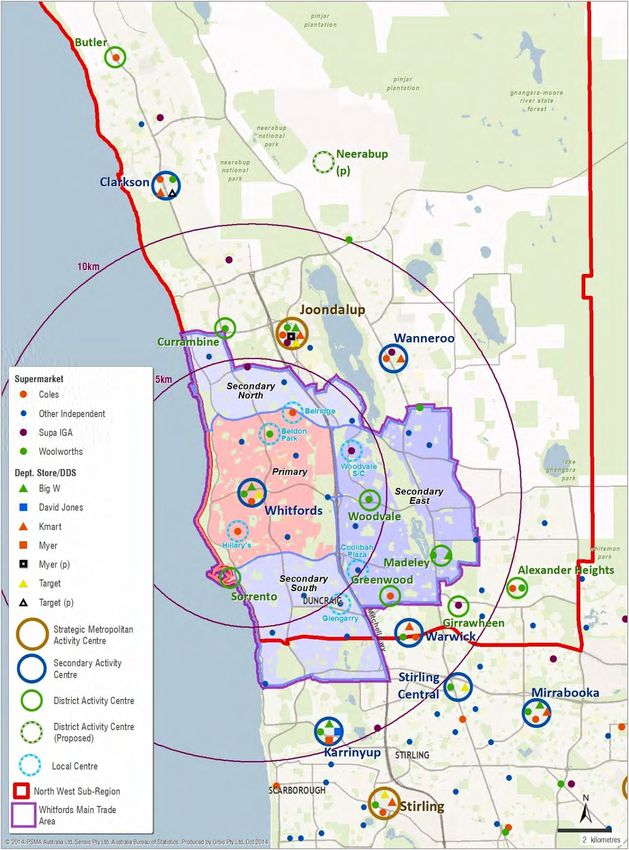
WHITFORDS ACTIVITY CENTRE RSA OCTOBER 20142 Market Analysis This section of the report outlines analysis of the market served by Whitfords Activity Centre. 2.1 TRADE AREA DEFINITION The main trade area for Whitfords Activity Centre is based on an exit survey conducted at the centre and recognition of other factors, such as the role of the Whitfords activity centre, the pattern of urban development, location of other activity centres, road and public transport infrastructure and any natural and physical barriers. This area reflects the future indicative service population (trade) area as defined in State Planning Policy 4.2, Activity Centres for Perth and Peel, which will be referred to as the main trade area in the remainder of this report. As shown in Map 2.1, the Whitford City shopping centre attracts visitation from throughout the North- Western suburbs of Perth, with the majority of customers coming from within a 7 km radius of the centre. Whitford City also draws well from the northern coastal suburbs (extending to Butler), from areas to the south and east, reflecting the direct and convenient road access to the centre. Access to the centre from these areas is facilitated by Marmion Avenue and West Coast Drive in terms of north-south main road routes and Ocean Reef Road, Whitfords Avenue and Hepburn Avenue in terms of east-west main road routes. Residents around Lake Joondalup, Wanneroo, Warwick and Karrinyup also visit the centre for shopping purposes. The dispersed nature of a centre’s draw is reflective of the unpredictable and irregular behaviour of shoppers. Shoppers use a variety of centres for a variety of reasons and will not always use the centre which is closest and most convenient to them. This behaviour is dictated by a range of reasons including people choosing to shop while at work, wanting to visit a particular retailer, the quality of the shopping environment, undertaking shopping while visiting friends or relatives or undertaking other activities, shopping while on holidays, etc. For example, the results of the survey indicate that residents in the areas surrounding Joondalup utilise the centre for their shopping needs. These residents would mainly shop at Joondalup but for the reasons described above direct a share of their spending to Whitford City. As a result of this diverse shopping behaviour, the trade area for any one centre therefore does not represent the sole market that supports the scale of a centre. Based on the exit survey information (and estimation of relative penetration rates) and key trade area definition parameters, the main trade area served by Whitfords is defined to include an area broadly extending between 5 km and 7 km from the centre. As shown in Map 2.2, the service trade area or in other words main trade area extends to Currambine in the north, Woodvale, Greenwood and Madeley in the east and Carine in the south. This area represents the core market that will be served by Whitfords following its proposed expansion. The Whitfords Activity Centre can be reached from almost all parts of the main trade area within 12 minutes, with shorter travel times from the south and north due to more direct road access. The main trade area currently contains around 150,000 people and accounts for the majority (75%) of visitors to the activity centre. The main trade area population is therefore consistent with the indicative guidelines as outlined in SPP 4.2. The main trade area defined for Whitford City shopping centre is the most important market for the centre but not the only market that supports its role, scale and performance. This is a relevant consideration in the assessment of market support for additional PLUC 5 shop floorspace at Whitfords Activity Centre. In the case of Whitfords, our analysis indicates that approximately 25% of turnover is derived from outside the main trade area. The shopping patterns of consumers also mean that trade areas for individual centres are not mutually exclusive. The overlapping of trade areas is common in all markets and is recognised in the activity centres policy. For the purposes of the analysis in this report, the area of the North-West Sub-Region not covered by the main trade area for Whitfords Activity Centre has been divided into north and south sectors. These sectors together with the main trade area form a broader study area for the market demand and impact analysis. URBIS WHITFORDS ACTIVITY CENTRE RSA OCTOBER 2014 MARKET ANALYSIS 7
WESTFIELD WHITFORD CITY CUSTOMER DISTRIBUTION                             MAP 2.1

8   MARKET ANALYSIS
                                                                                    URBIS
                                                WHITFORDS ACTIVITY CENTRE RSA OCTOBER 2014
MAIN TRADE AREA AND NORTH-WEST SUB-REGION MAP 2.2 URBIS WHITFORDS ACTIVITY CENTRE RSA OCTOBER 2014 MARKET ANALYSIS 9
2.2 POPULATION TRENDS
The analysis of the current and forecast resident population in the region of relevance to Whitfords activity
centre is based on a range of inputs including:
The results of the 2011 Census of Population and Housing released by the ABS.
The latest estimates of Estimated Resident Population (ERP) for SA1 (Statistical Area 1) and Local
Government Areas (LGA) prepared by the ABS. These are available to 2013.
Projections prepared by Forecast Id for the City of Wanneroo Council and City of Joondalup Council.
The Western Australian Tomorrow Population Report No. 7, 2006-2026, released by the WAPC. We
have used Band C (or medium) projections to inform resident population forecasts.
The masterplan proposed for the Whitfords activity centre which includes allowance for 400 dwellings
to be developed.
2.2.1 NORTH-WEST SUB-REGION AND JOONDALUP MUNICIPALITY
Table 2.1 below outlines population forecasts for the North-West Sub-Region and the Joondalup and
Wanneroo LGAs based on the WAPC forecasts, rebased to take into account the latest 2013 ERP
prepared by the ABS. Map 2.3 indicates the extent of both the Joondalup and Wanneroo Local
Government Areas.
As of June 2013, the North-West Sub-Region resident population was 346,100, including 167,620 in
Joondalup and 178,480 in Wanneroo. Of particular relevance to the Whitford Activity Centre, in recent
years, population growth has accelerated strongly in the municipality of Joondalup and at a rate of 1.7%
or 2,720 people per annum (2011-13), which compares with 0.7% or 1,120 people per annum from 2006
to 2011. There has now been three straight years of population growth in excess of 2,000 people per
annum in the Joondalup municipality. Higher density development and regeneration of older established
households would be driving this stronger rate of population growth. These trends are expected to
continue to support good levels of population growth in the Joondalup municipality.
Based on official projections, the resident population of the North-West Sub-Region is forecast to grow to
374,720 people by 2016, and approximately 504,000 people in 2031. Over the period 2013-31, the
resident population of the North West Sub-Region is therefore expected to increase by approximately
158,020 people or 47%.
As shown in Table 2.1 the majority of population growth in the North-West Sub-Region will be focussed in
the Wanneroo LGA, driven mostly by new housing development in greenfield estates. Solid levels of
population growth are expected to continue in the Joondalup municipality over the period to 2031,
estimated at approximately 1,190 people per annum. This population growth will be driven by new
residential development in greenfield areas as well as higher density infill development.
We note that the official projections were completed prior to the availability of the latest data from the
ABS, which shows a significant acceleration of population growth in the Joondalup municipality in
particular. The forecast growth indicated for the Joondalup municipality could be conservative and, on
this basis, would be understating future population levels in this area. The future size of the market
available to Whitfords Activity centre and other activity centres in the area therefore could be understated.
10 MARKET ANALYSIS
URBIS
WHITFORDS ACTIVITY CENTRE RSA OCTOBER 2014JOONDALUP AND WANNEROO MUNICIPALITIES MAP 2.3 URBIS WHITFORDS ACTIVITY CENTRE RSA OCTOBER 2014 MARKET ANALYSIS 11
North-West Sub-Region Population
RESIDENT POPULATION BY MUNICIPALITY, AS AT JUNE                                                                  TABLE 2.1

                                                Historical                                 Forecast

Residents (No.)                          2007            2013       2016          2021            2026           2031
Joondalup                              157,220          167,620    172,240       178,540         185,040        189,040
Wanneroo                               125,840          178,480    202,480       239,880         278,580        315,080
Total North-West Sub Region            283,060          346,100    374,720       418,420         463,620        504,120

Average Annual Growth (No.)                           2007-2013   2013-2016     2016-2021      2021-2026      2026-2031
Joondalup                                               1,733       1,540         1,260          1,300           800
Wanneroo                                                 8,773      8,000         7,480           7,740          7,300
Total North-West Sub Region                             10,507      9,540         8,740           9,040          8,100

Average Annual Growth (%)                             2007-2013   2013-2016     2016-2021      2021-2026      2026-2031
Joondalup                                               1.1%        0.9%          0.7%           0.7%           0.4%
Wanneroo                                                 6.0%       4.3%          3.4%            3.0%           2.5%
Total North-West Sub Region                              3.4%       2.7%          2.2%            2.1%            1.7%
Source : ABS; WAPC-Feb 2012 (LGA Only); Urbis

2.2.2       MAIN TRADE AREA
As of June 2013, the main trade area of Whitfords had a resident population of 151,280 people, including
43,630 in the primary trade area. The population in the balance of the North-West Sub-Region not
covered by Whitfords activity centre main trade area was 204,660 people. For clarity, the defined main
trade area extends beyond the boundary of the North-West Sub-Region and includes a small area to the
south of the area.

The main trade area is a reasonably well-established residential area but will continue to attract
population growth on the back of higher density development including planned residential development
within the Whitfords activity centre and the regeneration of older established households. These drivers
are highlighted in recent growth figures which showed the main trade area population increasing by 2,807
people or 1.9% per annum from 2011 to 2013. This rate of growth was about twice the rate achieved
from 2007 to 2011 (i.e. 1,366 people or 1.0% per annum). Nearly an extra 1,500 residents were added
each year to the main trade area from 2011 to 2013 relative to the previous four year period. Refer to
Table 2.2.

TABLE 2.2 – MAIN TRADE AREA ANNUAL POPULATION GROWTH

                                                   2007-11                   2011-2013                     2013-2031

 Whitfords Main Trade Area                  1,366 people (1.0%)       2,807 people (1.9%)             1,301 people (0.8%)

Source: ABS; Urbis

Resident population forecasts for the main trade area of Whitfords Activity Centre and broader study area
are presented in Table 2.3.

By 2031, the main trade area population is forecast to be 174,700, including 49,570 people in the primary
trade area. This represents population growth of around 1,300 people or 0.8% per annum between 2013
and 2031.

As noted earlier in Section 2.2.1, the official projections for the Joondalup municipality could be
understating future growth in the area. As a large proportion of Whitfords’ main trade area incorporates
the Joondalup municipality, the forecast growth in the main trade area could also be understated which
would have implications for the expected future size of the retail market available to Whitfords and other
activity centres.

12    MARKET ANALYSIS
                                                                                                                              URBIS
                                                                                          WHITFORDS ACTIVITY CENTRE RSA OCTOBER 2014
2.2.3 SOCIO-ECONOMIC CHARACTERISTICS
As indicated in Table 2.4, along with a range of other relevant socio-economic characteristics, the main
trade area is an increasingly affluent area. Average per capita incomes are above the Perth average
(+6%), with the highest incomes in the secondary south (+16%) sector.
From 2006 to 2011 average per capital incomes in primary and main trade areas have been rising slightly
faster than in Perth overall. Incomes are highest to the south of the Whitfords activity centre (refer Map
2.4) towards Karrinyup and along the coast. Incomes are also slightly above average in the secondary
east sector, around Woodvale. Extending inland to Joondalup and Wanneroo and to the north towards
Yanchep incomes are significantly lower and below the Perth average.
Other key socio-economic features of the main trade area and broader study area are as follows:
The main trade area is well represented by families, with half of the population living in households
with dependent children. Families account for 43% of the total Perth population.
A high 46% of households have a mortgage (which compares with a lower 36% for Perth as a whole).
The proportion of households that have own their home outright in the main trade area, at 36%, is
above the level in the remainder of the study area at 22%. There is a limited rental market in the
main trade area at present.
A high proportion of European born residents are evident in the main trade area, 21% compared with
the Perth average of 16% (notably from the United Kingdom in particular and South Africa).
The main trade area is an established suburban area characterised by families with good income levels
who own or are in the process of paying off a mortgage. These socio- economic characteristics indicate
the core market of the Whitfords activity centre is a socio-economically advantaged area, particularly
when compared with the remainder of the study area including Joondalup. This demographic is
consistent with the preferred market characteristics for David Jones stores and is one of the key reasons
why David Jones is looking to establish a store at Whitford.
The socio-economic profile of residents of Whitfords’ main trade area support above average retail
spending rates.
URBIS
WHITFORDS ACTIVITY CENTRE RSA OCTOBER 2014 MARKET ANALYSIS 13Resident Population
WHITFORDS MAIN TRADE AREA AND STUDY AREA, 2007-2031 TABLE 2.3
Historical Population1 Forecast Population1 Annual Population Growth (no.) Annual Population Growth (%)
2007- 2013- 2016- 2021- 2026- 2007- 2013- 2016- 2021-
2007 2013 2016 2021 2026 2031 13 16 21 26 31 13 16 21 26
Primary 40,980 43,630 44,790 46,490 48,250 49,570 442 387 340 352 264 1.0% 0.9% 0.7% 0.7%
Secondary:
North 19,450 20,190 20,660 21,160 21,680 22,040 123 157 100 104 72 0.6% 0.8% 0.5% 0.5%
East 44,660 50,630 53,530 57,770 60,290 61,740 995 967 848 504 290 2.1% 1.9% 1.5% 0.9%
South 25,850 26,990 27,640 28,520 29,560 30,120 190 217 176 208 112 0.7% 0.8% 0.6% 0.7%
Far South 9,260 9,840 10,070 10,530 10,920 11,220 97 77 92 78 60 1.0% 0.8% 0.9% 0.7%
Total Secondary 99,220 107,640 111,890 117,980 122,450 125,120 1,403 1,417 1,218 894 534 1.4% 1.3% 1.1% 0.7%
Main Trade Area 140,200 151,280 156,690 164,470 170,690 174,690 1,847 1,803 1,556 1,244 800 1.3% 1.2% 1.0% 0.7%
Balance of NW Sub-Region
North 44,630 67,420 78,220 95,050 116,720 141,180 3,798 3,600 3,366 4,334 4,892 7.1% 5.1% 4.0% 4.2%
South 107,490 137,240 149,890 169,430 187,120 199,470 4,958 4,217 3,908 3,538 2,470 4.2% 3.0% 2.5% 2.0%
Balance of NW Sub-Reg. 152,120 204,660 228,110 264,480 303,850 340,650 8,757 7,817 7,274 7,874 7,360 5.1% 3.7% 3.0% 2.8%
Total Study Area 292,320 355,940 384,790 428,950 474,540 515,340 10,603 9,617 8,832 9,118 8,160 3.3% 2.6% 2.2% 2.0%
1. As at June
Source : ABS; WAPC-Feb 2012 (LGA Only); Urbis
14 MARKET ANALYSIS
URBIS
WHITFORDS ACTIVITY CENTRE RSA OCTOBER 2014Socio-Economic Characteristics
WHITFORDS MAIN TRADE AREA AND STUDY AREA, 2011 TABLE 2.4
Total Secondary Total Main Trade Balance of North-West Region Perth Australia
Prim ary North East South Secondary Area North South Total Study Area Average Average
Household Incom e
$Nil 1% 1% 1% 1% 1% 1% 1% 1% 1% 1% 1% 2%
$1-$20,800 7% 7% 7% 6% 6% 7% 7% 8% 8% 7% 10% 10%
$20,800-$52,000 22% 21% 20% 19% 20% 21% 24% 22% 23% 22% 24% 25%
$52,000-$78,000 16% 16% 15% 13% 14% 15% 18% 16% 17% 16% 16% 17%
$78,000 - $130,000 24% 26% 27% 21% 24% 24% 26% 27% 27% 26% 22% 23%
$130,000-$208,000 25% 24% 26% 31% 27% 26% 20% 22% 21% 24% 21% 19%
$208,000 plus 6% 5% 5% 9% 6% 6% 3% 4% 4% 5% 5% 5%
Average Household Income $101,502 $100,281 $102,288 $116,137 $106,711 $105,183 $90,206 $94,456 $93,133 $98,615 $93,009 $89,341
Var'n from Perth Avg. +9% +8% +10% +25% +15% +13% -3% +2% +0% +6% 0% -4%
Average Household Size 2.6 2.7 2.7 2.7 2.7 2.7 2.8 2.9 2.9 2.8 2.5 2.6
Per Capita Incom e (Persons aged 15 - 64) (%)
$Neg/Nil 10% 10% 9% 9% 10% 10% 11% 11% 11% 10% 10% 11%
$1 - $20,800 19% 21% 20% 23% 20% 20% 21% 22% 22% 21% 21% 23%
$20,800 - $41,600 20% 20% 20% 20% 19% 19% 21% 21% 21% 20% 20% 22%
$41,600 - $78,000 29% 29% 29% 24% 28% 28% 28% 29% 29% 28% 28% 28%
$78,000 + 23% 20% 22% 25% 24% 24% 19% 17% 18% 20% 21% 17%
Avg. Per Cap. Income (aged 15-64) $54,156 $51,016 $52,462 $59,705 $54,638 $54,499 $48,282 $47,210 $47,539 $50,650 $51,288 $47,063
Var'n from Perth Avg. +6% -1% +2% +16% +7% +6% -6% -8% -7% -1% 0% -8%
Age Distribution
Aged 0-14 20% 19% 20% 18% 19% 19% 25% 23% 24% 22% 19% 19%
Aged 15-19 7% 8% 7% 7% 7% 7% 8% 8% 8% 8% 7% 6%
Aged 20-34 19% 20% 18% 15% 17% 18% 20% 21% 21% 20% 22% 22%
Aged 35-49 22% 22% 22% 21% 22% 22% 24% 23% 24% 23% 22% 22%
Aged 50-64 21% 22% 21% 24% 22% 22% 13% 16% 15% 18% 18% 18%
Aged 65-79 8% 8% 8% 11% 9% 9% 7% 7% 7% 8% 9% 9%
Aged 80+ 2% 2% 3% 3% 3% 3% 2% 2% 2% 2% 3% 4%
Average Age 36.7 36.7 37.6 39.6 38.1 37.7 32.8 33.9 33.5 35.3 36.9 37.2
Dependency Ratio1 30% 29% 31% 32% 31% 31% 34% 31% 32% 32% 32% 32%
1. Dependenc y ratio refers to the proportion of the population between 0-14 and over 65 years.
Sourc e : ABS; Urbis
URBIS
WHITFORDS ACTIVITY CENTRE RSA OCTOBER 2014 MARKET ANALYSIS 15Socio-Economic Characteristics
WHITFORDS MAIN TRADE AREA AND STUDY AREA, 2011 TABLE 2.4 (CONT’D)
Main
Total Secondary Total Trade Balance of North-West Region Study Perth Australia
Prim ary North East South Secondary Area North South Total Area Average Average
Household Com position (%)
Couples w ith no children 29% 28% 29% 30% 29% 29% 27% 25% 26% 27% 27% 26%
Family w ith children 15 19% 21% 20% 21% 21% 20% 14% 18% 17% 18% 15% 17%
Total Family (with children) 48% 51% 51% 50% 51% 50% 54% 54% 54% 52% 43% 45%
Group Household 3% 3% 2% 2% 2% 2% 2% 3% 3% 3% 4% 5%
Lone Person 18% 17% 17% 17% 17% 17% 16% 16% 16% 17% 24% 23%
Other 1% 1% 1% 1% 1% 1% 1% 1% 1% 1% 1% 1%
Housing Tenure 1
Ow ner 34% 32% 34% 44% 37% 36% 17% 24% 22% 28% 30% 31%
Purchaser 46% 49% 50% 41% 47% 46% 52% 54% 53% 50% 41% 37%
Renter 20% 19% 15% 14% 15% 17% 29% 21% 23% 20% 28% 30%
Housing Costs
Loan Mortgage Repayments (monthly $) $2,155 $2,113 $2,097 $2,353 $2,177 $2,171 $2,260 $2,181 $2,205 $2,190 $2,173 $2,142
2
% Households in Mortgage Stress 2% 2% 1% 1% 1% 1% 5% 5% 5% 3% 2% 3%
Rent Payments (w eekly $) $395 $385 $369 $411 $386 $390 $350 $342 $345 $362 $332 $345
% Households in Rental Stress 2 3.4% 3.4% 2.3% 2.1% 2.4% 2.7% 8.8% 4.4% 5.8% 4.4% 6.5% 7.2%
% Households in Housing Stress 5% 5% 3% 3% 4% 4% 14% 9% 11% 8% 9% 10%
Labour Force
Labour Force Participation 73% 73% 73% 71% 72% 73% 70% 72% 71% 72% 69% 67%
% Unemployed 4% 4% 3% 3% 3% 4% 6% 5% 5% 4% 5% 5%
% Managers and Professionals 34% 31% 32% 44% 36% 35% 25% 27% 26% 31% 34% 37%
% Other White Collar 36% 37% 38% 35% 37% 37% 36% 37% 37% 37% 34% 35%
% Blue Collar Occupations 30% 32% 30% 21% 27% 28% 39% 36% 37% 33% 32% 28%
Birthplace
Australian Born 63% 56% 66% 68% 65% 64% 56% 56% 56% 60% 63% 68%
Overseas Born 37% 44% 34% 32% 35% 36% 44% 44% 44% 40% 37% 32%
• Asia 3% 4% 4% 3% 4% 4% 3% 7% 6% 5% 9% 11%
• Europe 22% 27% 20% 18% 20% 21% 27% 22% 24% 22% 16% 11%
• Other 12% 13% 10% 8% 11% 11% 14% 14% 14% 13% 12% 11%
1. 'Other' Tenure Types have not been inc luded.
2. The Affordable Housing Taskforc e (established by the ACT Government) has defined people as having diffic ulty in ac c essing affordable housing if
they are in the lowest two quintiles (lowest 40% ) of inc ome distribution and pay 30% or more of their gross household inc ome in housing c osts. This group is referred to as being in housing stress.
Sourc e : ABS; Urbis
16 MARKET ANALYSIS
URBIS
WHITFORDS ACTIVITY CENTRE RSA OCTOBER 2014PER CAPITA INCOME, VARIATION FROM PERTH AVERAGE 2011 MAP 2.4 URBIS WHITFORDS ACTIVITY CENTRE RSA OCTOBER 2014 MARKET ANALYSIS 17
2.3           RETAIL SPENDING

2.3.1         METHODOLOGY AND DEFINITIONS
The retail spending market has been estimated using MarketInfo, a micro-simulation model developed by
MDS Market Data Systems Pty Ltd. This model is based on information from the ABS’ Household
Expenditure Survey (HES), the Census of Population and Housing (2011) and other information sources
that provide up-to-date information on changes in spending behaviour and/or income levels (e.g.
Australian National Accounts, Australian Taxation Statistics, etc.). MarketInfo is used widely by
stakeholders in the retail industry.

The model uses micro-simulation techniques to combine propensity to spend on particular commodities
with the socio-economic characteristics of individuals to derive spending per capita estimates on a small
area basis (i.e. the Statistical Area One level).

The retail expenditure estimates throughout the report exclude the component of turnover attributable to
goods and services tax, and that all values are expressed in financial years in constant 2014 dollar terms
(i.e. inflation is not included).

The retail spending estimates outlined in this report represent the categories of retail goods and services
which are served by retailers within the PLUC 5 definition. A summary of the types of retail expenditure
within the PLUC 5 retail definition is provided in Table A.1 in Appendix A. Throughout this report PLUC 5
retail expenditure is referred to as retail expenditure or spending.

2.3.2         RETAIL SPENDING PER CAPITA RATES
Chart 2.1 outlines estimates of retail spending per capita levels for residents of the main trade area and
broader study area. Consistent with above average income levels, retail spend per capita in the main
trade area for Whitfords activity centre is 6% higher than the Perth average. Spending levels are strong
in both the primary (+5%) and secondary sectors (+5%). Significantly lower spending rates in the balance
of the North-West Sub-Region result in the study area overall having a lower retail spending rate similar
to the Perth average.

Spending levels in the main trade area are high in the discretionary spending categories, as shown in
Chart 2.2. Across the main trade area, for example, spending on retail services is 12% above the Perth
average and apparel spending +9%.

Retail Spending Per Capita
WHITFORDS STUDY AREA VS PERTH AVG, 2014 ($2014, EX GST)                                                                                          CHART 2.1

                       Retail Spend Per Capita ($)                                                        Variation from Perth Average (%)
13,500        13,356         13,355          13,356                                           6%

                                                                                              4%        +5%           +5%             +5%
13,000
                                                                                              2%
                                                                            12,502
12,500
                                                                                              0%

12,000                                                       11,880                          -2%
                                                                                                                                                       -2%
                                                                                             -4%
11,500
                                                                                             -6%                                              -7%

11,000                                                                                       -8%
               PTA             STA            MTA          Bal. NW Study Area                           PTA           STA             MTA   Bal. NW    Study
                                                           Sub-Reg.                                                                         Sub-Reg.   Area

Sourc e : ABS; Australian National Ac c ounts: National Inc ome, Expenditure and Produc t Ac c ounts (5206.0) MDS MarketInfo; Urbis

18     MARKET ANALYSIS
                                                                                                                                                            URBIS
                                                                                                                        WHITFORDS ACTIVITY CENTRE RSA OCTOBER 2014
Retail Spending Per Capita by Product Group
WHITFORDS MAIN TRADE AREA, 2014
Variation from Perth CHART 2.2
+12%
Average
+9%
+7% +7%
+5%
+4% +5%
+3%
+3% +3%
Food Food Apparel Homewares Bulky Leisure/ Retail Food Non-Food Total Retail
Retail Catering Goods General Services
Sourc e : ABS; MarketInfo 2012; Urbis
2.3.3 RETAIL SPENDING VOLUME
The retail spending market generated by Whitfords’ main trade area and the broader study area residents
is presented in Table 2.5. The main trade area retail market is currently estimated at almost $2.0 billion,
including $585 million in the primary trade area (excluding GST) in the year to June 2014. Throughout
the balance of the North-West Sub-Region (Study Area) retail spending amounts to around $2.5 billion.
The main trade area of the Whitfords activity centre accounts for 45% of total retail spending in the study
area ($2.0 billion of $4.5 billion).
Forecast growth in retail spending is estimated by combining forecast population growth with anticipated
growth in real retail spending capita. The assumptions relating to these contributors to spending growth
are as follows:
Population growth, i.e. 0.8% per annum in the main trade area and 2.9% per annum across the
balance of the study area to 2031.
Real retail spending per capita growth, i.e. 1.3% per annum including varying rates for different
categories of retail. The application of 1.3% per annum could be considered conservative, given the
following:
As shown in Chart 2.3, retail spending per capita in Western Australia has grown by an average
of 1.5% per annum over the past 20 years but a higher 2.3% per annum over the past 10 years.
The 1.4% per annum growth rate used by Urbis is 6% less than the WA average over the past 20
years and 40% lower than the average for Western Australia over the more recent 10 year period.
Census results show that, over the past 20 years the average income per capita in Whitfords’
main trade area has grown at a slightly higher rate to that of Western Australia as a whole, i.e. an
average of 5.4% per annum compared with 5.3% per annum respectively.
The main trade area, and particularly the eastern half of the primary trade area, will continue to
attract higher income households (with stronger spending rates) as, for example, some
traditionally lower income suburbs continue to gentrify.
As income growth is a key determinant of spending growth the 1.3% per annum rate applied by Urbis to
the future growth of the spending market is low relative to historical trends. With a continuing expectation
for solid economic growth for Western Australia and Perth and the attraction of new higher income
households to the main trade area, the use of the 1.3% per annum rate could potentially understate the
future growth in the retail spending and in turn demand for retail floorspace in the main trade area over
the forecast period, especially in the short term (i.e. 2014-2017). This should be borne in mind when
considering the future shop floorspace needs of main trade area residents and the broader North-West
region of Perth.
URBIS
WHITFORDS ACTIVITY CENTRE RSA OCTOBER 2014 MARKET ANALYSIS 19Over the next 17 years to 2031, retail spending generated by main trade area residents is forecast to
increase by approximately $0.9 billion to $2.9 billion ($2014 excluding GST). In the balance of the North-
West Sub-Region retail spending is forecast to increase by 100% to $5 billion by 2031. By 2031, retail
spending generated by study area (main trade area and balance of North West Sub-Region) residents is
expected to be about $7.9 billion ($2014, excluding GST).
Real Retail Spending Per Capita Growth
WESTERN AUSTRALIA CHART 2.3
8%
WA
6% AUS
WA Average
4%
2%
0%
1993 1995 1997 1999 2001 2003 2005 2007 2009 2011 2013
-2%
-4%
-6%
Source : Australian National Accounts ; Urbis
Retail Spending Market, $Million (Excluding GST)
WHITFORDS MAIN TRADE AREA/NORTH WEST REGION STUDY AREA ($2014) TABLE 2.5
Primary Secondary Main Bal. NW Study
TA TA TA Reg. Area
2014 585 1,447 2,032 2,478 4,510
2017 624 1,560 2,184 2,858 5,042
2021 676 1,713 2,390 3,382 5,772
2026 749 1,900 2,649 4,144 6,794
2031 823 2,078 2,900 4,966 7,867
Average Annual Growth
2014-17 2.1% 2.5% 2.4% 4.9% 3.8%
2017-21 2.0% 2.4% 2.3% 4.3% 3.4%
2021-26 2.1% 2.1% 2.1% 4.1% 3.3%
2026-31 1.9% 1.8% 1.8% 3.7% 3.0%
Source : Urbis
20 MARKET ANALYSIS
URBIS
WHITFORDS ACTIVITY CENTRE RSA OCTOBER 2014You can also read