State of the energy market 2021 - June 2021 - Australian Energy Regulator
←
→
Page content transcription
If your browser does not render page correctly, please read the page content below
State of the
energy market
2021

June 2021
© Commonwealth of Australia 2021

This work is copyright. In addition to any use permitted under the Copyright Act 1968, all material contained
within this work is provided under a Creative Commons Attributions 3.0 Australia licence, with the
exception of:
• the Commonwealth Coat of Arms
• the ACCC and AER logos
• any illustration, diagram, photograph or graphic over which the Australian Competition and Consumer
  Commission does not hold copyright, but which may be part of or contained within this publication.
  The details of the relevant licence conditions are available on the Creative Commons website, as is the full
  legal code for the CC BY 3.0 AU licence.

ACKNOWLEDGEMENTS

This report was prepared by the Australian Energy Regulator. The AER gratefully acknowledges the
following corporations and government agencies that contributed to this report: ASX Energy, the Australian
Bureau of Statistics, the Australian Energy Market Commission, the Australian Energy Market Operator, the
Australian Financial Markets Association, the Clean Energy Regulator, CSIRO, Energy Consumers Australia,
EnergyQuest, and the Energy Security Board.

The AER also acknowledges APPEA, EnergyAustralia, Powering Australian Renewables and Snowy Hydro for
supplying photographic images.

Editor: Apricot Zebra
Cover image courtesy of Snowy Hydro

Requests and inquiries concerning reproduction and rights should be addressed to:

Director, Content & Digital Services
Australian Competition and Consumer Commission
GPO Box 3131
Canberra ACT 2601

or publishing.unit@accc.gov.au

Inquiries about this publication should be addressed to:

Australian Energy Regulator
GPO Box 520
Melbourne VIC 3001

Tel: 1300 585 165
Email: aerinquiry@aer.gov.au

Preface
The Australian Energy Regulator’s (AER) flagship State of the energy market
report has for more than a decade provided a clear, impartial, and comprehensive
view of our energy markets from all angles: wholesale electricity and gas markets,
the transmission and distribution networks, as well as energy retail markets and
consumer experiences.

A fundamental part of our role in regulating the NEM is to provide analysis and insight into the emerging and long‑term
trends within the energy market. This year’s report continues to explore the dominant themes in our energy markets
including the need for flexibility to respond to variable market conditions and the ongoing transformative expansion of
renewable energy generation.

While this transformation continued throughout 2020, consumers also went through a period of significant change as
COVID-19 shifted the way we work and live.

During 2020, the AER responded by initiating the Statement of Expectations of energy businesses, which
helped protect more than 61,000 households and small businesses from being disconnected – an 82% drop in
disconnections from the previous year – as they weathered the impacts from the pandemic.

Our enhanced reporting of key customer data during COVID-19, including disconnections and energy debt levels,
provides timely insight into how energy consumers are faring during the pandemic. We remain concerned about
the level of residential debt, as detailed in this report, with a 16% increase in the number of customers in debt at
December 2020 compared to the previous year, and their average debt up by more than $200.

We will have a strong focus in the coming year through our compliance and enforcement priorities on ensuring
retailers identify customers in financial difficulty and offer payment plans that have regard to the customer’s capacity
to pay.

Our focus on ensuring compliance with our energy laws and rules was supported by the Federal Court in 2020–21
with the highest civil penalties ordered under national energy laws to date totalling $3.8 million, while the AER issued
a further $960,000 in infringement notices.

As highlighted in this report, pressure on electricity prices began to ease during 2020 as reductions in wholesale
prices started to flow through to consumers. Prices fell significantly in all regions across 2020, declining by between
23% and 58% compared to 2019 averages.

The annual average price in all regions was below $70 per megawatt hour (MWh) for the first time since 2015. These
wholesale price reductions were evident in the AER’s Default Market Offer (DMO) final decision for 2021–22 with
standing offer prices for residential customers in south east Queensland, NSW and South Australia set to reduce
by between 2.7% and 7.4% from 1 July 2021. While short term factors have led to a rise in wholesale prices from
May 2021, the longer-term outlook is for prices to remain relatively subdued.

STATE OF THE ENERGY MARKET 2021      Overview
                                     Preface                                                                               1
Shopping around remains the best way for consumers to get the best energy deal and it’s never been easier to do
following the AER’s redevelopment of the Energy Made Easy website. Energy Made Easy is aimed at empowering
consumers to make the switch to better energy deals. It offers free, impartial price comparisons for energy
consumers, and was accessed by more than 2.5 million users over the past year, with more than 4.8 million sessions,
a 100% increase on the previous year. We know that if just 5% of people accessing the site switched they could save
a total of $7 million.
State of the energy market 2021 charts in detail the growth in renewables, with record investment in rooftop solar.
Our energy system is continually adapting as we transition away from a centralised system of large coal and gas
generation, towards a mixture of smaller scale, widely dispersed wind and solar generators, and battery storage.
To help the Australian Energy Market Operator (AEMO) more effectively manage system security in a transitioning
market, the AER proposed a rule change in 2020 that would stop weather dependent generators from turning off
without instruction from AEMO. The extensive consultation undertaken by the AER allowed the Australian Energy
Market Commission (AEMC) to fast track the rule change process with the final rule made in March 2021.
In 2020, we also published our second, biennial Wholesale electricity markets performance report. This presents a
comprehensive picture of the state of wholesale competition in the NEM. It also analyses how the performance of
the market has changed since our inaugural report released in 2018. A key finding of this report was that the NEM
continues to be concentrated in ownership, despite new entry of wind and solar, and ongoing surveillance will remain
important in a rapidly changing market.
While the transformation of the energy market might seem a high level concept, it is clearly visible at a grassroots
level by the changes we are seeing in neighbourhoods and communities.
Rooftop solar has dramatically altered the way consumers interact with the market and how the electricity grid
functions. Increasingly, we will see households installing their own batteries to store energy, and joining their
neighbours in creating virtual power plants. A small but growing fleet of electric vehicles on our roads also continues
to prompt policy debate about network charging.
As detailed in this report, in 2020 the total asset value of the electricity network businesses we regulate exceeded
$100 billion for the first time. Progressing tariff reform and supporting the integration of distributed energy resources
such as solar panels have been key features of the 8 electricity distribution network revenue determinations the AER
has completed in the past 18 months. The future of Australia’s gas distribution networks has also been central to our
2 gas distribution network decisions.
As this report details, the Integrated System Plan (ISP) is critical to achieving a least-cost development pathway to
support the energy transition. In 2020, the AER provided guidance on how large-scale projects should be assessed
through the ISP, and implemented changes to the regulatory investment test to streamline the assessment of
priority projects identified through that process. The AER has also delivered rapid approvals of a number of critical
transmission projects while maintaining rigour in our assessment and ensuring consumers pay no more than
necessary for safe and reliable power.
The AER is supporting the Energy Security Board in its important work on NEM 2025, a strategy that will help steer us
through the emerging challenges of the transition.
The AER is always listening and engaging with our diverse range of stakeholders particularly as we manage and
respond to the significant changes unfolding in the energy sector.
I commend the State of the energy market 2021 report to all stakeholders as a source of key data on the industry,
but also as a compelling reminder of our shared responsibility to help make energy consumers better off, now and in
the future.
Clare Savage
AER Chair
June 2021
STATE OF THE ENERGY MARKET 2021 Overview
Preface 2Contents
Preface 1
Market overview 5
National Electricity Market 6
Gas markets in eastern Australia 9
Electricity and gas networks 12
Retail energy markets 13
Infographic 1 – Electricity supply chain 17
Infographic 2 – Gas supply chain 18
1 The electricity market in transition 19
1.1 Drivers of change 21
1.2 Dimensions of the transition 27
1.3 Reliability issues 37
1.4 Power system security 41
1.5 Efficient integration of distributed energy resources 52
1.6 Efficient investment and access 57
1.7 Government schemes 63
2 National Electricity Market 66
2.1 Electricity consumption 69
2.2 Generation technologies in the National Electricity Market 73
2.3 Trade across National Electricity Market regions 82
2.4 Market structure 84
2.5 Generation investment and plant closures 87
2.6 Wholesale prices and activity 90
2.7 Electricity contract markets 100
2.8 Market competition 105
2.9 Power system reliability 109
2.10 Power system security 111
2.11 Generator information 116
3 Electricity networks 126
3.1 Electricity network characteristics 127
3.2 Geography 127
3.3 Network ownership 131
3.4 How network prices are set 131
3.5 Recent AER revenue decisions 136
3.6 Refining the regulatory approach 138
3.7 Power of Choice reforms 139
3.8 Revenue 143
3.9 Network charges and retail bills 147
3.10 Regulatory asset base 148
3.11 Rates of return 151
3.12 Electricity network investment 153
3.13 Electricity network operating costs 160
3.14 Electricity network productivity 162
3.15 Reliability and service performance 169
STATE OF THE ENERGY MARKET 2021 34 Gas markets in eastern Australia 178
4.1 Gas markets in eastern Australia 179
4.2 Gas demand in eastern Australia 182
4.3 Liquefied natural gas exports 183
4.4 Gas reserves in eastern Australia 184
4.5 Gas production 187
4.6 Gas storage 188
4.7 Gas transmission pipelines 189
4.8 Gas imports 191
4.9 Contract and spot gas markets 192
4.10 State of the eastern gas market 198
4.11 Gas prices 207
4.12 Market responses to supply risk 211
4.13 Government intervention in gas markets 214
4.14 Gas market reform 216
5 Regulated gas pipelines 219
5.1 Gas pipeline services 220
5.2 Gas pipeline ownership 222
5.3 How gas pipelines are regulated 223
5.4 How gas pipeline access prices are set 226
5.5 The building blocks of gas pipeline revenue 230
5.6 Gas pipeline revenues 232
5.7 Gas pipeline investment 234
5.8 Gas pipeline operating costs 235
6 Retail energy markets 241
6.1 Retail products and services 242
6.2 Energy market regulation 243
6.3 Energy retailers 244
6.4 Competition in retail energy markets 246
6.5 The evolving electricity market 259
6.6 Energy bills 262
6.7 Energy affordability 273
6.8 Customer complaints 283
6.9 Enforcement action in retail markets 285
Abbreviations 288
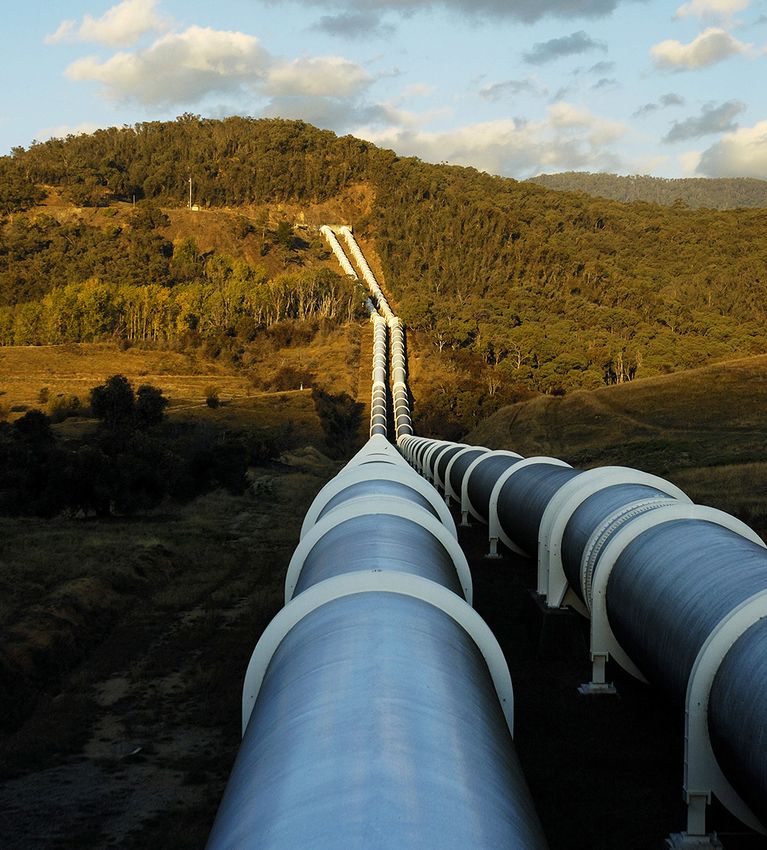
STATE OF THE ENERGY MARKET 2021 4Image source: iStock. Market overview
The National Electricity Market (NEM) is undergoing a profound transformation from a centralised system of large
fossil fuel (coal and gas) generation towards an array of smaller scale, widely dispersed wind and solar generators,
grid scale batteries and demand response. This transition has required adaptation by all participants, from generators
through to customers, and is driving a significant package of reforms to ensure the market framework remains fit
for purpose.

The gas market is also undergoing a fundamental shift. In 2020 we saw a move to more flexible use of our gas
resources to meet the competing demands of Australian industry and households, and liquefied natural gas (LNG)
export businesses. Focus has turned to identifying and encouraging development of new sources of gas as the
traditional sources decline. Gas network businesses are also balancing meeting short term operational needs against
uncertainty about the future demand for gas.

In 2020 the COVID-19 pandemic resulted in social and economic disruption across Australia, with many consumers
facing increased financial stress. But the pandemic has had only a moderate impact on broader energy market
outcomes. Energy demand reduced due to a drop in commercial load associated with businesses closing during
lockdowns, but this was partly offset by a rise in household consumption. Falling international fuel prices flowed
through to the domestic markets, contributing to lower energy prices.

National Electricity Market
In 2020 over 3,700 megawatts (MW) of large-scale solar and wind generation capacity entered the NEM, mostly
in New South Wales (NSW) and Victoria. There was also record investment in rooftop solar photovoltaic (PV), with
almost 2,500 MW of new capacity installed across the NEM in 2020.

This new entry drove record levels of wind and solar generation in 2020, accounting for over 19% of total electricity
generation. Wind output exceeded gas generation for the first time.

While wind and solar generation has increased, fossil fuel generation continues to produce over 70% of electricity in
the NEM, but this is declining. Many older generators are nearing the end of their operational life and becoming less
reliable. The growth in renewable energy is also contributing to financial stress on fossil fuel generators, risking earlier
than scheduled plant exits from the market. Broadly, the profitability of black coal and gas plant has been challenged
by low or negative prices in the middle of the day, when solar generation is at its maximum.

Over the next 2 decades, 16 gigawatts (GW) of thermal generation (61% of the current coal fleet in the NEM) is
expected to retire. Over the same period, 26–50 GW of new large scale wind and solar capacity is forecast to come
online, along with 13–24 GW of rooftop solar PV capacity. Energy storage is also expanding, through grid scale and
household batteries, and pumped hydrogeneration plant. While still in their infancy, technologies including hydrogen
and electric vehicles (EVs) will impact on both electricity supply and electricity demand.

This electricity market transition can deliver significant benefits. Renewable energy is a relatively cheap fuel source
and, if integrated efficiently into the power system, can deliver low cost sustainable energy into the future. But the
weather-dependent nature of wind and solar generation poses risks. Firming capacity (such as fast-start generation,
demand response and battery storage) is needed to maintain a reliable electricity supply, filling supply gaps when a
lack of wind or sunshine curtails renewable plant.

Coal and gas powered generators also provide the market with inertia and system strength which help stabilise the
grid. The reduction in output from these plants as renewables expand has meant the transmission network is more
susceptible to erratic frequency shifts and voltage instability. Shortages of system strength have emerged in South
Australia and Tasmania, and parts of Victoria and Queensland. South Australia also faces an inertia shortage. These
issues constrain the operation of renewable plant and make it difficult to connect new plant to the grid. The Australian
Energy Market Operator (AEMO) issued directions to market participants to maintain system security around
one‑third of the time in 2020 – a record high level. The volume of frequency control services acquired over 2020 and
into early 2021 was also a record high level. South Australia has been the main focus of these interventions.

STATE OF THE ENERGY MARKET 2021       Market overview                                                                     6
Market bodies are implementing changes to the market framework to signal the requirement for services alongside
energy to maintain system security. For example, new frequency services are being introduced to manage the
rising incidence of frequency deviations, and draft reforms announced in April 2021 make transmission networks
responsible for providing system strength services.

A further focus of recent reforms has been on planning and coordinating transmission and generation investment
to ensure assets are built in the right place at the right time. A key initiative is to cluster new wind and solar projects
in hubs, called renewable energy zones (REZs), so that efficient transmission investment can be made to transport
energy to customers. REZ locations have been identified through AEMO’s Integrated System Plan and are being
implemented by state governments.

In tandem with policy reforms underway, the Energy Security Board (ESB) is developing a long term, fit-for-purpose
market framework (NEM 2025). The ESB released a consultation paper on its preferred approaches to reform in April
2021, with recommendations to ministers expected to follow later in the year.1

Alongside coordinated reforms, governments are directly intervening in the market through various funding
mechanisms for new generation or storage capacity to meet short term reliability and security requirements and
carbon emissions targets. Recent examples include Victoria’s 300 MW ‘big battery’ (to begin operating in 2021)
and the Australian Government’s proposed 660 MW gas-powered generator in the Hunter region of NSW (to begin
operating in 2023).

The ESB noted in 2021 that a number of government interventions appear to be driven by an intolerance for sustained
high prices that may be needed to prompt a market-led investment response. It found that rewarding resources
outside the market increases the risk of distortions, especially when interventions are delivered inconsistently and
in an uncoordinated way.2 While the ESB recognised that such schemes are likely to be an enduring feature of
the energy sector, it noted that a NEM-wide approach to jurisdictional investment schemes would increase policy
certainty.3

Assessing whether the energy market is operating efficiently as it transitions to a lower emissions generation
mix is difficult. The AER published its second Wholesale electricity market report in 2020, which found that the
market transformation is having an effect on competition dynamics in the NEM. The transition has reduced market
concentration and affected how participants offer their capacity, price signals for new investment, and markets for
managing fluctuations in system frequency.

Prices fell significantly in all regions across 2020, declining by between 23% and 58% compared to 2019 averages.
The annual average price in all regions was below $70 per megawatt hour (MWh) for the first time since 2015. Prices
in Victoria ($62 per MWh) and South Australia ($51 per MWh) fell most dramatically, down from $124 per MWh and
$122 per MWh respectively in 2019). NSW ($68 per MWh) had the most modest reduction in prices and was the
NEM’s highest priced region in 2020. Tasmania ($43 per MWh) and Queensland ($44 per MWh) were the lowest
priced regions.

The declines in calendar year average prices reflect a downward trend in spot prices across the year. All regions
except NSW recorded lower average prices across all 4 quarters of 2020 than in the equivalent quarter of the
previous year.

Despite falling across the year, average prices in NSW, Victoria and South Australia were higher than in Queensland
and Tasmania – pushed up by a number of high price events. In January 2020, prices spiked above $5,000 per MWh
a total of 25 times. Five of these events were the result of high demand and network outages due to bushfires, while 4
others related to unplanned generator outages and lower than forecast wind generation. Prices also spiked 16 times
in Victoria and South Australia when extreme storms caused the collapse of transmission towers in Victoria, which led
to South Australia being electrically isolated from the rest of the NEM.

1   ESB, Post 2025 Market Design Options – a paper for consultation, April 2021.
2   ESB, Post-2025 Market Design Directions Paper, January 2021, pp 16, 21, 24.
3   ESB, Post 2025 Market Design Options – a paper for consultation, April 2021, pp 25–26.

STATE OF THE ENERGY MARKET 2021                 Market overview                                                               7
Figure 1                           Wholesale electricity prices
                      140

                      120

                      100
$ per megawatt hour

                      80

                      60

                      40

                      20

                       0

                                                                                                      2011
                            2001

                                     2002

                                            2003

                                                   2004

                                                            2005

                                                                   2006

                                                                          2007

                                                                                 2008

                                                                                        2009

                                                                                               2010

                                                                                                             2012

                                                                                                                     2013

                                                                                                                            2014

                                                                                                                                      2015

                                                                                                                                             2016

                                                                                                                                                      2017

                                                                                                                                                               2018

                                                                                                                                                                      2019

                                                                                                                                                                             2020
                                                          Queensland             NSW            Victoria            South Australia                 Tasmania

Note:                       Volume weighted annual averages.
Source:                     AER; AEMO (data).

Outcomes in 2021 have been more volatile. Prices remained low in early 2021, when first quarter prices fell to their
lowest average since 2011 in Tasmania, 2012 in Queensland and Victoria, and 2015 in NSW and South Australia.
Notably, first quarter prices were below $60 per MWh in all regions for the first time since 2012, with prices ranging
between $27 per MWh (Victoria) and $53 per MWh (South Australia). Low grid demand contributed to low prices,
with the NEM experiencing unusually mild summer conditions and high levels of rooftop solar PV generation.
Mild conditions also meant there were few reliability concerns over the 2020–21 summer. AEMO activated the
Reliability and Emergency Reserve Trader once, in NSW on 17 December 2020 in response to a forecast lack of
reserve capacity.

A tighter supply–demand balance from May 2021 drove a change in market outcomes. A fire at Queensland’s Callide
C power station in May 2021 and a number of plants being offline for maintenance significantly reduced availability
of coal fired generation. This coincided with relatively low output from weather-dependent renewables and rising
demand associated with winter heating requirements (particularly in NSW). Prices in May 2021 averaged over
$130 per MWh in Queensland and NSW, and around $85 per MWh in Victoria and South Australia.

Future price expectations have generally tracked spot market outcomes. Base futures prices for 2021 Australian
Securities Exchange (ASX) contracts fell by between 40% and 60% by early 2021 from highs observed in 2018 and
2019. Prices have since risen, particularly in Queensland and NSW. The outlook for 2022 and 2023 is for prices to
remain lower than in recent years. Base futures for 2022 and 2023 fell to less than $40 per MWh in March 2021 for
all regions except NSW ($49 per MWh) but by June 2021 were up to $10 higher in each region. These contract prices
indicate that participants are not currently anticipating any significant market impact from the impending closure of
Liddell power station in NSW.

A key challenge for AEMO over 2020 was managing minimum demand. Historically, electricity demand reaches
its lowest point in the middle of the night, when most people are sleeping. But rooftop solar PV output is lowering
daytime demand, to the extent that minimum grid demand increasingly occurs in the middle of the day. South
Australia, Victoria and Queensland all recorded their minimum demand in 2020 around the middle of the day.

Minimum demand fell in every NEM region in 2020. The greatest falls were in South Australia and Victoria, where new
minimum demand records were set. South Australia beat its previous minimum demand record (set in 2019) on 13
separate days in 2020.

STATE OF THE ENERGY MARKET 2021                                    Market overview                                                                                                  8
Figure 2 Daily minimum demand in South Australia, 2020
2,000
1,750
1,500
1,250
Megawatts
1,000
750
500
250
0
Jan Feb Mar Apr May Jun Jul Aug Sep Oct Nov Dec
2016 minimum demand 2019 minimum demand 2020 daily minimum demand
Note: 2016 and 2019 minimum demand levels shown were record minimum demand at the time.
Source: AER analysis of AEMO data.
With more low priced renewable generation operating at times of low demand, the incidence of negative prices
has increased. In 2020 there was a record number of negative prices NEM-wide, with 3,662 instances of negative
spot prices across the 5 regions. Over 40% of these occurred in the fourth quarter, where prices reached a record
low daily average in Victoria, South Australia and Tasmania. Nearly half of all instances of negative prices in 2020
occurred in South Australia.
To maintain the security of the power system, AEMO can instruct network operators in South Australia to back off
rooftop solar generation, forcing them to draw power from the grid. These powers, which were used for the first time
in March 2021, are being considered for other NEM regions due to the continued rapid uptake of rooftop solar PV.
Gas markets in eastern Australia
The development of Queensland’s LNG export industry placed significant pressure on the eastern gas market. That
pressure, combined with other factors such as state-based moratoriums on gas development, tightened the supply–
demand balance. This tightening led to increases in wholesale gas prices from 2017 as international gas prices began
to bear on domestic gas prices. However, these price pressures eased over 2020 as Asian LNG spot prices reduced
significantly due to intense price competition, reductions in oil price, and COVID-19 related demand reductions.
Ultimately LNG netback prices bottomed out at a record low in July 2020. Late in 2020, Asian LNG demand
rebounded during the northern hemisphere winter. From December 2020 to January 2021 a cold snap created
unexpectedly strong LNG demand in Asia, causing a sharp spike in international prices. This also coincided with coal
supply issues in China, LNG plant outages at key facilities around the world and congestion at the Panama Canal,
which caused delays in cargoes reaching Asia from further afield. By mid-February 2021 Asian LNG prices returned
to levels similar to before the spike.
Domestically conditions eased significantly in line with international conditions. Although demand for LNG exports
reduced in mid-2020, production in Queensland did not. This increase in gas availability coincided with a reduction in
gas used for electricity generation to lower domestic prices. Average annual prices fell by more than 40% over 2020
and in the second and third quarters were below $5 per gigajoule (GJ) in all markets except Adelaide.
STATE OF THE ENERGY MARKET 2021 Market overview 9Figure 3 Eastern Australia gas market prices
12
10
Spot price ($ per gigajoule)
8
6
4
2
0
Q1 Q2 Q3 Q4 Q1 Q2 Q3 Q4 Q1 Q2 Q3 Q4 Q1 Q2 Q3 Q4 Q1 Q2 Q3 Q4 Q1 Q2 Q3 Q4 Q1
2015 2016 2017 2018 2019 2020 2021
Brisbane Sydney Victoria Adelaide Wallumbilla
Note: The Wallumbilla price is the volume weighted average price for day-ahead, on-screen trades at the Wallumbilla gas supply hub. Brisbane,
Sydney and Adelaide prices are ex-ante. The Victorian price is the 6 am schedule price.
Source: AER analysis of gas supply hub, short-term trading market and Victorian declared wholesale gas market data.
With reductions in LNG export flows, producers also seized the opportunity to conduct maintenance and divert
flows into storage facilities. While short term conditions improved, Australian exporters reported that the uncertainty
stemming from COVID-19 and other international conditions limited their ability to strike new gas supply agreements
and finalise investment decisions.
The rebound in demand for LNG late in the year through the Asian winter drove record eastern Australian LNG
exports in 2020 (around 1,350 petajoules (PJ)) and record production in Queensland (over 1,500 PJ). But domestic
spot prices did not rise to the same degree, as lower summer demand on the east coast mitigated linkages to global
spot prices. In particular, gas used for electricity generation continued to fall across the year, particularly in the
southern regions, and by early 2021 had fallen to the lowest quarterly level since 2005. As a result of lower demand,
the southern markets were less reliant on northern production, and excess gas flowed from south to north.
These flows were supported by capacity purchased by participants through the day-ahead auction, which provided
access to over 73 PJ of contracted, but unnominated, pipeline capacity in the 2 years since it launched in March
2019. More generally, the day-ahead auction has improved market dynamics by enhancing competition, especially
in southern markets. Access to low or zero cost pipeline capacity is allowing shippers to move gas from relatively
low priced markets into other, more expensive markets, easing price pressures. The AER estimated the auctions
reduced monthly average spot gas prices by as much as $0.63 per GJ in the Sydney market over the 2 years to
December 2020.
While improvements have been made to market transparency and pipeline access, concerns remain that the
regulatory framework favours pipeline operators, with shippers facing information asymmetries and being exposed
to potential exercises of market power. In May 2021 Energy Ministers set out their preferred approach to improve the
regulatory framework.4
4 Energy Ministers, Options to improve gas pipeline regulation, Regulation Impact Statement for Decision, May 2021.
STATE OF THE ENERGY MARKET 2021 Market overview 10Figure 4 Day-ahead auction quantities won, by facility
18 1,800
16 1,600
14 1,400
Number of auction legs won
12 1,200
Quantity won (terajoules)
10 1,000
8 800
6 600
4 400
2 200
0 0
Q2 Q3 Q4 Q1 Q2 Q3 Q4 Q1
2019 2020 2021
MSP SWQP RBP EGP ICF WCFA/B BWP CGP MCF MAPS QGP Auction legs won (RHS)
BWP: Berwyndale to Wallumbilla Pipeline; CGP: Carpentaria Gas Pipeline; EGP: Eastern Gas Pipeline; ICF: Iona Compression Facility; MAPS: Moomba
to Adelaide Pipeline; MCF: Moomba Compression Facility; MSP: Moomba to Sydney Pipeline; QGP: Queensland Gas Pipeline; RBP: Roma to Brisbane
Pipeline; SWQP: South West Queensland Pipeline; WCFA/B: Wallumbilla compression facilities.
Source: AER analysis of day-ahead auction data.
Despite changing market conditions, forecast concerns around eastern Australia’s supply–demand balance have
persisted as Victorian production wanes. In 2021 the Australian Competition and Consumer Commission (ACCC)
forecast that potential supply shortfalls could emerge in the southern states by 2024. Similarly, AEMO forecast supply
scarcity risks in the southern states for winter 2023 under certain conditions.
Both AEMO and the ACCC have identified a range of projects that could mitigate the supply risk. The recently
approved Narrabri Gas Project has the potential to supply up to 200 terajoules (TJ) of gas per day. Also, in May
2021 APA Group announced it would be expanding key pipelines linking east coast markets to increase capacity by
up to 25%. In addition, there are currently 5 LNG import terminals under consideration in NSW, Victoria and South
Australia. Of these, the most progressed is Australian Industrial Energy’s Port Kembla proposal in NSW, which has
the potential to supply up to 500 TJ of gas per day.
There is a risk that these projects will not come online in time, however, as many have already faced significant
delays. The Narrabri Gas Project has faced significant opposition and regulatory hurdles since proposal, and the LNG
import terminals slipped from their original timeframes due to planning, environmental and other challenges. While,
if completed, projects under development should avert supply issues in the near term, supply gaps could emerge by
2026, or earlier if committed projects experience delays.
In response to ongoing supply uncertainty, the Australian Government and some state governments have launched
initiatives to encourage new projects to supply the domestic market. In 2020 the Australian Government announced
a number of measures as part of its gas-fired recovery plan to facilitate the development of new sources of supply.
These include extending the heads of agreement with Queensland producers, providing funding to support the further
development of key gas basins, and exploring a gas reservation scheme. In May 2021 the Australian Government
also released its first interim National Gas Infrastructure Plan, which identifies priority projects critical to addressing
expected gas supply shortfalls.
STATE OF THE ENERGY MARKET 2021 Market overview 11Electricity and gas networks
In 2020 the value of the regulatory asset base (RAB) for electricity network businesses exceeded $100 billion for the
first time – a 1.2% increase over the previous year. However, growth in customer numbers offset the impact of this
increase, with RAB per customer falling to $9,498 in 2020 – 3% lower than its peak in 2015.
Figure 5 Value of electricity network assets (regulatory asset base)
120
Peak: $9,793 per customer. $9,498 per customer.
100
$7,450 per customer.
80 Peak: $7,533 per customer.
RAB ($ billion)
60
40
Peak: $2,299 per customer. $2,048 per customer.
20
0
2006
2007
2008
2009
2010
2011
2012
2013
2014
2015
2016
2017
2018
2019
2020
Total Distribution Transmission
RAB: regulatory asset base.
Note: Closing RABs for electricity networks in the National Electricity Market, consumer price index (CPI) adjusted to June 2021 dollars. Most network
businesses report on a 1 July – 30 June basis. The exceptions are Victorian networks: AusNet Services (transmission) reports on a 1 April – 31
March basis, and the Victorian distribution network businesses report on a 1 January – 31 December basis. The data show outcomes for the
reporting period ending in that year (for example, the 2017–18 reporting year is shown as 2018). Transmission networks do not report customer
numbers. Per customer metrics for the transmission network were calculated using the total number of distribution customers.
Source: AER modelling; economic benchmarking regulatory information notice (RIN) responses.
In 2020 the average residential electricity distribution customer consumed 0.8% more energy from the distribution
network than they did in the previous year – the second consecutive year of mildly increasing consumption. This
compares to a trend of decreasing average consumption since 2008, by around 2% per year, due in large part to
the rapid uptake of rooftop solar PV systems. The opposite was experienced by business customers, with average
electricity use falling by 4.5% over 2020. This marked the largest single annual fluctuation in the past 14 years for
these customers.
The COVID-19 pandemic drove a significant change in electricity usage over 2020 as residential customers spent
more time at home and many businesses were forced to close or change how they operated. This change was most
pronounced in Victoria, which experienced a longer lockdown than other regions. Over 2020 Victorian residential
usage increased by around 4%. Victorian business customer usage reduced by over 8% in 2020.
The average network customer experienced significantly more total minutes off supply in 2020 (350) than in the
previous year (275). The increase was largely driven by the impact of the devastating bushfires which burned
throughout the spring and summer of 2019–20, destroying thousands of homes and burning over 17 million hectares
of land across Australia.
Customers also experienced a significant increase in the frequency and duration of planned interruptions to supply in
2020, driven by Ausgrid’s (NSW) decision to temporarily pause all live work on its network for safety reasons.
However, in 2020 the distribution businesses generally performed well against their reliability performance targets,
which exclude the impact of extreme events.
STATE OF THE ENERGY MARKET 2021 Market overview 12Network businesses are adapting to a changing operating environment. The impact of storms and bushfires over
recent years has emphasised the importance of electricity system resilience as extreme weather events become
more frequent and intense. In 2020 a number of distributors applied to the AER to pass through costs linked to
extreme weather events that damaged their networks.
Distribution networks are also addressing system security issues from the rapid growth in rooftop solar PV. Until
recently, distributors could not charge for export services into the grid, and hosted rooftop solar exports as a ‘free’
service. In effect, the costs of network congestion and voltage instability caused by rooftop solar PV were paid for by
all consumers through higher energy bills.
Distributors have sought to manage the issue through efficient expansion of their networks and by imposing solar
export limits, in some cases as low as zero. From February 2021 new minimum technical standards require rooftop
solar PV to be able to ride through voltage disturbances. Draft pricing reforms released in March 2021 allow networks
to charge for transporting electricity both from the grid and into it to better signal the cost of network services.5
Proposed new ‘solar export charges’ would allow network businesses to signal the value of excess electricity
produced by rooftop solar PV at different times of the day. The networks will also receive incentives to identify and
implement a level of export service valued by their customers.
Market signals should encourage efficient investment in distributed energy resources such as battery storage or EVs
that can provide network support services and help manage system demand, particularly when coordinated through
virtual power plants. While uptake of these technologies has been slow, trials are underway to identify how best to
integrate them into the NEM.
Retail energy markets
Electricity retail prices have become slightly more affordable over the past 3 years as sharply declining electricity
wholesale costs since 2019 started to flow through to retail customers. Between June 2018 and February 2021,
median market offer prices for residential customers fell by 8–16% in Queensland, 10–18% in NSW, 7–10% in
Victoria, 19% in South Australia, and 4% in the Australian Capital Territory (ACT). Tasmania was the only region to
record a rise (less than 1%) in market offer prices over this period. Standing offer prices also fell over this period,
particularly between 2019 and 2020, when the AER’s Default Market Offer (DMO) role (and similar Victorian provisions)
commenced to limit the level of standing offers in most regions, removing inflated offers from the market.
Price competition at the lower end of the market intensified over 2020, with prices of the lowest offers in most regions
reducing more than the median market or standing offer. The cheapest market offers were typically offered by
smaller tier 2 retailers. A residential customer switching from the median electricity market offer to the best market
offer in most jurisdictions could save $180–300 annually in February 2021. Potential savings were lower in Victoria, at
$110–150 annually.
Lower wholesale costs are forecast to drive electricity retail prices even lower. The AER’s DMO determination for
2021–22 will reduce the price cap on standing offer prices for residential customers in south east Queensland, NSW
and South Australia by between 2.7% and 7.4%. The Australian Government introduced legislation in June 2020 that
requires retailers to pass on to customers any sustained and substantial decreases in the costs of electricity.6
Gas retail prices have followed a similar path to electricity prices, with lower wholesale gas costs leading to a decline
in retail prices since 2018 in most regions. But price reductions were less pronounced than for electricity. Between
June 2018 and February 2021 median gas market offer prices fell by 3–8% in Queensland, 8% in NSW, 2–5% in
Victoria, and 8% in the ACT. South Australia was the only region to record a rise (of less than 1%) in market prices
over this period. A customer switching from the median gas market offer to the best market offer in their distribution
zone in February 2021 could save from $50 annually in Queensland to almost $300 in the ACT.
5 AEMC, National electricity amendment (access, pricing and incentive arrangements for distributed energy resources) rule, draft rule determination,
March 2021.
6 Treasury Laws Amendment (Prohibiting Energy Market Misconduct) Act 2019.
STATE OF THE ENERGY MARKET 2021 Market overview 13Figure 6 Movement in energy bills for customers on market and standing offers
Electricity
3,000
2,500
Annual bill ($)
2,000
1,500
1,000
2021
2021
2021
2021
2021
2021
2021
2021
2021
2021
2021
2021
2020
2018
2019
2020
2019
2020
2018
2019
2020
2018
2019
2020
2018
2019
2020
2018
2019
2020
2018
2019
2020
2018
2019
2020
2018
2019
2020
2021
2018
2019
2020
2018
2019
2020
2018
2018
2019
2020
2018
2019
Energex Ergon Ausgrid Endeavour Essential Citipower AusNet Jemena Powercor United SAPN TasNet- Evoenergy
(Qld) Energy (NSW) Energy Energy (Vic) Services (Vic) (Vic) Energy (SA) works (ACT)
(Qld) (NSW) (NSW) (Vic) (Vic) (Tas)
Gas
2,500
2,000
Annual bill ($)
1,500
1,000
500
2020
2021
2018
2019
2020
2021
2018
2019
2020
2021
2018
2019
2020
2021
2020
2021
2018
2019
2020
2021
2018
2019
2018
2019
2020
2021
2018
2019
2020
2021
2018
2019
Australian Gas Allgas Energy Jemena Gas Multinet (Vic) AusNet Australian Gas Australian Gas Evoenergy
Networks (Qld) (Qld) Networks (NSW) Services (Vic) Networks (Vic) Networks (SA) (ACT)
Market Standing
Note: AER estimates based on generally available offers for residential customers on a ‘single rate’ tariff structure.
Annual bills and price changes are based on median market and standing offers at June 2018, June 2019, June 2020 and February 2021, using
average consumption in each jurisdiction: NSW 5,881 kWh (kilowatt hours) (electricity), 22,855 megajoules (MJ) (gas); Queensland 5,699 kWh,
7,873 MJ; Victoria 4,589 kWh, 57,064 MJ; South Australia 4,752 kWh, 17,501 MJ; ACT 6,545 kWh, 42,078 MJ.
Market offer prices include all conditional discounts.
Source: Energy Made Easy (www.energymadeeasy.gov.au); Victoria Energy Compare (compare.energy.vic.gov.au).
STATE OF THE ENERGY MARKET 2021 Market overview 14Reforms were introduced in 2020 to cap conditional discounts (such as ‘pay on time’ discounts) in retail offers. Conditional discounts can result in much higher energy bills if the conditions are not met, and opaque advertising of these offers makes it difficult for customers to assess whether an offer is right for them. Customers in financial difficulty are more likely to face higher bills as a result of missed conditional discounts. In 2019–20, 18% of customers in hardship programs or on payment plans failed to meet conditional discounts compared to 11% of all customers.7 Caps on conditional discounts, along with earlier reforms that simplified and standardised how offers are presented (including a ‘reference bill’ against which all offers must be compared; and restrictions on advertising conditional discounts), have led to retailers moving away from this practice. In February 2021, 83–91% of offers in Queensland, NSW, Victoria and South Australia had guaranteed prices (no conditional discounts) – up from 43–60% in 2019. Similar outcomes were seen for gas offers. The size of offered discounts also reduced over this period. In February 2021 conditional discounts were typically less than 10% of the original bill. While energy prices have moderated in recent years, they continue to be a source of financial pressure for customers in vulnerable circumstances. The COVID-19 pandemic magnified financial stress over 2020 and led to many households facing payment difficulties for the first time as a result of reduced income and higher household energy use. The AER’s Statement of Expectations set out additional customer protections, including a ban on retailers disconnecting any small (residential or small business) customer in financial distress. This protection was in place until August 2020, with disconnections allowed after that date in limited circumstances. Disconnections of residential customers remained well below the previous year in the period following the lifting of restrictions – down more than 70% from October to December 2020. The number of customers in debt rose over 2020 – up 16% from a year earlier – and 2.9% of customers were in debt at December 2020.8 But this rise followed a trend of falling numbers of customers in debt since 2015, with the number of customers in debt in 2020 still well below the number between 2015 and 2018. Along with an increase in the number of customers in debt over 2020, the level of debt held by those customers also increased across all regions. The average value of debt at December 2020 was $1,008 (up from $796 in the previous year). This continued a trend of increasing debt levels since 2015. Hardship customers had higher levels of debt than other customers. Electricity debt for hardship customers reached record levels by December 2020, averaging $1,584. This was 58% higher than debt levels at December 2018. Gas hardship customer debt levels also increased over the past 2 years, rising 42% to an average $745. High debt levels of hardship customers are compounded by relatively high average energy usage for these customers. Customers on hardship programs in the third quarter of 2020 consumed on average over 60% more electricity than a typical customer (2,129 kWh per quarter compared to 1,310 kWh).9 This may reflect that financially vulnerable customers have less access to solar PV systems and are residing in properties and using electrical appliances that are less energy efficient. High ongoing energy costs from this electricity use contributes to around 40% of hardship customers not meeting ongoing usage charges, meaning their debt levels will continue to increase. Reforms to strengthen customer protections and encourage customers to engage (to their benefit) in the market, and a period of reducing prices, have contributed to improved customer satisfaction in the energy market. But there is much still to do, with only 38% of residential customers expressing confidence in the market in December 2020 (up from 21% in December 2017).10 Pleasingly, 70% of customers were confident in their ability to navigate the energy retail market – the highest recorded in the 4 years that surveys have been undertaken by Energy Consumers Australia. This increase in customer confidence has not translated into higher levels of market activity. Small customer switching decreased in 2020 in all regions for electricity customers, with NSW, Victoria and South Australia recording their lowest annual switching rates in the past decade. Customer switching rates peaked in 2018 following the introduction of initiatives to encourage customer engagement, but have declined in recent years. 7 ACCC, Inquiry into the National Electricity Market, May 2021 report, June 2021. 8 Energy debt refers to electricity and gas debt that has been outstanding for 90 days or more. 9 ACCC, Inquiry into the National Electricity Market, May 2020 report, May 2020. 10 Energy Consumers Australia, Energy consumer sentiment survey, December 2020. STATE OF THE ENERGY MARKET 2021 Market overview 15
Ongoing reform processes will impact on customer engagement. The Australian Government (Treasury) is
progressing work to implement a national Consumer Data Right for energy, which will increase access to consumers’
data to support comparisons of offers and underpin new energy services. The Consumer Data Right framework for
energy is expected to be finalised in 2021.11 Also, from August 2022, new customer billing rules will provide retailers
with more flexibility in how they present information to customers, including through digital platforms.

While customer engagement has reduced over the past year, retailer activity continues to expand. Since the start
of 2020, 11 new retailers have been authorised to retail electricity and 2 to retail gas. Five new brands commenced
selling electricity.

New products were introduced that reflect the increasing penetration of solar and to cater for early adopters of
batteries and EVs. Some of these products have a time-of-use pricing structure but with rates set to encourage
charging/discharging of batteries or EVs at specific times. These products may also come with add-on services such
as automated systems that learn customers’ usage patterns and charge/discharge batteries to maximise value. Some
offers allow customers to become part of a virtual power plant that aggregates multiple household solar and battery
systems to provide power for network support or frequency control ancillary services or to engage in wholesale
price arbitrage.

Retailers have also been required to manage the transition to cost-reflective network tariffs underway since 2017.
Retailers receive these price signals from networks, but have freedom to decide how to pass on the changes to their
customers. The AEMC found that despite progress at the network level, cost-reflective tariff reform at the consumer
level has proven to be difficult to implement. The AEMC cited a lack of clarity about how network tariffs could play out
through retailers, how retailers will translate tariffs to customers, and what protections will be available for vulnerable
consumers as factors contributing to slow progress.12 Survey responses from members of an AEMC technical
working group rated ‘retailer support and the extent of pass through into retail tariffs’ as the largest cause of delay to
the pace of tariff reform.

The limited penetration of smart meters (or manually read interval meters) for residential and small business
customers is another factor limiting the uptake of cost-reflective tariffs. At February 2021 around 39% of customers in
the NEM had metering capable of supporting cost-reflective tariffs. But installation rates vary across regions. Around
98% of Victorian customers had access to a smart meter. NSW had the next highest penetration of smart or interval
meters at around 25% of customers. Installation levels in other regions ranged from 15% of customers in Queensland
to 23% of customers in the ACT.

11 ACCC, Energy rules framework, consultation paper, July 2020.
12 AEMC, Electricity network economic regulatory framework 2020 review, final report, 1 October 2020, p 45.

STATE OF THE ENERGY MARKET 2021                 Market overview                                                         16
Infographic
       Infographic 1 1––Electricity
                         Electricity  supply
                                    supply    chain
                                           chain

           Generators
           Produce electricity from sources including coal, gas, solar, water, wind, biomass

           Transmission networks
           Convert low-voltage electricity to high voltage
           for efficient transport over long distances

                                                                                                       Some larger industrial consumers
                                                                                                       take their supply directly from
                                                                                                       the transmission lines

           Distribution networks
           Convert high-voltage electricity to
           low-voltage and transport it to customers

           Energy retail interface

              Alternative energy providers                          Authorised or licensed               Energy onsellers
                                                                       energy retailers
              Install solar panels and batteries at a                                                    Buy energy from authorised
              customer's premises and sell output                    Buy electricity from                retailers and onsell to
              to the customer. May also offer                        generators and sell to              customers in embedded
              energy management tools to                             energy users                        networks
              support demand response.

           Energy customers

         Microgrids                      Households                   Households with           Large retail             Embedded network
                                      (no solar installed)            solar panels and          customers                   customers
                                                                         batteries
     Largely self-sufficient                                                                                                 e.g. Apartment
     through small scale                                            May sell excess energy                              buildings, caravan parks
     generation and storage,                                        back to their retailer or
     but may trade small                                             neighbours, or offer
     amounts of energy with                                           demand response.
     retailers.

STATE OF THE ENERGY MARKET 2021                   Market overview                                                                                  17
Infographic
Infographic2 –2Gas supply
– Gas chain
supply chain
Gas production
Oil and gas wells and coal seam gas wells
source gas from gas fields and ship to a
Offshore gas platfom Coal seam gas well
processing plant to meet technical
specifications
Gas processing plant
Gas transmission
High pressure pipelines transport gas to large Large industrial customer
industrial customers, LNG plants, gas powered
electricity generators and city gates
Gas powered generator to electricity market
Gas storage for when
shortages arise
Gas distribution LNG plant and export to Asia
At city gates, gas pressure is lowered and
injected into local distribution networks
for transport to customers City gate
Energy retail interface
Buys gas from gas producers and pipeline
capacity from gas transmission and
distribution businesses to supply customers
Authorised or licensed
energy retailers
Gas customers
Residential Small industrial Commercial
STATE OF THE ENERGY MARKET 2021 Market overview 18You can also read


