February/March 2017 Investor Presentation - Nextera Energy Investor Relations
←
→
Page content transcription
If your browser does not render page correctly, please read the page content below
February/March 2017 Investor Presentation

Cautionary Statements And Risk Factors That May Affect
Future Results
This presentation includes forward-looking statements within the meaning of the
federal securities laws. Actual results could differ materially from such forward-
looking statements. The factors that could cause actual results to differ are
discussed in the Appendix herein and in NextEra Energy’s and NextEra Energy
Partners’ SEC filings.

Non-GAAP Financial Information
This presentation refers to certain financial measures that were not prepared in
accordance with U.S. generally accepted accounting principles. Reconciliations
of those non-GAAP financial measures to the most directly comparable GAAP
financial measures can be found in the Appendix herein.

 2
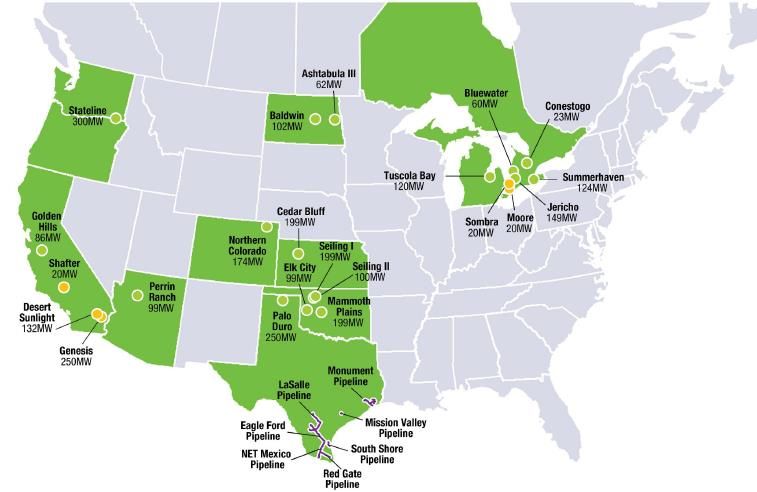
Table of Contents
    • NextEra Energy, Inc. Overview (NYSE: NEE) Slide 4

    • Florida Power & Light                     Slide 9

    • NextEra Energy Resources                  Slide 14

    • NextEra Energy Partners, LP (NYSE: NEP)   Slide 21

    • Financial Review                          Slide 34

    • Appendix                                  Slide 38

3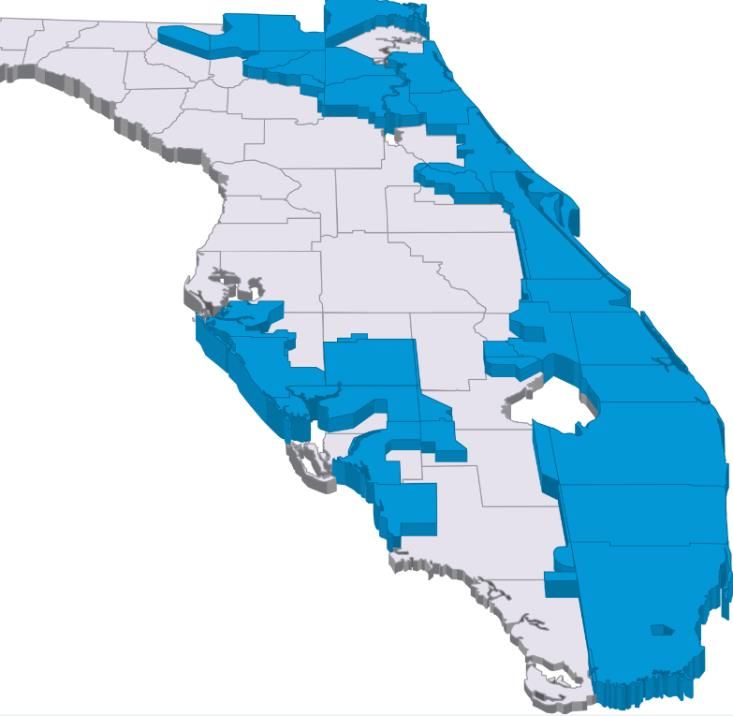
NextEra Energy is comprised of two strong businesses
supported by a common platform

                                                         •   $60 B market capitalization(1)
                                                         •   46 GW in operation(2,3)
                                                         •   $90 B in total assets(3)
                                                         •   Partnership with

                     • One of the largest electric           • The world leader in
                       utilities in the nation by              electricity generated from
                       retail MWh sales                        the wind and sun

                                          Engineering & Construction
                                                Supply Chain
                                             Nuclear Generation
                                           Non-Nuclear Generation
     (1) As of February 22, 2017; Source: FactSet
     (2) Megawatts shown include megawatts sold to NEP
     (3) As of December 31, 2016
 4
Built on a foundation of best-in-class operational excellence
and financial strength, and focused on clean generation
       Cost and Reliability                                                                         Generation Profile
     2015 Utility & Corporate Benchmarks                                                      2016 NextEra Energy Fuel Mix MWhs(3)

                                                                                                                   Nuclear           Wind
      Industry ~$23                        FL Avg ~133                Good                                          26%              20%

        FPL ~$14                             FPL ~61                                                                                             Coal 2%
                                                                                                                       Natural Gas               Solar 2%
                                                                                                                          49%
                                                                                                                                                  Oil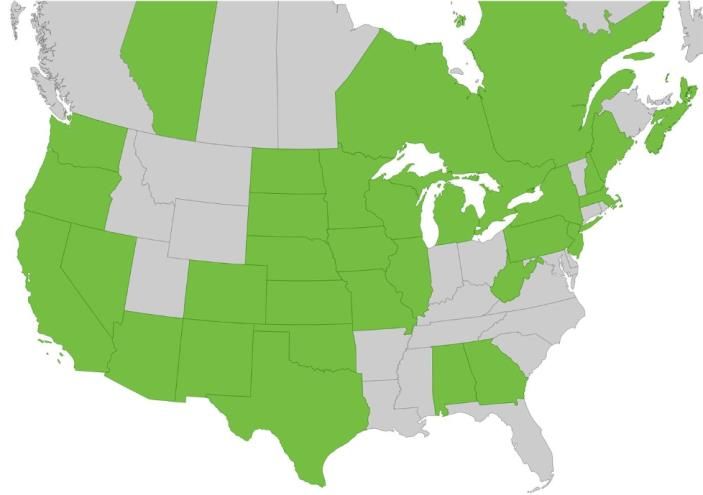
We have a long-term track record of delivering value to
   shareholders

        Adjusted Earnings Per Share(1)                                                       Total Shareholder Return(2)
                                                                                   $6.19    20%    18%                     60%
                                                                                                                                  53%
                                                                           $5.71                         16%
                                                                   $5.30                                                   50%
                                                           $4.97                                                                         43%
                                                                                            15%
                                    $4.30 $4.39 $4.57                                                           12%
                        $3.84 $4.05                                                                                        40%
                $3.49                                                                                                                          29%
        $3.04                                                                               10%                            30%
$2.63
                                                                                                                           20%
                                                                                             5%
                                                                                                                           10%

                                                                                             0%                             0%
 '05     '06     '07     '08   '09   '10    '11     '12     '13     '14     '15     '16              One Year                       Three Year

                 Dividends Per Share
                                                                                           140%   130%                   250%
                                                                                   $3.48
                                                                                                                                  206%
                                                                           $3.08           120%
                                                                   $2.90                                       98%       200%
                                                           $2.64                           100%
                                                   $2.40
                                           $2.20                                                                         150%
                              $2.00                                                        80%
            $1.64 $1.78 $1.89                                                                            64%
$1.42 $1.50                                                                                60%                                           96%   96%
                                                                                                                         100%
                                                                                           40%
                                                                                                                           50%
                                                                                           20%
                                                                                            0%                              0%
 '05    '06      '07     '08   '09   '10    '11     '12     '13     '14     '15     '16             Five Year                       Ten Year
                                                                                                     ■    NEE
                (1)     See Appendix for reconciliation of adjusted amounts to GAAP amounts          ■    S&P 500 Utility Index
        6
                (2)     Source: FactSet; includes dividend reinvestment as of 12/31/2016             ■    S&P 500
NextEra Energy has announced proposed transactions with
EFH, TTHC and OMI that would result in NextEra Energy
owning 100% of Oncor
               Oncor U.S. Bankruptcy Court and
                  PUCT Estimated Timeline

                              January/
    September 19, October 31, February February 14, February 21, April 29,
        2016         2016       2017      2017         2017       2017

         US       File formal   Intervenor,    US         PUCT     Statutory
    Bankruptcy     approval     staff, NEE, Bankruptcy   hearing   deadline
       court     request with   and Oncor     court      on the    for PUCT
    approval for     PUCT         rebuttal   hearings    merits      ruling
    EFH to enter                 testimony    begin       begin
    into merger
     agreement

7
Over a sustained period of time, our growth strategy has led
to real change in relative position

    Top 20 Global Utility Equity Market Capitalization(1)
                   As of 6/1/2001 ($ MM)                       As of 2/22/2017 ($ MM)
         Rank             Market Cap                    Rank      Market Cap
            1              $38,574                        1         $60,016     NextEra Energy
            2              $38,185                        2         $55,909
            3              $34,476                        3         $48,049
            4              $34,111                        4         $47,226
            5              $30,955                        5         $46,042
            6              $23,906                        6         $45,583
            7              $21,537                        7         $45,308
            8              $20,093                        8         $42,705
            9              $17,297                        9         $42,598
           10              $16,873                       10         $42,427
           11              $16,279                       11         $42,243
           12              $15,884                       12         $42,190
           13              $15,785                       13         $42,190
           14              $14,601                       14         $41,466
           15              $14,461                       15         $41,441
           16              $14,223                       16         $41,432
           17              $13,773                       17         $40,463
           18              $13,550                       18         $35,981
           19              $13,136                       19         $33,070
           20              $12,934                       20         $32,826

           30              $10,206     NextEra Energy
    (1) Source: Factset
8
9
Florida Power & Light is one of the best utility franchises in
the U.S.

                                        Florida Power & Light
• One of the largest U.S.
  electric utilities

• Vertically integrated, retail
  rate-regulated

• ~4.9 MM customer accounts

• ~26 GW in operation

• $10.9 B in operating
  revenues

• $45.5 B in total assets

     Note: Data is as of year ended December 31, 2016
10
Our core focus at FPL has been consistent for many years
Areas of Focus
• Unyielding commitment to Superior Customer
Value Delivery
customer value proposition
• Focus on efficiency and Strong
Financial Virtuous Circle
Customer
best-in-class cost Position
Satisfaction
performance
Constructive
• One of the most modern, Regulatory
Environment
clean, fuel-efficient
generation fleets in U.S.
• Low Cost
• Growth driven by deploying
capital productively in ways • High Reliability
that have long-term benefits • Customer Satisfaction
to customers
11Our value delivery is founded on a low cost position and best-
in-class operations
Operational Cost Effectiveness(1)
$100.00
Good Adjusted Regressed
Top Decile
$/Retail
MWh
Log/Log FPL ~$14
$10.00
1,000,000 10,000,000 100,000,000 1,000,000,000
Retail MWh
(1) FERC Form 1, 2015. Excludes pensions and other employee benefits. Note: Holding companies with >100,000
customers. Excludes companies with no utility owned generation.
12FPL’s settlement agreement is designed to help deliver
continued outstanding customer value
FPL’s Base Rate Case Settlement
• Effective January 2017 through December 2020
• Retail base revenue increases according to the following
schedule:
– $400 MM beginning January 2017
– $211 MM beginning January 2018
– $200 MM expected in mid-2019 when the Okeechobee Clean Energy
Center achieves COD
• Allowed regulatory ROE of 10.55% with a range of 9.60% to 11.60%
• Solar Base Rate Adjustment upon COD for up to 300 MW per year
• Flexibility to amortize up to $1.25 B of reserve amount
– Includes the $250 MM reserve amount that remained at the end of 2016
under the 2012 rate agreement
• Introduces a 50 MW battery storage pilot program
1314
Energy Resources is a diversified clean energy company
    whose skills and assets are well aligned to drive growth

                                                  Energy Resources
           Skills and Capabilities                                                 Generation Portfolio(1)
•        Largest, most successful
         developer of renewables in North
         America
          – Consistent strategy to build, own
            and operate environmentally
            favorable assets
•        Excellent operator of diverse fuel
         assets – wind, solar, fossil and
         nuclear
•        Investments in related areas – gas                                                        Wind
                                                                                                   70%
         pipelines, transmission, energy
         storage
•        Hedging, optimization and risk                                          Natural Gas      Solar
                                                                                                          Nuclear
                                                                                                           14%
         management                                                                  2%     Oil    10%
                                                                                            4%

          (1)   Generation mix is based on MW capacity as of December 31, 2016
    15
Energy Resources’ growth is driven by its best-in-class
development skills
NextEra Energy Resources Development Skills
Wind and Solar Portfolio(1)
20,000
Customer
Wind Relationships
15,000 Engineering/
MW Solar Construction
Regulatory
10,000 Management
5,000
0
2002 2004 2006 2008 2010 2012 2014 2016 Best-In-Class Integrated
Environmental/ Development Product
Permitting Offerings
Skills
Cumulative Origination in Gas
6,000 Pipeline Investments(2)
4,000 Technology Brand
$ MM Recognition
Balance
2,000 Sheet
Strength
0
2012 2014 2016
(1) Includes noncontrolling interest of NEP assets
(2) Pipeline origination represents planned capital investments at the time of project origination and 100% of
16 Texas Pipelines acquisition that closed on October 1, 2015We continue to have an outstanding opportunity set for new
renewables growth
Energy Resources Development Program(1)
• Delivered ~2.5 GW of wind and solar projects in 2016
• Added ~3.5 GW of renewables projects to backlog over the last year
– Includes repowering opportunities for ~1,600 MW of existing U.S. wind
• Current 2017 – 2018 development program:
Signed & Additional Current
2017-2018 Repowering Forecast Expectations
U.S. Wind 1,089(2) 1,311 – 2,711 2,400 – 3,800
Canadian Wind 0 0 – 300 0 – 300
U.S. Solar 292(3) 108 – 1,008 400 – 1,300
Total 1,381 MW 1,419 – 4,019 MW 2,800 – 5,400 MW
Total w/ Repowering 2,981 MW(4)
(1) See Appendix for detail of Energy Resources’ wind and solar development projects included in backlog
(2) Excludes 500 MW signed for post-2018 delivery
(3) Excludes 225 MW signed for post-2018 delivery
(4) Includes ~1,600 MW of repowering projects for completion in 2017-2018
17 Note: As of January 27, 2017Energy Resources’ renewables development opportunities
have never been stronger
Drivers for Renewables
• Extension and phase down of U.S. Federal Tax incentives
for renewables
• Improvements in wind and solar technology and declining
cost trends
• Evaluating repowering opportunities across our fleet
• State regulatory programs to encourage development of
renewable energy
• Potential coal-to-renewables switching driven by low
natural gas prices
Energy storage may provide additional opportunities in the next decade
18U.S. Federal tax incentives for completed renewables projects
have been extended into the next decade
Extended U.S. Federal Tax Credits
Wind Production Solar Investment
Tax Credit (PTC) Tax Credit (ITC)
Start of Start of
Construction COD Wind Construction Solar
Date Deadline PTC Date ITC
During 2016 12/31/2020 100% Prior to 1/1/2020 30%
During 2017 12/31/2021 80% During 2020 26%
During 2018 12/31/2022 60% During 2021 22%
During 2019 12/31/2023 40% 2022 and beyond 10%
• For wind PTC, the IRS provided additional guidance in 2016
– Continuity safe harbor is satisfied for a facility if COD occurs no more
than four calendar years after the calendar year that construction began
– Safe harbor is provided for certain repowered facilities
• Solar ITC remains subject to IRS guidance on COD deadlines
Safe harbor purchases could qualify over 10 GW of wind for 100% PTC
19We have leveraged our skills and capabilities from gas
infrastructure activities to expand into the gas pipeline
business
Gas Pipeline Assets
Sabal Trail and Florida Mountain Valley Pipeline Texas Pipelines(1)
Southeast Connection
• Energy Resources expects • Energy Resources expects • NEP completed the $2.1 B
to invest roughly $1.5 B in to invest roughly $1 B in MVP acquisition in October
Sabal Trail – Joint venture with Con Edison Gas 2015
– Joint Venture with Spectra and Midstream, WGL Midstream, EQT, – Seven natural gas pipelines in
Duke Vega Midstream, and RGC Texas
– NEE’s equity interest is 42.5% Midstream – 3.0 Bcf/day of ship-or-pay
– Expected in-service in mid-2017 – ~300-mile proposed route; ~2 contracts
Bcf/day of 20-year firm capacity – Planned growth and expansion
• Energy Resources expects commitments projects expected
to invest ~$550 MM in FSC – FERC process advancing;
expected in-service by year-end
2018
(1) Refers to NET Midstream portfolio acquired by NextEra Energy Partners
2021
We believe NEP is a premier distribution growth company

                                          NEP Investment Highlights
               High-Quality Portfolio                                              Financial Strength and Flexibility

                                                     ~2.8 GW
   18-Yr                         A3                    Renewables                   >90%
The NEP portfolio is diversified by geography and asset mix
NEP Asset Portfolio(1,2)
• Wind assets:
– 17 projects
– ~2,346 MW
• Solar assets:
– 5 projects
– ~442 MW
• Pipeline assets:
– Seven natural gas pipelines
– ~3 Bcf of contracted and
~4 Bcf total capacity
(1) Consolidated projects as of December 31, 2016
23 (2) Excludes non-economic ownership interest in equity method investmentsNEP’s structure creates tax advantages similar to MLPs
NEP’s Structural Tax Advantages
• NEP is not expected to pay meaningful U.S. federal income tax
for at least fifteen years
– Existing NOLs and NOLs generated through MACRS depreciation of its
acquisitions may be used to offset taxable income
• NEP distributions up to investors outside basis are expected to
be characterized as non-dividend distributions (“return of
capital”)
– Return of capital treatment is expected to remain so long as NEP has
negative current earnings and profits (E&P)
E&P is generally equal to taxable income, with several adjustments,
including 12 year depreciation schedule rather than MACRS
NEP expected to have negative current E&P for at least eight years
– Dividend treatment will apply if and when NEP has positive current E&P
• NEP is treated as a C Corporation for U.S. federal tax purposes
– Investors receive a 1099-DIV (as opposed to K-1s issued by MLPs)
Note: As of year-end 2016, except as otherwise noted; should not be construed as tax advice
24NEP’s tax shield creates the need to employ tax equity
financing for projects that generate a large portion of their
economics from tax credits
PAYGO Tax Equity Financing
• Tax equity financing is used Project Cash Flow Split(1)
to monetize tax attributes
• Under tax equity, an investor
8%-12%
makes an up-front payment
– Pre-payment for tax 30%-35%
depreciation, 70-75% of
expected PTCs, and a small
portion of project cash Reported
NEP
• Additionally, the investor 55%-60%
CAFD
makes PAYGO payments
– 25-30% of annual PTCs that
enhance asset cash flow profile
• Project cash not paid to the
investor and PAYGO Tax Equity Share of Project Cash
payments make up total NEP's Cash From PAYGO Payments
CAFD NEP's Share of Project Cash
25 (1) Cash flow splits are shown on a pre-tax basisSince the IPO, NextEra Energy Partners has delivered total
shareholder return of 34%
Total Shareholder Return
NextEra Energy Partners vs. Indices
40%
34%
30%
20%
20%
14%
10%
0% (1)
NEP S&P 500 S&P 500 Yieldco
Utilities Index Average (2)
-10%
-20%
-18%
-30%
-40%
(1) Reflects total shareholder return as of February 22, 2017 since the IPO dated June 27, 2014 based on the IPO
price of $25
(2) Reflects average total shareholder return for CAFD, TERP, ABY, PEGI, NYLD.A as of February 22, 2017 since
the IPO date assuming IPO price
26 Note: All other data is total shareholder return as of February 22, 2017 since June 27, 2014Over time, we have seen increasing differentiation among
Yieldcos
Total Shareholder Return(1)
NextEra Energy Partners vs. Yieldcos
40% 34%
30%
20% 15%
10%
0%
NEP Yieldco A Yieldco B Yieldco C Yieldco D Yieldco E
-10%
-11%
-20%
-19%
-30%
-30%
-40%
-50% -48%
(1) Reflects total shareholder return as of February 22, 2017 since the IPO date assuming IPO price
27NEE provides NEP strong visibility into a large portfolio of
attractive, long-term contracted assets
Strong Sponsor
• Renewables backlog
– ~13 GW(1) of renewables currently in service
– 2.8 – 5.4 GW of contracted U.S. wind and solar projects
expected to come in service in 2017 – 2018
– Announced ~1.6 GW of wind repowering through 2018
– Announced safe harbor purchases that could qualify over 10 GW
of wind for 100% PTC
• Long-term contracted gas pipelines
– Sabal Trail and Florida Southeast Connection expected to come
in service mid–2017
– Mountain Valley Pipeline expected to come in service by
year-end 2018
(1) As of December 31, 2016; excludes MW sold to NEP
28Accretive acquisitions funded by access to both equity and
debt have supported significant growth in cash available for
distribution (CAFD) and LP distributions
NEP Portfolio
Run-Rate CAFD(1) Annualized LP Distributions(3)
$230-$290 MM $1.41
$85-$90 MM
$0.75
(2)
IPO 12/31/2016E Q3 Q4 Q1 Q2 Q3 Q4 Q1 Q2 Q3 Q4
2014 2014 2015 2015 2015 2015 2016 2016 2016 2016
(1) See appendix for definition of CAFD expectations
(2) Reflects calendar year 2017 expectations for portfolio as of December 31, 2016
(3) Annualized basis; refer to distributions payable on the NextEra Energy Partners Investor Relations website
29NextEra Energy and NextEra Energy Partners announced a
structural modification to IDR fees
NEP IDR Fee Modification
• Based on NEP’s fourth quarter 2016 distribution to current
LP unitholders at an annualized rate of $1.41(1) per unit, IDR
fees are roughly $56 million per year
• From this point forward:
– NextEra Energy’s ability to achieve incremental IDR fees above $56
million from this point forward is predicated on NEP delivering LP
distributions at an annualized rate above $1.41 to all unitholders
– If LP distributions exceed $1.41 per unit, the excess above $1.41 is
split 75% to common unitholders and 25% to IDR fees
30 (1) Represents announced fourth quarter annualized distributions payable in February 2017The modification is centered on value creation, and is
expected to benefit both NEP and NEE
Strategic Rationale of NEP IDR Fee Modification
Expected Benefits to NEP Expected Benefits to NEE
• More cash available to • Potential increased value in
NEP’s LP unitholders NEE’s investment in NEP
• Fewer asset additions • Extension of NEP’s
required to achieve growth distribution growth runway
objectives
• Longer time horizon for
• Reduced equity need NEE to recycle capital, and
optimize its tax position
• Distribution growth runway
extended
Modification is expected to eliminate need for NEP
to issue common equity in 2017, and potentially 2018
31With the IDR fee modification, future NEP acquisitions are
more accretive to LP unitholders
NEP IDR Fee Modification
Original IDR Fee Waterfall Modified IDR Fee Waterfall
Cash Available For Distribution = $4.00/Unit(1)
LP IDR Fee LP IDR Fee
$1.125 First $1.20/unit $0.075 $1.41 First $1.41/unit $0.00
$1.40 50/50 thereafter $1.40 $1.94 75/25 thereafter $0.65
$2.525 $1.475 $3.35 $0.65
~65% ~35% ~85% ~15%
LP ROE’s are expected to increase from the high single digits to the low
double-digits on future NEP acquisitions
1) Illustrative for new acquisition providing $4 of cash available for distribution per unit
32Under the new IDR fee structure, incremental IDR fees are only
paid on annualized LP distributions/unit greater than $1.41 and
based on a single tier of 75% LPs/25% IDRs
Hypothetical IDR Fee Calculation Example(1)
Example
Cash Distributed Cash/Total Unit Distributed
Distributable Cash Flow $850 MM $2.35
Less: Cash Required to Pay $1.41 to LPs
($509 MM) ($1.41)
(based on total units outstanding – 361 MM)
Less: Existing IDRs (A)
($56 MM)(2) ($0.15)(2)
(based on 156 MM units under initial IDR Fee structure)
Total Cash Remaining To Be Split 75/25 $285 MM(3) $0.79(3)
NEW IDR Tier
applied to
remaining cash
LP Split at 75% $214 MM $0.59
IDR Split at 25% (B) $71 MM $0.20
Total LP Distributions $723 MM $2.00
Total IDRs (A+B) $127 MM $0.35
(1) Illustrative example of annualized IDR fee calculation assuming 361 MM units outstanding
(2) Calculation based on initial IDR fee structure, $56 MM amount will not change as long as LP distribution remains
at or above $1.41/unit (annualized)
(3) If negative, IDR fee will be reduced below ~$56 MM; See agreement filed with NEP’s Form 8-K dated January 27,
33 2017 for more information.Financial Review 34
NextEra Energy’s
            Adjusted Earnings Per Share Expectations(1)

                 2017                                                    $6.35 - $6.85

                 2018                                                    $6.80 - $7.30

                 2020                           6% - 8% CAGR off a 2016 base

     (1) See Appendix for definition of Adjusted Earnings expectations
35
NextEra Energy Partners’
Adjusted EBITDA and CAFD Expectations(1)
Adjusted
EBITDA CAFD
12/31/16 Run Rate(2) $670 - $760 MM $230 - $290 MM
12/31/17 Run Rate(3) $875 - $975 MM $310 - $340 MM
(1) See Appendix for definition of Adjusted EBITDA and CAFD expectations
(2) Reflects calendar year 2017 expectations for portfolio as of 12/31/16
(3) Reflects calendar year 2018 expectations for forecasted portfolio as of 12/31/17; includes announced
portfolio, plus expected impact of additional acquisitions not yet identified
36Our current expectations are for NEP to grow LP distributions
by 12 – 15% annually through at least 2022
NextEra Energy Partners’ Long-Term
Distribution per Unit Growth Expectations(1)
Annual
12% - 15%
Growth(2)
$1.58-$1.62
$1.41
Q4 2016 Q4 2017E Q4 2022E
(1) Represents expected fourth quarter annualized distributions payable in February of the following year
(2) From a base of our fourth quarter 2016 distribution per common unit at an annualized rate of $1.41
37Appendix 38
39
Contracted Renewables
                                       Development Program(1,2)
Wind                       Location          MW COD               Solar                         Location          MW       COD
Breckinridge               OK                  98     2015        Shafter                     CA                     20        2015
Goshen                    Ontario             102     2015        Adelanto I & II             CA                     27        2015
East Durham               Ontario              22     2015        McCoy Solar                 CA                    250        2016
Cedar Point JV            Ontario              50     2015        Blythe                      CA                    110        2016
Golden Hills               CA                  86     2015        White Oak Solar             GA                     77        2016
Golden West                CO                 249     2015        White Pine Solar            GA                    101        2016
Carousel                   CO                 150     2015        Live Oak Solar              GA                     51        2016
Cedar Bluff                KS                 199     2015        Silver State South          NV                    250        2016
Javelina                   TX                 250     2015        Blythe II                   CA                    125        2016
Javelina II                TX                 200     2016        River Bend Solar            AL                     75        2016
Dickinson/Brady            ND                 150     2016        Roswell Solar               NM                     70        2016
Osborn                     MO                 201     2016        Chaves Solar                NM                     70        2016
Ninnescah                  KS                 208     2016        Distributed Generation                             40   2015-2016
Rush Springs               OK                 249     2016               TOTAL 2015 – 2016 Solar:                 1,266
Kingman                    KS                 207     2016
Brady II                   ND                 149     2016        2017 – 2018:
High Lonesome Mesa(3)      NM                 100                 Contracted Solar                                 292
       TOTAL 2015 – 2016 Wind:              2,670
                                                                  Post – 2018:
2017 – 2018:                                                      Contracted Solar                                 225
Contracted Wind                             1,089

Post – 2018:
Contracted Wind                               500

     (1) 2015+ COD and current backlog of projects with signed long-term contracts. All projects are subject to
         development and construction risks.
     (2) Megawatts shown include megawatts sold to NEP
     (3) Acquired 100 MW project in 2016 that began commercial operations in 2009Note: As of January 27, 2017
40   Note: As of January 27, 2017
Reconciliation of Earnings Per Share Attributable to
NextEra Energy, Inc. to Adjusted Earnings Per Share
2005 2006 2007 2008 2009 2010 2011 2012 2013 2014 2015 2016
Earnings Per Share Attributable to NextEra Energy, Inc.
(assuming dilution) $ 2.34 $ 3.23 $ 3.27 $ 4.07 $ 3.97 $ 4.74 $ 4.59 $ 4.56 $ 4.47 $ 5.60 $ 6.06 $ 6.25
Adjustments:
Net unrealized mark-to-market losses (gains) associated
with non-qualifying hedges 0.47 (0.38) 0.36 (0.70) 0.07 (0.69) (0.75) 0.15 0.27 (0.70) (0.64) 0.23
Loss (income) from other than temporary impairments,
net 0.01 0.02 0.34 0.05 (0.02) 0.03 (0.13) (0.01) - 0.05 -
Merger-related expenses 0.06 0.06 0.29
Loss on sale of natural gas-fired generating assets 0.36
Gain from discontinued operations (Hydro) (0.87)
Loss (gain) associated with Maine fossil 0.16 (0.05)
Impairment charge 0.70
Resolution of contingencies related to a previous asset
sale (0.02)
Gains on sale of natural gas generation facilities (0.95)
Operating loss (income) of Spain solar projects 0.03 0.09 (0.01) 0.03
Less related income taxes (0.18) 0.12 (0.16) 0.13 (0.04) 0.27 0.16 (0.01) 0.22 0.36 0.19 0.36
Adjusted Earnings Per Share $ 2.63 $ 3.04 $ 3.49 $ 3.84 $ 4.05 $ 4.30 $ 4.39 $ 4.57 $ 4.97 $ 5.30 $ 5.71 $ 6.19
41Definitional information NextEra Energy, Inc. Adjusted Earnings Expectations This presentation refers to adjusted earnings per share expectations. Adjusted earnings expectations exclude the unrealized mark-to-market effect of non-qualifying hedges, net OTTI losses on securities held in NextEra Energy Resources’ nuclear decommissioning funds and the cumulative effect of adopting new accounting standards, none of which can be determined at this time, and operating results from the Spain solar project and merger related expenses. In addition, adjusted earnings expectations assume, among other things: normal weather and operating conditions; continued recovery of the national and the Florida economy; supportive commodity markets; current forward curves; public policy support for wind and solar development and construction; market demand and transmission expansion to support wind and solar development; access to capital at reasonable cost and terms; no divestitures, other than to NextEra Energy Partners, LP, or acquisitions; no adverse litigation decisions; and no changes to governmental tax policy or incentives. Expected adjusted earnings amounts cannot be reconciled to expected net income because net income includes the mark-to-market effect of non-qualifying hedges and net OTTI losses on certain investments, none of which can be determined at this time. 42
Cautionary Statement And Risk Factors That May Affect
Future Results
This presentation contains “forward-looking statements” within the meaning of the safe harbor provisions of the Private Securities
Litigation Reform Act of 1995. Forward-looking statements are not statements of historical facts, but instead represent the current
expectations of NextEra Energy, Inc. (together with its subsidiaries, NextEra Energy) regarding future operating results and other
future events, many of which, by their nature, are inherently uncertain and outside of NextEra Energy's control. Forward-looking
statements in this presentation include, among others, statements concerning adjusted earnings per share expectations and future
operating performance, and statements concerning future dividends. In some cases, you can identify the forward-looking
statements by words or phrases such as “will,” “may result,” “expect,” “anticipate,” “believe,” “intend,” “plan,” “seek,” “aim,”
“potential,” “projection,” “forecast,” “predict,” “goals,” “target,” “outlook,” “should,” “would” or similar words or expressions. You
should not place undue reliance on these forward-looking statements, which are not a guarantee of future performance. The future
results of NextEra Energy and its business and financial condition are subject to risks and uncertainties that could cause actual
results to differ materially from those expressed or implied in the forward-looking statements, or may require it to limit or eliminate
certain operations. These risks and uncertainties include, but are not limited to, the following: effects of extensive regulation of
NextEra Energy's business operations; inability of NextEra Energy to recover in a timely manner any significant amount of costs, a
return on certain assets or a reasonable return on invested capital through base rates, cost recovery clauses, other regulatory
mechanisms or otherwise; impact of political, regulatory and economic factors on regulatory decisions important to NextEra Energy;
disallowance of cost recovery based on a finding of imprudent use of derivative instruments; effect of any reductions or
modifications to, or elimination of, governmental incentives or policies that support utility scale renewable energy projects or the
imposition of additional tax laws, policies or assessments on renewable energy; impact of new or revised laws, regulations,
interpretations or other regulatory initiatives on NextEra Energy;; capital expenditures, increased operating costs and various
liabilities attributable to environmental laws, regulations and other standards applicable to NextEra Energy; effects on NextEra
Energy of federal or state laws or regulations mandating new or additional limits on the production of greenhouse gas emissions;
exposure of NextEra Energy to significant and increasing compliance costs and substantial monetary penalties and other sanctions
as a result of extensive federal regulation of its operations and businesses; effect on NextEra Energy of changes in tax laws,
guidance or policies as well as in judgments and estimates used to determine tax-related asset and liability amounts; impact on
NextEra Energy of adverse results of litigation; effect on NextEra Energy of failure to proceed with projects under development or
inability to complete the construction of (or capital improvements to) electric generation, transmission and distribution facilities, gas
infrastructure facilities or other facilities on schedule or within budget; impact on development and operating activities of NextEra
Energy resulting from risks related to project siting, financing, construction, permitting, governmental approvals and the negotiation
of project development agreements; risks involved in the operation and maintenance of electric generation, transmission and
distribution facilities, gas infrastructure facilities and other facilities; effect on NextEra Energy of a lack of growth or slower growth in
the number of customers or in customer usage; impact on NextEra Energy of severe weather and other weather conditions; threats
of terrorism and catastrophic events that could result from terrorism, cyber attacks or other attempts to disrupt NextEra Energy's
business or the businesses of third parties; inability to obtain adequate insurance coverage for protection of NextEra Energy against
significant losses and risk that insurance coverage does not provide protection against all significant losses; a prolonged period of
low gas and oil prices could impact NextEra Energy’s gas infrastructure business and cause NextEra Energy to delay or cancel
certain gas infrastructure projects and for certain existing projects to be impaired; risk of increased operating costs resulting from
unfavorable supply costs necessary to provide full energy and capacity requirement services; inability or failure to manage properly
or hedge effectively the commodity risk within its portfolio; effect of reductions in the liquidity of energy markets on NextEra Energy's
ability to manage operational risks; effectiveness of NextEra Energy's risk management tools associated with its hedging and
trading procedures to protect against significant losses, including the effect of unforeseen price variances from historical behavior;

 43
Cautionary Statement And Risk Factors That May Affect
Future Results (cont.)
impact of unavailability or disruption of power transmission or commodity transportation facilities on sale and delivery of power or
natural gas; exposure of NextEra Energy to credit and performance risk from customers, hedging counterparties and vendors; failure
of counterparties to perform under derivative contracts or of requirement for NextEra Energy to post margin cash collateral under
derivative contracts; failure or breach of NextEra Energy's information technology systems; risks to NextEra Energy's retail businesses
from compromise of sensitive customer data; losses from volatility in the market values of derivative instruments and limited liquidity in
OTC markets; impact of negative publicity; inability to maintain, negotiate or renegotiate acceptable franchise agreements; occurrence
of work strikes or stoppages and increasing personnel costs; NextEra Energy's ability to successfully identify, complete and integrate
acquisitions, including the effect of increased competition for acquisitions; NextEra Energy Partners, LP’s (NEP's) acquisitions may
not be completed and, even if completed, NextEra Energy may not realize the anticipated benefits of any acquisitions; environmental,
health and financial risks associated with ownership and operation of nuclear generation facilities; liability of NextEra Energy for
significant retrospective assessments and/or retrospective insurance premiums in the event of an incident at certain nuclear
generation facilities; increased operating and capital expenditures and/or result in reduced revenues at nuclear generation facilities
resulting from orders or new regulations of the Nuclear Regulatory Commission; inability to operate any owned nuclear generation
units through the end of their respective operating licenses; effect of disruptions, uncertainty or volatility in the credit and capital
markets on NextEra Energy's ability to fund its liquidity and capital needs and meet its growth objectives; inability to maintain current
credit ratings; impairment of liquidity from inability of credit providers to fund their credit commitments or to maintain their current credit
ratings; poor market performance and other economic factors that could affect NextEra Energy's defined benefit pension plan's funded
status; poor market performance and other risks to the asset values of nuclear decommissioning funds; changes in market value and
other risks to certain of NextEra Energy's investments; effect of inability of NextEra Energy subsidiaries to pay upstream dividends or
repay funds to NextEra Energy or of NextEra Energy's performance under guarantees of subsidiary obligations on NextEra Energy's
ability to meet its financial obligations and to pay dividends on its common stock; the fact that the amount and timing of dividends
payable on NextEra Energy's common stock, as well as the dividend policy approved by NextEra Energy's board of directors from
time to time, and changes to that policy, are within the sole discretion of NextEra Energy's board of directors and, if declared and paid,
dividends may be in amounts that are less than might be expected by shareholders; NEP’s inability to access sources of capital on
commercially reasonable terms could have an effect on its ability to consummate future acquisitions and on the value of NextEra
Energy’s limited partner interest in NextEra Energy Operating Partners, LP; and effects of disruptions, uncertainty or volatility in the
credit and capital markets on the market price of NextEra Energy's common stock. NextEra Energy discusses these and other risks
and uncertainties in its annual report on Form 10-K for the year ended December 31, 2016 and other SEC filings, and this
presentation should be read in conjunction with such SEC filings made through the date of this presentation. The forward-looking
statements made in this presentation are made only as of the date of this presentation and NextEra Energy undertakes no obligation
to update any forward-looking statements.

  44
Forward Looking Statements
Forward-looking statements also include, but are not limited to, statements about the anticipated benefits of the proposed transactions
involving NEE, EFH, TTHC, OMI and Oncor, including future financial or operating results of NEE or Oncor, NEE’s, EFH’s or Oncor’s
plans, credit ratings changes, objectives, expectations or intentions, the expected timing of completion of the transactions, the value, as
of the completion of the EFH merger, the TTHC merger or the acquisition of OMI’s interest in Oncor, or as of any other date in the future,
of any consideration to be received in the EFH merger in the form of stock or any other security, NEE’s earnings expectations and other
statements that are not historical facts. Important factors that could cause actual results to differ materially from those indicated by any
such forward-looking statements include risks and uncertainties relating to: the risk that NEE, EFH, TTHC, OMI or Oncor may be unable
to obtain bankruptcy court and governmental and regulatory approvals required for the transactions, or required bankruptcy court and
governmental and regulatory approvals may delay the transactions or result in the imposition of conditions that could cause the parties to
abandon any or all transactions; the risk that a condition to closing of any of the transactions may not be satisfied; the expected timing to
consummate the proposed transactions; the risk that the businesses will not be integrated successfully; disruption from the transactions
making it more difficult to maintain relationships with customers, employees or suppliers; the diversion of management time and
attention on merger- related issues; general worldwide economic conditions and related uncertainties; the effect and timing of changes
in laws or in governmental regulations (including environmental); fluctuations in trading prices of securities of NEE and in the financial
results of NEE, EFH or Oncor or any of their subsidiaries; the timing and extent of changes in interest rates, commodity prices and
demand and market prices for electricity; and other factors discussed or referred to in the “Risk Factors” section of Oncor’s or NEE’s
most recent Annual Reports on Form 10-K filed with the Securities and Exchange Commission. These risks, as well as other risks
associated with the transactions, will be more fully discussed in subsequent filings with the SEC in connection with the mergers.
Additional risks and uncertainties are identified and discussed in NEE’s and Oncor’s reports filed with the SEC and available at the
SEC’s website at www.sec.gov. Each forward-looking statement speaks only as of the date of the particular statement and NEE does
not undertake any obligation to update or revise its forward-looking statements, whether as a result of new information, future events or
otherwise.

  45
46
Expected Cash Available for Distribution(1)
                                      (December 31, 2016 Run Rate CAFD)

        $750-$840        ($10-$20)       ($50-$60)
                                                         $670-$760 ($250-$270)(2)

                                                                                         ($155-$205)(3)

$ MM

                                                                                                           ($25-$30)(4)
                                                                                                                                ($3-$8)   $230-$290(5)

        Project-Level    Corporate        IDR Fees         Adjusted      Debt Service Pre-Tax Tax           Non-Cash          Maintenance Estimated
          Adjusted       Expenses                          EBITDA                       Credits              Income             Capital  Pre-Tax CAFD
          EBITDA

         (1)   See Appendix for definition of Adjusted EBITDA and CAFD expectations. Project-Level Adjusted EBITDA
               represents Adjusted EBITDA before IDR Fees and Corporate Expenses.
         (2)   Debt service includes principal and interest payments on existing and projected third party debt and
               distributions net of contributions to/from tax equity investors
         (3)   Pre-tax tax credits include investment tax credits, production tax credits earned by NEP, and production tax
               credits allocated to tax equity investors
         (4)   Primarily reflects amortization of CITC
   47    (5)   CAFD excludes proceeds from financings and changes in working capital
Expected Cash Available for Distribution(1)
(December 31, 2017 Run Rate CAFD)
$960-$1,060 ($15-$25) ($60-$70)
$875-$975 ($290-$320)(2)
($240-$280)(3)
$ MM
($30-$35)(4)
($3-$8) $310-$340(5)
Project-Level Corporate IDR Fees Adjusted Debt Service Pre-Tax Tax Non-Cash Maintenance Estimated
Adjusted Expenses EBITDA Credits Income Capital Pre-Tax CAFD
EBITDA
(1) See Appendix for definition of Adjusted EBITDA and CAFD expectations. Project-Level Adjusted EBITDA
represents Adjusted EBITDA before IDR Fees and Corporate Expenses.
(2) Debt service includes principal and interest payments on existing and projected third party debt and
distributions net of contributions to/from tax equity investors
(3) Pre-tax tax credits include investment tax credits, production tax credits earned by NEP, and production tax
credits allocated to tax equity investors
(4) Primarily reflects amortization of CITC
48 (5) CAFD excludes proceeds from financings and changes in working capitalDefinitional information NextEra Energy Partners, LP. Adjusted EBITDA and CAFD Expectations This presentation refers to adjusted EBITDA and CAFD expectations. NEP’s adjusted EBITDA expectations represent projected (a) revenue less (b) fuel expense, less (c) project operating expenses, less (d) corporate G&A, plus (e) other income less (f) other deductions including IDR fees. Projected revenue as used in the calculations of projected EBITDA represents the sum of projected (a) operating revenues plus (b) a pre-tax allocation of production tax credits, plus (c) a pre-tax allocation of investment tax credits plus (d) earnings impact from convertible investment tax credits and plus (e) the reimbursement for lost revenue received pursuant to a contract with NextEra Energy Resources. CAFD is defined as cash available for distribution and represents adjusted EBITDA less (1) a pre-tax allocation of production tax credits, less (2) a pre-tax allocation of investment tax credits, less (3) earnings impact from convertible investment tax credits, less (4) debt service, less (4) maintenance capital, less (5) income tax payments less, (6) other non-cash items included in adjusted EBITDA if any. CAFD excludes changes in working capital. NextEra Energy Partners' expectations of 12/31/16 and 12/31/17 run rate adjusted EBITDA and CAFD reflect the consummation of forecasted acquisitions. These measures have not been reconciled to GAAP net income because NextEra Energy Partners did not prepare estimates of the effect of these acquisitions on certain GAAP line items that would be necessary to provide a forward-looking estimate of GAAP net income, and the information necessary to provide such a forward-looking estimate is not available without unreasonable effort. 49
Cautionary Statement And Risk Factors That May Affect
   Future Results
This presentation contains “forward-looking statements” within the meaning of the federal securities laws. Forward-looking statements are
not statements of historical facts, but instead represent the current expectations of NextEra Energy Partners, LP (together with its
subsidiaries, NEP) regarding future operating results and other future events, many of which, by their nature, are inherently uncertain and
outside of NEP’s control. Forward-looking statements in this presentation include, among others, statements concerning cash available
for distributions expectations and future operating performance. In some cases, you can identify the forward-looking statements by words
or phrases such as “will,” “may result,” “expect,” “anticipate,” “believe,” “intend,” “plan,” “seek,” “aim,” “potential,” “projection,” “forecast,”
“predict,” “goals,” “target,” “outlook,” “should,” “would” or similar words or expressions. You should not place undue reliance on these
forward-looking statements, which are not a guarantee of future performance. The future results of NEP and its business and financial
condition are subject to risks and uncertainties that could cause NEP’s actual results to differ materially from those expressed or implied
in the forward-looking statements, or may require it to limit or eliminate certain operations. These risks and uncertainties include, but are
not limited to, the following: NEP has a limited operating history and its projects include renewable energy projects that have a limited
operating history. Such projects may not perform as expected; NEP's ability to make cash distributions to its unitholders is affected by
wind and solar conditions at its renewable energy projects; NEP's business, financial condition, results of operations and prospects can
be materially adversely affected by weather conditions, including, but not limited to, the impact of severe weather; NEP may fail to realize
expected profitability or growth, and may incur unanticipated liabilities, as a result of the acquisition of NET Holdings Management, LLC
(the Texas pipeline business); NEP is pursuing the expansion of natural gas pipelines in its portfolio that will require up-front capital
expenditures and expose NEP to project development risks; NEP's ability to maximize the productivity of the Texas pipeline business and
to complete potential pipeline expansion projects is dependent on the continued availability of natural gas production in the Texas
pipelines’ areas of operation; Operation and maintenance of renewable energy projects involve significant risks that could result in
unplanned power outages, reduced output, personal injury or loss of life; Portions of NEP’s pipeline systems have been in service for
several decades. There could be unknown events or conditions or increased maintenance or repair expenses and downtime associated
with NEP's pipelines that could have a material adverse effect on NEP's business, financial condition, results of operations, liquidity and
ability to make distributions; Natural gas gathering and transmission activities involve numerous risks that may result in accidents or
otherwise affect the Texas pipelines’ operations; The wind turbines at some of NEP's projects and some of NextEra Energy Resources
LLC's (NEER) right of first offer (ROFO) projects are not generating the amount of energy estimated by their manufacturers’ original
power curves, and the manufacturers may not be able to restore energy capacity at the affected turbines; NEP depends on the Texas
pipelines and certain of the renewable energy projects in its portfolio for a substantial portion of its anticipated cash flows; Terrorist or
similar attacks could impact NEP's projects, pipelines or surrounding areas and adversely affect its business; The ability of NEP to obtain
insurance and the terms of any available insurance coverage could be materially adversely affected by international, national, state or
local events and company-specific events, as well as the financial condition of insurers. NEP's insurance coverage does not insure
against all potential risks and it may become subject to higher insurance premiums; Warranties provided by the suppliers of equipment for
NEP's projects may be limited by the ability of a supplier to satisfy its warranty obligations, or by the terms of the warranty, so the
warranties may be insufficient to compensate NEP for its losses; Supplier concentration at certain of NEP's projects may expose it to
significant credit or performance risks; NEP relies on interconnection and transmission facilities of third parties to deliver energy from its
renewable energy projects and, if these facilities become unavailable, NEP's wind and solar projects may not be able to operate or deliver
energy; If third-party pipelines and other facilities interconnected to the Texas pipelines become partially or fully unavailable to transport
natural gas, NEP's revenues and cash available for distribution to unitholders could be adversely affected;

    50
Cautionary Statement And Risk Factors That May Affect
Future Results (cont.)
NEP's business is subject to liabilities and operating restrictions arising from environmental, health and safety laws and regulations;
Natural gas operations are subject to numerous environmental laws and regulations, compliance with which may require significant
capital expenditures, increase NEP's cost of operations and affect or limit its business plans, or expose NEP to liabilities; NEP's
renewable energy projects may be adversely affected by legislative changes or a failure to comply with applicable energy regulations; A
change in the jurisdictional characterization of some of the Texas pipeline entities' assets, or a change in law or regulatory policy, could
result in increased regulation of these assets, which could have a material adverse effect on NEP's business, financial condition, results
of operations and ability to make cash distributions to its unitholders; NEP may incur significant costs and liabilities as a result of pipeline
integrity management program testing and any necessary pipeline repair or preventative or remedial measures; The Texas pipelines’
operations could incur significant costs if the Pipeline and Hazardous Materials Safety Administration or the Railroad Commission of
Texas adopts more stringent regulations; Petróleos Mexicanos (Pemex) may claim certain immunities under the Foreign Sovereign
Immunities Act and Mexican law, and the Texas pipeline entities' ability to sue or recover from Pemex for breach of contract may be
limited and may be exacerbated if there is a deterioration in the economic relationship between the U.S. and Mexico; NEP's partnership
agreement restricts the voting rights of unitholders owning 20% or more of its common units, and under certain circumstances this could
be reduced to 10%; NEP does not own all of the land on which the projects in its portfolio are located and its use and enjoyment of the
property may be adversely affected to the extent that there are any lienholders or leaseholders that have rights that are superior to NEP's
rights or the U.S. Bureau of Land Management suspends its federal rights-of-way grants; NEP is subject to risks associated with litigation
or administrative proceedings that could materially impact its operations, including, but not limited to, proceedings related to projects it
acquires in the future; NEP's wind projects located in Canada are subject to Canadian domestic content requirements under their Feed-
In-Tariff contracts; NEP's cross-border operations require NEP to comply with anti-corruption laws and regulations of the U.S. government
and non-U.S. jurisdictions; NEP is subject to risks associated with its ownership or acquisition of projects or pipelines that remain under
construction, which could result in its inability to complete construction projects on time or at all, and make projects too expensive to
complete or cause the return on an investment to be less than expected; NEP relies on a limited number of customers and is exposed to
the risk that they are unwilling or unable to fulfill their contractual obligations to NEP or that they otherwise terminate their agreements
with NEP; NEP may not be able to extend, renew or replace expiring or terminated power purchase agreements (PPAs) at favorable rates
or on a long-term basis; NEP may be unable to secure renewals of long-term natural gas transportation agreements, which could expose
its revenues to increased volatility; If the energy production by or availability of NEP's U.S. renewable energy projects is less than
expected, they may not be able to satisfy minimum production or availability obligations under NEP’s U.S. Project Entities’ PPAs; NEP's
growth strategy depends on locating and acquiring interests in additional projects consistent with its business strategy at favorable prices;
NextEra Energy Operating Partners, LP’s (NEP OpCo’s) partnership agreement requires that it distribute its available cash, which could
limit NEP’s ability to grow and make acquisitions; NEP's ability to consummate future acquisitions will depend on NEP's ability to finance
those acquisitions; Lower prices for other fuel sources may reduce the demand for wind and solar energy; Reductions in demand for
natural gas in the United States or Mexico and low market prices of natural gas could materially adversely affect the Texas pipelines’
operations and cash flows; Government laws, regulations and policies providing incentives and subsidies for clean energy could be
changed, reduced or eliminated at any time and such changes may negatively impact NEP's growth strategy; NEP's growth strategy
depends on the acquisition of projects developed by NextEra Energy, Inc. (NEE) and third parties, which face risks related to project
siting, financing, construction, permitting, the environment, governmental approvals and the negotiation of project development
agreements; Acquisitions of existing clean energy projects involve numerous risks; Renewable energy procurement is subject to U.S.
state and Canadian provincial regulations, with relatively irregular, infrequent and often competitive procurement windows;
51Cautionary Statement And Risk Factors That May Affect
Future Results (cont.)
NEP may continue to acquire other sources of clean energy, including, but not limited to, natural gas and nuclear projects, and may
expand to include other types of assets including, but not limited to, transmission projects, and any further acquisition of non-renewable
energy projects, including, but not limited to, transmission projects, may present unforeseen challenges and result in a competitive
disadvantage relative to NEP's more-established competitors; NEP faces substantial competition primarily from regulated utilities,
developers, independent power producers, pension funds and private equity funds for opportunities in North America; The natural gas
pipeline industry is highly competitive, and increased competitive pressure could adversely affect NEP's business; NEP may not be able
to access sources of capital on commercially reasonable terms, which would have a material adverse effect on its ability to consummate
future acquisitions; Restrictions in NEP OpCo's subsidiaries' revolving credit facility and term loan agreements could adversely affect
NEP's business, financial condition, results of operations and ability to make cash distributions to its unitholders; NEP's cash distributions
to its unitholders may be reduced as a result of restrictions on NEP's subsidiaries’ cash distributions to NEP under the terms of their
indebtedness; NEP's subsidiaries’ substantial amount of indebtedness may adversely affect NEP's ability to operate its business, and its
failure to comply with the terms of its subsidiaries' indebtedness could have a material adverse effect on NEP's financial condition;
Currency exchange rate fluctuations may affect NEP's operations; NEP is exposed to risks inherent in its use of interest rate swaps; NEE
exercises substantial influence over NEP and NEP is highly dependent on NEE and its affiliates; NEP is highly dependent on credit
support from NEE and its affiliates. NEP's subsidiaries may default under contracts or become subject to cash sweeps if credit support is
terminated, if NEE or its affiliates fail to honor their obligations under credit support arrangements, or if NEE or another credit support
provider ceases to satisfy creditworthiness requirements, and NEP will be required in certain circumstances to reimburse NEE for draws
that are made on credit support; NEER or one of its affiliates is permitted to borrow funds received by NEP's subsidiaries, including, but
not limited to, NEP OpCo, as partial consideration for its obligation to provide credit support to NEP, and NEER will use these funds for its
own account without paying additional consideration to NEP and is obligated to return these funds only as needed to cover project costs
and distributions or as demanded by NEP OpCo. NEP's financial condition and ability to make distributions to its unitholders, as well as its
ability to grow distributions in the future, is highly dependent on NEER’s performance of its obligations to return all or a portion of these
funds; NEP may not be able to consummate future acquisitions from NEER or from third parties; NEP GP and its affiliates, including, but
not limited to, NEE, have conflicts of interest with NEP and limited duties to NEP and its unitholders, and they may favor their own
interests to the detriment of NEP and holders of NEP common units; Common units are subject to NEP GP’s limited call right; NEE and
other affiliates of NEP GP are not restricted in their ability to compete with NEP; NEP may be unable to terminate the Management
Services Agreement among NEP, NextEra Energy Management Partners, LP (NEE Management), NEP OpCo and NextEra Energy
Operating Partners GP, LLC (NEP OpCo GP) (MSA); If NEE Management terminates the MSA, NEER terminates the management sub-
contract or either of them defaults in the performance of its obligations thereunder, NEP may be unable to contract with a substitute
service provider on similar terms, or at all; NEP's arrangements with NEE limit NEE’s liability, and NEP has agreed to indemnify NEE
against claims that it may face in connection with such arrangements, which may lead NEE to assume greater risks when making
decisions relating to NEP than it otherwise would if acting solely for its own account; The credit and business risk profiles of NEP GP and
its owner, NEE, could adversely affect any NEP credit ratings and risk profile, which could increase NEP's borrowing costs or hinder
NEP's ability to raise capital; NEP's ability to make distributions to its unitholders depends on the ability of NEP OpCo to make cash
distributions to its limited partners; If NEP incurs material tax liabilities, NEP's distributions to its unitholders may be reduced, without any
corresponding reduction in the amount of the incentive distribution rights (IDR) fee; Holders of NEP's common units have limited voting
rights and are not entitled to elect NEP's general partner or NEP GP’s directors; NEP's partnership agreement restricts the remedies
52You can also read


