PLATINUM The Impact of South Africa's energy crisis on PGM mine supply - Dr David Davis - Gold Stackers
←
→
Page content transcription
If your browser does not render page correctly, please read the page content below
PLATINUM

   The Impact of South Africa’s energy crisis
            on PGM mine supply

                   Research by:
                  Dr David Davis
PhD. MSc. MBL. CEng. CChem. FIMMM. FSAIMM. FRIC.

                   August 2021
INDEX
    Introduction                                                                        3-4

    Setting The PGM Scene                                                               5
    South African PGM Supply Risk                                                       6-7
    Setting The Energy Crisis Scene                                                     8-9
    Eskom                                                                               10 - 12
    The Roots of Eskom’s Demise                                                         13 - 16
    Load Shedding: The Looming Energy Gap                                               17 - 18
    The Relationship Between EAF and Coal-Fired Plants                                  19
    The Relationship Between EAF and Load Shedding                                      20 - 21
    Coal Generation Comparison at A Glance                                              22 - 24
    Fixing The Energy Gap at A Glance IRP2019                                           25 - 28
    The Power Ship Saga                                                                 29
    IRP2019: Some Risk Considerations                                                   30
    Will Pivotal Key Factors Be Met?                                                    30 - 31
    Summary of Load Shedding Stages by 2025                                             32 - 33
    Eskom Supply To The PGM Mining Industry                                             34
    The Frequency and Level of Load Shedding Stages                                     35
    The Impact of Increasing Load Shedding Stages at Higher Frequencies on PGM Supply   36 - 40
    Reducing The Impact of Load Shedding In The PGM Industry                            41 - 42

    About Dr David Davis PhD. MSc. MBL. CEng. CChem. FIMMM. FSAIMM. FRIC.               43
    Important Notice - General Disclosures, Disclaimers and Warnings                    44

2
INTRODUCTION

                          This review provides an insight into the “potential” impact of a diminishing and intermittent electricity
                          supply from South Africa’s power utility (Eskom) on the future of South African Platinum Group Metal
                          (PGM) mine supply.

                          Since 2007, South Africa has faced ongoing periods of widespread rolling blackouts (load shedding)
                          as supply continues to fall behind demand, threatening to destabilise the national grid. The situation,
                          some 14 years later, has reached “crisis level”.

                          In the worst-case scenario, the effect of this “energy crisis” is likely to be “overwhelming” and will
                          undoubtedly have a “crippling” effect on South Africa’s economy. Manufacturing, agricultural,
                          industrial, mining, transport and domestic users will not go untouched if the electricity supply shortage
                          is not urgently addressed and reversed by replacement and additional new capacity from coal, gas,
WWW.GOLDSTACKERS.COM.AU

                          wind, storage and solar.

                          The government and Eskom do not have a good record of completing projects on time and therefore
                          there is a high probability that the new-build of electricity capacity will be late, thereby exacerbating
                          the energy crisis.
The objective of this review is to provide evidence and timing                of Eskom. In this regard, I have used a number of graphics
to support this scenario. The outcome will determine the                      to illustrate the conversation.
degree and level of load shedding and its impact on PGM
supply from South Africa.                                                     My research indicates that it is most likely that the energy
                                                                              gap will widen significantly over the next 5 years, caused
It is important to recognise that load shedding is a controlled               mainly by a low energy availability factor (EAF) of the coal-
way and legal requirement to make sure that the national                      fired plants, a “slippage” in the new build programme (3 to
grid remains stable in the case of major incidents. Load                      4 years) and capital constraints. This, together with political
shedding is done to avoid a total countrywide blackout.                       interference and vacillation with respect to the recovery
There are 8 stages of load shedding. Eskom decides on the                     plan, will likely cause a rise in PGM supply losses. In this
load shedding stage depending on the number of megawatts                      regard, the PGM supply from South Africa will probably
(MW) required to be saved to balance the grid.                                start to decline within the next 2 to 3 years when higher
                                                                              levels and frequency of load shedding persist, including
For the investor in precious metals, the degree and level of                  Stage 6 and above ceteris paribus. (Noting, Stage 6 and
load shedding and the impact on PGM supply from South                         higher would cause mine operations to cease).
Africa will likely support the price of PGMs. The PGM industry
can cope with load shedding Stages 1, 2, 3 and 4, albeit at
Stage 4, and at higher frequencies, throughput may have to
be adjusted downwards. At Stage 6 and above operations
would cease.

I am of the view that it is “imperative” for investors to gain an
understanding of those factors that have led to the demise
of Eskom, which in turn, has led to a decline in electricity
supply (negative electricity supply gap) and will, in my view,
continue to do so. Much of this review describes the demise

                                             Platinum - The Impact of South Africa’s energy crisis on PGM mine supply   WWW.GOLDSTACKERS.COM.AU   4
Setting The PGM Scene

Demand for PGMs is all about climate change and the drive for net zero emissions by 2050.

In this regard, the auto industry has introduced new types of drivetrains for vehicles, with
a move from ICE to BEVs, HEVs and FCEVs to meet new emission standards. These new
standards mean higher autocatalyst PGM loadings. The new emission standards also
mean accelerated demand for FCEVs that contain platinum (mainly heavy-duty vehicles).
Furthermore, PEMs’ electrolysers, which also contain platinum, are currently seen as the
most cost-efficient way to produce green hydrogen from renewable power as they are
able to withstand the intermittency of renewable generation.

The progressive tightening of environmental regulations and technology innovation
surrounding the production of green hydrogen has led to an increase in PGM demand. My
calculations imply that global PGM demand will likely grow at a rate of around 3.5% CAGR
(2027). In this regard, my estimates are not too dissimilar from GlobalData’s estimates.
Global PGM mine supply will most likely remain roughly constant with an average PGM
of c.13moz, with a recognisable downward trend starting around 2031. Under these
circumstances, I am of the view that PGM demand will increasingly outstrip PGM supply.

This scenario is already playing out. The market balance for palladium has been in deficit
for at least nine years, rhodium has been in deficit over the past two years ( JM). In both
cases, the supply imbalance has been the main driver of the sky-rocketing price of these
metals. Platinum has a positive outlook due mainly to substitution in petrol autocatalysts
and an increase in catalyst loadings together with a global decline in platinum supply.
I expect platinum to move into deficit in 2022.

                                           Platinum - The Impact of South Africa’s energy crisis on PGM mine supply   WWW.GOLDSTACKERS.COM.AU   5
South African PGM Supply Risk

The continuity of South African PGM supply is not secure. The South African PGM mining industry has faced numerous
challenges in the past caused mainly by the combined effects of electricity shortages (load shedding), prolonged industrial
action, political upheaval, increasing costs and a significant reduction in capital expenditure. The PGM mining industry has
been starved of expansion and ore reserve replacement capital for a number of years.

South Africa has experienced 14 years (from 2007) of intermittent load shedding stages between 2 and 6. Currently, Eskom
is implementing load shedding. Furthermore, Eskom has recently warned that it expects load shedding (Stage 4) to increase
towards the end of 2021, as it is facing a 5GW shortfall, which is expected to continue for at least another 5 years. The higher
the load shedding stage, the more frequent load shedding becomes. In this regard, the impact on PGM production will likely
become more severe.

                                                      At this stage of the conversation, it is important to put into perspective the
                                                      potential impact of this looming “energy crisis” on some of South Africa’s
                                                      strategic mining exports such as PGMs, manganese, chrome and coal.

                                                      •    South Africa produces 72%, 36%, 82%, 81% and 87% of platinum, palladium,
                                                           rhodium, ruthenium and iridium respectively ( JM), (SFA Oxford).

                                                      •    South Africa is the number one global exporter of manganese, producing
                                                           5.2mt in 2020, some 37% more than the runner-up, Australia, at 3.3mt.
                                                           China was the fifth largest producer of manganese in 2020, recording
                                                           output of 1.3mt. It should be noted, however, that a number of manganese
                                                           mines have their own generators which supply them with electricity.

                                           Platinum - The Impact of South Africa’s energy crisis on PGM mine supply   WWW.GOLDSTACKERS.COM.AU   6
•   South Africa produced 16mt of chromium in 2020, beating                  ( JM 2019). Global platinum mine supply between 2006 and
    the rest of the world’s chromium producers by a wide                     2019 declined by c.-1.0% CAGR. South African platinum mine
    margin (58%): Kazakhstan came in at number two,                          supply declined by c.-1.4% CAGR. The gradual decline in
    producing 6.7mt of chromium.                                             the supply of platinum is mainly attributed to the historical
                                                                             evolution of the mining mix ratio of the PGM reefs in South
•   Based on the latest available data, South Africa’s coal                  Africa and to the lack of capital investment.
    exports increased in 2020. In a recent report, shipbroker
    Banchero Costa said that South Africa is the fourth largest              It is clear from the above list of strategic exports that an
    exporter of coal in the world, after Australia, Indonesia                “additional” decline in PGM supply from South Africa, due to
    and Russia.                                                              a continuous decline in power supply, will likely become more
                                                                             sensitive as PGMs are inextricably linked to climate change.
                                                                             Furthermore, the PGM market balance will inevitably move
                                                                             into a continuous and declining deficit, which will put upward
                                                                             pressure on the price, in particular the price of platinum.

                                                                             It is important to note that the relationship between a decline
                                                                             in power supply and its impact on PGM supply cannot be
                                                                             measured directly because of the complexities surrounding
                                                                             this calculation. The frequency and level of load shedding
                                                                             stages can, however, be measured. This leaves us with a
I note that global mine supply of platinum has grown by c.1.7%               series of probabilities as to the likely impact on PGM supply.
CAGR between 1990 and 2020. In 2019, global mine supply                      The frequency and level of load shedding stages are entirely
was some 6.1moz ( JM). Global platinum mine supply depends                   in the hands of Eskom.
heavily on the South African PGM mining industry, which
supplies about 72% of global platinum. Russia, North America                 This conversation therefore focuses on Eskom and its ability
and Zimbabwe supply around 12%, 6% and 7% respectively                       to achieve its new build plan.

                                            Platinum - The Impact of South Africa’s energy crisis on PGM mine supply   WWW.GOLDSTACKERS.COM.AU   7
Setting The Energy Crisis Scene

This section sets the scene as the energy crisis unfolds. The government has set out a plan (IRP2019) designed to neutralise
the electricity supply gap by reducing the existing dependence on fossil fuels to a mix of renewable energy sources. In this
regard, apart from the availability of capital, there are two pivotal key factors that will drive the successful accomplishment
of this exercise. These are: the energy availability factor (EAF) of the coal-fired plants must increase from 67% to 75.5% and
above by 2024, and the new plan must be executed between 2021 and 2030. If one or both of these pivotal key factors are
not achieved the plan will fail, and Eskom will be forced to increase the frequency of load shedding until the energy gap is
neutralised.

An Integrated Resource Plan (IRP) for electricity is a rational, mechanistic, techno-economic planning process that determines
the optimal mix of generation technologies and capacities, with the least cost to the economy, necessary to meet the
projected demand for electricity in the years ahead, with defined reliability and security of supply (Eskom).

There is, however, an overarching factor which will have an impact on
the execution of this plan; many of Eskom’s coal-fired plants are old and
reaching their end of life. In this regard, five out of fifteen coal-fired power
stations are expected to be decommissioned by 2025.

The decommissioning of these power stations will remove around -3.8GW
from the grid between 2020 and 2025 and -9.1GW between 2020 and 2030.
The decline between 2020 and 2030, and on to 2050 is relatively steep.

This means that it is imperative to replace the loss in capacity timeously,
as per the new-build plan. Any slippage, as indicated above, will mean
prolonged periods of load shedding.

                                             Platinum - The Impact of South Africa’s energy crisis on PGM mine supply   WWW.GOLDSTACKERS.COM.AU   8
Energy expert Ted Blom has indicated (MyBroadband) that “he would not be surprised if between now and the end of winter
2021, we will experience Stage 6 load shedding, pretty much for certain, and even Stage 8 or above that is a possibility’’.

In a surprise move, South Africa’s President Cyril Ramaphosa announced on 10 June, that the licence-exemption cap on
self- or distributed-generation plants would be raised from 1MW to 100MW. The increase in the threshold will enable mining
companies and other entities to build power generation units of up to 100MW without applying for a licence through the
National Energy Regulator of South Africa (Nersa). This action was introduced to help address the country’s electricity crisis,
which has been weighing down economic growth and confidence for more than a decade. This move was welcomed by the
industry.

In this conversation thus far, I have alluded to the pivotal key factors which must be met in order to neutralise the energy
gap. Unfortunately, Eskom and the government do not have a good track record in meeting project deadlines. Therefore,
the energy gap is likely to widen instead of being neutralised.

The objective of this review is to provide evidence and timing to support the scenario that the two pivotal key factors will or
will not be achieved in a timely manner. The outcome will determine the degree and level of load shedding and the impact
on PGM supply from South Africa.

                                           Platinum - The Impact of South Africa’s energy crisis on PGM mine supply   WWW.GOLDSTACKERS.COM.AU   9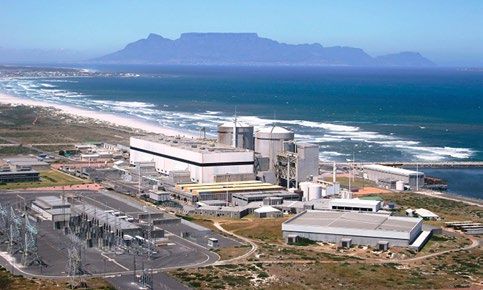
In this section of the conversation, I focus on the demise of Eskom. This subject is extremely complex
                          and, in this regard, this review draws mainly from experts in this field: Eskom, the CSIR and government
                          publications and presentations, the Minerals Council South Africa, Energy Intensive Users Group and
WWW.GOLDSTACKERS.COM.AU

                          the collective writings of energy experts and news publications. It should be noted that the Minerals
                          Council and other interested parties engage extensively with government and Eskom. This review also
                          uses a number of graphics drawn mainly from Eskom and the CSIR in order to aid the understanding
                          of the conversation and to provide evidence and timing to support the objective outlined above.
In this regard, I have also alluded to the track records of the government
Eskom projects a supply gap
and Eskom concerning the delivery of power to South Africa. The country
if not reversed by 2030
has already experienced 14 years (from 2007) of intermittent load shedding
at stages between 2 and 6. The higher the load shedding stage the more
frequent load shedding becomes.
The subject matter concerning Eskom and its future is not new. The impact
of a diminishing and intermittent electricity supply is the result of a number
of downgrading factors, which are attributed to a “cauldron” of political
ideology, political interference, state capture, mismanagement, lack of
skills, poor maintenance, unscheduled breakdowns, crime and corruption.
It should be noted that Eskom has an ageing fleet of coal-fired power stations. Historically, the EAF of these power stations
was above 80% (2000). Over the past decade, the EAF has declined to around 67% and lower, which has further constrained
power supply resulting in load shedding.
Eskom is currently struggling to meet electricity demand and has already started
load shedding. Notwithstanding, Eskom is scheduled to remove around 3.5GW
from the national grid by decommissioning five coal-fired stations, which will
have reached the end of their 50-year lifespan between 2021 and 2025. Eskom
estimates that without additional capacity, there will be an electricity supply
shortfall of around 5GW over the next four years (2025).
Plans to install alternative renewable energy to neutralise and bolster the
diminishing electrical supply “slipped” mainly because of a failure to implement
policy between 2015 and 2018, which led to a breakdown in procurement. It has
Platinum - The Impact of South Africa’s energy crisis on PGM mine supply WWW.GOLDSTACKERS.COM.AU 11taken, in all, around two years, until April 2021, of effectively doing nothing about the looming energy crisis. The government
has hastily restarted utility scale procurement processes for renewables according to the government’s upgraded IRP2019,
which sets out the transition from the existing dependence on fossil fuels to a mix of renewable electricity energy sources to
replace this widening energy gap. The IRP2019 also calls for the restructuring of Eskom into Eskom Holdings with three new
subsidiaries: Generation, Transmission and Distribution to improve the effectiveness of Eskom.
The key question in this regard:
Will the planned transition of the ageing coal-fired plants to a mix of renewable electricity energy sources be timeously
implemented? Or will there be continuous bouts of project “slippage” with Eskom having to continuously play “catch up”,
thereby having to implement higher stages of load shedding.
To cap it all, Eskom is not generating enough cash to fund its operations and service its R401bn (US$27bn) debt (Eskom
annual report 2021). So where will the money come from? Among others, a significant increase in tariffs is expected to fund,
in part, the new build programme.
As indicated, the subject matter concerning Eskom
and its future is not new. A number of well-known
leading engineering and energy experts, CEOs
of large industrial and mining organisations, the
Minerals Council South Africa, the CSIR, South African
Independent Power Producers Association (SAIPPA)
and many other associated organisations have been
raising “alarm bells” surrounding the progressive
demise of Eskom since 1994.
Currently, these “alarm bells” are at full volume!
Platinum - The Impact of South Africa’s energy crisis on PGM mine supply WWW.GOLDSTACKERS.COM.AU 12THE ROOTS OF ESKOM’S DEMISE
The objective of this section is to “set the scene” surrounding the major factors that have led to the
decline in Eskom’s electricity supply.
The roots of Eskom’s decline date back to 1994, some 27 years ago, when the ANC government took
power. The demise of Eskom has been attributed to numerous “crippling factors”, which have been
well documented and reported on. As indicated, much of these downgrading factors are attributed
WWW.GOLDSTACKERS.COM.AU
to political ideology, political interference and meddling, state capture, mismanagement, lack of
skills, poor maintenance, unscheduled breakdowns, crime and corruption. In a paper published in @
Liberty2015, the policy bulletin of the IRR, engineer and energy expert, Andrew Kenny said “that from
a well-run state organ, Eskom’s politically appointed new managers appear to have little interest in
ensuring future electricity supply.‘’Accountants replaced engineers at senior levels, and those accountants lost sight of Eskom’s fundamental purpose, which
is simply to provide electricity and cover its costs, not make a big profit or a high rate of return”.
Experts also blame Eskom for not building more power stations. Many of Eskom’s coal-fired plants are old and reaching
their end of life. It is noted that 60%, or 22.5GW, of Eskom’s nominal capacity of 37.4GW is generated by plants that are
between 35 and 59 years old.
Five of Eskom’s coal-fired power stations are expected to be decommissioned by 2025: Komati, Camden, Grootvlei, Hendrina
and Arnot, which are now 59, 54, 52, 51 and 50 years old respectively. It is noted that among others, the EAF from the coal-
fired fleet has declined from over 80% in 2000 to around 67% over the past decade, which has contributed to a continuous
decline in power supply resulting in load shedding.
Platinum - The Impact of South Africa’s energy crisis on PGM mine supply WWW.GOLDSTACKERS.COM.AU 14The relationship between the EAF and power supply will be
discussed further in the load shedding section of this review.
The graphic (CSIR) on the left illustrates the scheduled
decommissioning of the ageing coal-fired plants. It is
important to note that the shutdown of the ageing coal-fired
plants declines steeply from 2022 through to 2050, which
amounts to a coal-fired energy gap of around 30GW.
Eskom expects decommissioning of approximately 24.1GW of
coal-fired power plants in the period beyond 2030 to 2050.
As indicated, the government’s IRP2019 sets out the transition
from the existing dependence on fossil fuels to a mix of
renewable energy sources to fill this energy gap.
Eskom indicates that despite decommissioning of old power plants and preference for renewables and gas, coal remains
dominant in the energy mix for the planning period up to 2030.
It should be noted that Eskom does not have a good track record with regards to EAF, caused mainly by mismanagement,
cost constraints, the lack of skills and unscheduled breakdowns of the ageing coal-fired plants. In this regard, the projected
rate of decline of its coal-fired plants may well be “optimistic”.
The steep decline in the scheduled shutdown of ageing coal-fired plants after 2022 through to 2050 illustrates just how
precarious South Africa’s energy crisis is, affecting in particular South Africa’s PGM supply.
On this subject, Ted Blom noted that Eskom was facing what the Fossil Fuel Foundation called a ‘coal cliff’.
Platinum - The Impact of South Africa’s energy crisis on PGM mine supply WWW.GOLDSTACKERS.COM.AU 15Clearly, the degree of slippage surrounding new capacity will progressively impact PGM
supply. In this regard, Eskom and the government do not have a good track record of
completing projects on time.
For example, two mega coal-fired plants with an output of 4.8GW each were
commissioned to be built in 2007. Eskom said at that time Medupi and Kusile will be
completed by 2015 and will play an important role in solving South Africa’s energy
challenges. The construction of these plants was plagued by a multitude of delays,
spiralling costs and corruption scandals.
Current forecasts indicate that Medupi’s completion date has been extended to 2021,
with Kusile expected to be completed in 2025. It is noted that Medupi and Kusile have
been de-rated at below name-plate rating, meaning that these plants are unable
to provide the full complement of energy for their rating. It should be noted that this
energy shortage occurs despite the already-committed capacity from renewable energy
projects and the commissioning of the remaining units at Medupi and Kusile.
It is interesting to note that the government published a White Paper on energy policy in
1998, which was full of sensible suggestions, according to energy experts. This White Paper
proposed restructuring Eskom’s generation, distribution and transmission operations,
which has finally been adopted in IRP2019, some 22 years later. The White Paper also
proposed the option of renewable energy systems and opening electricity generation
to independent power producers, as well as competition for Eskom in power supply.
Politically, the notion of privatisation did not sit well with the ANC’s Marxist doctrine. In
this regard, the government banned Eskom from building new power stations. It should
be pointed out that in 1998 Eskom had surplus capacity but expected demand to outstrip
supply in 2007 if nothing was done to replace its ageing coal-fired power stations.
Platinum - The Impact of South Africa’s energy crisis on PGM mine supply WWW.GOLDSTACKERS.COM.AU 16Load Shedding: The Looming Energy Gap
Eskom is currently struggling to meet electricity demand and has started load shedding.
Notwithstanding, and as indicated, Eskom is scheduled to remove around 9.1 GW from the
national grid between 2021 and 2030. Eskom estimates that without additional capacity,
there will be an electricity supply shortfall of 5GW over the next four years (2025).
In this regard, South Africa’s power utility will be forced to increase the frequency of load
shedding in stages until the energy gap is neutralised.
The higher the load-shedding stage the more frequent load shedding becomes. For example, Stage 4 load shedding means:
load shedding 12 times over a 4-day period for 2 hours at a time, or 12 times over an 8-day period for 4 hours at a time.
Load shedding in Stage 8 will result in its customers having electricity for approximately 50% of the day.
The higher the loadshedding stage, the more frequently you will experience
loadshedding.
The higher the stage, the greater the number of customers who will be affected
across the country
Generally loadshedding in stage 8 will result in customers being on and off through
the day for a total of about 12 hours.
HOW DOES IT WORK?
1 Eskom decides on the loadshedding stage depending on the number of megawatts needed to
balance the power grid.
2 Eskom and the municipalities then implement loadshedding on a rotational basis, based on
the schedules developed.
3 Loadshedding is done for 2-4 hours depending on the schedule for your area
(+30 minutes restoration time)
Platinum - The Impact of South Africa’s energy crisis on PGM mine supply WWW.GOLDSTACKERS.COM.AU 17The graphic on the right
illustrates the load shedding
events since 2007 together with
energy shed and the estimated
economic impact. Presentation
CSIR, J Wright, and J Calitz,
January 2020 (abbreviated to
CSIR, W and C).
It is important to note that it is
assumed that load shedding
takes place for the full hours
in which it was implemented.
Practically, however, load
shedding and the stage may
occasionally change during a
particular hour. The graphic
also illustrates how complex it is to forecast load shedding. For example, in 2019, load shedding Stages 2, 3, 4, 5 and 6 were implemented,
with most load shedding falling in Stages 2 and 4. It stands to reason that the longer load shedding remains at higher stages (4 to 8) and
at higher frequencies, the greater the impact on PGM mine supply. It should be noted that the mining companies’ load shedding protocols
are somewhat different from the national protocol. The definition of stages of load shedding does not change.
Energy expert Ted Blom has indicated (MyBroadband) that he would not be surprised if between now and the end of winter we experience
Stage 6 load shedding, and even Stage 8 or above, which is a possibility. Ted Blom also indicated that based on Eskom’s own forecasts,
2021 is going to be the worst year of load shedding on record. The relationship between the load shedding stage and the impact on PGM
supply is discussed later in this review.
Platinum - The Impact of South Africa’s energy crisis on PGM mine supply WWW.GOLDSTACKERS.COM.AU 18The Relationship Between EAF and Coal-Fired Plants
The EAF from the coal-fired fleet has declined from above 80% in 2000
to around 67% over the past decade. This situation has contributed to a
continuous decline in power supply, which has an impact on increasing
load shedding. It is interesting to note that Eskom’s EAF was assumed to be
75.5% in the updated IRP2019, 2010 - 2030 plan. The graphic on the left,
illustrates the rate of decline of the EAF between 2000 and 2019. The CSIR
comments that the “historical fleet EAF decline seems irreversible... IRP2018
EAF did not materialise, risk of IRP2019 EAF not materialising is high”.
This situation is likely to be heightened as five of Eskom’s coal-fired power
stations are expected to be decommissioned by 2025.
Platinum - The Impact of South Africa’s energy crisis on PGM mine supply WWW.GOLDSTACKERS.COM.AU 19The Relationship Between EAF and Load Shedding
The graphics (CSIR, W and C) below, illustrate the relationship of the weighted average EAF of the coal fired plants and load
shedding.
The two graphics compare: IRP2019 EAF and IRP2019 planned demand forecast and the planned EAF recovery forecast, from
≈67% in 2019 to 75.5% by 2024 with an updated EAF and updated demand forecast, EAF from ≈67% in 2019 to ≈64% by 2024.
Note, these graphics are simulated. The first graphic implies a capacity shortage from the IRP2019 despite an increasing EAF
to meet the plan of 75.5% by 2024 (IRP2019). The power system is, however, less constrained, but still exhibits a dominant
Platinum - The Impact of South Africa’s energy crisis on PGM mine supply WWW.GOLDSTACKERS.COM.AU 20short-term capacity gap and small energy gap until planned new-
build capacity comes online. This graphic also implies the likelihood
of load shedding Stages 2 to 4 during 2021, and the possibility of
load shedding Stages 2 to 6 during 2022. According to the CSIR and
W and C, this scenario is unlikely to materialise.
The second graphic is an updated demand and EAF forecast from
≈67% in 2019 to ≈64% by 2024. This graphic is used for comparative
purposes against the EAF IRP2019. Essentially, the EAF used in this
graphic represents the actual average achieved in 2019, which
remains more or less constant to 2024. This scenario implies further
additional capacity and energy shortages relative to the IRP2019.
The second graphic also implies the likelihood of Stages 2 to 7 load
shedding through to 2025. The updated EAF and updated demand
forecast is the most likely scenario. This means the EAF IRP2019 will
probably not materialise (CSIR, W and C).
In summary:
Clearly, the improvement in the EAF is one of the pivotal factors
surrounding the success of IRP2019. In this regard, risk is to the
upside, which implies the likelihood of Stages 2 to 7 load shedding
through to 2025 (CSIR, W and C) and beyond.
Platinum - The Impact of South Africa’s energy crisis on PGM mine supply WWW.GOLDSTACKERS.COM.AU 21COAL GENERATION COMPARISON AT A GLANCE
Thus far, this study has focused on the complexity of forecasting load shedding and the impact of
EAF on load shedding. This section of the conversation uses Eskom’s data to illustrate the ballooning
energy gap if the new-build capacity does not come online as planned.
WWW.GOLDSTACKERS.COM.AUThe graphic on the left, illustrates a diminishing electricity supply as
Eskom’s ageing coal-fired plants are decommissioned through to 2030.
The graphic also illustrates, for comparative purposes, the equivalent
coal-fired capacity transition development plan (TDP) for 2019 and
2020, required between 2020 and 2030 to neutralise the expanding
energy gap, which reaches a deficit of around -9.1GW, if not replaced.
(Eskom TDP 20 October 2021 to 2030). As indicated, Eskom has recently
warned that it expects load shedding (Stage 4) to increase towards the
end of 2021, as it is facing shortfalls that are expected to continue for at
least another five years.
The graphic, however, implies that the energy gap is ballooning and
will likely advance much more rapidly through load shedding stages
of around 2 to 9 between 2022 and 2025 if additional capacity is not
implemented timeously. The acceleration of the energy gap shortfall has
been attributed in part to a failure to implement policy between 2015
and 2018, which led to a breakdown in procurement until April 2021.
This graphic confirms the urgency of the implementation of the TDP from the existing dependence on fossil fuels to a mix of renewable
electricity energy sources to neutralise this energy gap if not expedited rapidly. The graphic also implies that the TDP upgrade is of vital
importance and should go hand-in-hand with the alternative renewable energy and gas-coal installations.
It is important and disturbing to note that according to Eskom’s graphic, should there be any further slippage in the
installation of renewable energy sources and the completion of the transition development plan (TDP) the supply gap will
balloon to -9.1GW by 2030. This, according to Eskom, represents 10 stages of load shedding! This level would be disastrous
for South Africa and the mining industry.
Platinum - The Impact of South Africa’s energy crisis on PGM mine supply WWW.GOLDSTACKERS.COM.AU 23Eskom has numerous sub-stations and
transformers, with approximately 33,000km
of transmission lines and has a national
footprint in South Africa. Eskom indicates
that the overall transmission network
performance, has deteriorated over the past
5 years, and requires capital for replacement.
Eskom has a 10-year transmission
refurbishment plan in place based on asset
condition assessments, asset criticality and
network risks. (See graphics on the right).
Quote from Eskom’s TDP 2021 to 2030
presentation 29 October 2019:
“Existing generation fleet replacement
with both new energy (wind and solar)
and new capacity (back up gas, batteries,
etc.) is required irrespective of load
growth. Transmission expansions are
critical to create access for these new
energy sources and capacity location.
Load growth plays a significantly lower
role but is still important.”
Platinum - The Impact of South Africa’s energy crisis on PGM mine supply WWW.GOLDSTACKERS.COM.AU 24FIXING THE ENERGY GAP AT A GLANCE IRP2019 WWW.GOLDSTACKERS.COM.AU
This section focuses on the new-build plan as
                                                        laid out in the government’s IRP2019.

                                                        The Eskom graphics on the left, Illustrate the
                                                        electrical energy build-up mix of: wind, PV,
                                                        gas/fuel and storage to be achieved by 2030.
                                                        It is important to note that the electrical energy
                                                        produced by coal-fired plants reduces from
                                                        73% to 43%, while wind and PV energy increases
                                                        from 4% and 3% to 23% and 11% respectively.

                                                        Renewable energy increases from 8% to 35%
                                                        (wind and PV). The Eskom table on the left,
                                                        illustrates the timetable for the electrical build-
                                                        up mix of the new-build plan as laid out in the
                                                        government’s IRP2019.

                                                        It should be noted that this schedule has already
                                                        “slipped” by two years. This timetable colour
                                                        codes the installation sequence of the energy
                                                        mix.

                                                        According to the colour codes, the timetable
                                                        implies that the first new builds (green) should
                                                        be commissioned by 2022, which in my view,
                                                        seems “optimistic”.

Platinum - The Impact of South Africa’s energy crisis on PGM mine supply           WWW.GOLDSTACKERS.COM.AU    26
• Wind, 1.6 GW is scheduled for commissioning in 2022
• PV, 1.0 GW is scheduled for commissioning in 2022
• Storage 0.5 GW is scheduled for commissioning in 2022
• Coal, 0.75 GW is scheduled for commissioning in 2023
• Gas/Fuel,1.0 GW is scheduled for commissioning in 2023
According to the IRP2019, by 2025 the additional wind, PV,
storage, coal and gas/fuel should add 6.4GW, 3GW, 0.5GW,
1.5GW, and 0.75GW respectively: In all amounting to an
additional 12.2GW to the grid (cumulative).
Procurement of some of the major installations are only 6.7GW coupled with a low EAF (67% to 64%) implies that
now being implemented. Under these circumstances, it’s by 2025 the energy gap will likely widen to approximately
not unreasonable to assume at least a 3 to 4 slippage (from 9GW to 10GW. This quantum will equate to load shedding of
2021) in this plan ceteris paribus. A 3 to 4 year (2024 to 2025) around Stage 9 and above.
slippage in the new build programme will mean that new-
build capacity of 77.7GW will not likely be met by 2030, from Roger Baxter, CEO, Minerals Council of South Africa, in a
52.6GW in 2019. speech to EE Business Intelligence said: “Our view is that
in the short term and medium term, given the fact that we
A slippage of three years from IRP2019 commissioning date of are going to see such a significant phase-out of the older
the new build programme would likely result in a new-build generation power stations, and given the fact that we are
production level of around 5.5GW, instead of the expected going to need to bring on a lot more capacity, our perspective
IRP2019 production level of around 12.2GW by 2025. Or a is that capacity needs to come on stream pretty quickly’’. This
45% completion rate. What does this mean? Given that the statement has been quantified in this review. It should be
decommissioning of coal-fired plants will remove around noted that this “assumed slippage” is not set in stone; the
3.5GW from the grid, a slippage delay amounting to some government has a number of alternative options to fast track
Platinum - The Impact of South Africa’s energy crisis on PGM mine supply WWW.GOLDSTACKERS.COM.AU 27Roger Baxter, CEO, Minerals Council of South Africa
the new-build programme at any time. As indicated above, the White Paper also proposed the option of renewable energy
systems and opening electricity generation to independent power producers, as well as competition for Eskom in power
supply. Delaying the decommissioning schedule of the ageing coal-fired plants would be another option. Furthermore, as
described above, the government’s recent licence exemption cap on self- or distributed-generation plants has been raised
from 1MW to 100MW to try to mitigate the energy shortfall.
Apart from the likely delays in implementing the new build programme, further delays surrounding growing opposition and
legal challenges are beginning to arise against new gas/fuel, coal and “power ship’’ installations.
Clearly, the energy plan IRP2019, does not have the slack to pick up any shortfall. In this regard, the government’s licence
exemption cap on self- or distributed-generation plants should be opened to being privatised and raised to at least
1,000MW sooner rather than later.
Platinum - The Impact of South Africa’s energy crisis on PGM mine supply WWW.GOLDSTACKERS.COM.AU 28The Power Ship Saga
Recently, the Mineral Resources and Energy Minister, Gwede
Mantashe, proposed the leasing of three Turkish-built ‘’power ships”
as part of the risk mitigation programme. Each ship is set to produce
1,220MW of power, using liquefied natural gas to alleviate SA’s power
constraints in the shortest possible time. These ships are set to be
docked across three ports: Richards Bay, Ngqura and Saldanha for a
period of 20 years at an estimated cost of R218bn (US$14.7bn).
The leasing of the power ships has been met with a raft of controversy
by experts criticising the value of the scheme and method of
procurement. Aside from environmental concerns, the ships emit
greenhouse gases and are known to endanger marine life. There
have also been allegations of corruption around the bidding process.
In the latest turn of events, the Department of Forestry, Fisheries and
the Environment has rejected the environmental impact assessments
submitted by Turkish majority held company Karpowership SA for all
three of the ports.
As an aside, Koeberg nuclear power station appears on the plan;
however, this plant will likely be shut down in 2024 in line with its 40-
year life-of-plant design. In this regard, 1,860MW will come off the
grid, worsening the power generation situation.
Platinum - The Impact of South Africa’s energy crisis on PGM mine supply WWW.GOLDSTACKERS.COM.AU 29IRP2019: Some Risk Considerations One would have expected all the nuts and bolts needed to
complete the IRP2019 would be in place before starting the
In this section, I draw attention to a few risk considerations new build plan. However, as indicated above, and among
highlighted in the IRP2019: others, there are basic risks associated with the plan that
1. Variable capacity: Renewable sources impacting point to many “ifs and buts”, which are likely to lead to failure,
system security and stability. even before the plan gets off the ground. There are many
There is an inherent risk associated with the aspects to the Eskom puzzle which do not provide much
intermittency of renewable technologies such as comfort, including the possibility that coal and gas projects
wind and PV as requirements to balance the system don’t materialise due to financing and legal challenges.
increases (energy and ancillary services).
2. Coal: There is risk of 900MW of procured coal not Will pivotal key factors be met?
materialising due to financing and legal challenges.
There is also the likelihood of future coal-to- At the beginning of this review, I indicated that the government
power capacity not being realised due to financing has set out a plan (IRP2019) designed to neutralise the
challenges. electricity supply gap by reducing the existing dependence
on fossil fuels to a mix of renewable energy sources.
3. Gas: The availability of gas in the short to medium
term is a risk as South Africa does not currently In this regard, I indicated that there are two key factors that
have gas resources. This project may also face will drive the successful accomplishment of this exercise: the
legal challenges There is also a supply and foreign i) the low EAF of the coal-fired plants must increase to 75.5%
exchange risk associated with a likely increase in and ii) the plan must be timely executed between 2021 and
gas volumes depending on the energy mix adopted 2030. If one or both factors are not achieved the plan will fail
after 2030 when a large number of coal-fired power and Eskom will be forced to increase the frequency of load
stations are decommissioned. shedding until the energy gap is neutralised.
Platinum - The Impact of South Africa’s energy crisis on PGM mine supply WWW.GOLDSTACKERS.COM.AU 30The objective of this review is to provide evidence and timing Key factor 2
to support the scenario that the two key factors will or will Plans to install alternative renewable energy to
not be achieved timeously. The outcome will determine the neutralise and bolster the diminishing electricity
degree and level of load shedding and the impact on PGM supply have “slipped” because of a failure in part to
supply from South Africa. implement policy between 2015 and 2018, which led to
a breakdown in procurement.
After analysing reports and presentations from Eskom, the
CSIR and government publications and presentations, the It has taken around two years of effectively doing
Minerals Council South Africa, Energy Intensive Users Group nothing about the looming energy crisis. I am of the
and the collective writings of energy experts and news view that further slippage of at least three to four years
publications, I am of the view that: (from 2021) will occur as procurement for the new-build
programme has only just begun. This is despite the
Key factor 1 likelihood of capital constraints and legal challenges,
According to the CSIR, W and C, the planned EAF which are also likely to hinder this programme.
IRP2019 scenario is “highly unlikely to materialise”.
In this regard, I am of the view that a slippage of this
In this regard, there is a likelihood of load shedding magnitude will complement the likelihood of higher
Stages 2 to 4. during 2021 and load shedding Stages 2 levels of load shedding, Stages 2 to 8, through to 2025
to 6 during 2022 (CSIR, W and C). and beyond.
If the EAF does not change but dips marginally from
the 2019 figure of ≈67% then, according to CSIR W and
C, this EAF forecast is “the most likely scenario”.
This scenario implies the likelihood of Stages 2 to 7
load shedding until 2025 and beyond (CSIR, W and C).
Platinum - The Impact of South Africa’s energy crisis on PGM mine supply WWW.GOLDSTACKERS.COM.AU 31Summary of load shedding stages by 2025
In this section, I have applied my view together with the collective views of experts as outlined above, and have concluded
that:
My research indicates that it is most likely the energy gap will widen significantly over the next five years, caused mainly
by the low energy availability factor (EAF) of the coal-fired plants, a “slippage” in the new build programme (three to four
years) and capital constraints. Together with political interference, meddling and vacillation with respect to the recovery
plan, this will likely cause a rise in PGM supply losses. In this regard, PGM supply from South Africa will probably start to
decline within the next two to three years if the frequency and higher stages of load shedding persist ceteris paribus. (Note,
Stage 6 and higher would stop mining operations.)
1. If EAF remains constantly low (65%): Stages 2 to 7 at least.
2. Decommissioning coal-fired plants plus three-year slippage of the new build: load shedding Stages 2 to 8 to 2025
and beyond.
Platinum - The Impact of South Africa’s energy crisis on PGM mine supply WWW.GOLDSTACKERS.COM.AU 32ESKOM SUPPLY TO THE PGM MINING INDUSTRY
Eskom supplies some 14% of its total supply to the mining industry (3,284MW) of which around 40%
(1,314MW) is to the platinum mining industry (Eskom annual report 2020).
WWW.GOLDSTACKERS.COM.AUThe graphics below illustrate the PGM mining industry’s
annual consumption in GWh/koz produced together with the
individual usage of five of the major PGM mining companies:
Sibanye-Stillwater, Amplats, Impala Northam, ARM and
RBPM are rated around 276MW, 557MW, 381MW, 91MW
and 53MW respectively. Note, there are small differences
between Eskom and annual reports. The decline in GWh/koz
over the period 1990 to 2020 implies in part that the PGM
industry has become more energy efficient over time.
Platinum - The Impact of South Africa’s energy crisis on PGM mine supply WWW.GOLDSTACKERS.COM.AU 34The Frequency and Level of Load Shedding Stages
The annual and monthly frequency and level of load shedding
stages and the power shed (GWh) are illustrated in the graphics
below (Eskom, CSIR, W and C).
The annual colour-coded stages of load shedding and frequency
from 2007 to 2020 show a general movement towards higher
stages of load shedding in combination with the load shed
(GWh). This observation is emphasized, particularly in 2015
and 2019. In 2015, 1,325GWh was shed over Stages 1, 2 and 3. In
2019, 1,352 GWh was shed over Stages 1, 2, 3, 4 and 6.
Given the conclusions above regarding the impact of EAF
and the slippage of the new build, there is a high probability
that load shedding will move up to Stage 8 with increasing
frequency from 2022 to 2025.
The monthly load shedding and frequency for 2019 is illustrated
in the graphic on the right. A number of stages of load shedding
occurred in February, March and October, the most intensive
year of load shedding to date, Stage 6 was implemented in
December 2019. The discontinuity in the level of load shedding
illustrates its disruptive nature to mining and metallurgical
processes.
Platinum - The Impact of South Africa’s energy crisis on PGM mine supply WWW.GOLDSTACKERS.COM.AU 35The impact of increasing load shedding stages at higher frequencies on PGM supply
The schematic diagram on the left, represents the process
flow (Amplats) leading to the production of PGMs, nickel,
copper and chrome. This process flow is complex. This
complexity means that the relationship between a decline
in power supply and its impact on PGM supply cannot be
measured directly. The frequency and level of load shedding
stages can, however, be measured. This leaves us with a series of
“estimated probabilities” as to the likely impact on PGM supply.
The frequency and level of load shedding stages are entirely in the
hands of Eskom.
It is important to note that the effect of load shedding should not
be exactly extrapolated to other PGM mines, as each mine has
structural and complex differences that need to be taken into
account. Much depends on the load-shedding protocol adopted to
take these differences into account.
For example, Mike Rogers, a well-respected, expert mining engineer
and independent board member of Royal Bafokeng Rasimone
Platinum mine (BRPM) said: “RB Plats’ protocol is to reduce power
by 10%, 15% and 20% for Stages 2, 3 and 4 respectively. We do this by
not hoisting rock at Styldrift (lots of storage capacity in UG silos) and
limiting crushing. Beyond that, we stop the Maseve concentrator
and the BRPM concentrator if further reductions are required. We
Platinum - The Impact of South Africa’s energy crisis on PGM mine supply WWW.GOLDSTACKERS.COM.AU 36don’t stop UG production if we can possibly help it.
“In the event of a total blackout when the shift is underground, we have a number of 12MW
diesel generators to keep the fans going and to operate either the service winder or man
hoist at Styldrift. Employees at BRPM would use the chairlifts or be faced with a long walk
up the decline shafts”.
“We are fortunate that we don’t require refrigeration as the deep level mines do. (Sibanye-
Stillwater and Northam)”.
“I would believe that the deeper gold and platinum mines with sub shafts and requiring
refrigeration would have standby generating capacity for emergencies and certainly not
for operating compressors. As for Stage 4 and higher, I don’t think there would be much
production”.
A loss in production from underground would directly impact PGM supply. Power to the
smelters would have to be reduced as a consequence of Stage 4 and above, but this would
not be counted as a loss in production. It should also be recognised that the disruption
caused in the mining and metallurgical process takes time to get back to “normality”.
After canvasing some of the larger platinum mines there was general agreement that load
shedding at Stage 6 and above would mean that the miners would not go underground.
The loss in PGMs mined would depend on the frequency of Stage 6 load shedding. Stage
8 load shedding would result in a 50% loss of power supply. It should be noted that South
Africa experienced Stage 6 load shedding for about 7 hours on 6 December 2019 together
with Stages 1, 2, 3 and 4.
Platinum - The Impact of South Africa’s energy crisis on PGM mine supply WWW.GOLDSTACKERS.COM.AU 37In the conversation thus far, I have indicated that there is a high probability that the
stages of load shedding will likely move up towards Stage 8. In this regard, I have
attempted to illustrate these events in the schematic on the left (example only).
The schematic shows that load shedding Stages 2, 3 and 4 will likely fall away over
time, while at the same time load shedding Stages 5, 6, 7 and 8 will increase. This
is given the fact that the EAF will remain low and there is a three-year slippage on
the new build.
As I have indicated, the relationship between a decline in power supply and its
impact on PGM supply cannot be measured directly because of the complexities
surrounding this calculation. The frequency and level of load shedding stages can,
however, be measured. This leaves us with a series of “estimated probabilities” of
the likely impact of a decline in power supply on PGM supply.
Anglo American Platinum reported that it had lost 38,000oz of PGMs due to load
shedding during 2019, costing the company more than R742m (US$50.2m) in lost
production that cannot be recovered.
It is of note that this loss occurred during February, March, October and December,
which in total amounted to some 22 days (2019), with a major loss occurring in
December (Q4) of 20,000oz over seven consecutive days, which included Stages
3, 4 and 6. Unfortunately, no other companies reported a loss in this manner. In
this regard, my calculations are based on one incident with a “health warning”
and should be viewed as such. It is, however, important to note that this incident
included load shedding Stage 6, which likely reflects, to some extent, the future
scenarios.
Platinum - The Impact of South Africa’s energy crisis on PGM mine supply WWW.GOLDSTACKERS.COM.AU 38This loss in PGM supply may not initially be considered significant
in terms of global PGM mine supply of around 13.9moz and a
South African PGM mine supply of around 9.6moz. This statement
may have been insignificant in 2019 but going forward it is likely
to become significant due mainly to the energy crisis, especially
if Stages 6, 7 and 8 become a regular feature from 2022 to 2025
at least.
So, what have we got by way of information to work with? The
graphic on the left illustrates the yearly and December 2019
month of load shedding stages, the duration of load shedding for
December, and the duration of outages. As I concluded above,
I am of the view that the duration of outages will increase as
the ageing power stations are decommissioned, the renewable
energy replacement will likely have slipped by at least three years
and the EAF will remain problematic, resulting in constrained
power supply and as a consequence higher stages of load
shedding.
The following conversation focuses on a series of “estimated
probabilities” of load shedding, which are likely to impact PGM
supply.
The tables on the right show an “estimated” matrix of PGM losses
from the South African PGM industry as a result of the number of
days of load shedding over the year, together with the multiples
Platinum - The Impact of South Africa’s energy crisis on PGM mine supply WWW.GOLDSTACKERS.COM.AU 39of intensity as experienced in 2019.
In my view, the blue shaded area represents the most likely area
of the quantum PGM supply loss as the energy gap widens. This
would move the estimated PGM loss to the right-hand side of
the tables.
This “estimate” was also used to calculate the expected quantum
loss of platinum, palladium and rhodium.
It should be noted that the “estimated” matrix only touches on
load shedding Stage 6. Mining operations would cease at Stage
6 and above. Under these circumstances, these PGM estimates
could be on the low side and could very well double.
In summary:
My research presents an “estimated” matrix of PGM loss in supply from the South African PGM industry between the number
of days of load shedding over the year, together with the multiples of intensity. The impact of these variables cannot be
measured directly because of the complexities surrounding this calculation. The “estimated” matrix covers load shedding
Stages 1, 2, 3 and 4, and only touches on load shedding Stage 6. Mining operations would cease at Stage 6 and above.
Platinum - The Impact of South Africa’s energy crisis on PGM mine supply WWW.GOLDSTACKERS.COM.AU 40REDUCING THE IMPACT OF LOAD SHEDDING IN
THE PGM INDUSTRY
As indicated in the introduction, on 10 June, 2021 South Africa’s President Cyril Ramaphosa announced
that the licence-exemption cap on self- or distributed-generation plants would be raised from 1MW to
100MW. The increase in the threshold will enable mining companies and other entities to build power
generation units of up to 100MW without applying for a licence through the National Energy Regulator
of South Africa (Nersa). This move was welcomed by the mining industry.
WWW.GOLDSTACKERS.COM.AU
In this regard, Sibanye-Stillwater is preparing feasibility studies for prospective 50MW and 85MW
solar PV projects for its Rustenburg and Marikana operations respectively. Anglo American Platinum is
looking at building a 75MW to 100MW solar PV plant to support its Mogalakwena mine and concentrator,
while Northam Platinum will likely install modules of 10MW. Notwithstanding, the move to privatising
supply will likely encounter regulatory bumps along the way.The graphic above illustrates the capacity in MW attributed to Sibanye-Stillwater, Anglo American Platinum and Northam
compared to the allowance of 100MW. It is important to note that the exemption is applied not only to the company, but also
to the entities and projects within the company for example, Sibanye-Stillwater can install 50MW and 85MW solar PV projects
at its Rustenburg and Marikana operations respectively. Similarly, Anglo American Platinum, apart from Mogalakwena
mine, the company can install a solar PV plant at its Amandelbult mine etc.
According to Gold Fields CEO Chris Griffith, the solar PV plant it is currently building will generate more than 20% of the
mines’ electricity and will save Gold Fields R120m (US$8.1m) a year in power costs. The introduction of solar PV energy will
reduce operating costs, which currently make up about 13% of Gold Fields’ operating costs.
The introduction of a renewable energy source brings an additional advantage as this will reduce the carbon footprint of
the mines, thereby reducing carbon tax payments.
Platinum - The Impact of South Africa’s energy crisis on PGM mine supply WWW.GOLDSTACKERS.COM.AU 42About Dr David Davis PhD. MSc. MBL. CEng. CChem. FIMMM. FSAIMM. FRIC. David has been associated with the South African mining industry and mining investment industry for the past 43 years (mainly PGM, gold and uranium). At present, David is working as an independent precious metal consultant. David’s PhD involved: “Studies in the catalytic reduction and decomposition of nitric oxide 1976”.
Important Notice
General Disclosures, Disclaimers and Warnings
This Report (“the report”) in respect of the global PGM Industry is directed at          contained in the Report as part of their own due diligence. The value of
and is being issued on a strictly private and confidential basis to, and only            securities and the income from them may fluctuate. It should be remembered
to, Professional Clients and Eligible Counterparties (“Relevant Persons”) as             that past performance is not necessarily a guide to future performance.
defined under the Investment Research Regulatory Rules and is not directed
at Retail Clients. This report must not be acted on or relied on by persons              Dr David Davis has produced this report independently of the companies
who are not Relevant Persons. Any investment or investment activity to which             that may be named in this report except for verification of factual elements.
this Report relates is available only to Relevant Persons and will be engaged            Any opinions, forecasts, projections, or estimates or other forward-looking
in only with Relevant Persons.                                                           information or any expectations in this Report constitute the independent
                                                                                         judgement or view of Dr David Davis who has produced this report
The Report does not constitute or form part of any invitation or offer for sale          (independent of any company discussed or mentioned in the Report or any
or subscription or any solicitation for any offer to buy or subscribe for any            member of its group).
securities in any Company discussed nor shall it or any part of it form the
basis of or be relied upon in connection with any contract or commitment                 The Report is being supplied to you for your own information and may not be
whatsoever.                                                                              reproduced, further distributed to any other person or published, in whole or
                                                                                         in part, for any purpose whatsoever, including (but not limited to) the press
The opinions, estimates (and where included) projections, forecasts and                  and the media. The distribution of the Report in certain jurisdictions may be
expectations in this report are entirely those of Dr David Davis as at the               restricted by law and therefore any person into whose possession it comes
time of the publication of this report, and are given as part of his normal              should inform themselves about and observe any such restriction.
research activity, and should not be relied upon as having been authorised
or approved by any other person, and are subject to change without notice.               The Report has been prepared with all reasonable care and is not knowingly
There can be no assurance that future results or events will be consistent               misleading in whole or in part. The information herein is obtained from
with such opinions, estimates (where included) projections, forecasts and                sources that Dr David Davis considers to be reliable but its accuracy and
expectations. No reliance may be placed for any purpose whatsoever on                    completeness cannot be guaranteed.
the information or opinions contained in this Report or on its completeness
and no liability whatsoever is accepted for any loss howsoever arising from
any use of this Report or its contents or otherwise in connection therewith.             Dr David Davis Certification
Accordingly, neither Dr David Davis nor any person connected to him, nor                 Dr David Davis attests that the views expressed in this report accurately
any of his respective Consultants make any representations or warranty in                reflect his personal views about the global Platinum Industry. Dr David Davis
respect of the contents of the Report. Prospective investors are encouraged              does not hold any interest or trading positions in any of the Companies
to obtain separate and independent verification of information and opinions              mentioned in the report.

                                                       Platinum - The Impact of South Africa’s energy crisis on PGM mine supply           WWW.GOLDSTACKERS.COM.AU        44
You can also read