Presentation to: Portfolio Committee on Energy, Portfolio Committee on Public Enterprises and Select Committee on Economic and Business ...
←
→
Page content transcription
If your browser does not render page correctly, please read the page content below
Presentation to:
Portfolio Committee on Energy,
Portfolio Committee on Public Enterprises and
Select Committee on Economic and Business
Development

29 July 2014

Contents

Content

 1. Eskom overview

 2. Sustainability of the Energy Sector
    and Eskom

 3. Generation sustainability strategy

 4. New build programme update

 5. IPP programme

 6. International agreements

 7. Gas future

 8. Municipal debt

                                          2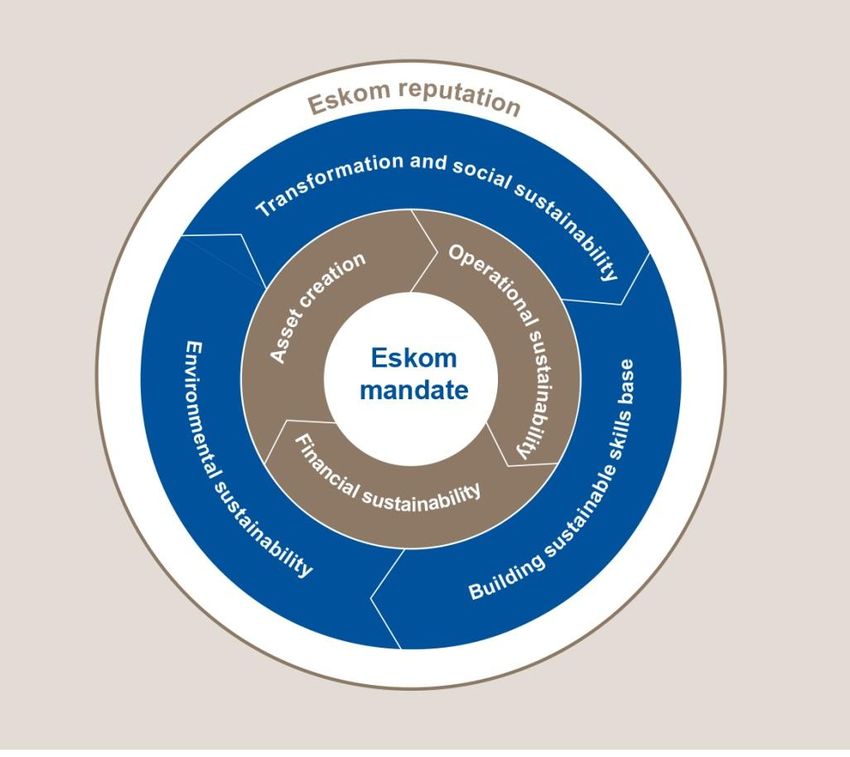
Eskom Overview

                                                      Number of electrification connections
•    Strategic 100% state-owned electricity
     utility, strongly supported by the government
                                                       Number
                                                                                                    201,788
•    Supplies approximately 95% of South Africa‟s
     electricity                                           154,250
                                                                              139,881

•    Performed 201 788 household electrification
     connections during the year, the highest in a
     single year since 2002
                                                           Jan-00             Jan-00                Jan-00
•    As at 31 March 2014:
     – 5.2 million customers (2013: 5.0 million)
                                                      Generation capacity – 31 March 2014
     – Net maximum generating capacity of 42.0GW
        (2013: 41.9GW)                                    Hydro
     – 17.4GW of new generation capacity being
        built, of which 6.1GW already commissioned        Pumped storage
     – Approximately 359 337km of cables and                                                             Coal
        power lines                                                    1.4%
                                                                       3.4%
     – 46 919 employees, inclusive of fixed-term                      4.4%      42.0GW
                                                                                            85.1%
        contractors, in the group (2013: 47 295)                      5.7%
                                                                               of nominal
                                                                                capacity

•    Moody‟s and S&P stand-alone credit ratings: b1       Nuclear

     and b- respectively with a negative outlook
                                                          Gas
Eskom‟s seven sustainability dimensions

 The changing environment requires a response that will ensure sustainability

                                                          Eskom’s mandate is
                                                          comprehensive, focused on many
                                                          dimensions of sustainability
                                                          • Core areas revolve around the
                                                            tension of asset
                                                            creation, operational
                                                            sustainability, and financial
                                                            sustainability
                                                          • Beyond that, Eskom also needs
                                                            to ensure a positive wider
                                                            impact on the
                                                            environment, contribution to
                                                            strategic transformation and social
                                                            sustainability objectives as well as
                                                            the contribution to a sustainable
                                                            skills base

 Safety will continue to be the foundation for all our operations and is key to Eskom’s
                             performance and sustainability
                                                                                         4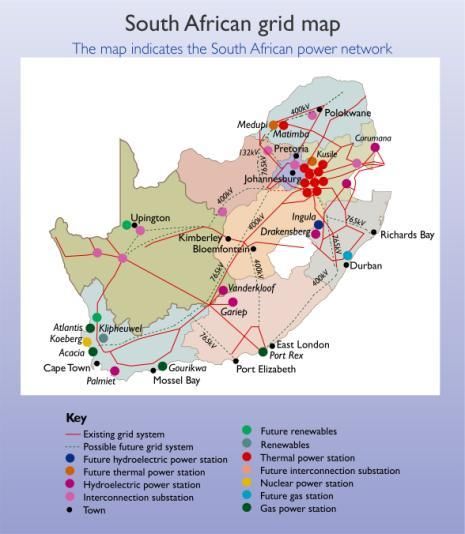
Eskom‟s footprint

                    5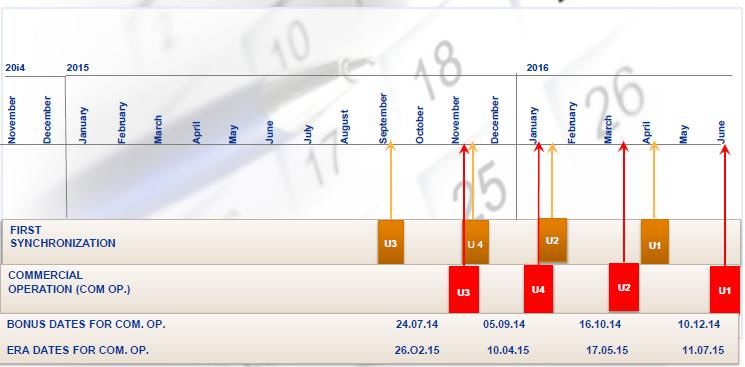
Eskom‟s energy mix

        Type                                            Number of stations   Nominal capacity (MW)

          Coal fired                                            13                  35 650

          Gas/liquid fuel turbine                                4                   2 409

          Hydroelectric                                          6                   600

          Pumped storage                                         2                   1 400

          Nuclear                                                1                   1 860

          Wind energy                                            1                    3

        TOTAL                                                   27                  41 919

“Driving world class generation performance, with Zero Harm”
Eskom‟s coal-fired power stations

    Station           Location                   Nominal capacity (MW)

      Arnot             Middelburg, Mpumalanga           2 232
     Camden             Ermelo                           1 480
      Duvha             Witbank                          3 450
     Grootvlei          Balfour                          1 090
     Hendrina           Mpumalanga                       1 865
     Kendal             Witbank                          3 840
      Komati            Middelburg, Mpumalanga            791
      Kriel             Bethal                           2 850
     Lethabo            Viljoensdrift                    3 558
      Majuba            Volksrust                        3 843

     Matimba            Lephalale                        3 690
      Matla             Bethal                           3 450
     Tutuka             Standerton                       3 510
Eskom‟s peaking power stations
                  Station          Location       Nominal capacity (MW)
                  Acacia           Cape Town             171
                  Ankerlig
  Gas

                                   Atlantis             1 327
                  Gourikwa         Mossel Bay            740
                  Port Rex         East London           171

                  Colley Wobbles   Mbashe River          42
  Hydroelectric

                  First Falls      Umtata River          6
                  Gariep           Norvalspont          360
                  Ncora            Ncora River            2
                  Second Falls     Umtata River          11
                  Vanderkloof      Petrusville          240
 Pumped

                                   Bergville
 storage

                  Drakensberg                           1000
                   Palmiet         Grabouw              400
  Wind

                  Klipheuwel       Klipheuwel            3
  Nuclear

                  Koeberg          Melkbossrand         1860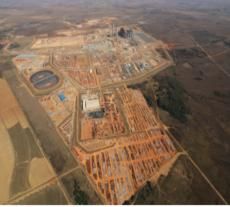
Contents

Content

 1. Eskom overview

 2. Sustainability of the Energy Sector
    and Eskom

 3. Generation sustainability strategy

 4. New build programme update

 5. IPP programme

 6. International agreements

 7. Gas future

 8. Municipal debt

                                          9
Context

Eskom‟s Emergency Task Team was set up by Board at the April 2014 Breakaway.

The Eskom response plan is organised around four pillars:
• The first pillar is Financial sustainability, this includes development of opportunities to
  optimise the balance sheet and unlock cash as well as the Business Productivity
  Programme (BPP). BPP has already scoped value packages to address key areas of
  spend: Primary Energy, Maintenance Costs, Employee Costs, Capex, and External Spend.
  The Programme has also looked at Financial levers and Revenue Management.
• The second pillar is Operational Sustainability, encompassing the comprehensive
  programme to improve and sustain the generation plant.
• The third and final lever is the Delivery of the Build Programme focusing on delivery of
  Unit 6 and 5 of Medupi, and containing the Capex spend to R251bn and pursuing
  opportunities to add capacity and reduce system pressures by using alternative
  technologies, for example gas.
• The fourth pillar is the implementation of a Gas Strategy focusing on both local and
  regional gas sources for both greenfield and brownfield projects.

    The initial emergency work, which focused on the 90 day plan, has now been concluded
                     …an intense stakeholder engagement has now begun.

                                                                                            10
Further context and objectives
(Today and going forward)
Key objectives for
▪ Cashflow forecast negative by June 2015 today
▪ Challenging to raise additional debt to reverse
the situation • Focus on short
▪ Forecasted sales decline of R47 bn term imperatives
TIMELINE • Review critical
decisions needed
(1997-2008) (2012-Today) - MYPD3
• Frame long term
▪ No increase of ▪ R225 bn revenue gap issues and
generation capacity ▪ Eskom Response possible
▪ Maintenance deferred programme established solutions
and use of OCGTs ▪ Operating reserves not
increased adequate to meet peak
▪ Extensive build program demand
to add capacity launched
in 2000‟s
11
“Driving world class generation performance, with Zero Harm”We are looking at all available solution options
Internally Eskom will drive the following
• Implementing a Business Productivity Programme
(BPP) to reduce operating costs and limit capital
spend
• Bring Medupi Unit 6 on line – first syncronisation by
end of this year
• Accelerating the Generation Sustainability
An appropriate sustainability
Programme with the aim of improving the availability Plan for Eskom looking at
and reliability of plant. various options is being
• Identifying new demand and supply-side levers to limit worked on by the relevant
use of Open Cycle gas Turbines Stakeholders in line with the
• Pursuing gas options for both existing (brownfield) President‟s State of the
and new (greenfield) plants. National address.
• Identifying regional projects and partnerships within
the South African Power Pool.
• Identifying and finalising various funding options with
the relevant Stakeholders.
• Clearly communicate and work with stakeholders on
the new process to manage the system including
revised load shedding schedules and communication
to give certainty around the system reliability .
12
“Driving world class generation performance, with Zero Harm”Contents
Content
1. Eskom overview
2. Sustainability of the Energy Sector
and Eskom
3. Generation sustainability strategy
4. New build programme update
5. IPP programme
6. International agreements
7. Gas future
8. Municipal debt
1360% of Eskom Power Stations are older than the
recommended design life of 30 years1
Coal Power Station ages Insight
52
Age in years An aging Eskom fleet
results in four major
42 44 43 issues:
38
1. Increase in
34
30 years 34 34 unplanned failures.
Design Life 28 28 2. More mechanical
27 maintenance
25
failures
17 3. Increased duration
required for outages
puts pressure on the
grid
4. Increased cost
implications
Lethabo
Kendal
Camden
Hendrina
Arnot
Matimba
Duvha
Kriel
Grootvlei
Matla
Majuba
Tutuka
Komati
5. Specialist
engineering
required
Prod
Coal 1 Coal 2 Coal 3
units
Capacity 32% 47% 21%
Contribution
1 – Interviews with Eskom Specialists, Medupi URS, Eskom Document GGP 1282 REV.2
SOURCE: GPSS, Team analysis 14Generation plant is being run harder than all other utilities “Driving world class generation performance, with Zero Harm”
Gx Plant have seen over 15 years of under expenditure in
  Capex on a fleet basis with periods of cost
  cutting, financial constraints and capacity constraints                                                    Change in approach
                                                                                                             to maintenance

 Capital expenditure – Generation (coal fired, etc.)

 R/kW                            90/7/3: strategy      Suppressed       Return to plant     Keep the Lights On: zero
        Plant focus: actual      adopted to optimise   tariff: tariff   focus: renewed      load shedding is top
  300
        CAPEX spending           production and        growth below     investment in       priority, reducing
        matches profile of fleet minimise CAPEX        inflation`       fleet               maintenance capacity

  200

  100

                                                                                       Underinvestment, in terms
                                                                                       of PCLF percentage, is
                                                                                       also confirmed by VGB‟s
                                                                                       benchmarking analysis
    0
   1991 92      93   94    95   96    97   98   99 2000 01   02   03    04   05   06   07    08   09   10   11   12 F2013

                       Past decisions, while reflective of the need of South Africa and Eskom at
                       the time, de-prioritised both time and capital allocated for maintenance
Source: Eskom Asset Management; VGB                                                                                         16
                                                                                                                           16
UCLF and EAF trends from March 2010 to March
2014
Actual Annual year-end target
Unplanned capability loss factor (UCLF1) % Energy availability factor (EAF2) %
Series2 1.6
10.
3.4 0
12.1 12.6
85.2 84.6 80.0
11.0 82.0
8.7 77.7
8.0
75.1
6.1
5.1
1 2 3 4 5
1 2 3 4 5
1. UCLF measures the lost energy due to unplanned production interruptions resulting from equipment failures and other plant conditions
2. EAF measures plant availability, plus energy losses not under the control of plant management
“Driving world class generation performance, with Zero Harm” 17A 5 point recovery plan has been put into place in
attempt to put generation on a sustainable path
Gx Leadership
intervention
Initiative
▪ 80 – 10 – 10 : Commit and deliver
▪ Recover good practice – adhere to SOP, housekeeping, outage
quality and scope and on line maintenance
▪ Visible, aligned and felt leadership
▪ Hands on oversight, correction and mentorship
▪ Securing the space to manage increased volatility – Demand &
Supply
“Driving world class generation performance, with Zero Harm” 18Generation performance recovery in 5 years
19There are a number of actions along three horizons
to reach Sustainability over the next 5 years PRELIMINARY
People
Improvement – 18 to
Plant 36 months
Processes / systems ▪ Reinforce safety-first mindset – continue
to innovate
Stability – up to ▪ Retention drive to decrease turnover at
18 months key positions
▪ Staff most critical vacancies
▪ Free up site & senior leadership time to ▪ Return to Design-based Maintenance
spend more time in the physical plant ▪ Ensure 100% stat/env compliance
▪ Deploy Specialist to sites
▪ Drive UCLF down – targeted effort ▪ Streamline HR recruitment process
▪ Improve Outage/Comm Effectiveness ▪ Finalise condition monitoring
▪ Exhaust supply and demand levers implementation
▪ Improve site risk management processes
▪ Cease / postpone certain initiatives
▪ Roll out strategic and modular spares
▪ Use OEM capacity more effectively
▪ Transform organisational mindset - sustainability
▪ Refocus training techniques in favour of hands-on, at-
Sustainability – up site technical experience
to 72 months
▪ Embed inflexible philosophy maintenance strategy
▪ Allocate sufficient budget for technical program
▪ Monitor & continuously Improve maintenance quality
▪ Implement tools for better technical data collection
SOURCE: Maintenance strategy team ▪ Manage suppliers contracts more rigorously 20Recent load shedding incidents…
21Introduction
General power system context
• The power system has been operated at its limit in order
undertake as much maintenance as possible.
• Whilst the intent has been to avoid forced demand reduction, the
increased possibility of load shedding is a consequence
• Over the last six months, the variability in generation performance
has been managed, however at current reserve levels, additional
incidents affecting the balance of supply and demand may lead to
a need for forced demand reduction.
.
“Driving world class generation performance, with Zero Harm”Learning from system emergency incidents
November 2013 February 2014 March 2014
Cause (NB context of a Disruption in the supply of HVDC line failure Kendal coal and Duvha
constrained system) OCGT fuel conveyer fire
Emergencies declared 19 Nov (17H00 - 29 Nov) 20 Feb (11H40-21H00) 6 Mar (06H00-22H00)
Revised (21H00 21 Nov) 21 Feb (15H50-21H00)
Voluntary demand Large customers Large customers Large customers
reduction Metro‟s munics Metro‟s munics Metro‟s munics
Small customers Small customers Small customers
Forced demand Curtailment – i.t.o. Curtailment – i.t.o Curtailment & shedding
reduction NRS048-9 NRS048-9 – i.t.o. NRS048-9
Stakeholders: large 10% reduction 10% reduction Initially 10% and then
customers 20% reduction
Stakeholders: Smaller No load shedding No load shedding Stage 3 shedding (20%)
customers Stage 2 shedding (10%)
Metro’s and No load shedding No load shedding Implemented load
municipalities shedding
Schedules Eskom and several Schedules remained Several Metro/munic
Metro/munic schedules published schedules not available
published as a precaution until later in the
day/week.Learning from system emergency incidents
June 2014 June 2014 June 2014
Cause (NB context of a Kendal MUT causing System demand System demand
constrained system) depletion of reserves.
Emergencies declared 11 Jun (peak) 17 Jun (18H00-19H00) 18, 19 Jun (18H00-
12 Jun (peak) 20H00)
Voluntary demand Large customers Large customers Large customers
reduction Metro‟s munics Metro‟s munics Metro‟s munics
Small customers Small customers Small customers
Forced demand Shedding only (11th) Shedding only – i.t.o None
reduction Shed & curtail (12th) NRS048-9
Stakeholders: large 10% reduction 10% reduction N/A
customers
Stakeholders: Smaller Stage 1 shedding Stage 1 shedding N/A
customers
Metro’s and Implemented load Implemented load N/A
municipalities shedding shedding
Schedules Schedules remained Schedules remained Schedules remained
published – Eskom published – Eskom published – Eskom
website available website available website available
schedules schedules schedulesWinter profile:… „Beat the Peak‟
• Peak profile experienced from as early as May up to end-August
• Constrained from 5pm – 9pm (with the highest demand and risk from 5:30pm to 6:30pm)
• Electrical heating, geysers and pool pumps primarily impact demand
• Residential customers can make the biggest difference as demand increases in the
evenings
38,000
MW Summer & Winter load profiles
36,000
Winter Peak Profile
34,000 Winter constraints are
short, sharp peaks while
32,000
summer constraints are
30,000 throughout the day
28,000
26,000
Summer flat (Table Mountain profile)
24,000
22,000
Series1 Series2
20,000
1 4 7 10 13 16 19 22 25 28
Help us Beat the Peak as it reduces high diesel usage
“Driving world class generation performance, with Zero Harm”
25All electricity users are urged to pull together
and help to „Beat the Peak‟ this winter
• Saving electricity not only reduces pressure on the grid but also reduces on
your electricity bill and South Africa‟s carbon emissions.
• Evening peak is experienced between 5pm and 9pm. Switch off!
Particularly from 5:30pm to 6:30pm, when the demand is at its highest.
• To keep the system in balance please:
- Switch off geysers and pool pumps during peak times
- Reduce swimming pool pump operating time and limit water
circulation to once a day
- Dress for the weather, to postpone switching on space heaters
- Install ceiling insulation - an insulated room requires 51% less
energy to heat up
- Invest in a thermostatically controlled heater - a fan heater is ideal
for quick heat situations, while an oil heater can be considered to keep
a room warm for longer periods
- Consider gas heaters and hot water bottles to keep warm
- Respond to the Power Alert messages by switching off all appliances
that are not being used
26
“Driving world class generation performance, with Zero Harm”It is possible to minimise workplace energy use
and spend with these 7 super savings tips
1 5
Use the cold water tap At the end of the day, don‟t leave
rather than engaging the geyser your computer on stand-by; switch
every time off the power button
2
When you leave the 6
office, remember to switch off Be energy efficiency and change your
the lights light bulbs to energy efficient lights /
CFLs
3 Only fill kettles with as
much water as you need 7
Before you leave, turn off
copiers, printers and fax machines
at the switch.
4 Avoid sleep mode.
Set air-conditioners‟
average temperature in
summer at 23 C
27
“Driving world class generation performance, with Zero Harm”Eskom is committed to assisting users to beat the
peak
• Eskom leadership and the Eskom Board are taking a hands-on approach to
ensure operational sustainability.
• The system remains tight this Winter particularly during peak from 5pm to
9pm, (with the highest risk between 5:30pm – 6:30pm) and will remain so
for the next few years until the build programme is completed.
• The tight system means that the probability of load reduction and load
shedding remains high in the event of significant incidents on the power
system.
• As a precautionary measure, residential customers should familiarise
themselves and download winter load shedding schedules.
http://loadshedding.eskom.co.za/.
• We thank all electricity users who continue to assist by reducing consumption.
28
“Driving world class generation performance, with Zero Harm”Contents
Content
1. Eskom overview
2. Sustainability of the Energy Sector
and Eskom
3. Generation sustainability strategy
4. New build programme update
5. IPP programme
6. International agreements
7. Gas future
8. Municipal debt
29New Generation Capacity and Transmission Lines
Leading and partnering to keep the lights on
Return-to-service Base load Peaking and Mpumalanga Transmission
(RTS) renewable refurbishment
• None • Nuclear New Build • Pilot Concentrated • Refurbishment and • >60 Grid
Programme Solar Power (100 MW) air quality projects strengthening
development
• Next Coal (Coal 3) • Open Cycle Gas Turbine projects
• Biomass Conversion Project –
In
• Majuba Underground Coal conversion of Ankerlig and
Gasification Demo Plant Gourikwa OCGT power
(UCG) plants to a Combined
• Primary Energy projects Cycle Gas Turbine
(Road and Rail) (CCGT)
• Photovoltaic (own use)
• Komati (1 000 MW) • Medupi (4 764 MW) • Ankerlig (1 338.3MW) • Arnot capacity • 765kV projects
construction
• Camden (1 520 MW) • Kusile (4 800 MW) • Gourikwa (746 MW) increase (300 MW) • Central projects
•
Under
• Grootvlei (1 180 MW) Ingula (1 332 MW) • Matla refurbishment • Northern projects
• Sere (100 MW) • Kriel refurbishment • Cape projects
• Acacia relocation • Duvha refurbishment
• Solar PV installations: • Grootvlei Fabric Filter
MWP, Lethabo, Kendal Plant (FFP)
(1.62 MW) • Kriel Retrofit
3 700 MW 9 564 MW 3 517.92 MW 300 MW 9 756 km
Synchronisation of the first units are expected as follows:
• ~ 17.4GW of new capacity (6 137MW installed and commissioned)
• Medupi in the second half of 2014
• ~ 9 756 km of new transmission network (5 524km installed)
• Kusile in the second half of 2015 • ~ 42 470 MVA of new transmission strengthening (27 565MVA installed)
• Ingula in the second half of 20151
Medupi is the first coal-generating plant in Africa to use supercritical power generation technology
1. Date moved out after the accident at Ingula end October 2013 30Base load: Medupi and Kusile Executive summary
Summary
• 1st unit synchronization is on schedule for December 2014
Medupi • Construction progress in critical areas is still hindered due to industrial action that
commenced on 01 July 2014, however, there has been a positive trend recently with
resources returning to site
– Both the main contractors, Alstom and Mitsubishi Hitachi Power Systems Africa
(MHPSA), have mobilised resources to reduce the impact of the industrial action
– In order to avoid slippage on the 1st unit synchronization date, the milestone of Boiler
Chemical Clean Start is required to commence by 27 July 2014
• The Control and Instrumentation (C&I) contractor‟s (Alstom) schedule indicates that it is on
target for completion of First Fires by 15 September 2014, which is required to support
the 1st unit synchronization date.
• First Coal was delivered to the Coal Stockyard and the running of conveyors, coaling to
station and optimizing of the system continues.
• 1st unit synchronization by December 2015. Eskom continues to implement plans, track
progress and drive strategies supported by contractors to complete these works within
Kusile needed target dates and in parallel with the critical path work.
Boiler progress: MHPSA‟s progress of 0.6%/week shows improvement against the
previous performance of 0.48%/week during March 2014 and it is making very good
progress on Steam Piping. However, progress on the Boiler needs still needs to be
improved to avoid slippages into 2016
Eskom continues to work with the C&I contractor to ensure support for the 2015
synchronization date, Eskom has also implemented additional measures to mitigate
schedule risk
We have implemented a Commercial Strategy for the project which will help ensure that
contractors perform with additional resources having been deployed to site by MHPSAMedupi Unit 6 – The next steps to 1st
Synchronization in December 2014
• This is to remove construction contaminants which could cause operating problems or failure during
Boiler Chem initial operation
15 July
2014 Clean • This involves flushing hydrofluoric acid through the system to remove mill scale, weld
slag, rust, oil, grease, debris and dirt
• This is to test the control and instrumentation systems which manage all associated plant responsible
6 Sept Boiler Protect’n for keeping the boiler operational this includes, boiler feed pumps, water treatment plant, coal
2014 System teams conveyors, coal mills, ash handling equipment and draught groups
• The first fires in the boiler is started using bulk fuel oil instead of coal
9 Sept • This is test the burners and to raise the temperate of the water in the boiler and to help combust
2014 First Oil Fires pulverized fuel
• In this instance, pulverized fuel is introduced into the boilers while the oil fires are present and is the test
11 Sept First Coal Fires of coal handling, coal mills and burner systems
2014
• The blow through is performance after the first coal fires to ensure that the water circuit is cleaned of
26 Sept any foreign debris which could damage the turbine
Blow Through
2014 • This blow through is steam that is expressed through the boiler at very high temperatures and pressures
• This is the first time the turbine is rotated using steam from the boiler and operated at 3000revs/min
1 Dec Steam to Set
2014
• The purpose of synchronization is to ensure that the electricity generated is in phase with the grid;
15 Dec First • This means that the speed and phase of the generator matches the electricity load on the transmission
2014 Synchroni- lines and for the production of electricity occurs and electrical energy is exported into the National Grid
sation
32Base load: To mitigate the schedule risk relating to Control and Instrumentation (C&I), an Early Works Order (EWO) has been placed in parallel to the current C&I contractor work “Driving world class generation performance, with Zero Harm” 33
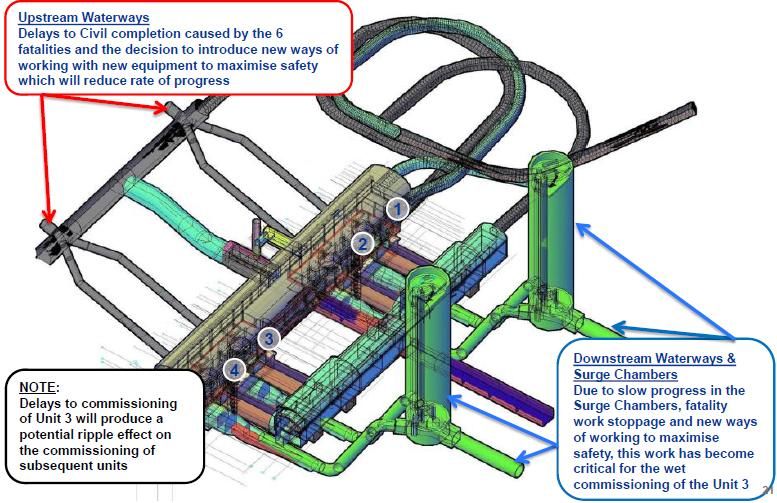
Peaking: Ingula‟s 1st Unit (Unit 3) synchronization of
September 2015 could potentially be impacted in 2
main areas

  “Driving world class generation performance, with Zero Harm”   34
Peaking: Ingula‟s Unit synchronization and
commercial operations forecast dates

                                                             Forecasted first synchronisation September 2015

  “Driving world class generation performance, with Zero Harm”             35
New build programme: Key issues on projects
Item Description Resolution
Welding Defects • Inadequate and/or failed Weld Procedure • Defective and sub-standard welds needed to be re-
Qualification Records (WPQRs) and Post treated or redone.
Weld Heat Treatment (PWHT) on the boilers. • Contractors had to revisit and correct their quality
• Welds for which there was no evidence of data books to ensure compliant and adequate quality
PWHT. control.
• Misalignment of the Super-Heater that • All boiler repair work has since been completed.
resulted in design changes.
Control and • The contractor was not able to meet some of • Eskom has worked- and continues to work with the
Instrumentation its contractual requirements relating to C&I. contractor to resolve identified issues within the
(C&I) This posed a risk to both Projects Medupi required timelines. However, an alternative supplier
and Kusile and could have delayed the was contracted on the Boiler Protection System (BPS)
projects further. component for the 1st two units of Medupi and an Early
Works Order (EWO) has been placed in parallel to the
current C&I work to further mitigate schedule delays.
Safety • Poor safety performance on sites, • Eskom and its contractors have implemented
Performance particularly at Project Ingula with 6 fatalities safety interventions, appointed additional resources,
occurring during the incident of October removed non-performing resources and changed work
2013. methods. Safety performance and behaviour has
improved significantly and Eskom and its contractors
will continue with efforts to further improve
performance.
36
“Driving world class generation performance, with Zero Harm”Transmission projects: On target to meet the
shareholder compact of lines built
Jun-14
KM LINE BUILT YTD Plan YTD Actual YE Plan YE Projection
Plan Actual
Northern Grid Projects: 36.4 33.7 100.1 113.5 208.8 204.9
HPM: 132kV interconnecting line,
8.0 0.0 8.0 7.7 57.2 58.3
400kV line
Kusile: Vulcan bypass, loop 1 and 2 0.0 0.0 0.0 0.0 2.0 2.0
Anglo deviation 0.0 0.0 0.0 0.0 1.5 1.5
Medupi: Section E, F, G and Medupi
28.4 33.7 92.1 105.8 148.1 143.1
Masa
765kV Projects: 5.0 8.7 10.0 13.9 70.0 73.9
Kappa Turn ins 5.0 8.7 10.0 13.9 10.0 13.9
Kappa Sterrekus 0.0 0.0 0.0 0.0 60.0 60.0
Cape Grid Projects: 0.0 0.0 0.0 0.0 6.0 6.0
Mercury Mookodi 400kV line 0.0 0.0 0.0 0.0 6.0 6.0
Central Grid Projects 0.0 0.0 0.0 0.0 30.3 30.3
Eros-Vuyani 400kV line Section A
0.0 0.0 0.0 0.0 25.9 25.9
and B
Verwoerdburg Loop-in Loop-out 0.0 0.0 0.0 0.0 4.4 4.4
Power Delivery Projects 41.4 42.4 110.1 127.4 315.1 315.1
“Driving world class generation performance, with Zero Harm” 37Contents
Content
1. Eskom overview
2. Sustainability of the Energy Sector
and Eskom
3. Generation sustainability strategy
4. New build programme update
5. IPP programme
6. International agreements
7. Gas future
8. Municipal debt
38Contents
Introduction Progress to date
• The Integrated Resource Plan (IRP 2010-30) was • Eskom Grid Access Unit (GAU) has processed over
promulgated a few years ago and remains the 1400 Cost Estimate Letters in support of the DoE‟s
official document of government plan for Renewable Energy Procurement Programme
directing the country on new generation. The IRP (REIPP)
2010 prescribes the preferred generation
technology required to meet the expected demand • As of June 2014, Eskom has connected 25 IPPs
growth up to 2030 (23 in Bid window 1 and 2 in Bid window 2) as
part of the RE IPP PP. These 25 projects have
• DoE has structured the IRP such that it delivers on cumulatively added over 1300 MW of generation
the government policy of reducing carbon capacity to the grid. A further 1200 MW is expected
emissions ; introducing competition in the by the end of 2015 as the second bid window projects
generation of electricity and facilitating economic come to fruition
growth of the country
• GAU is currently processing cost estimate letters
• There has been some progress over the past three for the 4th bid window (BW4) with the bid
years since the promulgation of the IRP 2010 in submission date for this window scheduled for August
executing the procurement programmes through 2014.In addition, budget quotations for the 3rd bid
Ministerial Determinations (in 2011 and 2012) which window (BW3) are being processed with financial
identified 7135 MW of capacity to be procured close for these projects expected in August –
from independent power producers (IPPs) September 2014
• Through Small Project Procurement Program, over
200 MW is expected to be procured from the
small scale IPPs. Typically these projects would be
between 1 MW and 5 MW. A further 1200 MW to be
procured through Special Peakers‟ programme
39DoE RE IPP Procurement Programme
Eskom Support for REIPP
• IPP‟s that made applications to
BID 1 - 3 Projects
Eskom are (Bid 1: 503, Bid 2: 481,
and Bid 3: 511) In total Eskom
Series1 Series2 Series3
processed 1495 applications and
1600
1495 issued cost estimates letters to the
IPP‟s.
1400
• Whilst Eskom processed these,
1200
only a few IPP‟s submitted
applications for the Bids (Bid 1: 54,
1000
Bid 2: 79, and Bid 3: 97) Total: 230
800
• Successful Bids stand at 68
600
503 481
511 • Applications vs. successful bidders
is less than 5% therefore requiring
400
a different processes to manage
212 the inefficiency
200
54 79 79 68
28 19 21
0
1 2 3 4
42Eskom has identified key issues and learnt
lessons from the integration of IPPs
Key issues and lessons
• Bid 1 and Bid 2 RE power plants to the grid appear to have taken the “low hanging fruits”.
Bid 3 projects already taking longer to cost and quote
Timelines • IPP timelines are not consistent with Eskom delivery timeframes
• The slow pace of concluding the framework and activities for the Small and Micro
Generation (SMG less than 1 MW) remains a risk to both Eskom and the municipalities
• The geographical distribution of renewable IPP projects generally follows the established
Geographical patterns of wind and photovoltaic (PV) corridors
locations • Solar resources are largely in the desert areas of the Northern Cape with no infrastructure
intended for connection of customers.
• Eskom Tx network development plan (strengthening and refurbishment) is necessary to
create capacity to successfully connect the IPPs. Project does not seem to meet the
Integration into immediate needs of the IPPs
existing plans • Dx and Tx integration for Planning and Design functions need to improve - in the past the
improper functioning was not detected
• Eskom project processes and governance procedures may need improvement: 3 projects
are likely to claim a total of R96 mil in deemed energy charges for Eskom delayed projects
due to Procurement issues (R12mil); MYPD3 capital reprioritization (R19mil) and EIA
related issues (R64mil)
• Despite Eskom availing funding (R2.34 billion) for network upgrades, the long lead times
will delay the grid connection dates thus impacting the commercial operation dates of
Funding issues some of the Bid 3 projects
• Although IPP costs are a pass through, negative cashflow for Eskom due to misalignment
in timing of cashflows
• Inadequate funding allocated in MYPD3 for strengthening of the network to connect
43 IPPs
to the grid
“Driving world class generation performance, with Zero Harm”Contents
Content
1. Eskom overview
2. Sustainability of the Energy Sector
and Eskom
3. Generation sustainability strategy
4. New build programme update
5. IPP programme
6. International agreements
7. Gas future
8. Municipal debt
44Eskom currently has a number of cross-border
Sales and Purchase agreements
Sales Agreements
Country Account Capacity Firm? Expiry
EDM 0MW Non-firm -
Mozambique
Motraco 950MW Firm Dec 2025
Zambia ZESCO 0MW Non-firm -
Zimbabwe ZESA 0MW Non-firm -
Lesotho LEC 90MW Firm indefinite
Swaziland SEC 250MW Firm Aug 2025
NamPower 300MW Firm Mar 2017
Namibia Skorpion 100MW Firm Jan 2018
Orange River 40MW Firm
Botswana BPC 100MW Firm Dec 2015 • Mozambique, Botswana and Namibia
make up >90% of export sales
Purchase Agreements
• Approx. 65% of sales made to Motraco
Country Account Capacity Firm? (Mozal smelter)
Cahora 1 500MW Firm Mar 2030 • Sales to Botswana reduced to due to
Bassa new Morupule power station in
Mozambique Botswana
Aggreko 108- Firm Aug 2015 • Sales reduced to Namibia due to its
148MW agreements with Zimbabwe and
Lesotho LEC 0MW Non-firm Aggreko temporary power station
45Regional imports are currently limited
Cahora Bassa is the main regional source of In summary, electricity exports show a slow
supply, tied to supplying the Mozal aluminum but steady decline, while imports improved in
smelter in Mozambique FY2014
Poor technical performance of the Cahora Bassa The overall result is that Eskom remains in a
HVDC scheme resulted in reduced imports of net export position of 2.95TWh in FY2014,
6.43TWh in FY2013, but improved to 8.58TWh in which is an improvement from 5.97TWh in
FY2014 FY2013
46Applicable principles to Utilities receiving energy
from Eskom during emergencies
• During Eskom system emergencies the following applies to exports:
• Trading Partners are required to utilize all their own generation capacity to the
maximum
• All non-firm energy supplies are reduced to zero
• All firm energy supplies are reduced by 10%
• Trading Partners are required to enforce the 10% reduction on their customer base
• If there is load shedding in South Africa then all sales to Namibia and Botswana
are withdrawn, and Swaziland and Lesotho are required to do proportional load
shedding
• Energy which may inadvertently be drawn out of the Eskom system is charged at
punitive emergency generation rates
• The interruptibility of the Mozal and Skorpion Zinc agreements are activated by
National Control as the Tx system requires for system stabilityEskom is collaborating with various countries to
develop new regional capacity
Priority future generation and transmission
opportunities to facilitate imports
DRC
Grand Inga Phase 1: Mphanda Nkuwa: 1 500 MW
4800 MW installed installed with 1 200MW to RSA
with 2500MW to RSA
Rovuma:
Zambia IPPs with 200 MW
Zambia
~600MW for RSA Gas from
Rovuma Basin.
Nacala: 300 MW Assume RSA
purchases 80%
Beira: 400 MW and EDM 20%
Namibia Botswana
Maputo: 2 000 MW
Kudu: 800
Gas from current Pande-
MW installed Swaziland Gigawatt: 140MW Temane field. All power
withContents
Content
1. Eskom overview
2. Sustainability of the Energy Sector
and Eskom
3. Generation sustainability strategy
4. New build programme update
5. IPP programme
6. International agreements
7. Gas future
8. Municipal debt
49We have an intention to pursue all technology options to
ensure regional integration and energy security
KENYA
GEO-THERMAL
GABON
DR CONGO
TANZANIA
ANGOLA
ZAMBIA
NAMIBIA
BOTSWANA
SUPER GRID
SOLAR
Shale Gas SWAZILAND
50Among the supply options we are pursuing, gas is seen
as one of the best for replacing end-of-life stations
Plants approaching end of life
25,590MW
9,750MW
3,810MW
380MW
2014-2020 2021-2025 2026-2030 2031-2050
• Camden • Arnot - 740 MW • Acacia – 180MW1 • Ankerlig - 1350MW
• Camden – 1140 MW • Arnot – 1480MW • Duhva – 2320MW
• Grootvlei – 180 MW • Duhva – 1160MW • Gourikwa – 750MW
• Hendrina – 1330 MW • Grootvlei – 900MW • Kendal – 3780MW1
• Komati – 300 MW • Hendrina – 560MW • Koeberg – 1860MW
• Matimba – 60 MW • Kendal – 60MW • Lethabo – 3540MW
• Tutuka – 60 MW • Komati – 600MW • Majuba – 3170MW
• Kriel – 2880MW • Matimba – 3600MW
• Matla – 1740MW • Matla – 1740MW
• Port Rex – 180MW • Tutuka – 3480MW
• Given the long lead times to commission new plants, Eskom
must decide soon on how this capacity will be replaced
• Life extensions and environmental retrofits will require R50-
R260bn in capex spend which could be spent on gas instead
1 Stations still required for grid stability
SOURCE: Eskom Decommissioning Plan; Fleet Life Extension Clarification Report; Team analysis
51The 600MW unit in Maputo is the most feasible short-term gas
option; shale gas is the most attractive long-term source
Difficult Moderate Easy
Positive Breakeven Uneconomical
Capex
Total Eskom Generating Remaining
required portion Gas cost cost Comple- life
Rbn Rbn $/mmbtu R/MWh tion Years Feasibility2
600MW
1 (ex Buzi) 13 4 5-6 450-550 2016 51
Phase I:
Reduce
system
pressure LNG for coastal
2 peaking stations 4 4 13-16 1600-2000 2018 >100
5000MW
3 (ex Rovuma) 120 4 6-8 550-700 2023 >100
Phase II:
Replace
ageing coal
fleet 4 Ibhubesi gas 190 3 12-15 900 - 1100 2019 ~10
5 Shale gas 730 4 4-5 400-450 2030s >753
Phase III –
Gas-enabled
industrial-
isation 6 Waterberg CBM 14 0.4 7-8 500-600 2030 >30
1 Gas price of $5-6 offered to Eskom with the gas-field expected to last until 2032
2 Subjective assessment based on coordination required between various stakeholders and technical complexity of implementation
3 Reserve estimates are as high as 485 TCF. Shale gas scenarios require 1 TCF p.a. to generate 10,000 MW
SOURCE: McKinsey Exploration Practices Benchmarking participants 2013; Eskom; team analysis
52Gas development options can drive three waves
of opportunity for South Africa
Opportunity to pursue immediately
Phase III: Gas-enabled
Phase II: Replace ageing industrialisation (2023-40)
Phase I: Reduce system coal fleet (2018-23)
pressure (2015-18) • 18,000 – 60,000 MW
• 5,000 MW
• 600 MW
New capacity
• Add capacity that is: • Begin replacement of • Drive industrialisation with
– Quick to build ageing coal fleet with improved competitiveness
– Flexible to account for sustainable and economic of key industries
generation capacity that (e.g., petrochemicals)
Objectives renewables
can support country growth
for the country – Economical to avoid • Complete replacement of
subsidies or reduce coal fleet with sustainable
costs and economic capacity
1 600 MW of power 3 5,000 MW capacity in 5 Develop shale gas for the
generated in Maputo, supplied by balance of the gas mix in
Mozambique, potentially pipeline from Rovuma gas power generation and the
Gas options from Buzi block gas field rest for direct consumption
to support
objectives 2 Floating LNG regas to 4 Potential supply from 6 Build 400 MW capacity in
supply gas to OCGTs in the Ibhubesi gas field in the Waterberg based off CBM
Western Cape - multifuel Western Cape reserve
53Contents
Content
1. Eskom overview
2. Sustainability of the Energy Sector
and Eskom
3. Generation sustainability strategy
4. New build programme update
5. IPP programme
6. International agreements
7. Gas future
8. Municipal debt
54Movement in overdue municipal debt
Trend in Total Overdue Municipal Debt (>30 days) (R’million):
Oct „13 Nov „13 Dec „13 Jan ‟14 Feb ‟14 Mar „14 April „14 May „14 June ‘14
R2,355 R2,346 R2,096 R2,207 R2,377 R2,268 R2,198 2,534 2,915
Source: Cashlab
** Eskom‟s payment terms is 15 days; however, the focus is on managing arrear debt >30 days as many municipalities have collection
periods of 30 days.; also „free basic electricity‟ accounts are payable in 30 days.
55Provincial breakdown of overdue debt, (>30 days)
Total outstanding debt (>30 days) as at 30 June 2014
= R2.9 billion
> 30 days > 60 days > 90 days
R550m R420m R1,945m
Source: MFMA reports 56The top 20 defaulting municipalities
Average current account (low demand period)
of municipality-inserted in bar
52
The high demand (winter) current accounts
108 are significantly higher - inserted above
57
22
19
44
60
37 11
60 58 7
14 11
8
7 12
2 6 5
28 32 12 8 5 24 6 52 12 16 33 42 4 5Top 30 of defaulting municipalities as at 31 October
2013
Average Total Overdue Debt (>30 Days) Movement
Priority 30 Current a/c (from Oct
Province Oct 2013 April 2014 May 2014 June 2014
Municipality name (low demand) 2013)
R'm R'm R'm R'm R'm R'm
Mpumalanga EMALAHLENI LOCAL MUNICIPALITY 52 227.09 245.87 299.41 311.84 84.76
Free State MATJHABENG MUNICIPALITY 28 184.19 283.74 310.55 338.65 154.45
Free State MALUTI A PHOFUNG MUNICIPALITY 32 205.29 198.32 228.86 266.68 61.39
Free State NGWATHE LOCAL MUNICIPALITY 12 192.31 204.19 216.47 229.16 36.85
Mpumalanga THABA CHWEU LOCAL MUNICIPALITY 12 152.32 162.67 173.95 184.23 31.91
Mpumalanga LEKWA LOCAL MUNICIPALITY 16 114.75 104.99 125.05 139.76 25.01
North West CITY OF MATLOSANA LOCAL MUNICIPALITY 35 99.87 71.91 74.25 76.37 -23.50
Mpumalanga MBOMBELA LOCAL MUNICIPALITY 42 62.20 34.49 33.39 68.76 6.56
Gauteng RANDFONTEIN LOCAL MUNICIPALITY 24 96.66 81.83 66.17 87.61 -9.04
Mpumalanga GOVAN MBEKI MUNICIPALITY 33 85.35 31.70 72.39 57.73 -27.63
North West NALEDI LOCAL MUNICIPALITY 6 70.95 80.69 83.62 90.47 19.53
Gauteng WESTONARIA LOCAL MUNICIPALITY 6 71.03 55.77 56.19 55.11 -15.93
Free State DIHLABENG MUNICIPALITY 8 63.14 49.52 58.38 67.40 4.26
Gauteng MOGALE CITY LOCAL MUNICIPALITY 38 59.98 23.99 29.51 58.09 -1.89
North West LICHTENBURG MUNICIPALITY,- 7 43.50 43.85 36.34 42.95 -0.55
Limpopo THABAZIMBI LOCAL MUNICIPALITY 4 43.46 58.88 62.79 66.49 23.03
Mpumalanga MSUKALIGWA LOCAL MUNICIPALITY 12 43.47 13.86 23.18 34.17 -9.30
KwaZulu Natal ULUNDI LOCAL MUNICIPALITY 5 41.86 0.05 0.11 40.06 -1.81
Free State MAFUBE MUNICIPALITY 2 38.75 38.84 39.41 39.98 1.23
Free State NALA LOCAL MUNICIPALITY 5 33.78 36.89 43.41 44.24 10.46
Limpopo MAKHADO LOCAL MUNICIPALITY 15 25.16 0.00 10.64 18.52 -6.64
Free State MOQHAKA MUNICIPALITY 14 37.21 0.00 0.00 0.19 -37.03
North West LEKWA - TEEMANE 3 33.08 10.22 36.17 38.69 5.61
Eastern Cape GARIEP LOCAL MUNICIPALITYProgress with Provincial Structures
Eskom has experienced different levels of success in dealing with defaulting
municipalities in the MP, FS, NW & GP
Province Progress with defaulting Municipalities
• TC has no option but to
• Agreed with the MEC CoGTA (Oct 2013) that all be more assertive in
Mpumalanga
municipal current bills will be honoured and protecting Eskom‟s
outstanding debt to be settled by end Oct 2014. revenue risk going
(7 munics1)
• Payment agreements finalised with all except forward and notice of
Lekwa and Emalahleni. disconnection will be
issued as required.
• Agreed with the MEC CoGTA (March 2014) that
all defaulting munics will honour current accounts • TC regularly meets with
North West National Treasury who
and debt to be settled by end March 2015.
(6 munics1) is placing pressure on
Discussions progressing well to finalise
provincial teams to
agreements with defaulting munics. address the debt
• The FS MEC Finance is to set up a steering (meeting on 22 July „14)
committee to initiate a detailed and in-depth • TC is informing the
process to deal with the arrear debt. Premiers of the
Free State
(7 munics1)
• Final demand (letter of disconnection) sent to outstanding municipal
Ngwathe, Maluti-a-Phofung and Dihlabeng debt situation in their
municipalities – to disconnect 04 August 2014. respective provinces.
• Matjhabeng court date is 31 July 2014. • Eskom is in the process
of finalising signed
• Provincial Treasury and the MEC CogTA are debt acknowledgment
Gauteng involved in discussions with the defaulting munics and outstanding debt
(3 munics1) and to oversee the process. repayment plans with
• Payment plan agreements in place with all except defaulting munics.
Westonaria.
1- number of municipalities that are in the top 30 of defaulting municsThe increasing trend of overdue municipal debt
over the last few years
We are in the process of determining a trend and year end projection by taking consideration of
the „aggregate‟ of the signed payment plans, higher „winter‟ tariffs and some probability & risk factor.
(interim projection = R4billion)
The trend is for the overdue municipal debt to double
to a new base following the „winter‟ period.
What has changed over time:
• Eskom tariffs increasing
• Economic downturn
• Increasing inadequacy of equitable share funding – historically was sufficient to settle outstanding electricity debt
• Instability of key positions in municipalities
• Poor revenue collection and increasing number of creditors in municipalities
** Eskom‟s payment terms is 15 days; however, the focus is on managing arrear debt >30 days as many munics have collection periods of 30 days. Also, „Free
Basic Electricity‟ accounts are payable in 30 days.Factors underlying the municipal debt situation
Various drivers are understood but out of Eskom‟s direct control
Main issues/ drivers (from an Eskom perspective)
• Inadequate skills/ resources in Municipalities
Skills • Separation of financial and technical duties within
competency Municipalities,
• High turnover in management and key staff and
prolonged acting positions in Municipalities
• Municipal Billing system not always functional
Revenue • Losses and ineffective revenue collection
Management • Penalties when exceeding NMD due to bad load
management
• Municipality electricity revenue not ring-fenced
Municipal • Ineffective sales forecasting and budgeting processes
Arrear Debt Cash Flow
• Eskom billing dates vs Municipal billing dates to their
customers
• Municipal equitable share payments to municipalities
have reduced and are no longer able to cover
Funding municipal arrear debt
• Dependency on funding to settle outstanding
municipal debt
• Municipality tariff structure not always cost reflective
Tariffs • Inadequate capacity within municipalities regarding
electricity tariffs practises and philosophies
2014/07/28
• Root causes cannot be tackled directly by Eskom and will embrace indirect ways of reducing
municipal debtThank you
You can also read