Chapter 1: The science of climate change - AWS
←
→
Page content transcription
If your browser does not render page correctly, please read the page content below
Chapter 1:
The science of climate
change
Climate change is already happening, and past emissions have locked in further change. By signing
up to the Paris Agreement, the world has committed to take action on climate change. Nations are
responsible for determining how they will contribute to global efforts to limit warming to well below
2°C and pursue efforts to limit it to 1.5˚C above pre-industrial levels and reduce the risks and impacts
of climate change. Aotearoa has set itself the goal in the Climate Change Response Act of
contributing to efforts to limit temperature increases to 1.5˚C above pre-industrial levels.

This chapter explores the science on climate change and sets out why urgent action is needed,
looking at what effect our current behaviour has and what is at stake. It examines the forces
affecting the global temperature, the role of different greenhouse gases and the possible emissions
reduction pathways to meeting the 1.5˚C limit.

                                                                                                       1
                     1 February 2021 Draft Supporting Evidence for Consultation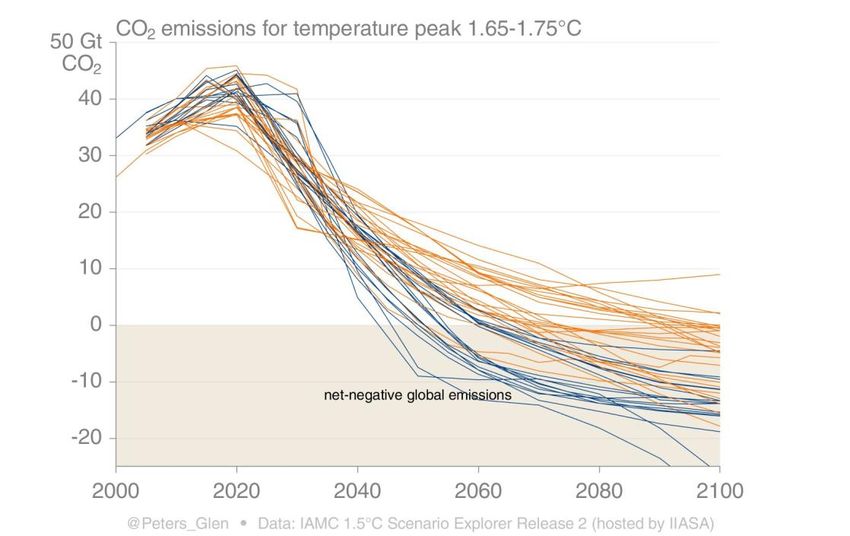
Contents
Chapter 1: .................................................................................................................................... 1
The science of climate change ...................................................................................................... 1
1.1 Introduction ........................................................................................................................... 3
   1.1.1 We are seeing the effects of climate change now...................................................................... 4
   1.1.2 Looking ahead ............................................................................................................................ 7
   1.1.3 The world has committed to limit climate change .................................................................... 7
1.2 The main greenhouse gases and global 1.5°C pathways ........................................................... 8
   1.2.1 The three main greenhouse gases – carbon dioxide, methane and nitrous oxide ................... 9
   1.2.2 Effects of long-lived and short-lived greenhouse gas emissions on climate ........................... 12
   1.2.3 What reductions are required to limit warming to 1.5°C? ...................................................... 12
   1.2.4 What is ‘overshoot’ in the IPCC models? ................................................................................. 15
   1.2.5 1.5°C compatible pathways: the reductions in greenhouse gases needed to limit warming . 16
   1.2.6 Trading reductions and removals within the 1.5°C compatible pathways .............................. 17
   1.2.7 When are the reductions in methane needed and why? ........................................................ 21
1.3 How different are the pathways that limit warming to 1.5°C to those that limit warming to well
below 2°C? ................................................................................................................................. 23
1.4 References ........................................................................................................................... 25

                                                                                                                                                   2
                             1 February 2021 Draft Supporting Evidence for Consultation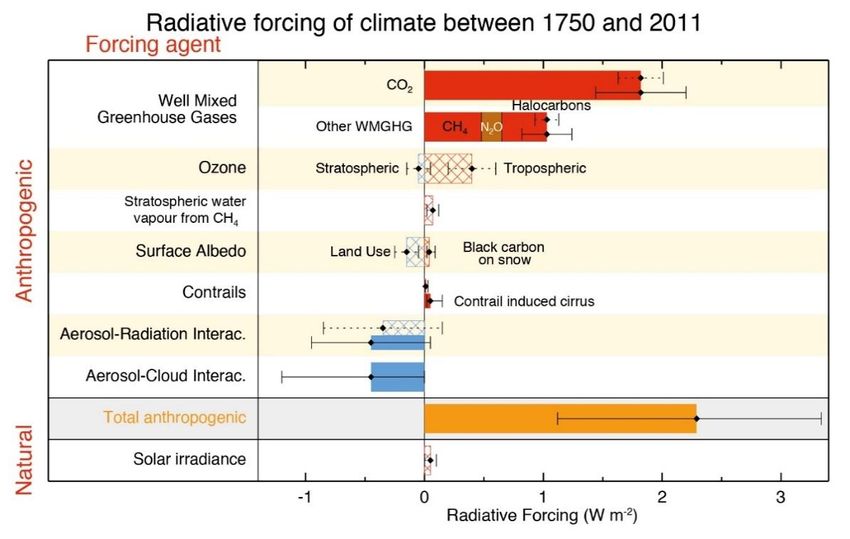
Climate change is already happening, and past emissions have locked in further change. By signing
up to the Paris Agreement, the world has committed to take action on climate change. Nations are
responsible for determining how they will contribute to global efforts to limit warming to well below
2°C and pursue efforts to limit it to 1.5˚C above pre-industrial levels and reduce the risks and impacts
of climate change. Aotearoa has set itself the goal in the Climate Change Response Act of
contributing to efforts to limit temperature increases to 1.5˚C above pre-industrial levels.

This chapter explores the science on climate change and sets out why urgent action is needed,
looking at what effect our current behaviour has and what is at stake. It examines the forces
affecting the global temperature, the role of different greenhouse gases and the possible emissions
reduction pathways to meeting the 1.5˚C limit.

1.1 Introduction
Scientists have understood the role of greenhouse gases in global climate systems for more than 160
years.1 The sun’s energy warms the earth and it is the ability of greenhouse gases to trap this
warmth that makes life on earth possible. Without them, the average temperature of the earth
would be around -18°C.2

Forty years after the greenhouse effect was discovered, scientists recognised the role that human
activities could have in changing the global climate. In 1896, Swedish chemist Svante Arrhenius
surmised burning coal to power the Industrial Revolution would heat the Earth, although he thought
it would take hundreds or thousands of years for this to happen.3

1
  Eunice Foote discovered the absorption of thermal radiation by carbon dioxide and water vapour in 1856. In
1859, John Tyndall discovered that carbon dioxide and methane were strong absorbers of infrared radiation,
and thus were able to trap heat radiating from the earth’s surface. (Jackson, 2020)
2
  (Lang, 2010)
3
  (Arrhenius, 1896)

                                                                                                               3
                      1 February 2021 Draft Supporting Evidence for Consultation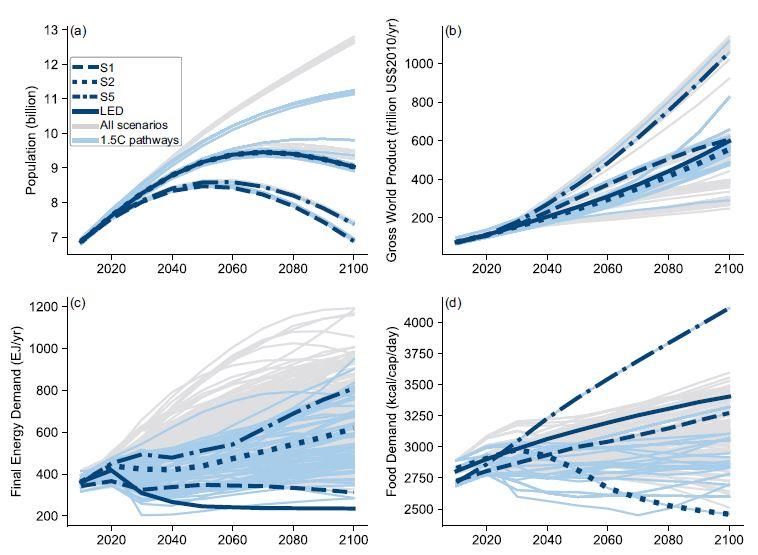
Box 1.1: Identifying the human fingerprint in global warming
Research combining observations of the factors that can affect global temperature has identified
how much of the observed warming is due to natural variation, and how much is driven by human
emissions of greenhouse gases. Natural factors include things like changes in solar activity, volcanic
eruptions, and changes in ozone and aerosols like sulphur.4 Human activities include burning of fossil
fuels, methane and nitrous oxide emissions from agriculture, and carbon dioxide released from
burning forests and land-use change.

If natural drivers of climate change were the only forces at play, the world’s climate should be stable
or cooling. Instead, human activities are driving significant increases in global air and ocean
temperatures and related changes to the planet (Figure 1.1).

                         Figure 1.1: Human forces affecting global temperature 5

1.1.1 We are seeing the effects of climate change now

Those early predictions of human-driven climate change have since been borne out. Human
activities are estimated to have warmed the planet by approximately 1°C since the start of the
Industrial Revolution.6 More than half this warming has occurred since 1980. If the observed rate of
warming were to continue, the world would reach 1.5°C of warming around 2040.7

This human-driven warming is already affecting the planet. The IPCC 5th Assessment Report (IPCC-
AR5) concluded that:

'Recent climate changes have had widespread impacts on human and natural systems on all
continents and across the oceans'. Attributable impacts included an impact of climate change on

4
  An aerosol is a particle that is small enough to be suspended in the air. For example, dust, smoke, fog and
mist. They can be natural, like water droplets in fog or dust, or human-caused, like smoke from household fires
or sulphur dioxide from burning oil. Around 90% of all aerosols come from natural sources. (Voiland, 2010)
5
  (NASA Earth Observatory, 2010)
6
  (IPCC, 2018b)
7
  (IPCC, 2018b)

                                                                                                             4
                      1 February 2021 Draft Supporting Evidence for Consultation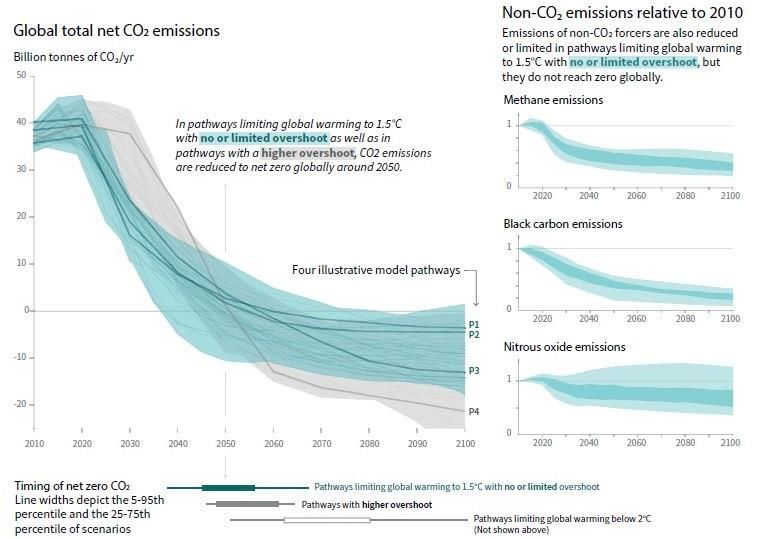
crop yields, shrinking glaciers and changing rainfall patterns affecting water availability and
changing geographic ranges of species on land and ocean8’.
Closer to home, we are already seeing the impacts of warming in Aotearoa. Average temperatures,
and temperature extremes, are increasing significantly in many parts of the country, while winters
are getting warmer and drier. Average sea level has increased by nearly 30cm since records began
over 100 years ago, and the rate of sea-level rise is accelerating. At the same time, we are observing
a range of physical and environmental impacts from these changes - coastal erosion rates are
increasing, coastal flood frequency is increasing, growing seasons are changing and environments
are becoming uninhabitable for some of our native species.9
These changes are also having impacts on people and the economy. A recent study conservatively
estimated that the contribution of climate change to floods and droughts cost Aotearoa $840 million
in insurance claims and economic losses over the 10 years to 2017.10 Local Government New
Zealand has estimated that approximately $5 billion of roading, water infrastructure, buildings and
other assets would be exposed under 1 metre of sea level rise.11
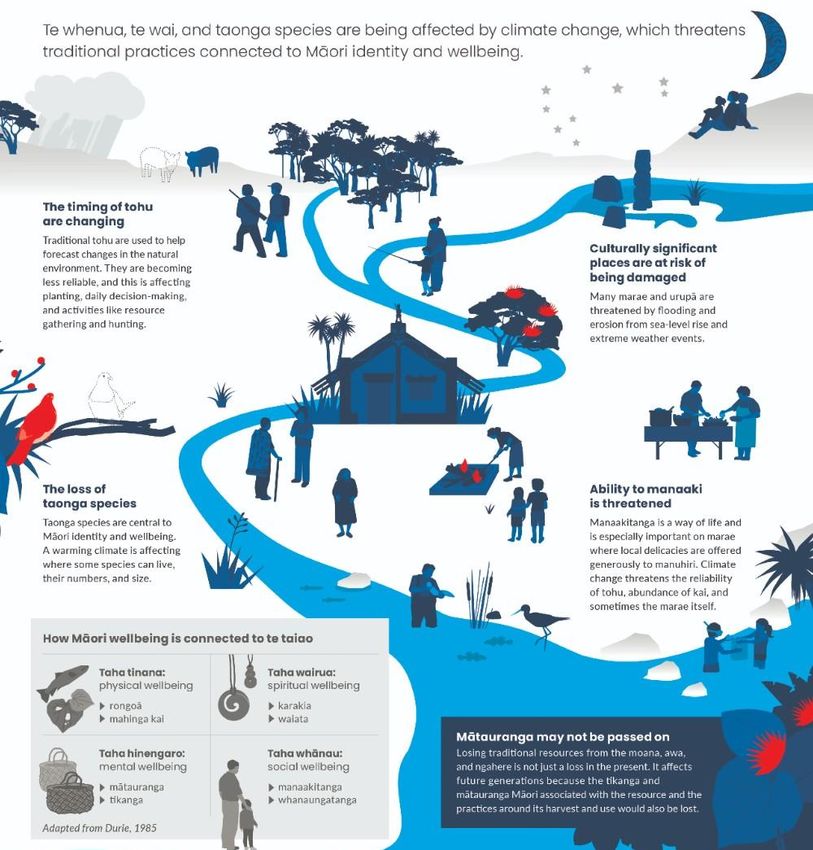
Box 1.2: Iwi/Māori are also observing many changes in the environment that affect customary
practices and values.
The numbers and distributions of taonga species are changing. Species are turning up at times and in
places where they have not before. For example, mullet in Northland can now be caught year-round,
something that never happened in the past.12 Kingfish – a species unknown to early Ngāi Tahu – is
being caught in increasing numbers along the east coast of the South Island, Te Waipounamu.
Traditional tohu (environmental indicators) are also changing. The flowering of pōhutukawa has
traditionally been a sign that kina were ready for harvest. However, changes in sea temperatures
have altered the reproductive period of kina,13 meaning that kina are no longer ready for harvesting
when pōhutukawa traditionally bloom in summer (Figure 1.2).
The physical impacts of climate change are also affecting special places such as marae and urupā
(burial grounds). In particular, coastal sites are at increasing risk of flooding from sea-level rise, and
erosion.14 For example, rising seas led to a 700-year-old urupā at Ōkūrei Point in Maketū collapsing
onto the beach below.15 In other areas, urupā at risk from flooding have already had to be relocated.
All in all, climate change is having and will have significant and wide-ranging impacts on iwi/Māori.
As the latest state of the environment report on atmosphere and climate notes:
“Climate change can contribute to degradation in the mauri (life force) of ecosystems and taonga
species, and jeopardise the mātauranga associated with them. When a taonga species is lost, the
8
(Committee on Climate Change, 2019, p. 57)
9
(Ministry for the Environment & Statistics NZ, 2020)
10
(Frame et al., 2018)
11
(Simonson & Hall, 2019)
12
(Te Hiku o te Ika Development Trust, 2018) cited in (Ministry for the Environment & Statistics NZ, 2020, p.
53)
13
(Ministry for the Environment & Stats NZ, 2019)
14
(Colliar & Blackett, 2018)
15
(Neilson, 2019)
5
1 February 2021 Draft Supporting Evidence for Consultation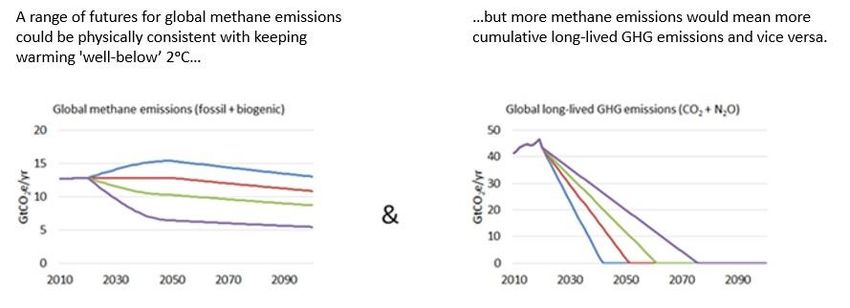
whakapapa (lineage or ties) between iwi, hapū, whenua (land), and taonga is severed. The ability of
tangata whenua to act as kaitiaki (guardians) over the taonga, and to engage in mahinga kai
practices within their rohe (region) can also be degraded” 16

“[…]Climate change is likely to affect marae and customary harvesting grounds, and cause major
shifts in how whānau practice manaakitanga. Coastal marae may become inaccessible due to
increased flooding. A loss of taonga species would mean whānau were no longer able to provide local
delicacies to manuhiri. A combination of these situations could see some whānau unable to manaaki
on their marae as they have for generations. The inability to gather kaimoana also has economic
consequences because this practice has always supplemented low incomes and diet.”17

                       Figure 1.2: Climate change and Māori-collective wellbeing18

16
   (Ministry for the Environment & Statistics NZ, 2020, p. 54)
17
   (Patuharakeke Te Iwi Trust Board Inc., 2014) cited in (Ministry for the Environment & Statistics NZ, 2020, p.
55)
18
   (Ministry for the Environment & Statistics NZ, 2020, p. 56)

                                                                                                                   6
                       1 February 2021 Draft Supporting Evidence for Consultation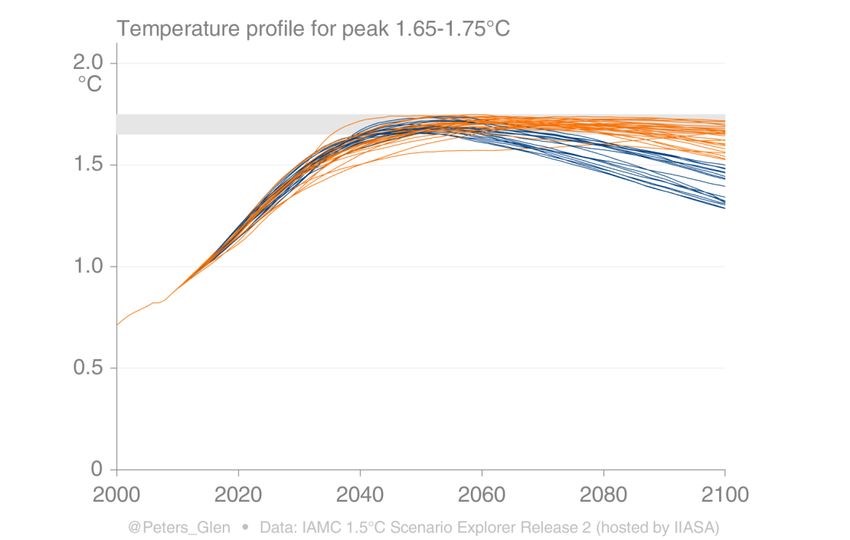
1.1.2 Looking ahead
Climate risks will be significantly lower in years to come if warming is limited to 1.5°C rather than
2°C. In a 2°C world, sea levels are projected to rise further, there would be more species’ loss, and
almost all the world’s coral reefs would be destroyed. Hundreds of millions more people would be
exposed to climate-related risks, including risks to health, water supply, food security and economic
growth.19

1.1.3 The world has committed to limit climate change
Under the Paris Agreement, most of the world has agreed to take action to limit climate change.
Recognising the risks of uncontrolled warming, nations have signed up to efforts to:

“Hold the increase in the global average temperature to well below 2°C above pre-industrial levels
and pursue efforts to limit the temperature increase to 1.5°C above pre-industrial levels, recognising
that this would significantly reduce the risks and impacts of climate change”

“Increase the ability to adapt to the adverse impacts of climate change and foster climate resilience
and low greenhouse gas emissions development, in a manner that does not threaten food
production.” 20

Under the Paris Agreement, individual nations have the right to determine what specific actions they
will take as part of their contribution to global efforts. They can undertake both domestic and
international actions that reflect where there are opportunities to reduce emissions, and that also
recognise their own specific culture, society, economy and environment. However, the Agreement
also requires ‘highest possible ambition’ contributions from all parties,21 with developed countries
taking the lead.22

Aotearoa has recently set out how it will act to reduce its own emissions. Under the Climate Change
Response Act, the government is required to contribute to efforts to limit warming to 1.5°C above
pre-industrial levels. The Act establishes a domestic emissions reduction target for greenhouse gases
for 2050. This target is to reduce biogenic methane emissions to 10% below 2017 levels by 2030 and
24-47% below 2017 levels by 2050, and reduce all other greenhouse gas emissions to net zero by
2050.

The Act also established the Climate Change Commission, whose role is to provide advice to the
government on the reductions in emissions over time that would ensure Aotearoa meets those
targets, in the form of five-yearly emissions budgets. Critical for the Commission in providing this
advice is an understanding of the size and rate of reductions in different greenhouse gases and any
other actions, that may be required to limit warming to 1.5°C degrees above pre-industrial levels.

In providing its advice, the Commission needs to consider what other countries are doing to tackle
their emissions and to scope the opportunities and potential impacts for Aotearoa in reducing our

19
   (IPCC, 2018a)
20
   Paris Agreement, Article 2 (United Nations, 2015).
21
   Paris Agreement, Article 4.3 (United Nations, 2015).
22
   Paris Agreement, Article 4.4, 9.3 (United Nations, 2015).

                                                                                                         7
                       1 February 2021 Draft Supporting Evidence for Consultation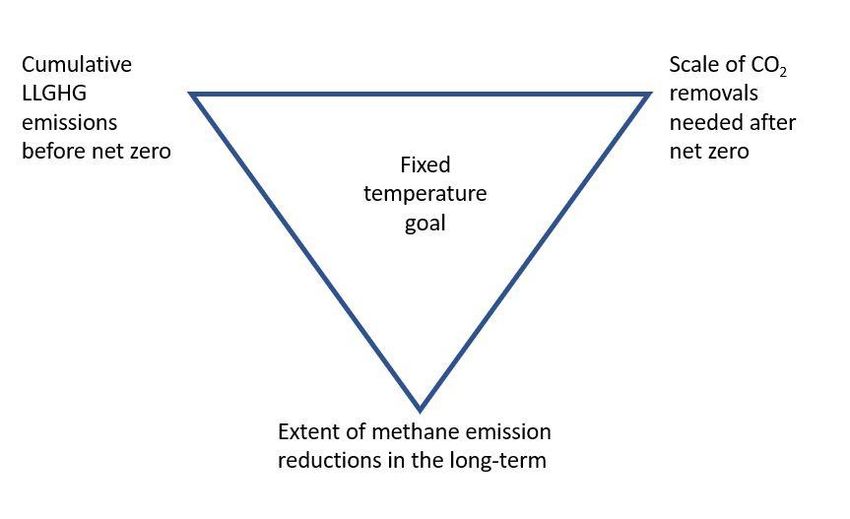
emissions. The Commission is required to understand potential impacts for iwi/Māori. There is also
an opportunity to learn from tangata whenua and how indigenous kaitiaki models can inform
emissions reductions.

Through an additional request from the Minister, the Commission has also been tasked with
considering the long-term reductions in our biological methane emissions that would be that
compatible with limiting warming to 1.5°C. The Commission is also required to consider whether our
international commitments, in the form of our Nationally Determined Contribution, is compatible
with this goal. Our advice on these two questions is provided in the Commission’s Advice report,
chapters 8 and 9.

The remainder of this chapter sets out the scientific basis of the challenge we face to limit warming
to 1.5°C. It sets out the properties of the main greenhouse gases – carbon dioxide, methane and
nitrous oxide. It then sets out the effects they have individually and collectively on the climate and
the implications for strategies to reduce emissions and warming.

1.2 The main greenhouse gases and global 1.5°C pathways
The following section outlines the scientific understanding of emission pathways compatible with
limiting warming to 1.5°C above pre-industrial levels. The section draws primarily on the
Intergovernmental Panel on Climate Change’s (IPCC) Special Report on limiting warming to 1.5°C as
well as other more recent papers and reviews.23

Box 1.3: The Intergovernmental Panel on Climate Change

The Intergovernmental Panel on Climate Change (IPCC) was established by the United Nations as its
body for assessing the science related to climate change. It was established in 1988 with the purpose
of providing “policymakers with regular scientific assessments on climate change, its implications
and potential future risks, as well as to put forward adaptation and mitigation options.”24

The IPCC draws on the peer-reviewed research and expertise of the world’s climate scientists and
identifies the state of knowledge about climate change and its impacts, as well as identifying where
more research is needed. Its reports are extensively reviewed throughout their production to ensure
objectivity and transparency.

The main reports the IPCC produces are Assessment Reports, which provide extensive assesments of
the state of knowledge. The fifth IPCC Assessment Report was produced in 2014, with the sixth due
in 2022.

The IPCC also produces special reports that go into more detail on specific issues. In 2018, it
produced a report on the advantages, opportunities and challenges of limiting warming to 1.5°C
above pre-industrial levels.25 The conclusions of this report have been instrumental in many nations
setting goals of limiting warming to 1.5°C, including here in Aotearoa.

23
   (Forster et al., 2021; IPCC, 2018a)
24
   (IPCC, 2020)
25
   (IPCC, 2018a)

                                                                                                         8
                        1 February 2021 Draft Supporting Evidence for Consultation
In 2019, the IPCC also produced a special report on climate change and land. This report addressed
greenhouse gas emissions and removals in land-based ecosystems, land use and management in
relation to climate change mitigation and adaptation, as well as desertification, land
degradation and food security.26
The Commission has drawn heavily on these and other IPCC reports in producing its advice. Over
time we will update and reassess any relevant conclusions as new IPCC reports are produced.
This section and the rest of the report is focused on the gases that are emitted as a result of human
activities and are responsible for driving changes in the earth’s climate system. As well as being the
gases that are driving increases in temperature, sea levels, rainfall patterns and extreme weather.
They are also the gases that we are able to do something about.
The section first outlines the fundamental properties and impacts of the different greenhouse gases
humans emit, before presenting the high-level results on global pathways compatible with the 1.5°C
goal. The section then specifically examines the different effects of cuts to short- and long-lived
greenhouse gases and the potential role of carbon dioxide removals from the atmosphere.
1.2.1 The three main greenhouse gases – carbon dioxide, methane and nitrous oxide
The impact that a greenhouse gas has on the climate depends on 1) its ‘power’ on a molecule-by-
molecule basis and 2) its concentration in the atmosphere. This impact can be expressed as the
‘radiative forcing’ of that gas – a measure of how much that gas is driving the changes in
temperature and climate (Figure 1.3).
Human caused
Natural
Figure 1.3: Estimates of radiative forcing of different greenhouse gases and other agents between
1750 and 201127.
26
(IPCC, 2019)
27
(IPCC, 2014a, p. 697, Figure 8.15)
9
1 February 2021 Draft Supporting Evidence for ConsultationCarbon dioxide is the most important greenhouse gas produced by human activities. Although it is
not a particularly powerful greenhouse gas in itself, carbon dioxide is very long-lived, meaning that
carbon dioxide released today can still be causing warming centuries or millennia into the future. It
is the greenhouse gas the world is emitting the most of – more than 40 billion tonnes in 2018,28 and
emissions have been increasing at around 1% per year over the last decade.29
Carbon dioxide is also the greenhouse gas that has the highest concentration in the atmosphere
(Figure 1.4). The rates of addition of carbon dioxide to the atmosphere from human activities are
100 times faster than from natural sources like volcanoes.30 Of the human sources of carbon dioxide,
burning coal is the most significant globally, followed by gas and then oil.31 Overall, carbon dioxide is
responsible for the majority of human-driven warming to date.32
Figure 1.4: Observed changes in atmospheric greenhouse gas concentrations. Atmospheric
concentrations of carbon dioxide (CO2, green), methane (CH4, orange) and nitrous oxide (N2O, red).
Data from ice cores (symbols) and direct atmospheric measurements (lines) are overlaid33.
28
A Gigatonne is a billion tonnes, or 1,000,000,000. To give an idea of scale, a Gigatonne is equivalent to the
volume of 3 million Boeing 747’s, or 20,000 Titanics.
29
(Ministry for the Environment & Statistics NZ, 2020)
30
(Parliamentary Commissioner for the Environment, 2019, p. 48)
31
Based on 2018 figures, coal makes up 40% of total human carbon dioxide emissions, oil makes up 34% and
gas makes up 20%. The bulk of the remainder comes from cement production and flaring of natural gas.
(Ritchie & Roser, 2020)
32
(IPCC, 2014a, p. 678, Table 8.2)
33
(IPCC, 2014b, p. 44, Figure 1.3)
10
1 February 2021 Draft Supporting Evidence for ConsultationMethane is the second most important greenhouse gas and is responsible for around a fifth of
human-driven warming. Molecule for molecule, methane is much powerful than carbon dioxide.34
However, methane is a short-lived greenhouse gas. It has an intense warming effect for the first few
decades after it is emitted, but this effect dissipates as the methane breaks down in the atmosphere
(Figure 1.5). However, a small proportion of methane-induced warming will linger much longer due
to the inertia of the climate system and indirect feedback effects.3536
Figure 1.5: Top: Tonne for tonne, methane causes more warming than carbon dioxide over at least
200 years. Bottom: Aotearoa emits different quantities of different greenhouse gases, which affects
the warming they cause and how quickly the warming dissipates from the atmosphere.37
Due to the ‘power’ of the different gases and the time they stay in the atmosphere, emitting the
same amount of each gas would have very different impacts on the climate. Over approximately 200
years, one tonne of methane would cause more warming than one tonne of carbon dioxide.
34
(IPCC, 2014a, pp. 731–738, Appendix 8.A)
35
While each emission of methane has a relatively short-lived impact on air temperatures, most of the
warming it causes is taken up by the oceans. Indeed, Ocean warming accounted for more than 90% of the
energy accumulated in the climate system between 1971 and 2010. (IPCC, 2014b)
36
(Reisinger, 2018)
37
Figure is based on 2016 emissions in Aotearoa. (Interim Climate Change Committee, 2019, p. 25, Figure 3.4)
11
1 February 2021 Draft Supporting Evidence for ConsultationNitrous oxide is a powerful greenhouse gas38 and is relatively long-lived in the atmosphere. As a
result, it has similar warming dynamics to carbon dioxide over decadal-to-centennial timeframes.
However, emissions of nitrous oxide are much lower than carbon dioxide or methane and as a result
it contributes less to human-driven warming - at around 5%.
1.2.2 Effects of long-lived and short-lived greenhouse gas emissions on climate
Long-lived gases accumulate in the atmosphere – they are effectively being added faster than they
are being removed.39 Therefore, a constant rate of emissions leads to increasing concentrations and
more warming.
Short-lived gases do not last as long in the atmosphere, so a constant rate of emissions would
eventually lead to a constant concentration. This in turn leads to a constant level of warming,
although this effect can take time to stabilise. For example, a constant rate of methane emissions
would take more than a century to stabilise the concentration of methane and increase the warming
effect by about a third.40
The different lifetimes and effects of long- and short-lived gases means different actions are
required to reduce their effect on the climate.
Emissions of long-lived gases need to drop to zero to stop warming. In comparison, any reduction in
the rate of emissions of short-lived gases will lead to less warming. The more that they are reduced,
the greater the reduction in the warming.
Reducing emissions of short-lived gases can have immediate impacts on the amount of warming that
occurs but, to ultimately stop warming, it is the emissions of long-lived gases – and of carbon dioxide
in particular – that need to reduce to zero.
1.2.3 What reductions are required to limit warming to 1.5°C?
The IPCC Special Report on Global Warming of 1.5°C outlines the science on what global pathways
are consistent with limiting warming to 1.5°C. In considering the pathways that are consistent with
limiting warming to 1.5°C, the report draws on peer-reviewed modelling studies that are not based
solely on atmospheric science, but also consider the feasibility and costs of reducing emissions
across sectors and gases, using a range of socio-economic scenarios.
The IPCC report shows that limiting warming to 1.5°C will require rapid emission cuts of greenhouse
gases between now and 2030, then slower reductions until the end of the century. The 1.5°C
38
(IPCC, 2014a, pp. 731–738, Appendix 8.A)
39
Scientists talk about the ‘lifetime’ of a greenhouse gas in the atmosphere. The lifetime estimate is made up
of how long an individual molecule stays in the atmosphere, which is known as the turnover time, and the time
it takes for the atmospheric concentration to return to around 37% of its initial value following a one-off
emission – known as the perturbation time. For carbon dioxide, the turnover time for an individual molecule
can be as short as days or weeks. For example, carbon dioxide that is stored in a leaf may be quickly released
back into the atmosphere once it decays, whereas another molecule may be stored in the wood of a tree for
decades before it is released. However, carbon is only permanently removed from the atmosphere very slowly
– through processes like ending up buried in marine sediments when sea creatures die. As a result, the
perturbation lifetime of carbon dioxide in the atmosphere is centuries to millennia.
40
(Reisinger, 2018)
12
1 February 2021 Draft Supporting Evidence for Consultationcompatible pathways show different pathways and reduction levels for the main greenhouse gases,
which reflects their different warming properties and impacts. However, the compatible pathways
have several features in common:
o Emissions of carbon dioxide and other greenhouse gases need to peak in the 2020s then
rapidly reduce through the 2030s and 2040s.
o Gross emissions of long-lived greenhouse gases need to be near-zero by 2050. Most of the
pathways have some remaining gross emissions in 2050 from hard-to-abate sectors: for
example, carbon dioxide produced from cement manufacturing and nitrous oxide from
agriculture. As a result, emission removals are required in the pathways to ensure net
emissions reach zero.
o Emissions of short-lived gases such as methane need to reduce significantly through the next
20 years, but not necessarily to zero by 2050 or 2100.
Box 1.4: IPCC pathways, Representative Concentration Pathways and other key assumptions
The IPCC pathways for future warming contain a range of assumptions about economic growth,
technology developments and lifestyles. The IPCC modelling found 1.5°C compatible pathways that
covered a broad range of possible future developments across economic and demographic changes.
41
The IPCC developed four archetype scenarios to illustrate the breadth of possible 1.5°C trajectories
the world could take. The four scenarios are:
S1 – A pathway based on sustainable development and a global focus on technology and behaviour
change
S2 – A pathway with moderate assumptions about technology and population growth
S5 – A fossil-fuel intensive scenario, with a high reliance on carbon capture and storage and
significant overshoot of the 1.5°C threshold
LED – Low energy demand. A scenario with a stronger focus on energy efficiency.
Figure 1.6 illustrates the range of assumptions in these scenarios in population growth, world gross
domestic product, global energy demand and global food demand. All 1.5°C scenarios are included in
light blue; all other scenarios are included in grey; the four illustrative scenarios are highlighted in
dark blue.
41
The IPCC also found that some features of global pathways are strong impediments to reaching the 1.5 °C
goal (IPCC, 2018a, p. 95). Keeping to 1.5°C was particularly difficult in global development pathways that
included:
o a lack of global cooperation
o high global inequality
o high population growth, or rapidly growing resource-intensive consumption (section 2.3.1.1 (IPCC,
2018a, pp. 109–110))
13
1 February 2021 Draft Supporting Evidence for ConsultationFigure 1.6: Range of assumptions and drivers in scenarios modelled by the IPCC42.
Figure 1.7 illustrates that keeping warming to 1.5°C is not dependent on a particular technology, or
any single future pathway for global development. There is a range of possible futures where the
1.5°C goal is achieved.
The modelled pathways that were the most difficult to keep warming to 1.5°C were those with
significant fossil-fuel development (SSP5), low global cooperation (SSP3) or high global inequality
(SSP4). The middle-of-the-road assumptions (SSP2) with limited global cooperation, some
technological progress and medium population growth, were still compatible with keeping to
1.5°C43.
A key conclusion from the scenarios that are compatible with limiting warming to 1.5°C is that they
all assume global population and food demand will increase over the course of the century, although
42
(IPCC, 2018a, p. 111, Figure 2.4)
43
Four out of six models found 1.5°C compatible pathways in the SSP2 scenario.
14
1 February 2021 Draft Supporting Evidence for Consultationsome of the scenarios expect both population and food demand to drop by 2100.
Figure 1.7: Global 1.5°C emission pathways used by the IPCC44
1.2.4 What is ‘overshoot’ in the IPCC models?
Most of the scenarios that the IPCC modelled overshoot 1.5°C warming to some extent before
returning back to 1.5°C in the second half of the 21st century. To bring warming back down, they
require removing carbon dioxide from the atmosphere – for example, by sequestering carbon
dioxide in permanent forests or using carbon capture and storage – or deeper reductions in methane
and other short-lived gases.
The IPCC classified different modelled pathways based on how much they would overshoot 1.5°C
(Table 1.1) and concluded that pathways with little or no overshoot were the most likely to limit
warming to 1.5°C. These pathways were also assessed as the ones most likely to lead to the best
overall social, economic and environmental outcomes. 45
Pathways with higher overshoot allow more gradual reductions in gross emissions, however they
rely on deploying large scale emissions removal technologies after 2050. For example, the pathways
that assume slower reductions in fossil fuel use require carbon dioxide sequestration to scale up to
around a third of current global CO2 emissions levels by 2050.
44
(IPCC, 2018b, p. 13, Figure SPM.3a)
45
(IPCC, 2018a)
15
1 February 2021 Draft Supporting Evidence for ConsultationTable 1.1: The IPCC classified the 1.5°C pathways based on how much they would overshoot 1.5°C46
Level of overshoot Description
No overshoot Pathways limiting peak warming to below 1.5°C during the entire 21st
century with at least 50% likelihood.
Limited overshoot Pathways limiting median warming to below 1.5°C in 2100 and with a
50–67% probability of temporarily overshooting that level earlier,
generally implying peak warming of less than 1.6°C.
Higher overshoot Pathways limiting median warming to below 1.5°C in 2100 and with a
greater than 67% probability of temporarily overshooting that level
earlier, generally implying peak warming of 1.6-1.9°C.
There are significant risks that the scale of emission removal technologies required in these high
overshoot pathways may not be feasible. To date, none of these technologies have been trialled or
used at scale. In many of the pathways the required levels of deployment exceed recent literature
assessments of the potential for their deployment by the middle of the century.47
Afforestation and reforestation are also unlikely to provide the scale of emissions reductions
required to bring temperatures back down in high-overshoot pathways. This is because reforesting
removes carbon that was originally emitted from deforesting in earlier decades (or centuries). While
afforestation can be thought of as capturing the emissions associated with the deforestation, it does
not undo the emissions associated with fossil fuel combustion and cannot alone be relied upon to
ensure net zero targets are met.
The higher overshoot pathways are also associated with higher levels of climate change impacts due
to the higher warming experienced throughout the 21st century. Higher overshoot pathways would
mean that future generations would have to deal with more severe climate impacts and adaptation
challenges at the same time as needing to deliver large scale emissions reduction technologies to
compensate for delayed action from the present generation.
Based on the above analysis, we have excluded pathways with higher overshoot from our analysis of
1.5°C compatible pathways – both for the globe and for Aotearoa.
1.2.5 1.5°C compatible pathways: the reductions in greenhouse gases needed to limit
warming
From here on, we refer to pathways that are compatible with limiting warming to 1.5°C with no or
limited overshoot as ‘1.5°C compatible pathways.’
Within the IPCC 1.5°C compatible pathways there are a wide range of assumptions that feed into the
models. Some of these are less likely than others. For example, some of the pathways assume slower
reductions in gross emissions which are then offset by removals in the order of 7 to 13 Gt carbon
dioxide each year.
46
Table 2.1, (IPCC, 2018a, p. 100)
47
(IPCC, 2018b, p. 17)
16
1 February 2021 Draft Supporting Evidence for ConsultationRemovals of emissions on this scale rely on technologies like carbon capture and storage (CCS) that
are very expensive or are not yet widely in use. For example, CCS has been deployed at only a small
scale globally. In 2020 there were 59 facilities operational with a capacity of 127 Mt carbon dioxide
per year.48 Bioenergy with carbon capture and storage (BECCS) is only a small subset of wider CCS
deployment. According to the global CCS institute, as of 2019, five facilities globally were using
BECCS, capturing a total of 1.5 Mt carbon dioxide per year.49 Other pathways assume unrealistically
optimistic emission reductions in the near term – reaching net zero carbon dioxide globally as early
as 2036.
Excluding the most unrealistic pathways gives the following reductions in net carbon dioxide, and
methane and nitrous oxide from agriculture in 2030 and 2050 (Table 1.2).50
Table 1.2: Reductions in greenhouse gas emissions in IPCC model pathways with no or limited
overshoot (interquartile range)
Greenhouse gas emissions Percentage change relative to 2010
2030 2050
Net carbon dioxide emissions -40 to -58% -94 to -107%
Agricultural methane emissions -11 to -30% -24 to -47%51
Agricultural nitrous oxide emissions +3% to -21% +1% to -26%
Box 1.5: New analysis since the IPCC 1.5°C report was released
Since the Fifth Assessment Report and the Special Report on 1.5°C there have been several
comparisons and assessments of the range of available climate models.52 One factor that has
improved in the models over time is how they model the sensitivity of the climate to the
greenhouse gases. The updated evidence on the sensitivity of the climate has narrowed the range
of possible response to future greenhouse gas emissions.53 As this revised uncertainty in the
Earth’s climate sensitivity largely affects the tails of the distribution, the central estimates of
projected warming remain similar to those shown in the Fifth Assessment Report and the Special
Report on 1.5°C.54 This gives us greater confidence that the emissions pathways presented in the
Special Report on 1.5°C provide a sound basis for describing the actions needed at a global level to
limit warming to 1.5°C.
1.2.6 Trading off reductions and removals within the 1.5°C compatible pathways
48
(Global CCS Institute, 2020)
49
(Consoli, 2019)
50
To exclude the most unrealistic pathways in our analysis, we have used the interquartile range of the IPCC
pathways scenarios.
51
This range provided the basis for the 2050 methane target in the Climate Change Response Act of 24-47%
below 2017 levels. Methane emissions in Aotearoa changed by less than 0.5% between 2010 and 2017, so a
later base year was used for easier comparison.
52
Including the sixth climate model intercomparison exercise.
53
(Sherwood et al., 2020)
54
(Forster et al., 2021)
17
1 February 2021 Draft Supporting Evidence for ConsultationThese pathways give the ranges of reductions for each gas that have been modelled to limit warming
to 1.5°C. They all require significant and rapid reductions in carbon dioxide and methane. Within
them, there are different combinations of reductions of the gases and emissions removals that can
potentially lead to the same warming outcomes. However, different combinations of actions can
have different implications on longer-term temperatures and impacts, and on the costs people face.
In the IPCC pathways, the level of cuts to methane emissions modelled in the long-term to be
compatible with the 1.5°C goal depends on two inter-related relationships:
1. the speed of reaching net zero for long-lived greenhouse gases, and
2. the extent to which we can rely on removal technologies.
First, there is a relationship between the rate of methane emissions globally in the period before
peak warming and the modelled cumulative long-lived greenhouse gas emissions from now (2020)
until the peak temperature is reached. The more long-lived greenhouse gases are reduced, the
relatively smaller reductions in methane are needed (Figure 1.8).
Figure 1.8: Stylised trajectories that illustrate the trade-off between global trajectories for methane
emissions caused by humans (fossil and biogenic sources) and long-lived GHG emissions using the
framework of Cain et al. (2019). Trajectories are constructed to keep expected peak warming to
approximately 1.75°C above pre-industrial levels.55.
Second, reductions in the rate of methane emissions have an equivalent effect on warming to net
removals of carbon dioxide, by immediately reducing the warming contribution of methane. In the
long-term, greater reductions in the rate of methane emissions reduce the world’s dependence on
carbon dioxide removal.56 Conversely, the more carbon dioxide removal that can be deployed, the
fewer methane reductions are required for the same temperature outcome. However, there are also
consequences for the climate from the temperature pathway up to and after the peak temperature,
which is affected by the relative trade-offs between methane reductions and net removals of carbon
dioxide. This is discussed in the next section.
Therefore, for a given temperature goal in the medium-long-term – out to 2050 and beyond – the
three factors can be balanced between each other with more emissions of one kind requiring
greater reductions of another (Figure 1.9):
55
(Forster et al., 2021)
56
(Forster et al., 2021; Parliamentary Commissioner for the Environment, 2018)
18
1 February 2021 Draft Supporting Evidence for ConsultationFigure 1.9: Interaction between the fixed temperature goal and various options
Box 1.6: What are metrics and how are they useful?
Greenhouse gas emissions metrics are used to quantify the contributions to climate change of
emissions of different gases. They can be thought of as exchange rates that allow different gases,
which have different heat trapping properties and lifetimes in the atmosphere, to be compared
using a common scale.
Metrics commonly relate the climate effects of emissions to those of carbon dioxide (CO2). A
formula or weighting factor is used to convert mass units (e.g. tonnes) of non-CO2 gas emissions
into CO2 equivalent emissions (CO2e). This aims to equate the non-CO2 gas emissions to an
amount of carbon dioxide that would generate the same amount of warming.
Metrics are used in a range of contexts where there is a need to aggregate, compare or evaluate
emissions of multiple greenhouse gases. For example, they are used in:
1. Reporting, to express aggregate emissions of various gases, such as in national greenhouse
gas inventories or in ‘carbon footprints’ of products (lifecycle assessment).
2. Mitigation policy, to make decisions about the effort and cost warranted to reduce or avoid
the emission of a quantity of one gas as compared to another gas at a given time.
3. Evaluating pathways, to consider trajectories across different gases to reach climate policy
objectives, such as emission reduction targets or the 1.5°C temperature goal.
To date, the most well-known metrics used in climate policy and related literature are the Global
Warming Potential (GWP) and the Global Temperature change Potential (GTP). Recently, a new
metric called GWP* has been developed.
GWP compares gases based on the amount of carbon dioxide that would have produced the same
warming effect (‘radiative forcing’) over the same period as the gas being emitted. GTP compares
gases based on the actual warming they cause at a specific single future point in time. Both GWP
and GTP values depend on specific time horizons (i.e. how far into the future the climate effects of
each gas are considered). GWP* is a new variation on GWP. It compares a sustained change in the
rate of short-lived gas emissions with a one-off emission of carbon dioxide, rather than GWP’s and
GTP’s comparison of the climatic effects of one-off emissions of both types of gases.
Different metrics are suited to different purposes
19
1 February 2021 Draft Supporting Evidence for ConsultationThere is wide agreement across scientists that the appropriate choice of metric cannot be
determined by science alone but depends on broader policy contexts and goals and underlying
value judgements. 57 Different metrics have different strengths and weaknesses and there is no
one ‘correct’ metric that is useful for all purposes.
This can be illustrated by considering the GWP with a time horizon of 100 years (GWP100, the
metric adopted for reporting aggregate emissions under international agreements) with GWP*.
When GWP100 is used to look at mitigation scenarios over long timeframes, it does not provide
robust estimates of actual temperature outcomes.58 It does not give good information for making
decisions about trade-offs between reducing methane emissions vis-à-vis carbon dioxide
emissions when considering trajectories for, or compliance with, temperature targets such as the
1.5oC goal in the Climate Change Response Act.
GWP* was developed to provide a better representation of the warming impacts of methane
relative to those of carbon dioxide.59 In particular it better reflects the fact that a gas like methane
has a short lifetime in the atmosphere and captures the effects of increases or decreases to the
rate of methane emissions on temperature outcomes relative to that of carbon dioxide . Although
understanding of GWP* is still developing, it appears to be more suitable than GWP100 for
analysing global emissions reduction pathways to limit temperature increases.
However, GWP* is less useful in other accounting, reporting and domestic policy applications,
because:
• When applied to individual emitters rather than global emissions, its use would inherently
benefit those who start with higher emissions, i.e. it would have a grandparenting effect.
• It treats changes in the flow of methane emissions as permanent, whereas methane emissions
fluctuate from year-to-year, even if there is a long-term trend.
The first issue arises because GWP* estimates only the further effect on the climate from a
sustained change in methane emissions, relative to past emissions at a point in time. This leads to
results that do not reflect the total warming contribution from different emitters. For example,
two emitters with constant, ongoing emissions of 1 tonne and 100 tonnes of methane
respectively would both be assessed as having a CO2e warming effect of zero under GWP*, even
though the contribution to warming of the second is 100 times that of the former.
This raises questions of equity and fairness. If GWP* were used in domestic policy or to determine
emission reduction targets on a country-by-country basis, it would entitle those with higher
methane emissions initially to keep emitting more than those starting from a lower point.
GWP* also has a built-in assumption that that changes in methane emissions are sustained in
perpetuity. This means it places a hundred-fold higher value on any change in methane emissions
than GWP100 does on annual methane emissions.
This does not accurately reflect how emitters behave. Farmers changing their production and
consequently their methane emissions, do not necessarily make these decisions in perpetuity.
Rather, they may adjust their activity due to temporary factors such as market prices or drought.
Changes to methane emissions that are relatively small under GWP100 are much larger under
GWP*. This could cause targets to be missed despite a long-term reducing trend and may not
send steady policy signals. For example, if a dairy farmer added one cow to their herd in a given
year and that cow emitted 100 kg of methane, this would be the equivalent of emitting 250 tCO2
57
(Hollis et al., 2016; IPCC, 2009; Levasseur et al., 2016; Tanaka et al., 2013)
58
(Allen et al., 2016)
59
(Allen et al., 2016)
20
1 February 2021 Draft Supporting Evidence for Consultationin that year under GWP*, rather than 2.5 tonnes under GWP100. If these emissions were priced,
this would incur a one-off liability of $8,750, assuming an emissions price of $35/tonne.
GWP100 provides a more stable way of accounting and reporting greenhouse gases and is the
metric required for emissions budgets under the Climate Change Response Act. Its use for this
purpose is not inaccurate as this does not involve assessing warming impacts. In Aotearoa, the
split-gas 2050 target already reflects the different warming effects of biogenic methane.
Finally, use of metrics is not always necessary. In the Commission’s mitigation pathway analysis,
we have applied a split-gas framework that avoids the use of metrics to compare methane with
other gases or trade off emissions reduction efforts across the different gases.
1.2.7 When are the reductions in methane needed and why?
The above section shows there are trade-offs that can be made between reductions in methane and
removals of emissions that can lead to the same temperature goal. However, it is also important to
consider whether methane is acted on sooner or later.
Emissions of methane in the short-term are important because they affect the temperature
trajectory in reaching the long-term goal. Whether a given level of reductions in methane emissions
occurs sooner (2020-2040) or later (2040-2060) will affect the level of warming the world
experiences and the chance of significant overshoot.
Reducing methane emissions earlier rather than later in the century leads to a higher likelihood that
temperatures will not overshoot the 1.5°C threshold. Figure 1.10 illustrates two generalised
scenarios for a given level of cuts to methane in the long-term. The trajectory of cuts to long-lived
greenhouse gases are the same in both scenarios, as are the long-term cuts to methane emissions.
Consequently, the final temperature is also the same in both scenarios. However, in one scenario the
cuts to methane emissions happen earlier, which leads to temperatures remaining below the final
temperature threshold rather than overshooting and then returning to it.
21
1 February 2021 Draft Supporting Evidence for ConsultationFigure 1.10: the impact of early versus later action on reducing methane emissions. The same level of
reduction in methane would ultimately lead to the same temperature outcome. However, earlier cuts
lead to less cumulative warming and reduce the chance of overshooting the goal and the negative
impacts associated with higher temperatures.
As a result, in modelled pathways compatible with limiting warming to 1.5°C, much of the cuts to
biogenic methane occur between 2020 and 2030, with slower reductions between 2030 and 2050
and much more limited reductions after 2050 (as illustrated in Figure 1.10).
The timing of cuts to methane required to be compatible with the 1.5°C global goal depends on our
view of overshoot and how much we value avoiding warming in the near-medium term in addition
to reducing warming in the long-term. It also depends on how much we wish to rely on removals to
meet our goals and for what purpose we want to use those removals.
Acting earlier on methane has advantages in that it:
• Leaves more time to reduce gross emissions of hard-to-abate long-lived greenhouse gases.
• Reduces risks of impacts from higher temperatures, including irreversible changes such as
species’ extinctions or catastrophic damage from more extreme weather events and faster
and higher sea level rises.
• Leaves more of the emission removal opportunities available to be used to get long-lived
gases to net zero.
22
1 February 2021 Draft Supporting Evidence for Consultation1.3 How different are the pathways that limit warming to 1.5°C to
those that limit warming to well below 2°C?
Our domestic emissions reduction goal raises an important question about the level of effort that is
required to reduce emissions. Aotearoa has set a different goal for its domestic actions compared to
what may be required under the wording of the Paris Agreement – Aotearoa has set a domestic
target of limiting warming to 1.5°C. The Paris Agreement sets the goal of limiting temperature
increases to well below 2°C while pursuing efforts to limit the temperature increase to 1.5°C. How
material is the difference of a few tenths of a degree between our domestic and international
obligations?
Analysis of the 1.5°C compatible pathways compared to pathways that limit warming to well below
2°C shows some key similarities (Figure 1.11). Both sets of pathways require very similar reductions
in gross emissions, particularly of carbon dioxide. The rates that global temperatures change out to
the peak temperature are also broadly the same (Figure 1.12). Under both temperature goals,
carbon dioxide needs to rapidly reduce over the next two decades and reach very low levels by 2050.
The main difference is in the amount of carbon dioxide removals required in the different pathways.
More emissions removal is needed in the 1.5°C compatible pathways to limit warming to the
temperature target, often by bringing the temperature back down to 1.5 degrees after it has
overshot the target.
Figure 1.11: Reductions in CO2 required in pathways compatible with less than 2°C (orange) and 1.5°C
(blue)60
60
(Peters, 2020a) using data from (Huppmann et al., 2019)
23
1 February 2021 Draft Supporting Evidence for ConsultationFigure 1.12: Peak temperatures in less than 2°C (orange) and 1.5°C compatible with limited overshoot
(blue). 1.5°C compatible pathways reach the same temperatures before dropping back down.61
61
(Peters, 2020b) using data from (Huppmann et al., 2019)
24
1 February 2021 Draft Supporting Evidence for Consultation1.4 References
Allen, M. R., Fuglestvedt, J. S., Shine, K. P., Reisinger, A., Pierrehumbert, R. T., & Forster, P. M. (2016).
New use of global warming potentials to compare cumulative and short-lived climate
pollutants. Nature Climate Change, 6(8), 773–776. https://doi.org/10.1038/nclimate2998
Arrhenius, S. (1896). On the influence of Carbonic Acid in the Air upon the Temperature of the
Ground. London, Edinburgh, and Dublin Philosophical Magazine and Journal of Science (Fifth
Series), 41, 237–275.
Cain, M., Lynch, J., Allen, M. R., Fuglestvedt, J. S., Frame, D. J., & Macey, A. H. (2019). Improved
calculation of warming-equivalent emissions for short-lived climate pollutants. Npj Climate
and Atmospheric Science, 2(1), 29. https://doi.org/10.1038/s41612-019-0086-4
Colliar, J., & Blackett, P. (2018). Tangoio Climate Change Adaptation Decision Model: A process for
exploring adaptive pathways for Tangaio Marae (Prepared for Maungaharuru-Tangitū Trust
and Deep South National Science Challenge NIWA Client Report: 2018242HN). New Zealand:
National Institute of Water and Atmospheric Research Ltd (NIWA).
Committee on Climate Change. (2019). Net Zero: The UK’s contribution to stopping global warming
(p. 275). Committee on Climate Change. https://www.theccc.org.uk/wp-
content/uploads/2019/05/Net-Zero-The-UKs-contribution-to-stopping-global-warming.pdf
Consoli, C. (2019). Bioenergy and Carbon Capture and Storage. Global CCS Institute.
https://www.globalccsinstitute.com/wp-content/uploads/2019/03/BECCS-
Perspective_FINAL_18-March.pdf
Forster, P. M., Millar, R., & Fuglestvedt, J. (2021). Climate science considerations of global mitigation
pathways and implications for New Zealand mitigation pathways [Report to the Climate
Change Commission].
Frame, D., Rosier, S., Carey-Smith, T., Harrington, L., Dean, S., & Noy, I. (2018). Estimating financial
costs of climate change in New Zealand, an estimate of climate change-related weather
event costs. New Zealand Climate Change Research Institute, National Institute of Water and
Atmospheric Research (NIWA). https://www.treasury.govt.nz/sites/default/files/2018-
08/LSF-estimating-financial-cost-of-climate-change-in-nz.pdf
Global CCS Institute. (2020). Carbon capture and storage pipeline grows by 10 large-scale facilities
globally. https://www.globalccsinstitute.com/news-media/press-room/media-
releases/carbon-capture-and-storage-pipeline-grows-by-10-large-scale-facilities-globally/
Hollis, M., de Klein, C., Frame, D., Harvey, M., Manning, M., Reisinger, A., Kerr, S., & Robinson, A.
(2016). Cows, Sheep and Science: A Scientific Perspective on Biological Emissions from
25
1 February 2021 Draft Supporting Evidence for ConsultationAgriculture. (Motu Working Paper 16-17; p. 48). Motu Economic and Public Policy Research.
http://motu-www.motu.org.nz/wpapers/16_17.pdf
Huppmann, D., Kriegler, E., Krey, V., Riahi, K., Rogelj, J., Calvin, K., Humpenoeder, F., Popp, A., Rose,
S. K., Weyant, J., Bauer, N., Bertram, C., Bosetti, V., Doelman, J., Drouet, L., Emmerling, J.,
Frank, S., Fujimori, S., Gernaat, D., … Zhang, R. (2019). IAMC 1.5°C Scenario Explorer and
Data hosted by IIASA (release 2.0) [Data set]. Zenodo.
https://doi.org/10.5281/ZENODO.3363345
Interim Climate Change Committee. (2019). Action on agricultural emissions: Evidence, analysis and
recommendations. https://www.iccc.mfe.govt.nz/what-we-do/agriculture/agriculture-
inquiry-final-report/action-agricultural-emissions/
IPCC. (2009). IPCC Expert Meeting on the Science of Alternative Metrics: Meeting Report (p. 82).
https://www.ipcc.ch/site/assets/uploads/2018/05/expert-meeting-metrics-oslo.pdf
IPCC. (2014a). Climate Change 2013: The Physical Science Basis. Contribution of Working Group I to
the Fifth Assessment Report of the Intergovernmental Panel on Climate Change (T. Stocker,
D. Qin, G.-K. Plattner, M. Tignor, S. Allen, J. Boschung, A. Nauels, Y. Xia, & P. Midgley, Eds.).
Cambridge University Press.
https://www.ipcc.ch/site/assets/uploads/2018/02/WG1AR5_all_final.pdf
IPCC. (2014b). Climate Change 2014: Synthesis Report. Contribution of Working Groups I, II and III to
the Fifth Assessment Report of the Intergovernmental Panel on Climate Change (p. 151)
[Core Writing Team, R.K. Pachauri and L.A. Meyer (eds.)]. IPCC.
https://www.ipcc.ch/site/assets/uploads/2018/05/SYR_AR5_FINAL_full_wcover.pdf
IPCC. (2018a). Global Warming of 1.5°C: An IPCC Special Report on the impacts of global warming of
1.5°C above pre-industrial levels and related global greenhouse gas emission pathways, in
the context of strengthening the global response to the threat of climate change, sustainable
development, and efforts to eradicate poverty. IPCC.
https://www.ipcc.ch/site/assets/uploads/sites/2/2019/06/SR15_Full_Report_High_Res.pdf
IPCC. (2018b). Summary for Policymakers. In Global Warming of 1.5°C. An IPCC Special Report on the
impacts of global warming of 1.5°C above pre-industrial levels and related global greenhouse
gas emission pathways, in the context of strengthening the global response to the threat of
climate change, sustainable development, and efforts to eradicate poverty. [Masson-
Delmotte, V., P. Zhai, H.-O. Pörtner, D. Roberts, J. Skea, P.R. Shukla, A. Pirani, W. Moufouma-
Okia, C. Péan, R. Pidcock, S. Connors, J.B.R. Matthews, Y. Chen, X. Zhou, M.I. Gomis, E.
Lonnoy, T. Maycock, M. Tignor, and T. Waterfield (eds.)]. In Press. IPCC.
26
1 February 2021 Draft Supporting Evidence for ConsultationYou can also read