Electrochemical Reduction of CO2 to Formate on Easily Prepared Carbon-Supported Bi Nanoparticles - MDPI
←
→
Page content transcription
If your browser does not render page correctly, please read the page content below
molecules
Article
Electrochemical Reduction of CO2 to Formate on
Easily Prepared Carbon-Supported Bi Nanoparticles
Beatriz Ávila-Bolívar, Leticia García-Cruz, Vicente Montiel and José Solla-Gullón *
 Instituto de Electroquímica, Universidad de Alicante, Apartado 99, 03080 Alicante, Spain;
 beatriz.bolivar@ua.es (B.Á.-B.); leticia.garcia@ua.es (L.G.-C.); vicente.montiel@ua.es (V.M.)
 * Correspondence: jose.solla@ua.es

 Academic Editor: Paramaconi Rodriguez

 Received: 15 April 2019; Accepted: 24 May 2019; Published: 28 May 2019

 Abstract: Herein, the electrochemical reduction of CO2 to formate on carbon-supported bismuth
 nanoparticles is reported. Carbon-supported Bi nanoparticles (about 10 nm in size) were synthesized
 using a simple, fast and scalable approach performed under room conditions. The so-prepared Bi
 electrocatalyst was characterized by different physicochemical techniques, including transmission
 electron microscopy, X-ray photoelectron spectroscopy, and X-ray diffraction and subsequently
 air-brushed on a carbon paper to prepare electrodes. These electrodes were characterized by scanning
 electron microscopy, energy-dispersive X-ray spectroscopy and also by cyclic voltammetry. Finally,
 CO2 electroreduction electrolyses were performed at different electrode potentials for 3 h. At the
 optimal electrode potential (−1.6 V vs AgCl/Ag), the concentration of formate was about 77 mM with
 a faradaic efficiency of 93 ± 2.5%. A 100% faradaic efficiency was found at a lower potential (−1.5 V
 vs AgCl/Ag) with a formate concentration of about 55 mM. In terms of stability, we observed that
 after about 70 h (in 3 h electrolysis experiments at different potentials), the electrode deactivates due
 to the gradual loss of metal as shown by SEM/EDX analyses of the deactivated electrodes.

 Keywords: electrocatalysis; CO2 reduction; Bi electrodes; formate

1. Introduction
     The concentration of CO2 in the atmosphere is reaching extremely high values (>410 ppm) as
consequence of the industrial activity and the combustion of fossil fuels [1]. In this regard, numerous
research groups have focused their efforts on the development of different methods including chemical,
photochemical, electrochemical, and biological approaches, among others, not only to significantly
reduce such high CO2 concentration (thus, mitigating the greenhouse effect and climate change) but
also to valorise it into more valuable chemicals [2].
     Among the different alternatives, the electrochemical approach to efficiently transform CO2 into
value-added chemicals and fuels is considered one of the most promising ways of CO2 valorisation [3,4].
As described in previous contributions, it is possible to generate different products selectively as a
function of different experimental conditions including the nature of the electrocatalytic materials,
among many other experimental parameters [5–9]. Additionally, the possible coupling with renewable
energy sources such as wind and/or solar energy, it allows the electrochemical CO2 reduction (ECO2 R)
process to be considered as an eco-friendly approach. However, due to its particular structure, CO2 is
quite thermodynamically and kinetically stable, and it requires usually high cathodic overpotentials to
produce C1, C2 and even C3 compounds. Due to these high overpotentials, the hydrogen evolution
reaction (HER) is its serious competitive reaction in aqueous solution. Additionally, the ECO2 R displays
a complex reaction mechanism with multiple electron transfer processes with manifold coupled
consecutives intermediates [10]. Also, as previously stated, the product selectivity and efficiency of
the ECO2 R are strongly affected by a number of parameters including the chemical nature of the

Molecules 2019, 24, 2032; doi:10.3390/molecules24112032                           www.mdpi.com/journal/molecules
Molecules 2019, 24, 2032                                                                             2 of 15

electrocatalysts [11–14], the particle shape/ surface structure [7,8,15–25], atomic composition [24,26–31],
and particle size [32–35], among others. Consequently, several electrocatalysts [5,7,8,36,37] as
well as experimental conditions such as temperature and pressure [5], pH [38,39], and electrolyte
composition [5,40–42] have been explored.
      In aqueous electrolyte and depending on the electroactive material, CO2 can be reduced to a wide
number of products including carbon monoxide (CO), methane (CH4 ), ethylene (C2 H4 ), methanol
(CH3 OH), ethanol (CH3 CH2 OH), and other high added value products such as formate/formic acid
(HCOO− /HCOOH) or formaldehyde (HCHO). Among these, the production of formic acid or formate
is particularly interesting due to their wide versatility in multiples practical applications [43–45].
For instance, formate can be used as raw material in chemical, textile, agricultural and pharmaceutical
industries. Alternatively, formic acid has demonstrated significant benefits over methanol fuel cell
devices [46], including higher open circuit voltage [47] and lower crossover [48]. In addition, the formic
acid can be used as hydrogen storage material [49,50].
      The electrochemical conversion of CO2 to HCOOH/HCOO− is a two-electron process highly
favoured on a plethora of non-precious metal surfaces [51] such as Cd [52], In [53,54], Sn [55,56],
and Pb [56]. Note that is found that not only these materials in metallic state, but also some of
their oxides (e.g., SnOx) are beneficial for CO2 reduction since the oxide layer films can inhibit
HER [57,58]. Despite Pb and, particularly, Sn have been the most extensively studied systems for
formate production, the use of bismuth (Bi) is being considered as a very promising electrocatalyst for
obtaining formate (or formic acid) at lower overpotential compared to the above-mentioned metals
in aqueous electrolyte. Bi presents interesting properties not only due to its low toxicity and cost,
but also due to its higher stability under electrochemical conditions in neutral aqueous media (due to its
relatively positive standard reduction potential (Bi3+ /Bi, 0.308 V) [59]. Also, Bi has been reported to be
a poor electrocatalyst for H2 evolution because of its positive free energy of hydrogen adsorption [60].
      Owing to these interesting properties, the employ of Bi-based electrodes towards ECO2 R to
formate (or formic acid) is increasing significantly [56,61–73]. For instance, Zhang et al. studied
the electrochemical reduction of CO2 to formate at room temperature using a high surface area
Bi (HAS-Bi) electrocatalyst obtained from the electrochemical reduction of previously prepared
BiOCl nanosheets [62]. This electrocatalyst exhibited a good selectivity towards formate with a high
faradaic efficiency (around 92%). Also, Zong et al. reported that, using nanostructured Bi dendrite
electrocatalyst, electrochemically grown on a carbon paper, displayed a remarkable performance
for CO2 reduction to formate with a maximum faradaic efficiency of 96.4% and a current density of
15.2 mAcm−2 at −1.8 V [63]. Also, the electrode was found to be stable during 10 h of continuous
electrolysis. Similarly, Koh et al. demonstrated a high selectivity (∼89% at −0.74 vs RHE) and
an efficient conversion of CO2 to formate by using a rational design of a hierarchical Bi dendrite
catalyst [74]. In addition, a stable performance during ∼12 h operation was achieved with the Bi
dendrite catalyst. More recently, new interesting contributions have been reported [64–67,69,70]
including nanosized-Bi electrocatalysts [75–77], oxide-derived Bi films [70], Bi nanosheets [78,79],
sulphide-derived Bi catalysts [80], and Bi nanoflakes [67], among others, for successfully CO2 reduction
to formate. However, the preparation of such electrocatalysts requires the use of increasing temperatures,
high pressure (autoclave systems are required), non-commercial precursors or in-situ electrochemical
reductions which makes their production not easy to be scaled up. Consequently, using a simple, fast
and scalable approach is still needed.
      In this way, the work aims at the development of an easy and fast procedure for the preparation
of carbon-supported Bi nanoparticles under soft experimental conditions. The carbon-supported Bi
nanoparticles will be physicochemically and electrochemically characterized and their electrocatalytic
properties towards CO2 reduction to formate studied in 0.5 M KHCO3 . Finally, a preliminary analysis of
the stability of the Bi-based electrodes was also carried out including microscopic degradation studies.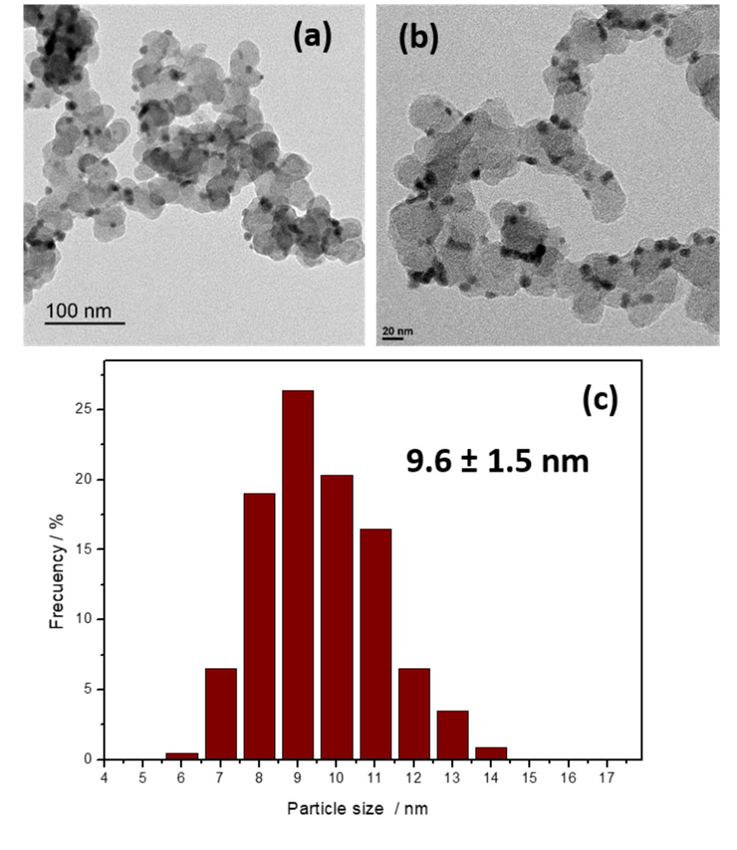
Molecules 2019, 24, 2032                                                                                                       3 of 15

      Molecules 2019, 24, x FOR PEER REVIEW                                                                          4 of 17
2. Results and Discussion
      2.
      AsResults and Discussion
         mentioned    in the Materials and Methods section, syntheses with different PVP to BiCl3
stoichiometric     ratios (PVP/Bi       3+ : 10, 5, 2, 1, and 0) were tested to be able to form Bi nanoparticles
           As mentioned        in the Materials       and Methods section, syntheses with different PVP to BiCl3
whilestoichiometric
       using the lowest          amount
                       ratios (PVP/Bi         of 5,PVP,
                                         3+: 10,           as the
                                                    2, 1, and        residual
                                                                 0) were  tested presence    ofform
                                                                                 to be able to   PVPBimay      represent
                                                                                                         nanoparticles     a major
                                                                                                                         while
     usingfor
obstacle     thean
                 lowest   amount
                    efficient        of PVP, as the residual
                                 electroreduction          of CO2presence
                                                                     . Figure  of S1
                                                                                  PVP   maythe
                                                                                      (see    represent  a major obstacle
                                                                                                 Supplementary             for
                                                                                                                      Information)
showsan some
         efficient  electroreduction
                 representative       TEM  of CO   2. Figure S1 (see the Supplementary Information) shows some
                                               images      of the samples prepared with different PVP: BiCl3 ratios.
     representative
The results   obtained  TEM     images
                           suggest    thatof for
                                              thePVP
                                                   samples
                                                        to BiCl prepared    with different PVP: BiCl3 ratios. The results
                                                                   3 ratios of 10, 5, 2, and 1 (see Figure S1a–d), the BiNPs
     obtained suggest that for PVP to BiCl3 ratios of 10, 5, 2, and 1 (see Figure S1a–d), the BiNPs present
present similar characteristics, that is, a quasi-spherical morphology and a particle size about 10 nm.
     similar characteristics, that is, a quasi-spherical morphology and a particle size about 10 nm.
Interestingly, a low PVP: BiCl3 ratio of 1 is enough for controlling the growth of the BiNPs and
     Interestingly, a low PVP: BiCl3 ratio of 1 is enough for controlling the growth of the BiNPs and
keeping   their their
     keeping     particle   size in
                       particle      thein10the
                                  size          nm10range.     This remarkable
                                                       nm range.                     reduction
                                                                       This remarkable           of theofPVP
                                                                                            reduction       thecontent   contribute
                                                                                                                 PVP content
enormously      to the   correct   and     complete      washing       of  the  nanoparticles.     It is
     contribute enormously to the correct and complete washing of the nanoparticles. It is worth recall  worth    recall that clean
surfaces
     that are
           cleanalways   important
                  surfaces   are always  for   electro-catalysis.
                                            important                  On the other
                                                          for electro-catalysis.        hand,
                                                                                   On the       ashand,
                                                                                            other   shown    in Figure
                                                                                                          as shown       S1e, in the
                                                                                                                     in Figure
absence
     S1e,ofinPVP,   the sample
               the absence          loses
                               of PVP,   theitssample
                                                 nanoparticle
                                                         loses itsform      and a nanostructured
                                                                     nanoparticle                       network appears
                                                                                     form and a nanostructured              instead
                                                                                                                      network
     appears instead
of individual              of individual
                 nanoparticles                 nanoparticles
                                     with spherical               with spherical
                                                            morphology.              morphology.
                                                                               The formation          The nanostructure
                                                                                                 of this   formation of thismay be
     nanostructure
also interesting,     may
                    but       beout
                          it is  alsoofinteresting,
                                         our objective but itofispreparing
                                                                  out of our objective   of preparing
                                                                               carbon-supported       Bicarbon-supported    Bi an
                                                                                                          nanoparticles. Once
     nanoparticles.    Once     an optimal      PVP:   BiCl  3 ratio was determined, carbon-supported BiNPs were
optimal PVP: BiCl3 ratio was determined, carbon-supported BiNPs were prepared. Figure 1 displays
     prepared. Figure 1 displays some TEM images and the corresponding particle size histogram of Bi/C
some TEM images and the corresponding particle size histogram of Bi/C nanoparticles with a PVP to
     nanoparticles with a PVP to Bi ratio of 1. The spherical morphology is again clearly observed together
Bi ratio of 1. The spherical morphology is again clearly observed together with a well dispersion of
     with a well dispersion of the nanoparticles on the carbon substrate. The particle size was found to be
the nanoparticles     on theAAS
     9.6 ± 1.5 nm. From          carbon     substrate. the
                                     measurements,         Themetal
                                                                  particle   size was
                                                                        loading         found
                                                                                  was 14.3      to be
                                                                                             wt.%,      9.6 ± lower
                                                                                                     slightly 1.5 nm.   From
                                                                                                                      than the AAS
measurements,
     nominal one.the metal loading was 14.3 wt.%, slightly lower than the nominal one.

      Figure 1. (a,b) TEM images and (c) particle size histogram corresponding to Bi/C prepared with a PVP
      to Bi Figure
            ratio of1. 1.
                       (a,b) TEM images and (c) particle size histogram corresponding to Bi/C prepared with a PVP
            to Bi ratio of 1.
     XRD analysis of the acetone-washed BiNPs indicates, as expected, the presence of Bi oxides as
          XRD analysis of the acetone-washed BiNPs indicates, as expected, the presence of Bi oxides as
consequence of the spontaneous oxidation during the washing step/air exposure. Figure S2a,b depict
     consequence of the spontaneous oxidation during the washing step/air exposure. Figure S2a,b depict
the XRD patterns of the unsupported BiNPs, and Bi/C samples, respectively. Both diffractograms are
     the XRD patterns of the unsupported BiNPs, and Bi/C samples, respectively. Both diffractograms are
very similar although, for the Bi/C sample, two small diffraction peaks between 38◦ and 40◦ , associated
with metallic Bi with a hexagonal crystal structure, are also observed. The quasi-spherical morphology
of the BiNPs, as well as an effective surface cleaning, makes them more sensitive to the oxidation.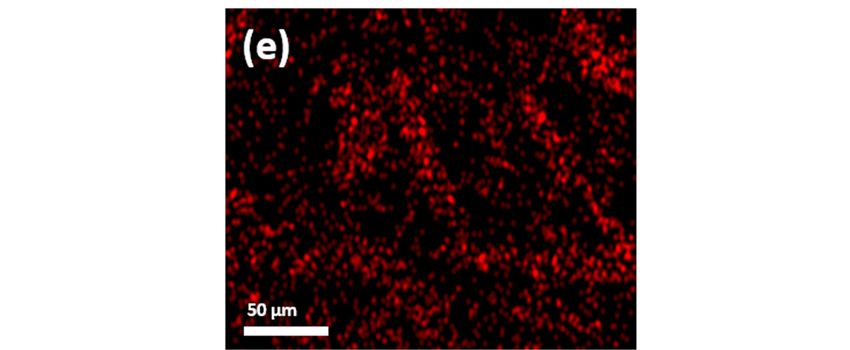
Molecules 2019, 24, 2032                                                                                                   4 of 15

On the other, the XRD pattern of the nanostructured Bi network obtained in the absence of PVP
(Figure S2c), clearly shows two sharp peaks at 38◦ and 40◦ indicating that, in that case, the sample
retains a more metallic state although some features related to Bi oxides are also observed. This finding
suggests that the nanostructured meshed network seems more stable towards its oxidation. It is worth
noticing that when the nanoparticles were washed with non-anhydrous ethanol instead of acetone,
the nanoparticles changed from a black to a white powder, and the diffraction pattern completely
modified. The new pattern fits perfectly with that of bismuth carbonate species (bismutite) (Figure S3).
     To get more insight into the oxidation states of the Bi/C sample, XPS measurements were performed.
The XPS spectrum of the Bi 4f region (Figure S4) shows the presence of two binding energy contributions
at 164.8 (Bi 4f5/2 ) and 159.5 eV (Bi 4f7/2 ) related to Bi3+ [81]. In addition, two clear shoulders are observed
at 162.6 (Bi 4f5/2 ) and 157.3 (Bi 4f7/2 ) eV denoting the presence of Bi0 . The Bi3+ : Bi0 ratio was found to be
about 94:6, thus confirming that the BiNPs present an oxidised character. Similar features were reported
with other Bi-modified electrodes [56,65,67,70]. Also, as previously mentioned in the literature [57],
the formation of a Bi oxide stable film could exhibit positive effects on CO2 reduction probably by
effective inhibition of the hydrogen evolution reaction (HER). As described in the experimental section,
the Bi/C sample was used to manufacture Bi-based electrodes. For that, the catalytic ink containing the
carbon supported BiNPs was air-brushed onto a carbon paper. Figure 2 shows some representative
SEM-EDX images of electrode. The images evidence how the Bi/C ink covers homogenously the carbon
Toray fibbers leading to a uniform and compact catalytic layer. At higher magnification, Figure 2b,
the good distribution of the BiNPs can be even observed. This homogeneous Bi distribution is further
confirmed by the EDX mapping of the plane section of the electrode (Figure 2c–e) from which the uniform
distribution of   the Bi metal on the carbon substrate with a low metal agglomeration degree
              Molecules 2019, 24, x FOR PEER REVIEW                                             6 of 17
                                                                                                        is verified.

                  Figure 2. Field emission SEM images of the Bi/C electrode with Bi loading of 0.1 mg cm : (a)
                                                                                                             −2
      Figure 2. Field    emission SEM images of the Bi/C electrode with Bi loading of 0.1 mg cm−2 :
                  magnification ×130, and (b) magnification ×100.00 K. Micrographs (c–e) correspond to SEM-EDX
      (a) magnification  ×130,
                  mapping:  d andand   (b) magnification
                                  e highlight,                   ×100.00
                                               in red, the distribution      K. Micrographs
                                                                        of BiNPs                 (c–e) correspond to SEM-EDX
                                                                                 on the carbon substrate.
      mapping: d and e highlight, in red, the distribution of BiNPs on the carbon substrate.
                    The electrochemical characterisation of the Bi-based electrodes was performed in an Ar-
               saturated 0.5 M KHCO3 solution, Figure S5 (red line). For sake of comparison, the response of a
               massive Bi rod is also included, Figure S5 (black line). Both voltammograms display similar
               voltammetric features which are characterised by a reduction contribution at about −0.6 V vs
               AgCl/Ag associated with the electrochemical reduction of Bi2O3 to Bi [80]. In the positive going sweep,
               the oxidation at about −0.25 V refers to the opposite process, that is, oxidation of Bi to Bi2O3. For the
               Bi rod, the HER appears clearly at about −1.4 V vs AgCl/Ag. However, for the Bi/C based electrode,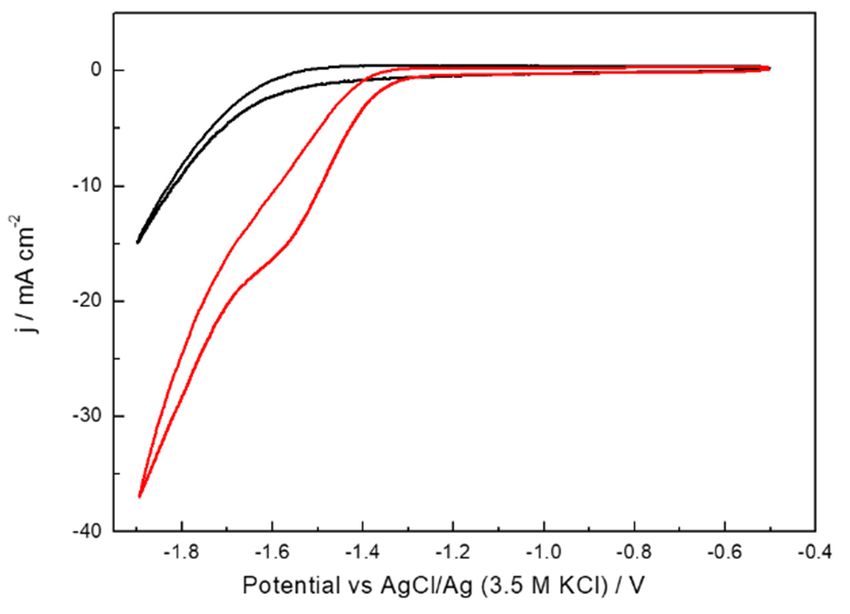
Molecules 2019, 24, 2032                                                                                  5 of 15

      The electrochemical characterisation of the Bi-based electrodes was performed in an Ar-saturated
0.5 M KHCO3 solution, Figure S5 (red line). For sake of comparison, the response of a massive Bi rod
is also included, Figure S5 (black line). Both voltammograms display similar voltammetric features
which are characterised by a reduction contribution at about −0.6 V vs AgCl/Ag associated with the
electrochemical reduction of Bi2 O3 to Bi [80]. In the positive going sweep, the oxidation at about
−0.25 V refers to the opposite process, that is, oxidation of Bi to Bi2 O3 . For the Bi rod, the HER appears
clearly at about −1.4 V vs AgCl/Ag. However, for the Bi/C based electrode, this HER is less evident
because of the larger double layer contribution of the carbon substrate. The CO2 reduction activity of
the Bi/C electrode was evaluated using a CO2 -saturated 0.5 M KHCO3 solution, Figure 3. As expected,
the results obtained clearly display the presence of a new and well-defined reduction process starting
at −1.3 V and associated with the CO2 reduction. A similar feature was observed with the massive Bi
rod electrode thus pointing out that, at this potential range, the carbon support does not contribute to
the CO2 reduction. To better verify the role of the carbon support, Figure S6 displays the response
of a Toray
 Molecules    paper
           2019,       containing
                 24, x FOR          pure Vulcan XC-72R carbon in the absence (Ar saturated 0.5 M KHCO
                            PEER REVIEW                                                                7 of 17
                                                                                                            3
solution) and in the presence of CO2 . The results indicate that the activity of the carbon-based electrode
 the activity
towards     COof   the carbon-based
                2 reduction             electrode
                               is very low        towards CO
                                            in comparison    2 reduction
                                                          with           is very
                                                                that observed    lowthe
                                                                               with  in comparison  with that
                                                                                         carbon supported  Bi
 observed(Figure
samples      with the 3). carbon supported Bi samples (Figure 3).

      Figure 3. Cyclic voltammetry response of Bi/C electrode with Bi loading of 0.1 mg cm−2−2 in Ar (black
       Figure 3. Cyclic voltammetry response of Bi/C electrode with Bi loading of 0.1 mg cm in Ar (black
                                                                        −1 .
      line) and CO2 (red line) saturated 0.5 M KHCO3 . Scan rate 50 mV s−1
       line) and CO2 (red line) saturated 0.5 M KHCO3. Scan rate 50 mV s .

     Subsequently, CO2 electroreduction electrolyses were performed in an H-type electrochemical to
      Subsequently, CO2 electroreduction electrolyses were performed in an H-type electrochemical
evaluate the product formation, Faradaic efficiency, and selectivity of the reaction towards formate.
to evaluate the product formation, Faradaic efficiency, and selectivity of the reaction towards
For that, consecutive electrolyses were performed at different controlled potentials of −1.5, −1.6, −1.7
formate. For that, consecutive electrolyses were performed at different controlled potentials of −1.5,
and −1.8 V vs. AgCl/Ag in CO2 -saturated 0.5 M KHCO3 solution for 3 h using the experimental
−1.6, −1.7 and −1.8 V vs. AgCl/Ag in CO2-saturated 0.5 M KHCO3 solution for 3 h using the
setup described below. In these experiments, the current density increases (in absolute value) as the
experimental setup described below. In these experiments, the current density increases (in absolute
electrolysis potential decreases. Also, the electrolysis current density remains practically constant
value) as the electrolysis potential decreases. Also, the electrolysis current density remains practically
during the entire experiments (3 h) at all potentials studied (Figure S8). In this work, electrolysis
constant during the entire experiments (3 h) at all potentials studied (Figure S8). In this work,
density current values registered ranged between −4 and −12 mA cm−2 for −1.5 and −1.8      V, respectively.
electrolysis density current values registered ranged between −4 and −12 mA cm−2 for −1.5 and −1.8
These values are similar to those reported in previous contributions [65]. Figure 4 summarizes the
V, respectively. These values are similar to those reported in previous contributions [65]. Figure 4
main findings obtained during the CO2 electroreduction electrolysis experiments. Figure 4a shows the
summarizes the main findings obtained during the CO2 electroreduction electrolysis experiments.
Faradaic efficiency as a function of the applied potential. As expected, the faradaic efficiency values
Figure 4a shows the Faradaic efficiency as a function of the applied potential. As expected, the
decrease for more negative potential values due to the higher contribution of the HER. In any case,
faradaic efficiency values decrease for more negative potential values due to the higher contribution
a good value of about 76% is found at −1.8 V vs AgCl/Ag.
of the HER. In any case, a good value of about 76% is found at −1.8 V vs AgCl/Ag.
Molecules 2019, 24, 2032 6 of 15
Molecules 2019, 24, x FOR PEER REVIEW 8 of 17
Figure 4. (a) Faradaic efficiency for formate production at different controlled potential from −1.5 to
Figure 4. (a) Faradaic efficiency for formate production at different controlled potential from −1.5 to
−1.8 V. Electrolysis time: 3 h. (b) Formate concentration produced after 3 h of electrochemical reduction
−1.8 V. Electrolysis time: 3 h. (b) Formate concentration produced after 3 h of electrochemical
of CO2 at different controlled potentials as a function of Faradaic efficiency.
reduction of CO2 at different controlled potentials as a function of Faradaic efficiency.
For lower potential values of −1.5 and −1.6 V for which the contribution of the HER is practically
For lower potential values of –1.5 and −1.6 V for which the contribution of the HER is practically
negligible, very high faradic efficiencies were observed towards formate production. Particularly
negligible, very high faradic efficiencies were observed towards formate production. Particularly
interesting is the ~100% faradic efficiency obtained at −1.5 V. This finding suggests that, at this potential,
interesting is the ∼100% faradic efficiency obtained at –1.5 V. This finding suggests that, at this
HER is essentially missing, as previously shown in Figure 3. Obviously, a very minor contribution of
potential, HER is essentially missing, as previously shown in Figure 3. Obviously, a very minor
the HER is also possible although certainly negligible taking into consideration our experimental error.
contribution of the HER is also possible although certainly negligible taking into consideration our
Numerous electrolyses were carried out at different potentials in order to evaluate the reproducibility
experimental error. Numerous electrolyses were carried out at different potentials in order to
of the faradic efficiency values obtained. The standard deviation oscillated between 0.5 and 2.5%,
evaluate the reproducibility of the faradic efficiency values obtained. The standard deviation
demonstrating the good reproducibility of the measurements. To complete this analysis, it is also
oscillated between 0.5 and 2.5%, demonstrating the good reproducibility of the measurements. To
important to estimate how the faradaic efficiency evolves during the 3 h experiment. Figure S9 shows
complete this analysis, it is also important to estimate how the faradaic efficiency evolves during the
the faradaic efficiency values for each hour of reaction. At −1.5 V the FE remains unaltered at the
3 h experiment. Figure S9 shows the faradaic efficiency values for each hour of reaction. At −1.5 V the
FE remains unaltered at the maximum value (100%). A slight decrease in FE is observed between 2Molecules 2019, 24, 2032 7 of 15
maximum value (100%). A slight decrease in FE is observed between 2 and 3 h of reaction at −1.6 V.
This decrease is much more evident at −1.7 and −1.8 V, for which a 20 and 25% loss of FE is observed,
respectively. It is worth noting that no obvious detachment of the catalytic layer was observed despite
H2 bubbles were clearly visible from HER during electrolyses.
Although FE values are relevant for the process, from a practical point of view, analysing the
formate concentration produced it is of critical importance. Figure 4b depicts the formate concentration
produced after 3 h at different potentials. A maximum formate concentration of 77 mM is found at
−1.6 V. This concentration decreases to 70 and 64 mM at −1.7 and −1.8 V, respectively. The lowest
formate concentration of 54 mM is found at −1.5 V. The evolution of the formate concentration during
the 3-h CO2 reduction experiments is shown in Figure S10. In all cases, a linear evolution of the formate
concentration is observed. Taking into consideration the FE values and the formate production (in terms
of formate concentration), we conclude that, in our experimental conditions, the most convenient
potential value is −1.6 V vs. AgCl/Ag.
Finally, in a preliminary attempt of evaluating the long-term stability of the Bi-based electrodes,
we have observed that, after approximately 70 working hours in 3-h CO2 reduction experiments at
different potential, the electrodes deactivate. To understand the origin of this deactivation, SEM images
of the deactivated Bi electrodes were taken, Figure 5 and Figure S11. The SEM images indicate a clear
loss of BiNPs in comparison with the freshly prepared electrodes. However, at this point, it is not clear
if the detachment of the BiNPs in the electrocatalytic layer is due to the water washing step after each
electrolysis and/or to a loss of Bi during the electrochemical/electrolysis experiments. In this respect,
it is worth noting that current remains essentially stable during the 3-h CO2 reduction experiments
(Figure S8) which may suggest that the loss of Bi essentially takes place during the water washing
between2019,
Molecules experiments.
24, x FOR PEER REVIEW 10 of 17
Figure
Figure 5. Back-scattered
Back-scatteredelectrons
electronsfield
field emission
emission SEM SEM images
images of theofBi-based
the Bi-based electrodes
electrodes with Biwith Bi
loading
of 0.1 mg −2
cmmg: cm
(a) as-prepared, and and
(b) after aprox. 7070
h hinin3-h
loading of 0.1 −2 : (a) as-prepared, (b) after aprox. 3-hCO
CO22 reduction experiments at
reduction experiments at
different potentials.
different potentials.
To properly evaluate the stability of the Bi NPs and to find out why the electrode degrades,
a long-term (24 h) CO2 reduction experiment was carried out at −1.6 V vs. Ag/AgCl in the same H-type
electrochemical cell and with a freshly prepared electrode. As shown in Figure S12, the current remains
essentially stable during the first 6–7 h. Nevertheless, from this moment, the currents progressively
become more negative. At the same time, a more visible generation of bubbles at the surface of the
electrode is also observed thus suggesting that HER is becoming predominant in the process. To verify
this hypothesis, Figure 6 reports the evolution of the FE and formate concentration during the 24 h
experiment. The results confirm that, after 4–5 h, the electrode begins to be less efficient and both
FE and formate concentration clearly decay. In particular, the FE decreases from 90–95% (after 5 h)
to about only 20% after 24 h. A similar deactivation is progressively observed in term of formateMolecules 2019, 24, 2032 8 of 15
concentration. Thus, whereas in the first 5 h the formate concentration is increasing in about 23 mM/h,
this production is significantly reduced to about 6 mM/h during the remaining 19 h. These preliminary
results indicate that the Bi electrode strongly deactivates under working conditions. As deduced from
the SEM images, Figure 5, this deactivation is attributed to a gradual loss of Bi. This Bi detachment
suggests
Figurean5.insufficient
Back-scatteredinteraction
electrons between the Bi
field emission SEMNPs and the
images carbon
of the Vulcan
Bi-based substrate.
electrodes In any
with Bi
case,loading
more work
of 0.1 is
mgincm
progress not only to
−2: (a) as-prepared, better
and understand
(b) after aprox. 70 the
h inmechanism of degradation
3-h CO2 reduction experimentsofatthe Bi
electrodes but also to
different potentials.find new alternatives to improve their durability under working conditions.
Figure 6.
Figure Faradaic efficiency
6. Faradaic efficiency and
and formate
formate concentration
concentration vs
vs time
time during
during 24
24 h
h CO electroreduction
CO22 electroreduction
electrolysis at −1.6 V.
electrolysis at −1.6 V.
3. Materials and Methods
3. Materials and Methods
3.1. Chemicals and Reagents
3.1. Chemicals and Reagents
BiCl3 (99.99%, Aldrich, St. Louis, MO, USA) was used as Bi precursor. N,N-Dimethylformamide
(DMF, BiCl 3 (99.99%, Aldrich, St. Louis, MO, USA) was used as Bi precursor. N,N-Dimethylformamide
99.8%, Sigma Aldrich), polyvinylpyrrolidone (PVP, K30, Mw ~ 55.000, Aldrich), and sodium
(DMF, 99.8%,
borohydride (NaBH4Sigma Aldrich), polyvinylpyrrolidone
99%, Aldrich) were used as(PVP,solvent, Mw ∼ 55.000,
K30,capping agent Aldrich), and sodium
and reducing agent,
borohydride (NaBH4 99%, Aldrich) were used as solvent, capping agent
respectively. Vulcan XC-72 carbon powder (CAS No 1333-86-4, sample number GP 3621) and reducing agent,
was
respectively. Vulcan XC-72 carbon powder (CAS No 1333-86-4, sample number
purchased from Cabot Corporation (Boston, MA, USA). The ion exchange cross-linked resin Nafion GP 3621) was
purchased from Cabot Corporation
(5 wt.% in isopropyl/water solution)(Boston, MA, USA).
was purchased fromTheAlfaion exchange
Aesar (Wardcross-linked resinCationic
Hill, MA, USA). Nafion
(5 wt.% in isopropyl/water solution) was purchased from Alfa Aesar (Ward Hill, MA,
ion exchange membrane Nafion 112 was purchased from DuPont, (Wilmington, DE, USA). All other USA). Cationic
ion exchange
chemicals weremembrane
purchasedNafion
from the112 was purchased
highest from DuPont,
analytical grade available(Wilmington,
and were usedDE, USA). All
as received other
without
chemicals were purchased from the highest analytical grade available and were used
any further purification. All solutions were prepared using MilliQ ultrapure water (18.2 MΩ cm). as received
without any further purification. All solutions were prepared using MilliQ ultrapure water (18.2 MΩ
3.2. Synthesis of Bismuth Electrocatalysts
cm).
Bi nanoparticles (BiNPs) were synthesized by chemical reduction of Bi3+ in DMF by NaBH4 in
the presence of PVP as protecting agent. In more details, BiCl3 (0.316 g) and PVP K30 (1.116 g) were
added into DMF (37.92 g) and sonicated until complete solubilisation. Subsequently, NaBH4 (0.116 g)
was directly added to the solution under continuous magnetic stirring at room temperature. After
the addition of the reducing agent the solution becomes dark, indicating the reduction of Bi3+ to Bi0 .
The solution was stirred and alternatively sonicated (Selecta ultrasonic bath operating at 50/60 kHz,Molecules 2019, 24, 2032 9 of 15
360 W power output, JP Selecta, Barcelona, Spain) for 45 min. Thereafter, the BiNPs were thoroughly
washed (four times) and storage with acetone. Different PVP to BiCl3 stoichiometric ratios (PVP/Bi3+ :
10, 5, 2, 1, and 0) were evaluated with the objective of decreasing as much as possible the amount of PVP
without affecting the particle size of the Bi nanoparticles. For the preparation of the carbon supported
Bi nanoparticles (Bi/C), the chemically reduced BiNPs, in the original DMF suspension, were mixed
with appropriated amounts of Vulcan XC-72R carbon powder to obtain a Bi loading of ca. 20 wt.%.
After 60 min of continuous magnetic stirring with alternative sonication the Bi/C nanoparticles were
precipitated by using acetone and filtered and washed with acetone through a nylon membrane filter
of 45 mm (Cat No. MNY045047H, chm by CHMLAB GROUP, Barcelona, Spain). Finally, the sample is
dried overnight under vacuum conditions at 45 ◦ C.
3.3. Preparation of the Catalytic Ink and Cathode
The catalytic ink was prepared by dispersing the sample in a Nafion solution (perfluorosulfonic
acid- PTFE copolymer 5% w/w solution, Alfa Aesar) at a Bi/C:Nafion mass ratio of 80:20. The mixture
was then diluted to 2% in absolute ethanol, (EMSURE® , Merck, Darmstadt, Germany). Ultrasonic
agitation was used to homogenize the ink for at least 30 min. The cathode was prepared by spraying
(air-brushing technique) the catalytic ink on a 3 × 3 cm2 Toray paper (TGPH-120 from QuinTech,
Göppingen, Germany), supported on a hot metallic plate at 90 ◦ C to facilitate solvent evaporation.
The Bi loading was 0.1 mg cm−2 .
3.4. Physicochemical Characterisation
Transmission electron microscopy (TEM) images were collected with a JEM-2010 microscope
(JEOL, Akishima, Tokyo, Japan) working at 200 kV and with a JEOL JEM-1400 Plus working at 120 kV.
The samples were dispersed onto a Formvar-covered copper grid and allowed to evaporate in air at
room temperature. For each sample, usually about 200 particles from different parts of the grid were
used to estimate the mean diameter and size distribution of the nanoparticles. X-ray diffraction (XRD)
patterns were obtained with a D8 Advance diffractometer (Bruker, Billerica, MA, USA) fitted with a
copper tube. The optical setup included a Ni 0.5% CuKβ filter in the secondary beam so that only
CuKα radiation illuminated the sample (CuKα1 = 0.154059 nm and CuKα2 = 0.154445 nm). The sample
was spread onto a Si wafer and measured in reflection geometry over the 20–90◦ 2θ range with a step
of 0.10◦ and a counting time of 30 s per step. X-ray photoelectron spectroscopy (XPS) experiments were
recorded on a K-Alpha spectrometer (Thermo Scientific, Waltham, MA, USA) using AlKα 1486.6 eV
radiation, monochromatised by a twin crystal monochromator and yielding a focused X-ray spot with a
diameter of 400 mm, at 3 mA × 12 kV. Deconvolution of the XPS spectra was carried out using a Shirley
background. Scanning electron microscopy (SEM, S-3000 N microscope, Hitachi, Krefeld, Germany,
working at 20 kV with a Bruker Xflash 3001 X-ray detector for microanalysis) was employed to analyse
the morphology of the electrocatalytic layer of the manufactured electrodes. High resolution SEM
images were obtained using a field emission scanning electron microscopy (FESEM) (model Merlin
VP Compact, ZEISS, Oberkochen, Germany). The metal (Bi) loading was experimentally analyses
by atomic absorption spectroscopy (AAS) using a SpectrAA-220 FS instrument (Varian, Palo Alto,
CA, USA). For that, a known amount of the carbon supported Bi nanoparticles was firstly treated
in nitric acid and then filtered. Finally, the sample was conveniently diluted using a 2 wt% HNO3
water solution.
3.5. Electrochemical Characterisation
The electrochemical characterisation of the Bi-based electrodes was performed in a three-electrode
configuration glass cell in Ar or CO2 -saturated 0.5 M KHCO3 (99.7%, Sigma Aldrich) solution using a
platinum wire and an AgCl/Ag (3.5 M KCl) as counter and reference electrodes, respectively. Cyclic
voltammetry (CV) experiments were performed using a PGSTAT302N system (Metrohm Autolab B. V.,
Utrecht, Netherlands). All CV measurements were performed at 25 ± 1 ◦ C. Currents were normalisedMolecules 2019, 24, 2032 10 of 15
by the geometric area of the electrodes. For sake of comparison, a massive Bi rod (bismuth rod, 11 mm
diameter, 99.99% (metals basis), Alfa Aesar) was also employed. CO2 electroreduction electrolyses
were performed in an H-type electrochemical cell with divided compartments through a cationic ion
exchange membrane (Nafion 112). A CO2 -saturated 0.5 M KHCO3 solution (CO2 continuous flux
of 200 mL min−1 ) was used as catholyte. The anolyte was a 1.0 M KOH (85%, Panreac, Barcelona,
Spain) solution. The Nafion 112 membrane was previously activated in 0.1 M NaOH for 24 h. A long
platinum wire immersed in the anolyte acted as counter electrode. An AgCl/Ag (3.5 M KCl) electrode
placed in the catholyte was reference electrode. The CO2 electroreduction electrolyses were carried
out by chronoamperometry measurements at controlled potential between −1.5 V and −1.8 V for 3 h
using the PGSTAT302N. The conversion of CO2 to formate was followed by ionic chromatography
(690 Ion Chromatograph Ω Metrohm, Herisau, Switzerland), with conductivity range of 1000 µScm−1
and sensitivity of 200 µScm−1 ), with an AS9-HC (Dionex, Sunnyvale, CA, USA) coupled to an UV-Vis
detector. The mobile phase consisted of 4.5 mM Na2 CO3 with pH < 12. A calibrate curve was
initially carried out from 0 to 60 ppm in 0.005 M KHCO3 , that is, a 100 times dilution of the catholyte.
The calibration curve is included in the Supporting Information (Figure S7).
4. Conclusions
An easy, fast and scalable methodology for the preparation of BiNPs at room conditions has
been described. The nanoparticles have been characterised, presenting a particle size of about 10 nm,
an oxidised state, and a good dispersion on the carbon substrate. Their electrochemical characterisation
shows similar features than that observed with a massive Bi rod. The electrocatalytic properties of the
nanoparticles towards CO2 reduction to formate have been evaluated. As expected, the sample displays
a high activity and selectivity towards formate. In 3-h CO2 electroreduction electrolyses, we have
found that the optimal electrode potential is −1.6 V vs AgCl/Ag at which the concentration of formate
was about 77 mM with a Faradaic efficiency of 93 ± 2.5%. A ~ 100% Faradaic efficiency was observed
at a lower potential (−1.5 V vs AgCl/Ag) at expenses of lowering the formate concentration (~55 mM).
The stability of the Bi-based electrodes has been preliminary tested. Unfortunately, our findings show
that, after about 70 h (in 3-h electrolysis experiments at different potentials), the electrode deactivates.
This deactivation is attributed to a gradual loss of Bi as shown by SEM/EDX analyses. A 24 h experiment
suggests that the degradation takes place under working conditions. More work is in progress to
understand this degradation mechanism and to enhance the durability of the Bi electrodes. Future
research also involves the use of these carbon supported Bi nanoparticles to prepare Gas Diffusion
Electrodes (GDEs) as previously described with Sn nanoparticles [82].
Supplementary Materials: The following are available online at http://www.mdpi.com/1420-3049/24/11/2032/s1,
Figure S1: TEM images of unsupported BiNPs synthesized from different stoichiometric PVP to BiCl3 ratios,
Figure S2: XRD diffractograms of BiNPs prepared with a PVP to Bi ratio 1, Figure S3: XRD diffractogram of BiNPs
prepared with a PVP to Bi ratio of 1 and washed with non-anhydrous ethanol instead of acetone, Figure S4: High
resolution XPS spectra recorded of Bi 4f region of the Bi/C electrodes, Figure S5: Cyclic voltammograms obtained
in Ar-saturated 0.5 M KHCO3 solution at a scan rate of 50 mV s−1 saturated with a (red) Bi/C electrode (Bi loading:
0.1 mg cm−2 ) and with a (black) massive Bi rod, Figure S6: Cyclic voltammograms in Ar (black) and CO2 (red)
saturated 0.5 M KHCO3 solution at a scan rate of 50 mV s−1 with a Vulcan XC-72R carbon electrode (without Bi),
Figure S7: Formate calibrate curve obtained from ionic chromatography analysis, Figure S8: Chronoamperometric
measurements at relevant potentials for 3 h, Figure S9: Faradaic efficiency for formate production at different
controlled potential as a function of time, Figure S10: Formate concentration vs time at different potentials,
Figure S11: Back-scattered electrons field emission SEM images of the Bi-based electrodes as-prepared, and after
aprox. 70, Figure S12: Chronoamperometric measurement during 24 h.
Author Contributions: Conceptualization, V.M. and J.S.-G.; Data curation, B.Á.-B., L.G.-C and J.S.-G; Formal
analysis, B.Á.-B., L.G.-C. and J.S.-G; Investigation, B.Á.-B., L.G.-C. and J.S.-G.; Methodology, L.G.-C and J.S.-G.;
Supervision, V.M. and J.S.-G.; Writing—original draft, B.Á.-B., and L.G.-C; Writing-review & editing, B.Á.-B.,
L.G.-C and J.S.-G.
Funding: This research was funded by the Spanish Ministry of Economy, Industry and Competitiveness (MINECO),
project CTQ2016-76231-C2-2-R (AEI/FEDER, UE).Molecules 2019, 24, 2032 11 of 15
Acknowledgments: J.S.-G. acknowledges financial support from VITC (Vicerrectorado de Investigación y
Transferencia de Conocimiento) of the University of Alicante (UATALENTO16-02).
Conflicts of Interest: The authors declare no conflict of interest.
References
1. Figueroa, J.D.; Fout, T.; Plasynski, S.; McIlvried, H.; Srivastava, R.D. Advances in CO2 capture
technology—The U.S. Department of Energy’s Carbon Sequestration Program. Int. J. Greenh. Gas Con.
2008, 2, 9–20. [CrossRef]
2. Aresta, M.; Dibenedetto, A.; Angelini, A. Catalysis for the Valorization of Exhaust Carbon: From CO2 to
Chemicals, Materials, and Fuels. Technological Use of CO2 . Chem. Rev. 2014, 114, 1709–1742. [CrossRef]
[PubMed]
3. Qiao, J.; Liu, Y.; Zhang, J. Electrochemical Reduction of Carbon Dioxide: Fundamentals and Technologies, 1st ed.;
Qiao, J., Liu, Y., Zhang, J., Eds.; CRC Press: Boca Raton, FL, USA, 2016.
4. Wu, J.J.; Zhou, X.D. Catalytic conversion of CO2 to value added fuels: Current status, challenges, and future
directions. Chin. J. Catal. 2016, 37, 999–1015. [CrossRef]
5. Zhang, L.; Zhao, Z.J.; Gong, J.L. Nanostructured Materials for Heterogeneous Electrocatalytic CO2 Reduction
and their Related Reaction Mechanisms. Angew. Chem. 2017, 56, 11326–11353. [CrossRef]
6. Arán-Ais, R.M.; Gao, D.; Roldan Cuenya, B. Structure- and Electrolyte-Sensitivity in CO2 Electroreduction.
Acc. Chem. Res. 2018, 51, 2906–2917. [CrossRef] [PubMed]
7. Zhang, W.; Hu, Y.; Ma, L.; Zhu, G.; Wang, Y.; Xue, X.; Chen, R.; Yang, S.; Jin, Z. Progress and Perspective
of Electrocatalytic CO2 Reduction for Renewable Carbonaceous Fuels and Chemicals. Adv. Sci. 2018, 5.
[CrossRef]
8. Wanfeng, Y.; Kamran, D.; Chen, J.; Chuan, Z. Design of Electrocatalysts and Electrochemical Cells for Carbon
Dioxide Reduction Reactions. Adv. Mater. Technol. 2018, 1700377. [CrossRef]
9. Feng, D.M.; Sun, Y.; Liu, Z.Q.; Zhu, Y.P.; Ma, T.Y. Designing nanostructured metal-based CO2 reduction
electrocatalysts. J. Nanosci. Nanotechnol. 2019, 19, 3079–3096. [CrossRef]
10. Kortlever, R.; Shen, J.; Schouten, K.J.P.; Calle-Vallejo, F.; Koper, M.T.M. Catalysts and Reaction Pathways
for the Electrochemical Reduction of Carbon Dioxide. J. Phys. Chem. Lett. 2015, 6, 4073–4082. [CrossRef]
[PubMed]
11. Kuhl, K.P.; Hatsukade, T.; Cave, E.R.; Abram, D.N.; Kibsgaard, J.; Jaramillo, T.F. Electrocatalytic Conversion
of Carbon Dioxide to Methane and Methanol on Transition Metal Surfaces. J. Am. Chem. Soc. 2014, 136,
14107–14113. [CrossRef]
12. Hori, Y.; Wakebe, H.; Tsukamoto, T.; Koga, O. Electrocatalytic process of co selectivity in electrochemical
reduction of CO2 at metal-electrodes in aqueous-media. Electrochim. Acta 1994, 39, 1833–1839. [CrossRef]
13. Lim, R.J.; Xie, M.; Sk, M.A.; Lee, J.-M.; Fisher, A.; Wang, X.; Lim, K.H. A review on the electrochemical
reduction of CO2 in fuel cells, metal electrodes and molecular catalysts. Catal. Today 2014, 233, 169–180.
[CrossRef]
14. Lu, Q.; Jiao, F. Electrochemical CO2 reduction: Electrocatalyst, reaction mechanism, and process engineering.
Nano Energy 2016, 29, 439–456. [CrossRef]
15. Hoshi, N.; Sato, E.; Hori, Y. Electrochemical reduction of carbon dioxide on kinked stepped surfaces of
platinum inside the stereographic triangle. J. Electroanal. Chem. 2003, 540, 105–110. [CrossRef]
16. Hori, Y.; Takahashi, I.; Koga, O.; Hoshi, N. Electrochemical reduction of carbon dioxide at various series of
copper single crystal electrodes. J. Mol. Catal. Chem. 2003, 199, 39–47. [CrossRef]
17. Tang, W.; Peterson, A.A.; Varela, A.S.; Jovanov, Z.P.; Bech, L.; Durand, W.J.; Dahl, S.; Norskov, J.K.;
Chorkendorff, I. The importance of surface morphology in controlling the selectivity of polycrystalline
copper for CO2 electroreduction. Phys. Chem. Chem. Phys. 2012, 14, 76–81. [CrossRef]
18. Chen, C.S.; Handoko, A.D.; Wan, J.H.; Ma, L.; Ren, D.; Yeo, B.S. Stable and selective electrochemical reduction
of carbon dioxide to ethylene on copper mesocrystals. Catal. Sci. Technol. 2015, 5, 161–168. [CrossRef]
19. Zhu, S.Q.; Shao, M.H. Surface structure and composition effects on electrochemical reduction of carbon
dioxide. J. Solid State Electrochem. 2016, 20, 861–873. [CrossRef]
20. Luo, W.J.; Nie, X.W.; Janik, M.J.; Asthagiri, A. Facet Dependence of CO2 Reduction Paths on Cu Electrodes.
ACS Catal. 2016, 6, 219–229. [CrossRef]Molecules 2019, 24, 2032 12 of 15
21. Liu, S.; Tao, H.; Zeng, L.; Liu, Q.; Xu, Z.; Liu, Q.; Luo, J.-L. Shape-Dependent Electrocatalytic Reduction of
CO2 to CO on Triangular Silver Nanoplates. J. Am. Chem. Soc. 2017, 139, 2160–2163. [CrossRef] [PubMed]
22. Kim, J.; Song, J.T.; Ryoo, H.; Kim, J.G.; Chung, S.Y.; Oh, J. Morphology-controlled Au nanostructures for
efficient and selective electrochemical CO2 reduction. J. Mater. Chem. A 2018, 6, 5119–5128. [CrossRef]
23. Back, S.; Yeom, M.S.; Jung, Y. Understanding the Effects of Au Morphology on CO2 Electrocatalysis. J. Phys.
Chem. C 2018, 122, 4274–4280. [CrossRef]
24. Gao, D.F.; Zhou, H.; Cai, F.; Wang, J.G.; Wang, G.X.; Bao, X.H. Pd-Containing Nanostructures for
Electrochemical CO2 Reduction Reaction. ACS Catal. 2018, 8, 1510–1519. [CrossRef]
25. Strasser, P.; Gliech, M.; Kuehl, S.; Moeller, T. Electrochemical processes on solid shaped nanoparticles with
defined facets. Chem. Soc. Rev. 2018, 47, 715–735. [CrossRef]
26. Kim, D.; Resasco, J.; Yu, Y.; Asiri, A.M.; Yang, P.D. Synergistic geometric and electronic effects for electrochemical
reduction of carbon dioxide using gold-copper bimetallic nanoparticles. Nat. Commun. 2014, 5. [CrossRef]
27. Monzo, J.; Malewski, Y.; Kortlever, R.; Vidal-Iglesias, F.J.; Solla-Gullon, J.; Koper, M.T.M.; Rodriguez, P.
Enhanced electrocatalytic activity of Au@Cu core@shell nanoparticles towards CO2 reduction. J. Mater.
Chem. A 2015, 3, 23690–23698. [CrossRef]
28. Zhao, X.; Luo, B.; Long, R.; Wang, C.; Xiong, Y. Composition-dependent activity of Cu-Pt alloy nanocubes for
electrocatalytic CO2 reduction. J. Mater. Chem. A 2015, 3, 4134–4138. [CrossRef]
29. Zhang, F.-Y.; Sheng, T.; Tian, N.; Liu, L.; Xiao, C.; Lu, B.-A.; Xu, B.-B.; Zhou, Z.-Y.; Sun, S.-G. Cu overlayers on
tetrahexahedral Pd nanocrystals with high-index facets for CO2 electroreduction to alcohols. Chem. Commun.
2017, 53, 8085–8088. [CrossRef]
30. Kim, D.; Xie, C.; Becknell, N.; Yu, Y.; Karamad, M.; Chan, K.; Crumlin, E.J.; Nørskov, J.K.; Yang, P.
Electrochemical Activation of CO2 through Atomic Ordering Transformations of AuCu Nanoparticles. J. Am.
Chem. Soc. 2017, 139, 8329–8336. [CrossRef]
31. Shan, C.; Martin, E.T.; Peters, D.G.; Zaleski, J.M. Site-Selective Growth of AgPd Nanodendrite-Modified
Au Nanoprisms: High Electrocatalytic Performance for CO2 Reduction. Chem. Mater. 2017, 29, 6030–6043.
[CrossRef]
32. Mistry, H.; Reske, R.; Zeng, Z.H.; Zhao, Z.J.; Greeley, J.; Strasser, P.; Cuenya, B.R. Exceptional Size-Dependent
Activity Enhancement in the Electroreduction of CO2 over Au Nanoparticles. J. Am. Chem. Soc. 2014, 136,
16473–16476. [CrossRef]
33. Zhu, W.L.; Michalsky, R.; Metin, O.; Lv, H.F.; Guo, S.J.; Wright, C.J.; Sun, X.L.; Peterson, A.A.; Sun, S.H.
Monodisperse Au Nanoparticles for Selective Electrocatalytic Reduction of CO2 to CO. J. Am. Chem. Soc.
2013, 135, 16833–16836. [CrossRef]
34. Gao, D.; Zhou, H.; Wang, J.; Miao, S.; Yang, F.; Wang, G.; Wang, J.; Bao, X. Size-Dependent Electrocatalytic
Reduction of CO2 over Pd Nanoparticles. J. Am. Chem. Soc. 2015, 137, 4288–4291. [CrossRef]
35. Loiudice, A.; Lobaccaro, P.; Kamali, E.A.; Thao, T.; Huang, B.H.; Ager, J.W.; Buonsanti, R. Tailoring Copper
Nanocrystals towards C-2 Products in Electrochemical CO2 Reduction. Angew. Chem. 2016, 55, 5789–5792.
[CrossRef]
36. Duan, X.C.; Xu, J.T.; Wei, Z.X.; Ma, J.M.; Guo, S.J.; Wang, S.Y.; Liu, H.K.; Dou, S.X. Metal-Free Carbon
Materials for CO2 Electrochemical Reduction. Adv. Mater. 2017, 29. [CrossRef]
37. Guanyu, L.; Thanh, T.P.; Hongjun, C.; Antonio, T. A Review of Metal- and Metal-Oxide-Based Heterogeneous
Catalysts for Electroreduction of Carbon Dioxide. Adv. Sustainable Syst. 2018. [CrossRef]
38. Schouten, K.J.P.; Gallent, E.P.; Koper, M.T.M. The influence of pH on the reduction of CO and CO2 to
hydrocarbons on copper electrodes. J. Electroanal. Chem. 2014, 716, 53–57. [CrossRef]
39. Varela, A.S.; Kroschel, M.; Reier, T.; Strasser, P. Controlling the selectivity of CO2 electroreduction on copper:
The effect of the electrolyte concentration and the importance of the local pH. Catal. Today 2016, 260, 8–13.
[CrossRef]
40. Verma, S.; Lu, X.; Ma, S.C.; Masel, R.I.; Kenis, P.J.A. The effect of electrolyte composition on the electroreduction
of CO2 to CO on Ag based gas diffusion electrodes. Phys. Chem. Chem. Phys. 2016, 18, 7075–7084. [CrossRef]
41. Varela, A.S.; Ju, W.; Reier, T.; Strasser, P. Tuning the Catalytic Activity and Selectivity of Cu for CO2
Electroreduction in the Presence of Halides. ACS Catal. 2016, 6, 2136–2144. [CrossRef]Molecules 2019, 24, 2032 13 of 15
42. Medina-Ramos, J.; Lee, S.S.; Fister, T.T.; Hubaud, A.A.; Sacci, R.L.; Mullins, D.R.; DiMeglio, J.L.; Pupillo, R.C.;
Velardo, S.M.; Lutterman, D.A.; et al. Structural Dynamics and Evolution of Bismuth Electrodes during
Electrochemical Reduction of CO2 in Imidazolium-Based Ionic Liquid Solutions. ACS Catal. 2017, 7,
7285–7295. [CrossRef]
43. Rumayor, M.; Dominguez-Ramos, A.; Irabien, A. Formic Acid manufacture: Carbon dioxide utilization
alternatives. Appl. Sci. 2018, 8, 914. [CrossRef]
44. Álvarez, A.; Bansode, A.; Urakawa, A.; Bavykina, A.V.; Wezendonk, T.A.; Makkee, M.; Gascon, J.; Kapteijn, F.
Challenges in the Greener Production of Formates/Formic Acid, Methanol, and DME by Heterogeneously
Catalyzed CO2 Hydrogenation Processes. Chem. Rev. 2017, 117, 9804–9838. [CrossRef]
45. Pérez-Fortes, M.; Schöneberger, J.C.; Boulamanti, A.; Harrison, G.; Tzimas, E. Formic acid synthesis using CO2
as raw material: Techno-economic and environmental evaluation and market potential. Int. J. Hydrog. Energy
2016, 41, 16444–16462. [CrossRef]
46. Rees, N.V.; Compton, R.G. Sustainable energy: A review of formic acid electrochemical fuel cells. J. Solid
State Electrochem. 2011, 15, 2095–2100. [CrossRef]
47. Ong, B.C.; Kamarudin, S.K.; Basri, S. Direct liquid fuel cells: A review. Int. J. Hydrog. Energy 2017, 42,
10142–10157. [CrossRef]
48. Jeong, K.J.; Miesse, C.A.; Choi, J.H.; Lee, J.; Han, J.; Yoon, S.P.; Nam, S.W.; Lim, T.H.; Lee, T.G. Fuel crossover
in direct formic acid fuel cells. J. Power Sources 2007, 168, 119–125. [CrossRef]
49. Czaun, M.; Kothandaraman, J.; Goeppert, A.; Yang, B.; Greenberg, S.; May, R.B.; Olah, G.A.; Prakash, G.K.S.
Iridium-Catalyzed Continuous Hydrogen Generation from Formic Acid and Its Subsequent Utilization in a
Fuel Cell: Toward a Carbon Neutral Chemical Energy Storage. ACS Catal. 2016, 6, 7475–7484. [CrossRef]
50. Singh, A.K.; Singh, S.; Kumar, A. Hydrogen energy future with formic acid: a renewable chemical hydrogen
storage system. Catal. Sci. Technol. 2016, 6, 12–40. [CrossRef]
51. Noda, H.; Ikeda, S.; Oda, Y.; Imai, K.; Maeda, M.; Ito, K. Electrochemical reduction of carbon-dioxide at
various metal-electrodes in aqueous potassium hydrogen carbonate solution. Bull. Chem. Soc. Jpn 1990, 63,
2459–2462. [CrossRef]
52. Chen, Z.P.; Wang, N.L.; Yao, S.Y.; Liu, L.C. The flaky Cd film on Cu plate substrate: An active and efficient
electrode for electrochemical reduction of CO2 to formate. J. CO2 Util. 2017, 22, 191–196. [CrossRef]
53. Detweiler, Z.M.; White, J.L.; Bernasek, S.L.; Bocarsly, A.B. Anodized Indium Metal Electrodes for Enhanced
Carbon Dioxide Reduction in Aqueous Electrolyte. Langmuir 2014, 30, 7593–7600. [CrossRef]
54. White, J.L.; Bocarsly, A.B. Enhanced Carbon Dioxide Reduction Activity on Indium-Based Nanoparticles.
J. Electrochem. Soc. 2016, 163, H410–H416. [CrossRef]
55. Del Castillo, A.; Alvarez-Guerra, M.; Solla-Gullon, J.; Saez, A.; Montiel, V.; Irabien, A. Electrocatalytic
reduction of CO2 to formate using particulate Sn electrodes: Effect of metal loading and particle size.
Appl. Energy 2015, 157, 165–173. [CrossRef]
56. Medina-Ramos, J.; Pupillo, R.C.; Keane, T.P.; DiMeglio, J.L.; Rosenthal, J. Efficient Conversion of CO2 to CO
Using Tin and Other Inexpensive and Easily Prepared Post-Transition Metal Catalysts. J. Am. Chem. Soc.
2015, 137, 5021–5027. [CrossRef]
57. Zhang, R.; Lv, W.X.; Lei, L.X. Role of the oxide layer on Sn electrode in electrochemical reduction of CO2 to
formate. Appl. Surf. Sci. 2015, 356, 24–29. [CrossRef]
58. Wu, J.J.; Risalvato, F.G.; Ma, S.G.; Zhou, X.D. Electrochemical reduction of carbon dioxide III. The role of
oxide layer thickness on the performance of Sn electrode in a full electrochemical cell. J. Mater. Chem. A
2014, 2, 1647–1651. [CrossRef]
59. Vanýsek, P. Handbook of Chemistry and Physics, 93rd ed.; Haynes, W.M., Ed.; CRC Press: Boca Raton, FL, USA,
2012; pp. 5–80.
60. Greeley, J.; Jaramillo, T.F.; Bonde, J.; Chorkendorff, I.; Nørskov, J.K. Computational high-throughput screening
of electrocatalytic materials for hydrogen evolution. Nat. Mater. 2006, 5, 909–913. [CrossRef]
61. Zu, M.Y.; Zhang, L.; Wang, C.; Zheng, L.R.; Yang, H.G. Copper-modulated bismuth nanocrystals alter the
formate formation pathway to achieve highly selective CO2 electroreduction. J. Mater. Chem. A 2018, 6,
16804–16809. [CrossRef]Molecules 2019, 24, 2032 14 of 15
62. Zhang, H.; Ma, Y.; Quan, F.J.; Huang, J.J.; Jia, F.L.; Zhang, L.Z. Selective electro-reduction of CO2 to formate
on nanostructured Bi from reduction of BiOCl nanosheets. Electrochem. Commun. 2014, 46, 63–66. [CrossRef]
63. Zhong, H.X.; Qiu, Y.L.; Zhang, T.T.; Li, X.F.; Zhang, H.M.; Chen, X.B. Bismuth nanodendrites as a high
performance electrocatalyst for selective conversion of CO2 to formate. J. Mater. Chem. A 2016, 4, 13746–13753.
[CrossRef]
64. Bei, J.J.; Zhang, R.; Chen, Z.D.; Lv, W.X.; Wang, W. Efficient Reduction of CO2 to Formate Using in Situ
Prepared Nano-Sized Bi Electrocatalyst. Int. J. Electrochem. Sci. 2017, 12, 2365–2375. [CrossRef]
65. Lv, W.X.; Zhou, J.; Bei, J.J.; Zhang, R.; Wang, L.; Xu, Q.; Wang, W. Electrodeposition of nano-sized bismuth on
copper foil as electrocatalyst for reduction of CO2 to formate. Appl. Surf. Sci. 2017, 393, 191–196. [CrossRef]
66. Lv, W.X.; Bei, J.J.; Zhang, R.; Wang, W.J.; Kong, F.Y.; Wang, L.; Wang, W. Bi2O2CO3 Nanosheets as
Electrocatalysts for Selective Reduction of CO2 to Formate at Low Overpotential. ACS Omega 2017, 2,
2561–2567. [CrossRef]
67. Kim, S.; Dong, W.J.; Gim, S.; Sohn, W.; Park, J.Y.; Yoo, C.J.; Jang, H.W.; Lee, J.L. Shape-controlled bismuth
nanoflakes as highly selective catalysts for electrochemical carbon dioxide reduction to formate. Nano Energy
2017, 39, 44–52. [CrossRef]
68. Sun, X.F.; Zhu, Q.G.; Kang, X.C.; Liu, H.Z.; Qian, Q.L.; Zhang, Z.F.; Han, B.X. Molybdenum-Bismuth
Bimetallic Chalcogenide Nanosheets for Highly Efficient Electrocatalytic Reduction of Carbon Dioxide to
Methanol. Angew. Chem. Int. Ed. 2016, 55, 6771–6775. [CrossRef]
69. Zhang, X.; Lei, T.; Liu, Y.Y.; Qiao, J.L. Enhancing CO2 electrolysis to formate on facilely synthesized Bi
catalysts at low overpotential. Appl. Catal. B-Environ. 2017, 218, 46–50. [CrossRef]
70. Bertin, E.; Garbarino, S.; Roy, C.; Kazemi, S.; Guay, D. Selective electroreduction of CO2 to formate on Bi and
oxide-derived Bi films. J. CO2 Util. 2017, 19, 276–283. [CrossRef]
71. García de Arquer, F.P.; Bushuyev, O.S.; De Luna, P.; Dinh, C.-T.; Seifitokaldani, A.; Saidaminov, M.I.; Tan, C.-S.;
Quan, L.N.; Proppe, A.; Kibria, M.G.; et al. 2D Metal Oxyhalide-Derived Catalysts for Efficient CO2
Electroreduction. Adv. Mater. 2018, 30. [CrossRef]
72. Qiu, Y.; Du, J.; Dai, C.; Dong, W.; Taoz, C. Bismuth nano-flowers as a highly selective catalyst for electrochemical
reduction of CO2 to formate. J. Electrochem. Soc. 2018, 165, H594–H600. [CrossRef]
73. Miao, C.-C.; Yuan, G.-Q. Morphology-Controlled Bi2 O3 Nanoparticles as Catalysts for Selective
Electrochemical Reduction of CO2 to Formate. ChemElectroChem 2018, 5, 3741–3747. [CrossRef]
74. Koh, J.H.; Won, D.H.; Eom, T.; Kim, N.K.; Jung, K.D.; Kim, H.; Hwang, Y.J.; Min, B.K. Facile CO2
Electro-Reduction to Formate via Oxygen Bidentate Intermediate Stabilized by High-Index Planes of Bi
Dendrite Catalyst. ACS Catal. 2017, 7, 5071–5077. [CrossRef]
75. Lee, C.W.; Hong, J.S.; Yang, K.D.; Jin, K.; Lee, J.H.; Ahn, H.-Y.; Seo, H.; Sung, N.-E.; Nam, K.T. Selective
Electrochemical Production of Formate from Carbon Dioxide with Bismuth-Based Catalysts in an Aqueous
Electrolyte. ACS Catal. 2018, 8, 931–937. [CrossRef]
76. Zhang, X.; Hou, X.; Zhang, Q.; Cai, Y.; Liu, Y.; Qiao, J. Polyethylene glycol induced reconstructing Bi
nanoparticle size for stabilized CO2 electroreduction to formate. J. Catal. 2018, 365, 63–70. [CrossRef]
77. Qiu, Y.; Du, J.; Dong, W.; Dai, C.; Tao, C. Selective conversion of CO2 to formate on a size tunable nano-Bi
electrocatalyst. J. CO2 Util. 2017, 20, 328–335. [CrossRef]
78. Han, N.; Wang, Y.; Yang, H.; Deng, J.; Wu, J.; Li, Y.; Li, Y. Ultrathin bismuth nanosheets from in situ topotactic
transformation for selective electrocatalytic CO2 reduction to formate. Nat. Commun. 2018, 9. [CrossRef]
79. Su, P.; Xu, W.; Qiu, Y.; Zhang, T.; Li, X.; Zhang, H. Ultrathin Bismuth Nanosheets as a Highly Efficient CO2
Reduction Electrocatalyst. ChemSusChem. 2018, 11, 848–853. [CrossRef]
80. Zhang, Y.; Li, F.; Zhang, X.; Williams, T.; Easton, C.D.; Bond, A.M.; Zhang, J. Electrochemical reduction
of CO2 on defect-rich Bi derived from Bi2S3 with enhanced formate selectivity. J. Mater. Chem. A 2018, 6,
4714–4720. [CrossRef]
81. Moulder, J.F.; Stickle, W.F.; Sobol, P.E.; Bomben, K.D. Handbook of X Ray Photoelectron Spectroscopy: A
Reference Book of Standard for Identification and Interpretation of Xps Data, 1st ed.; Physical Electronics Division,
Perkin-Elmer Corporation: Eden Prairie, MN, USA, 1995.You can also read