Surface production of negative ions from pulse-biased nitrogen doped diamond within a low-pressure deuterium plasma
←
→
Page content transcription
If your browser does not render page correctly, please read the page content below
Journal of Physics D: Applied Physics

PAPER • OPEN ACCESS

Surface production of negative ions from pulse-biased nitrogen doped
diamond within a low-pressure deuterium plasma
To cite this article: Gregory J Smith et al 2021 J. Phys. D: Appl. Phys. 54 435201

View the article online for updates and enhancements.

                                This content was downloaded from IP address 46.4.80.155 on 19/09/2021 at 19:30
Journal of Physics D: Applied Physics
J. Phys. D: Appl. Phys. 54 (2021) 435201 (13pp) https://doi.org/10.1088/1361-6463/ac18ee
Surface production of negative ions
from pulse-biased nitrogen doped
diamond within a low-pressure
deuterium plasma
Gregory J Smith1,∗, Lenny Tahri2, Jocelyn Achard3, Riadh Issaoui3, Timo Gans1,4,
James P Dedrick1 and Gilles Cartry2
1
York Plasma Institute, Department of Physics, University of York, Heslington, York YO10 5DD,
United Kingdom
2
Aix-Marseille Université /CNRS, PIIM, UMR 6633, Centre de St Jérôme, Case 241, 13397 Marseille,
Cedex 20, France
3
LSPM-CNRS, UPR 3407, Université Sorbonne Paris Nord, Avenue JB Clement, 93430 Villetaneuse,
France
4
School of Physical Sciences & National Centre for Plasma Science and Technology (NCPST),
Dublin City University, 9 Dublin, Ireland
E-mail: gjs507@york.ac.uk
Received 18 March 2021, revised 16 July 2021
Accepted for publication 29 July 2021
Published 9 August 2021
Abstract
The production of negative ions is of significant interest for applications including mass
spectrometry, materials surface processing, and neutral beam injection for magnetic confined
fusion. Neutral beam injection sources maximise negative ion production through the use of
surface production processes and low work function metals, which introduce complex
engineering. Investigating materials and techniques to avoid the use of low work function metals
is of interest to broaden the application of negative ion sources and simplify future devices. In
this study, we use pulsed sample biasing to investigate the surface production of negative ions
from nitrogen doped diamond. The use of a pulsed bias allows for the study of insulating
samples in a preserved surface state at temperatures between 150 ◦ C and 700 ◦ C in a 2 Pa,
130 W, (ne ∼ 109 cm−3 , Te ∼ 0.6 eV) inductively coupled deuterium plasma. The negative ion
yield during the application of a pulsed negative bias is measured using a mass spectrometer and
found to be approximately 20% higher for nitrogen doped diamond compared to non-doped
diamond. It is also shown that the pulsed sample bias has a lower peak negative ion
yield compared to a continuous sample bias, which suggests that the formation of an
optimum ratio of defects on its surface can be favourable for negative ion
production.
∗
Author to whom any correspondence should be addressed.
Original Content from this work may be used under the
terms of the Creative Commons Attribution 4.0 licence. Any
further distribution of this work must maintain attribution to the author(s) and
the title of the work, journal citation and DOI.
1361-6463/21/435201+13$33.00 1 © 2021 The Author(s). Published by IOP Publishing Ltd Printed in the UK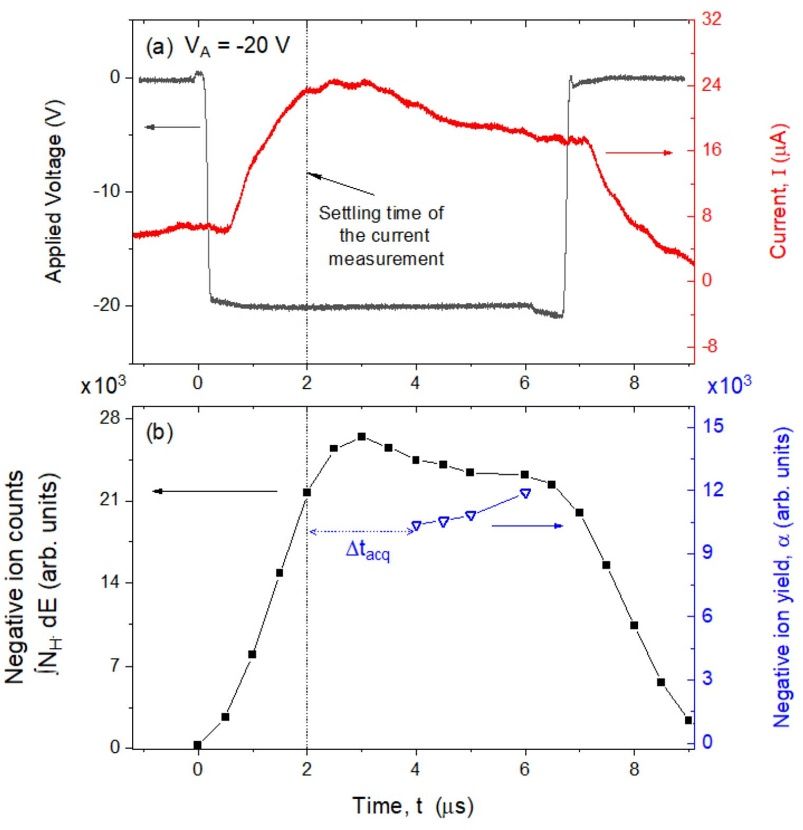
J. Phys. D: Appl. Phys. 54 (2021) 435201                                                                                      G J Smith et al

Keywords: negative ions, diamond, surface production, deuterium plasma
(Some figures may appear in colour only in the online journal)

1. Introduction                                                               In this study, we investigate negative ion production using
                                                                           a pulsed sample biasing technique. The use of a pulsed bias
Negative ions play an important role in applications includ-               lowers the positive ion average energy which preserves the sur-
ing particle acceleration [1–5], neutron generation [6, 7], mass           face state of the sample, and enables the surface biasing of an
spectrometry [8–11], spacecraft propulsion [12–14], micro-                 insulating surface. The negative ion yield is compared between
processor manufacturing [15] and neutral beam heating for                  un-doped micro crystalline diamond (MCD) and MCNDD
magnetic confinement fusion (MCF) [16–19].                                 films. This comparison is carried out over a temperature range
    In plasma-based sources, negative ions are produced using              between 150 ◦ C and 700 ◦ C to develop the understanding of
either volume production or surface-production processes,                  negative ion production from diamond at temperatures below
however surface production processes are typically dominant                450 ◦ C where MCNDD is non-conductive [41, 43, 44]. The
where a high current of negative ions are required [1, 11, 16].            experimental method is described in section 2 and the results
Increasing the negative ion production from surfaces is typic-             are presented in section 3.
ally achieved through the introduction of low work function
metals such as caesium, which introduces complex engineer-
ing challenges [16, 19–22].                                                2. Experimental setup and method
    Alternative materials to caesium are under investigation,
and these include highly oriented pyrolitic graphite (HOPG)                The experimental setup is shown in figure 1.
[20, 23–25], novel electrides [26], LaB6 , MoLa [27], as well
as those that have dielectric properties such as diamond-like-             2.1. Plasma source and diffusion chamber
carbon (DLC) and diamond [23–25, 28–33].
    Dielectric materials are of particular interest for negat-             The reactor consists of a cylindrical plasma source (100 mm
ive ion surface production due to the band gap that exists                 height and 150 mm diameter), which is separated from a
between their conduction and valence bands. The valence band               spherical diffusion chamber (200 mm diameter) by a groun-
in dielectrics is typically located at a lower level than many             ded mesh (285 µm spacing, hole size 200 µm). The mesh
other materials such as metals and semi conductors. However,               reduces radio-frequency (RF) plasma potential fluctuations in
through the combination of an image potential downshifting                 the diffusion chamber, which would otherwise alter the shape
the affinity level of an approaching particle and a reduction              of the negative ion energy distribution functions (NIEDFs)
in electron detachment due to the presence of the band gap, a              measured by the mass spectrometer [23]. The mesh also
dielectric material can be used to enhance negative ion surface            acts to increase the confinement of the plasma to the source
production [34–36].                                                        region, thereby reducing the plasma density in the diffu-
    Diamond is of particular interest due to its large band gap            sion region where the sample is located. The stability of
(5.5 eV) [37] and because of the capability to manufacture                 the plasma is therefore tracked in the diffusion region,
it with particular physical properties, such as with a domin-              described in sections 2.3 and 2.5, as distinct from the source
ant grain size or crystal orientation [37]. It can also be doped           region [33].
to further influence its properties and electronic band struc-                A low-pressure inductively coupled deuterium
ture [38–41]. Firstly, as a method to increase conductivity at             plasma was generated using an RF power generator
low temperatures through the addition of boron (p-type dop-                (Huttinger PFG 1600 RF) attached to a matchbox
ing) [28, 42], and secondly, to enhance negative ion yield                 (Huttinger PFM 3000 A). Power is coupled to the plasma
through the use of nitrogen doping (n-type doping) [33].                   through a three turn copper coil positioned on top of a
    Although the introduction of nitrogen doping has been                  dielectric ceramic window (150 mm diameter). The effect-
shown to enhance the negative ion yield from diamond, it also              ive power coupled to the plasma was 130 W as measured by
introduces a strong temperature dependency due to poor elec-               the generator.
trical conductivity at temperatures below 450 ◦ C [33]. Addi-                 The pressure in the diffusion chamber was maintained at
tionally, the magnitude of a continuous negative bias has been             2 Pa, as measured with a Baratron gauge (MKS), using a
shown to influence the negative ion yield [29]. This has previ-            mass flow controller (7.6 sccm, BROOKS 5850TR) and
ously been attributed to the formation of defects on the surface           a 150 mm diameter Riber gate valve installed in front
which alters its electronic properties [23, 29, 30]. It is therefore       of a turbo molecular pump (Alcatel ATP400). These exper-
of significant interest to investigate the negative ion yield from         imental conditions were selected to reduce the ion bom-
micro crystalline nitrogen doped diamond (MCNDD) with a                    bardment of the samples between application of negative
preserved sample surface and at temperatures where the mater-              bias and so limit their degradation during the course of the
ial is non-conductive.                                                     experiment.

                                                                       2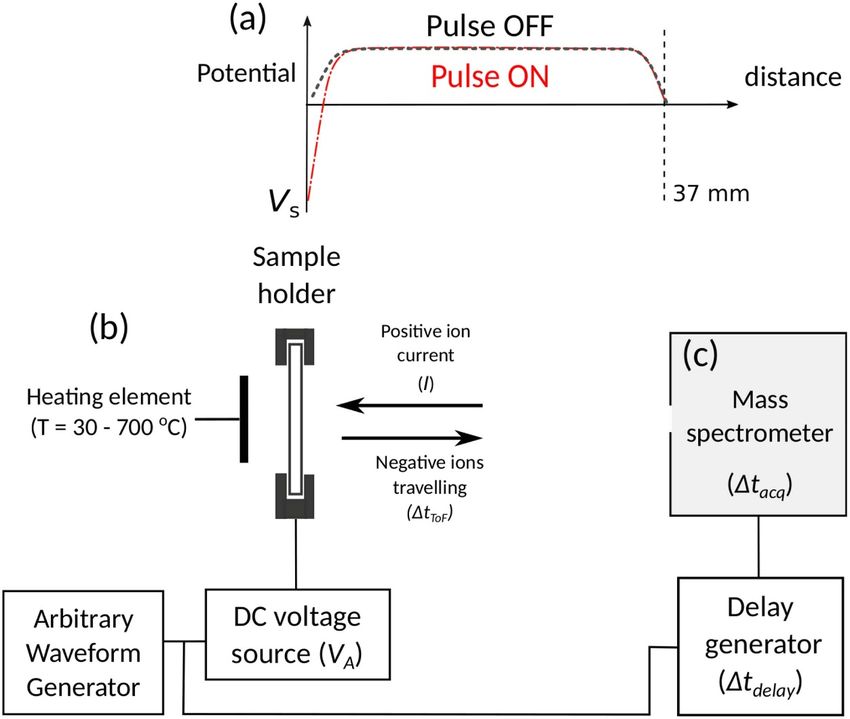
J. Phys. D: Appl. Phys. 54 (2021) 435201                                                                                      G J Smith et al

                                                                          diffusion chamber as shown in figure 1(c). It was not possible
                                                                          in this experimental campaign to position the Langmuir probe
                                                                          in front of the sample, meaning measurements were made in
                                                                          a position close to the centre of the diffusion chamber, which
                                                                          gives an indication of the plasma properties within the cham-
                                                                          ber, as shown in figure 1.
                                                                              The Langmuir probe was RF compensated, with a cyl-
                                                                          indrical tungsten probe tip of length 6.5 mm and 110 µm
                                                                          radius. The tip was cleaned prior to each measurement by
                                                                          biasing it with a high positive voltage to heat the probe tip
                                                                          and vaporise any impurities. Representative values of the elec-
                                                                          tron density, (2.5 ± 0.5) × 109 cm−3 , electron temperature,
                                                                          (0.6 ± 0.5) eV, plasma potential (2.6 ± 0.1) V and floating
                                                                          potential (0 ± 0.1) V have been determined directly from the
                                                                          I(V) curve obtained with the Langmuir probe. From these val-
                                                                          ues the sheath width adjacent to the sample surface can be
                                                                          estimated and is roughly 1 mm and 2 mm for sample biases
                                                                          of −20 V and −130 V, respectively [47].

                                                                          2.4. Micro-crystalline diamond samples
Figure 1. Schematic of the experimental setup. (a) Plasma source          Micro crystalline diamond (MCD) films were prepared using
with associated experimental settings. (b) Sample holder and mass         plasma enhanced chemical vapour deposition (PECVD) as
spectrometer positioned within diffusion chamber. (c) Langmuir
probe positioned behind the sample holder. (d) Position of the mass
                                                                          described in [48]. Nitrogen doped diamond films were pro-
spectrometer relative to the sample holder and Langmuir probe. The        duced using a similar PECVD technique to the MCD samples
schematic is not to scale.                                                [33]. The PECVD process utilised a bell jar reactor with a pres-
                                                                          sure of 200 mbar, microwave power at 3 kW, substrate tem-
                                                                          perature of 850 ◦ C, background hydrogen gas mixture with a
2.2. Sample temperature control
                                                                          methane concentration of 5%. The ratio of nitrogen in the gas
Figure 1(b) shows a schematic of the temperature controlled               mixture was set as a means to vary the concentration of nitro-
sample holder. This was described in detail in [33] and there-            gen in the MCNDD film. Each film was deposited on to a (100)
fore an overview is provided here.                                        oriented silicon wafer.
    The sample holder was attached to a 4-axis manipulation                   In previous work, the nitrogen introduced in the gas phase
arm, which enables the positioning of the samples within the              has been correlated to the nitrogen content in the samples via
diffusion chamber and alignment of the surface to the orifice             Raman spectroscopy [33]. The introduction of the nitrogen in
of the mass spectrometer. To maximise the number of negative              the gas phase was also shown to affect the structure of the crys-
ions collected by the mass spectrometer, samples were posi-               tals grown, changing both the size and the orientation of the
tioned at a distance of 37 mm away from its orifice. Previous             crystals. This is described in additional detail in previous work
work has shown that this distance has a negligible effect on the          [33].
shape of an NIEDF measured by the mass spectrometer [45].                     The gas phase content of the MCNDD sample used in this
The alignment of the samples was regularly checked by rotat-              study was 50 ppm. In previous work, it was observed that this
ing the sample and maximising the negative ion signal.                    concentration of doping resulted in the highest negative ion
    A tungsten element, which is controlled by a proportional–            yield [33].
integral–derivative controller (PID) connected to a thermo-
couple installed into the frame of the sample holder, heats
the back of the samples. The temperature of the sample sur-               2.5. Measurement of negative ion energy distribution
face was determined by comparing the temperature measured                 functions
using the PID with the temperature measured by a thermo-                  A schematic of the sample holder and mass spectrometer, is
couple attached to the front of a calibration sample. This is             shown in figure 2.
expected to introduce an uncertainty of ±20 ◦ C for all tem-                 Figure 2(a) shows a plasma potential profile that can be
perature measurements.                                                    reasonably expected in the space between the sample surface
                                                                          and the mass spectrometer. When a bias (VA ) is applied to the
                                                                          sample using the DC voltage source as shown in figure 2(b),
2.3. Deuterium plasma characteristics
                                                                          the voltage on the sample surface (VS ) decreases. This accel-
Measurements of the deuterium plasma potential, elec-                     erates positive ions onto the sample surface. Negative ions that
tron temperature and density were made using a Langmuir                   are produced due to the positive ion bombardment are acceler-
probe (smart probe from Scientific Systems) [46] within the               ated by the negative bias such that they then cross the 37 mm

                                                                      3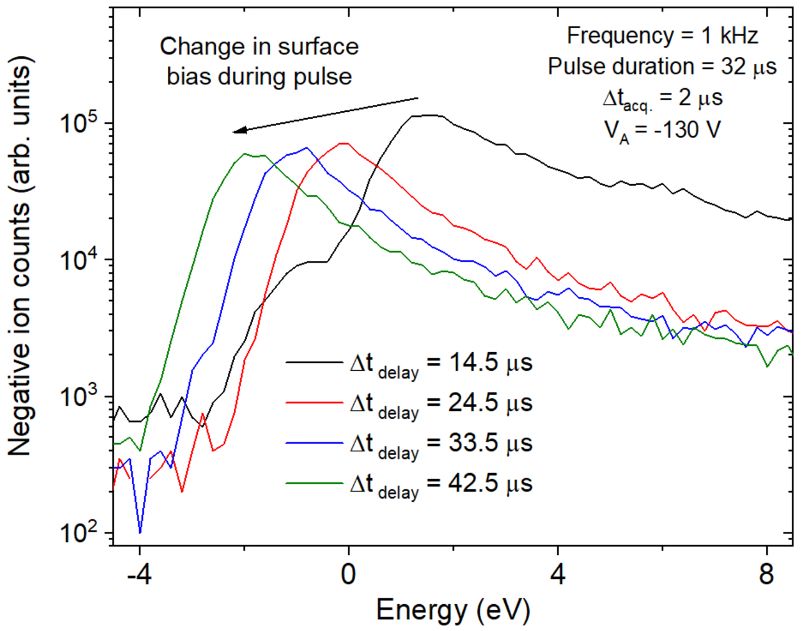
J. Phys. D: Appl. Phys. 54 (2021) 435201                                                                                     G J Smith et al

Figure 2. Schematic of the sample holder and mass spectrometer timing setup. (a) Representative plasma potential profile between the
sample holder and the mass spectrometer. (b) Sample holder with tungsten heating element and sample biasing electronics. (c) Mass
spectrometer and delay generator for measurements of the negative ion energy distribution function (NIEDF) with respect to time within the
sample bias pulse.

gap separating the sample surface and the mass spectrometer.            not observed in the experiments, which suggests that it has a
The mass spectrometer is then used to measure an NIEDF [49].            negligible contribution to the NIEDF. Previous work has also
    The relatively low gas pressure of the plasma limits ion-           investigated the production of negative ions from samples in a
neutral collisions within the diffusion chamber [45]. Any               similar experimental setup using SRIM simulations [45, 50].
collisions that occur between the negative ions produced at             This demonstrated that the main contribution of negative ions
the sample surface and the background gas are assumed to                from sample surfaces is from positive ion bombardment.
cause detachment, resulting in the destruction of the negative             To investigate the influence of positive ion energy and neg-
ion [18, 49]. The negative ions formed through volume pro-              ative ion yield, two positive ion bombardment energies are
duction processes are prevented from entering the mass spec-            considered. A ‘high-energy’ bombardment regime using an
trometer due to the plasma potential in front of the mass spec-         applied bias of −130 V, and a ‘low-energy’ regime using a
trometer orifice. This means that in the absence of a negative          bias of −20 V. Bombarding positive ions are understood to
bias, negative ions will not be not detected.                           dissociate into their constituent components during their inter-
    It is useful to also consider other potential sources of neg-       action with the sample surface [20, 51]. The plasma is primar-
ative ions that may be detected by the mass spectrometer                ily composed of D+   3 ions, resulting in a positive ion energy
e.g. production in the sheath adjacent to the sample surface            bombardment of 44 eV/nucleon and 8 eV/nucleon for a negat-
and production at the sample surface through the recom-                 ive bias of −130 V and −20 V respectively [45]. This means
bination of atomic deuterium to form an excited deuterium               that the main contribution to negative ion formation is from
molecule. In the first case, the formation of negative ions in          D+                                                       +
                                                                          3 ions and a smaller contribution is expected from D2 ions
                                                                             +
the sheath would have to be through dissociative attachment.            to D ions. The Langmuir probe measurements in section 2.3
This requires an electron to impact an excited molecule of deu-         suggest that the sheath width is smaller than ion-neutral mean
terium. As the sheath is electron deficient, this is considered         free path. It is therefore reasonable to suggest that the posit-
to be an unlikely source of negative ions. In the second case,          ive ions undergo minimal collisions when passing through the
the production of negative ions on the sample surface by neut-          sheath.
ral species would result in a peak in the NIEDFs at 0 eV as                As described above, the positive ions bombard the sample
the negative ions would effectively be formed at rest. This is          surface to produce negative ions. These are then detected by

                                                                    4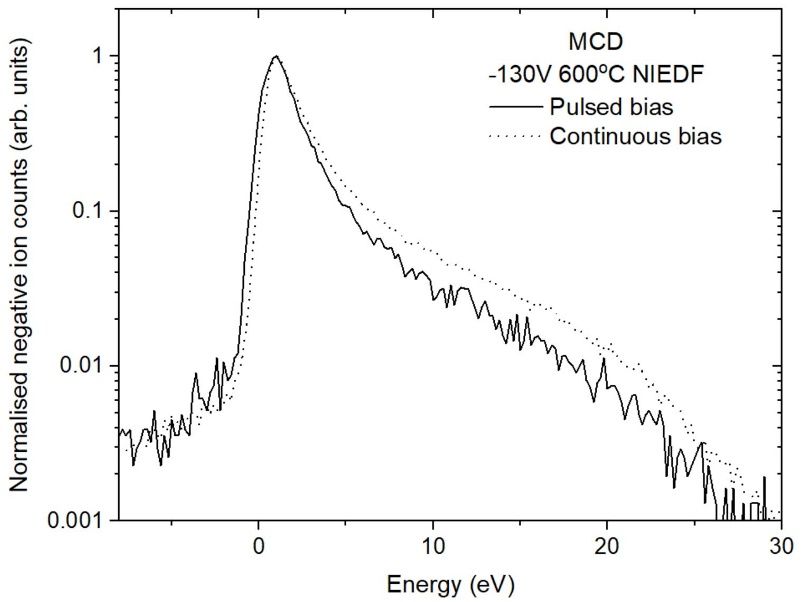
J. Phys. D: Appl. Phys. 54 (2021) 435201                                                                                            G J Smith et al

the mass spectrometer, producing an NIEDF. Once the meas-
urement has been completed, the NIEDF can be shifted to
account for the energy the negative ions possessed when they
were formed. This is possible because the total negative ion
energy, E, is conserved: [45]
                             E = Ek − eVS                     (1)

where Ek is the kinetic energy of the negative ion when it was
formed and VS is the voltage on the surface of the sample. The
NIEDFs in this article are given in terms of Ek .
    In this work, both a pulsed bias and a continuous bias is
utilised. When using a continuous bias in combination with a
conductive sample, it is reasonable to expect that VA is equi-
valent to VS and that the sheath in front of the sample is planar
because the sample holder is much larger than the area of
the sample from which negative ions are emitted compared
to the sheath width. When a pulsed bias is applied to a non-
conductive sample [30], VS becomes time dependent as a res-
ult of a build of charge on the sample surface [30]. Therefore
equation (1) is rewritten as:
                            E = Ek − eVS (t)                  (2)        Figure 3. Timing diagram for an NIEDF measurement for pulsed
                                                                         bias operation. (a) Voltage applied to the sample (VA ) generates an
                                                                         electric field that causes positive ion bombardment and accelerates
   VS (t) on a non-conductive sample is calculated by consid-            newly created negative ions towards the mass spectrometer.
ering the system as a capacitor:                                         (b) Negative ions travel from the sample to the mass spectrometer
                                                                         detector, arriving after a flight time, ∆ttof . (c) Measurement trigger
                                                                         voltage pulse (Vtrig ) sent from delay generator, shown in figure 1,
                                  Q(t)
                       VS (t) =        + VA + Vf              (3)        initiates a measurement of length ∆tacq by the mass spectrometer.
                                   C
where Q is the charge build up on the surface of the sample
due to positive ion bombardment, Vf is the floating potential                In figure 3(a), a negative bias is applied to the sample
on the sample before the application of the pulse (Vf = 0 V) as          (VA ) through the use of a waveform generator and DC voltage
measured with the Langmuir probe), and C is the capacitance              source, shown previously in figure 2(b). The negative voltage
of the sample surface in contact with the plasma.                        on the sample surface accelerates positive ions towards the
                                                                         sample and negative ions towards the mass spectrometer. The
2.6. Negative ion yield using pulsed and continuous                      time of flight (∆ttof ) for these negative ions is shown in
substrate biasing                                                        figure 3(b) and was measured to be approximately 14.5 µs or
The negative ion yield is used as a means to compare the pro-            15.5 µs when operating with ‘high’ and ‘low’ energy positive
duction of negative ions between samples, applied voltages               ion bombardment, respectively. The delay generator, shown
and biasing techniques. This is defined as:                              in figure 2(c) sends a trigger to the mass spectrometer after
                                                                         time ∆tdelay , for a duration corresponding to ∆tacq . The time
                            ˆ
                          1                                              ∆tdelay accounts for the time of flight (∆ttof ) of the negative
                    α=        ND− (E) dE                  (4)            ions from the samples to the mass spectrometer detector and
                          I
                                                                         is adjusted so that a NIEDF measurement, with a duration of
where ND− is the number of negative ion counts detected by               ∆tacq , is acquired within the negative ion pulse arriving at the
the mass spectrometer, which are integrated with respect to              mass spectrometer as shown in figure 3(c).
incident ion energy, E, and I is the positive ion current to the             The creation of negative ions on an insulating surface
sample. As only a proportion of the negative ions that are pro-          through positive ion bombardment causes the accumulation
duced by the sample surface are collected by the mass spec-              of positive charge on the sample surface. This implies that,
trometer, the negative ion yield is a relative measurement for           at t = 0 µs, Q = 0 C which means that VS is equivalent to
comparing between samples.                                               VA as shown in equation 3. This corresponds to the case where
                                                                         a conductive sample is employed [30].
2.6.1. Electrical conditions for pulsed sample biasing.        As            With reference to equation (3), the build up of positive
described in section 2.5, a surface bias is required to accelerate       charge changes the voltage on the surface, VS (t), over the dur-
positive ions towards the sample surface. Pulsed biasing was             ation of the pulse, which alters the energy that the negative
undertaken to generate the necessary electric field at the sur-          ions possess when they are measured by the mass spectro-
face of non-conductive samples, as shown in figure 3.                    meter [30]. If the duty cycle is too high, the positive charge

                                                                     5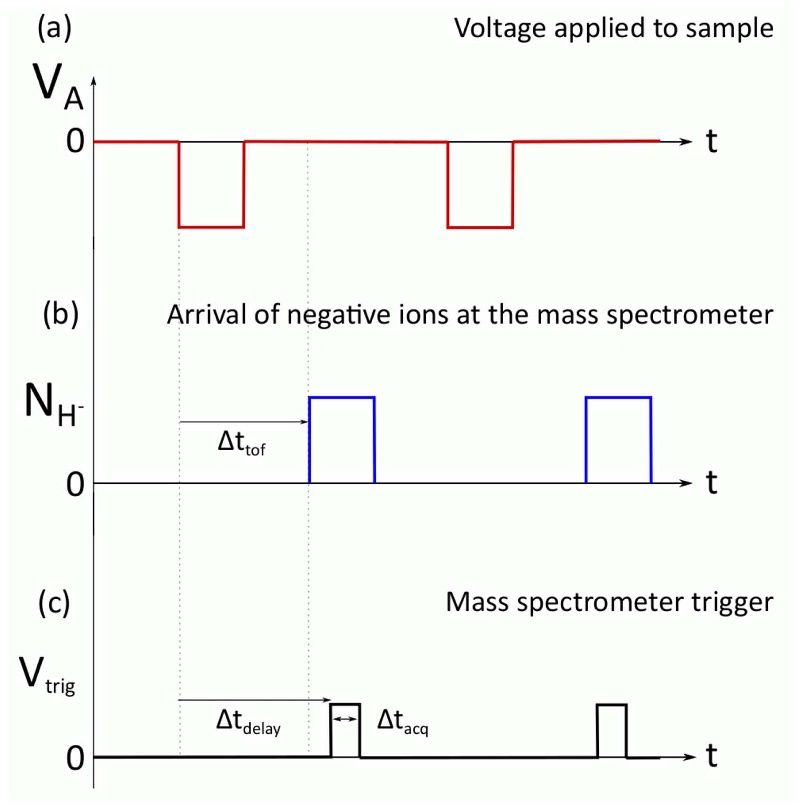
J. Phys. D: Appl. Phys. 54 (2021) 435201                                                                                           G J Smith et al

                                                                               insulating sample used in this study would be below the resol-
                                                                               ution of the mass spectrometer, thus maximising the negative
                                                                               ion signal, while minimising the shift in the surface voltage
                                                                               during the acquisition.
                                                                                   The pulse condition that was chosen for this work was a
                                                                               square waveform with a 5 kHz frequency and 6 µs duration
                                                                               (duty cycle 3%), which was selected to minimise the accumu-
                                                                               lation of positive charge on the surface of an insulating sample
                                                                               and therefore enable a reasonable comparison with samples
                                                                               that are conductive.

                                                                               2.7. Measurement of the positive ion current

                                                                               To measure the positive ion current, an electrically isolated
                                                                               copper electrode was inserted into the sample holder in the
                                                                               place of a sample. This electrode was isolated from the rest of
                                                                               the sample holder through the use of Kapton tape. The molyb-
Figure 4. NIEDFs measured for pulsed-bias operation of an                      denum bracket, used to affix samples to the sample holder,
un-heated MCD sample with respect to the delay time between the                acted as a guard ring on the electrode to reduce edge effects
application of the bias voltage and negative-ion measurement                   interfering with the measurement of the positive ion current.
trigger, ∆tdelay . Bias voltages are applied at 1 kHz with a duration of       The electrode and sample holder were electrically connec-
32 µs and applied voltage of −130 V. Low pressure deuterium
plasma is operated at 2 Pa and 130 W.
                                                                               ted in parallel to reduce differences in sheath expansion from
                                                                               affecting the positive ion current measurement.

                                                                               2.7.1. Continuous bias operation.     The current drawn from
that accumulates during the ‘on’ phase of the pulse will not dis-
                                                                               the plasma was measured using an ammeter. This was done
sipate before the next pulse [30]. Therefore a sufficiently small
                                                                               without any heating applied to the electrode to reduce the
duty cycle is utilised to enable sufficient time for the surface
                                                                               chance of overheating which could damage the Kapton tape.
potential of the sample to return to the floating potential via a
                                                                               Variations in the current to the sample due to increases in its
recombination of positive charge on the sample surface with
                                                                               temperature are expected to be approximately 5%, as determ-
the incident electron flux.
                                                                               ined from separate measurements of the current to the sample
    A series of NIEDFs were taken with increasing ∆tdelay
                                                                               holder during the experiments [33].
where the sample was biased using a square waveform pulse
                                                                                  The measurement of the current to the sample at an applied
at a frequency of 1 kHz, an amplitude of negative −130 V
                                                                               voltage of −20 V was 14.5 µA, whilst at −130 V the current
and duration of 32 µs (3.2% duty cycle). The NIEDFs, shown
                                                                               was 18 µA. The expected sheath width is approximately 1 mm
in figure 4, are generated using an insulating un-heated MCD
                                                                               or 2 mm, as determined using Langmuir probe measurements
sample with measurement duration (∆tacq ) of 2 µs.
                                                                               described in section 2.3 for a −20 V and −130 V bias respect-
    In figure 4, increasing ∆tdelay results in a shift in the peak
                                                                               ively. This is much smaller than the size of the sample holder,
of the NIEDF towards lower ion energies. This is because as
                                                                               which is approximately a rectangle of side lengths of 3 cm.
∆tdelay increases, the surface bias VS starts to increase due to
                                                                               Therefore the sheath is expected to be approximately planar
a build up of positive charge on the non-conductive surface.
                                                                               across the surface of the sample.
Within a single pulse, at t = 0 µs, the charge built up on the
sample surface, Q from equation (3), will be zero. This means
that the applied voltage, VA will be approximately equal to VS .               2.7.2. Pulsed bias operation.      In pulsed bias operation, the
In the case where a sample is conductive, equation (1) can be                  instantaneous positive ion current was determined using the
used in the place of equation (2) and VS can be substituted                    same setup as described in section 2.7 for the continuous bias,
with VA so that the NIEDFs of a conductive sample can be                       with a copper electrode inserted into the sample holder in place
presented in terms of Ek by rearranging equation (1) [49]. In                  of a sample. A current–voltage converter, based upon a trans-
the case where a sample is non conductive as shown in figure 4                 impedance amplifier, was custom built to measure the sample
the difference between VA and VS will increase over time. This                 current with an oscilloscope (Teledyne LeCroy Wavesurfer
results in the observed shift in figure 4 the negative ion energy              4mXs-B). The current within a pulse was first measured with
peak as ∆tdelay is increased [30].                                             the plasma on, and then with the plasma off to account for leak-
    Changes in VS during ∆tacq resulting in a ‘smeared’ NIEDF                  age currents that are present due to the parasitic capacitance of
are avoided by utilising a short ∆tacq . The data in figure 4                  the cables. The effective sample current was obtained by sub-
demonstrates that a change in the surface voltage of 0.1 V                     tracting plasma off measurement from the plasma on meas-
µs−1 can be expected for insulating samples when using a duty                  urement. Representative measurements of the applied voltage
cycle of 3.2%. ∆tacq was chosen to be 2 µs due to this being the               and positive ion current to the sample, and corresponding time-
longest time over which a change in the surface voltage on an                  resolved negative ion yield, are shown in figure 5.

                                                                           6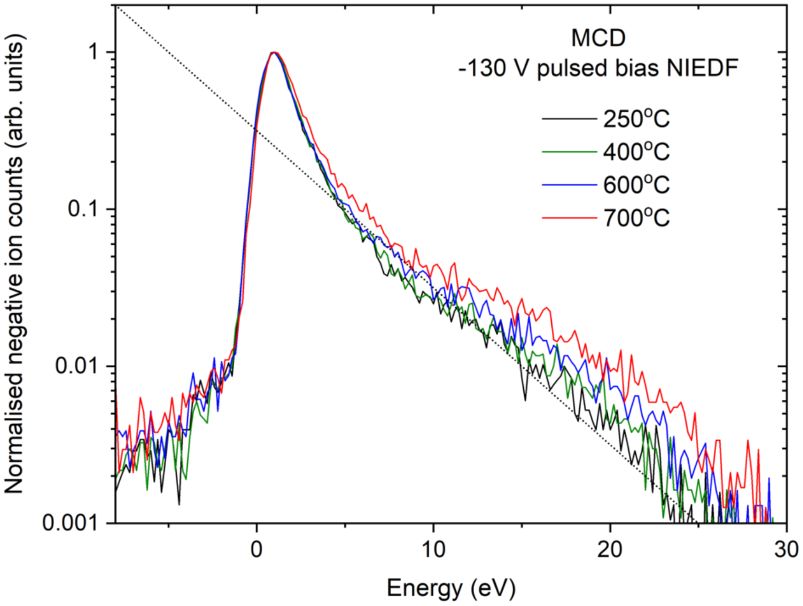
J. Phys. D: Appl. Phys. 54 (2021) 435201 G J Smith et al
whilst also ensuring that the sample is fully conductive [33].
From 0 µs, the negative ion counts increases from a negligible
amount of negative ions to a peak at 1 µs. This roughly aligns
with the measured peak in the positive ion current, shown in
figure 5(a). After this peak the counts decrease by 3 × 10⁻³
over the duration of the pulse, before decaying to zero rap-
idly at the end of the pulse. Negative ions are measured during
an acquisition window of ∆tacq which in this study is set to
2 µs. It is observed in figure 5(a) that the current changes by
approximately 5 µA over the course of ∆tacq .
To compare the relative negative ion yield between
samples, a consistent temporal position in the negative ion
pulse at t = 4 µs encompassing a ∆tacq window between
2 µs and 4 µs is chosen, as shown in figure 5(b). This period
was chosen as it is the earliest point in time that the current can
be determined, thus minimising the build up of positive ions
on the surface of the samples.
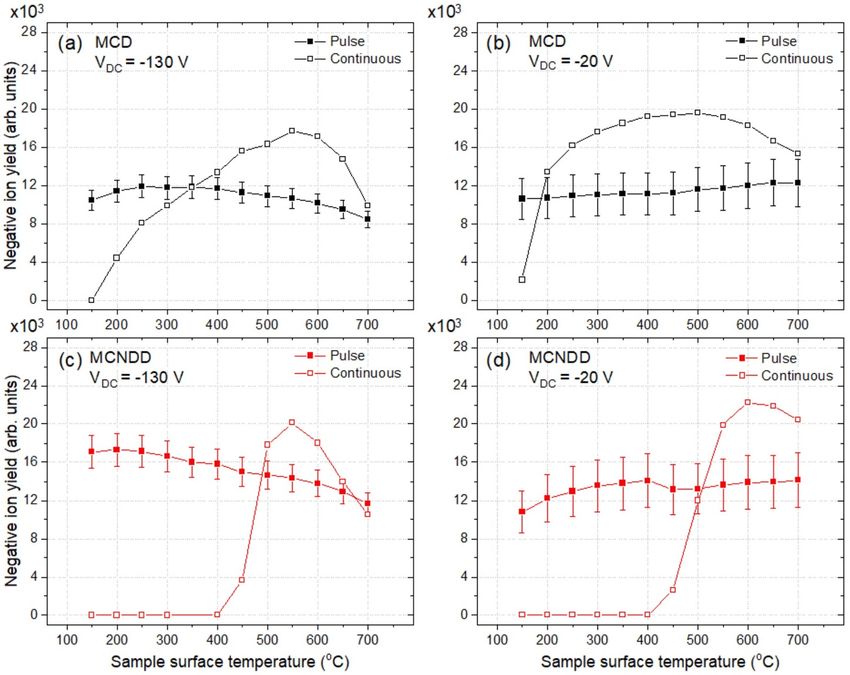
3. Negative ion yield: comparison of MCD and
MCNDD for pulsed and continuous biases
Figure 5. (a) Voltage applied to sample holder and copper electrode Figure 6 shows the negative ion yield measured using MCD
with corresponding positive ion current. (b) Negative ion counts and MCNDD for ‘high-energy’ and ‘low-energy’ positive ion
measured with incrementally increasing ∆tdelay for a ∆tacq of 2 µs. bombardment conditions in continuous and pulsed sample bias
In (b), ∆tacq is shown for the first data point of the negative ion yield
operation.
measurement at t = 4 µs. Low pressure deuterium plasma is
operated at 2 Pa and 130 W. Solid lines have been added to guide Uncertainty bars have been included in the pulsed bias case
the eye. to account for the change in the current during the 2 µs acquis-
ition interval, ∆tacq .
Figure 5(a) shows the time-resolved applied voltage and
positive ion current. The voltage that is applied to the sample
3.1. Negative ion yield for continuous bias operation
is measured to be −20 V with little observed change during
the application of the bias. In figure 6(a) the negative ion yield for MCD is observed
The settling time of the electrical measurement setup is to increase up to 17.7 × 10⁻³ as the sample temperature is
determined to be ∼2 µs by replacing the electrode with a res- increased from 150 ◦ C to 550 ◦ C when using a −130 V con-
istor outside of the plasma chamber. This means that current tinuous sample bias. This is then followed by a decrease in
measured between the application of the bias in figure 5 at the yield from 17.7 × 10⁻³ to 9.8 × 10⁻³ as the temperature
0 µs and 2 µs is considered to be unreliable due to the rapid is increased from 550 ◦ C to 700 ◦ C.
change of the system at during this interval. Therefore, the In figure 6(b) when using a −20 V bias, the trend of increas-
period of time where the positive ion current can be reliably ing yield with increasing sample temperature is similar to
interpreted is between t = 2 µs and the end of the pulse at that observed in figure 6(a), it increases from 2 × 10⁻³ to
t = 6.7 µs, as shown in figure 5(a). During this interval, the 20 × 10−3 as the temperature increases from 150 ◦ C to 500 ◦ C,
current is observed to first peak at 25 µA and then decrease and then decreases to a yield of 15 × 10−3 from a sample tem-
steadily to 17 µA. It is observed that the current is higher dur- perature of 500 ◦ C to 700 ◦ C.
ing the application of the pulsed bias compared to the use of The negative ion yield from MCNDD samples is shown in
the continuous bias. This is consistent with observations that figures 6(c) and (d). When using a continuous sample bias,
the current decreases over a time to a similar value observed at sample temperatures below 400 ◦ C the yield from MCNDD
when using a continuous sample bias. It is therefore reason- cannot be measured due to the poor conductivity of the sample.
able to suggest that the relatively high current observed at the Once the MCNDD sample temperature reaches 400 ◦ C, neg-
beginning of the pulse, i.e. at 2 µs in figure 5(a), is consistent ative ions are measured and a peak in the negative ion yield
with rapid perturbation and stronger disturbance of the plasma of 20 × 10−3 at 550 ◦ C is observed in figure 6(c) when using
close to the sample holder when the applied voltage switches. a sample bias of −130 V. Similarly, a negative ion yield of
Figure 5(b) shows the time-resolved negative ion counts 22 × 10−3 at 600 ◦ C is observed in figure 6(d) when using a
detected during the bias pulse and the corresponding negative- sample bias of −20 V. The changes in the negative ion yield
ion yield, as determined with equation (4), for MCD at 550 ◦ C. when using a continuous sample bias for MCNDD and MCD
This temperature is chosen because in previous work a temper- at temperatures above 550 ◦ C are similar to results of previ-
ature of 550 ◦ C produced the largest quantity of negative ions, ous work [33]. The peak negative ion yield from MCNDD is
7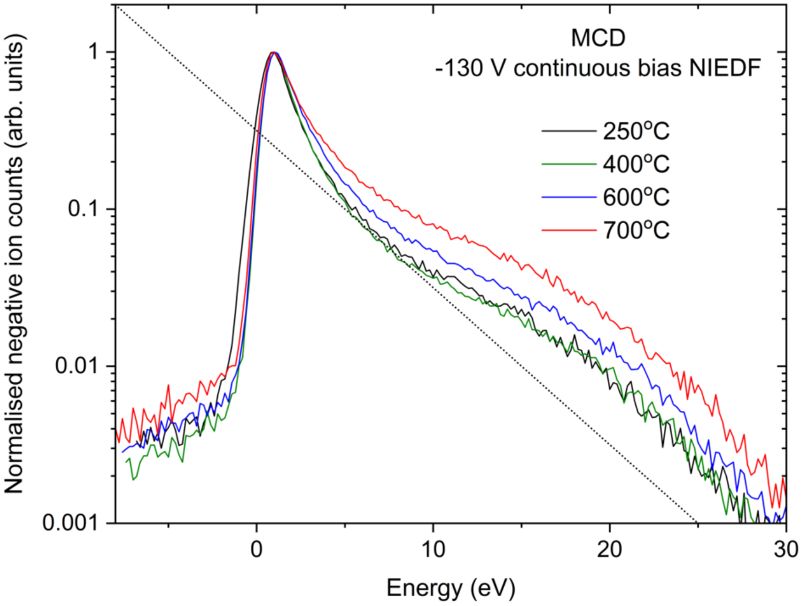
J. Phys. D: Appl. Phys. 54 (2021) 435201                                                                                     G J Smith et al

Figure 6. Negative ion yield with respect to temperature of the sample surface for continuous and pulsed biased operation. (a) MCD with a
bias of −130 V. (b) MCD with a bias of −20 V. (c) MCNDD with a bias of −130 V. (d) MCNDD with a bias of −20 V. Uncertainty bars of
10% and 20% have been included for the pulsed bias yield measurements at −130 V and −20 V respectively to account for the uncertainty
in the current measurements in each respective case. Low pressure deuterium plasma is operated at 2 Pa and 130 W. Solid lines are included
as visual guide.

about 10% higher than MCD for a −20 V bias, which is also                adsorption of deuterium and encourages out-gassing into the
consistent with previous work [33].                                      diamond lattice, thus reducing the amount of sputtering that
    Differences between the samples and biasing methods that             can occur [23, 25, 45]. Changes in the proportion of negat-
can be observed in figure 6 can be understood by analysing the           ive ions produced by the two production processes can be
corresponding NIEDFs, which are used to determine the neg-               observed by considering the NIEDFs produced by samples at
ative ion counts coming from the samples. The distribution of            different temperatures. Figure 7 shows the NIEDFs for MCD
negative ions in the NIEDFs have previously been shown to                at temperatures of 250 ◦ C, 400 ◦ C, 600 ◦ C and 700 ◦ C.
be useful for determining the negative ion production mechan-                In figure 7, the NIEDFs shown have been normalised to the
isms involved when using carbon samples [45]. There are two              peak negative ion counts. In previous work, it was observed
production processes that are considered to be responsible for           that the proportion of negative ions produced through sputter-
negative ion formation from carbon: backscattering and sput-             ing processes was higher at lower negative ion energies than
tering. Backscattering produces negative ions when an incom-             at higher energies [50]. This means that, due to the normalisa-
ing positive ion is reflected off the deuterated carbon lattice of       tion of the NIEDFs, a change in the tail height can be used
the samples and during the collision the positive ion captures           to infer the relative proportion of backscattering compared
two electrons [25]. As distinct from this, sputtering relies on          to sputtering, which in turn can be used to infer the amount
the ejection of adsorbed deuterium from the carbon lattice as            of sub-surface deuterium is in the samples [23, 32, 50]. It is
a negative ion [25].                                                     observed that the tail of the NIEDFs in figure 7 rises as the
    Of the two production processes, sputtering is temperat-             sample temperature is increased. When combined with obser-
ure dependent because it relies on the presence of adsorbed              vations in figures 6(a) and (c) that show a decrease in the neg-
deuterium on and within the sub-surface lattice of the dia-              ative ion yield at temperatures above 550 ◦ C for both MCD
mond samples. Increasing the sample temperature reduces the              and MCNDD, it demonstrates that a reduction in the adsorbed

                                                                     8
J. Phys. D: Appl. Phys. 54 (2021) 435201 G J Smith et al
the trends observed when heating the samples under a continu-
ous positive ion bombardment are the same as that observed
in previous work [23, 29, 33]. These trends are observed in
figures 6(a) and (b) when comparing the negative ion yield
between a sample bias of −130 V and −20 V, respectively.
A ‘high-energy’ positive ion bombardment will produce more
defects. At lower sample temperatures, when using a‘high-
energy’ positive ion bombardment, the defects are not etched
away and so a lower negative ion yield is observed due to a lar-
ger proportion of sp2 bonds. Increasing the temperature of the
sample will increase the negative ion yield as the defect bonds
are etched away more rapidly. This results in a lower negat-
ive ion yield from MCD at temperatures between 150 ◦ C and
550 ◦ C when using a ‘high-energy’ (VA = −130 V) positive
ion bombardment compared to a ‘low-energy’ (VA = −20 V)
positive ion bombardment across the same temperature range.
This also means that a higher peak negative ion yield for a
Figure 7. NIEDF measurements for MCD at sample temperatures
low energy positive ion bombardment can be expected, as the
of 250 ◦ C, 400 ◦ C, 600 ◦ C and 700 ◦ C using a bias of −130 V,
applied continuously. Dotted reference line added to guide the eye. number of defects is reduced when using a ‘low-energy’ posit-
Low pressure deuterium plasma is operated at 2 Pa and 130 W. ive ion bombardment. This is observed in figure 6(b) at 500 ◦ C
which is higher that the peak in the negative ion yield at 550 ◦ C
in figure 6(a).
deuterium within the sample decreases the negative ion yield In figures 6(c) and (d), the negative ion yield from MCNDD
from the samples. This observation is consistent with previous is observed to decrease with respect to sample temperature at a
work [23, 33, 50]. A similar comparison cannot be carried out similar rate to MCD at applied biases of −130 V and −20 V.
using the NIEDFs produced using a −20 V bias as the NIEDFs A similar comparison to MCD cannot be made at temperat-
in this case do not have a high energy tail. However, it is reas- ures below 550 ◦ C as addition of nitrogen doping lowers the
onable to suggest that a similar process occurs when using a conductivity of the diamond such that the negative ion yield
−20 V bias as the negative ion yield decreases in a similar cannot be measured at sample temperatures below 550 ◦ C.
manner when using a continuous sample bias past a sample
temperature of 500 ◦ C and 600 ◦ C for MCD and MCNDD
respectively.
3.2. Negative ion yield for pulsed bias operation
As shown in figures 6(a) and (b), when applying a con-
tinuous bias to MCD, the negative ion yield increases as the In figure 6(a), the negative ion yield from MCD when using
temperature of the sample is increased from 150 ◦ C to 550 ◦ C. a pulsed sample bias of −130 V increases as the sample tem-
This is consistent with previous work and has been attributed perature is increased from 150 ◦ C to 250 ◦ C by 1.4 × 10⁻³
to a coupled process of defect formation, where the diamond and then decreases as the sample temperature increases from
sp3 bonds are turned to sp2 bonds by the bombarding pos- 250 ◦ C to 700 ◦ C by 3.4 × 10⁻³ . This is unlike the trend
itive ions from the plasma, and then the preferential etching observed in figure 6(b), where the negative ion yield, when
away of these newly created sp2 bonds [23, 29, 52]. Surfaces using a pulsed bias of −20 V, increases as sample temperat-
that are composed mostly of sp2 bonds have previously been ure is increased from 150 ◦ C to 700 ◦ C by 1.7 × 10⁻³ .
associated with a reduction in the negative ion yield. There- The negative ion yield from MCNDD using a pulsed sample
fore the creation of these bonds has previously been expected bias is shown in figures 6(c) and (d) for −130 V and −20 V
to decrease negative ion yield if too many exist on a diamond sample bias voltages, respectively. Using a pulsed bias, neg-
surface [23]. By increasing the temperature of the samples, the ative ions are produced at temperatures lower than 450 ◦ C,
rate at which the sp2 bonds are etched away will be increased compared to when operating with a continuous sample bias.
resulting in a reduction in the number of defects on the surface In figure 6(c), the negative ion yield is shown to decrease by
at higher sample temperatures, and thus a higher negative ion 5.4 × 10⁻³ as the sample temperature is increased from 150 ◦ C
yield from samples that are heated [23, 29, 52]. This process to 700 ◦ C. In contrast to this, in figure 6(d) it is observed that
is observed to cause a peak in the negative ion yield at a tem- the negative ion yield increases by 3.4 × 10⁻³ as sample tem-
perature of approximately 550 ◦ C for MCD, before the higher peratures are increased from 150 ◦ C to 400 ◦ C when using a
temperature of the samples causes a reduction in the sputtering pulsed sample bias of −20 V.
contribution. In figures 6(a) and (b) when using a pulsed sample bias, it
Previous work has demonstrated using ex-situ Raman spec- is observed that there is a comparatively small change in the
troscopy that exposure of samples of diamond to positive ion negative ion yield as sample temperature is increased, which
bombardment is associated with an increase in the amount of is in contrast to the large change in negative ion yield observed
defects on the sample surface [23, 29]. A similar process of when using a continuous sample bias between sample temper-
defect formation can reasonably be expected in this work as atures of 150 ◦ C to 500 ◦ C. As described in section 3.1, the
9J. Phys. D: Appl. Phys. 54 (2021) 435201 G J Smith et al
negative ion yield from diamond is influenced by the num-
ber of sp2 defects formed by bombarding positive ions. As the
sample temperature is increased, sp2 defects are etched at an
increased rate. This means that the negative ion yield from a
sample is expected to increase as the sample temperature is
increased, as is observed when using a continuous bias. When
using a pulsed −130 V sample bias, as shown in figure 6(a),
the negative ion yield peaks at a lower sample temperature
compared to when using a continuous sample bias, at 250 ◦ C,
and then decreases as the sample temperature is increased.
When using a pulsed sample bias case, if little to no defects
are formed on the sample surface, the influence of temperat-
ure on the negative ion yield due to preferential etching will
be reduced and only a decrease in the sputtering contribution
will be observed. As there is a comparatively small change in
the negative ion yield observed when using a pulsed sample
bias compared to a continuous sample bias at −130 V, it can
Figure 8. NIEDF measurements for MCD at sample temperatures
be confirmed that the sample surface is being preserved when
of 250 ◦ C, 400 ◦ C, 600 ◦ C and 700 ◦ C using a pulsed bias of
using this technique, and that the pulsed sample bias measure- −130 V. Dotted reference line added to guide the eye. Low pressure
ments are representative of an almost ‘pristine’ sample surface deuterium plasma is operated at 2 Pa and 130 W.
[30].
By using a pulsed sample bias, it is possible to compare the
negative ion yield from the pristine surface states of MCNDD applied that would otherwise be depleted when utilising a con-
and MCD at temperatures between 150 ◦ C and 700 ◦ C, as well tinuous sample bias [30]. It can also be observed that the
as generate and measure negative ions in spite of the low increase in the tail height between a sample temperature of
conductivity of MCNDD at temperatures below 400 ◦ C. The 600 ◦ C and 700 ◦ C, is much larger in figure 7 than in figure 8.
negative ion yield from MCNDD is observed to be, on aver- This agrees with the larger decrease in the negative ion yield
age, higher than MCD by 28% at −130 V and 14% at −20 observed in figure 6(a) between 600 ◦ C and 700 ◦ C when using
V across the compared temperatures. This supports previous a continuous sample bias compared to when using a pulsed
work that observed that negative ion yield from diamond is sample bias.
enhanced when nitrogen doping is added to diamond samples For the same reason as the continuous sample biasing case,
and suggests that the surface state of MCNDD is conducive to it is not possible to compare the NIEDFs for −20 V pulsed
enhanced negative ion yield. sample biasing to determine the sputtering contribution due to
A series of NIEDFs when using a pulsed sample bias of the lack of a high energy tail in the NIEDF. This means that
−130 V and a MCD sample are shown in figure 8 for sample the sputtering contribution from these samples is inferred by
temperatures of 250 ◦ C, 400 ◦ C, 600 ◦ C and 700 ◦ C. It can be considering the NIEDFs using a −130 V bias and the trends
observed in figure 8 that there is a smaller change in the tail observed in figure 6. As sample temperatures are increased,
height when compared to figure 7, suggesting a smaller change a decrease in the sputtering contribution can be expected as
in the sputtering contribution to the negative ion yield as the the adsorbed deuterium is out-gassed from the samples [23].
sample temperature is increased over the same range of tem- This is observed to be the case for MCD and MCNDD in
peratures. figures 6(a) and (c) when using a −130 V pulsed sample
The negative ion yield in figure 6(a) when applying a pulsed bias. It is observed that the negative ion yield from MCD
bias is observed to decrease as the temperature of the MCD decreases as the sample temperature is increased from 150 ◦ C
sample is increased from 200 ◦ C to 700 ◦ C. This observation to 700 ◦ C by 28% and by 41% for MCNDD over a similar
is consistent with the observed changes in the tail height in temperature scale. This is in contrast to the observations in
figure 8. There is an increase in the tail height as the sample figures 6(b) and (d) for MCD and MCNDD when using a
temperature is increased suggesting a similar decrease in the −20 V pulsed sample bias. It is observed that the negative ion
sputtering contribution that reduces the negative ion yield from yield increases by 13% over a similar temperature range for
the sample as sample temperature is increased. MCD and by 24% for MCNDD. Previous work has suggested
Using the dotted reference lines in figures 7 and 8 as a that the deuterium content of the samples is similar at sim-
guide, we qualitatively compare the tail heights for pulsed and ilar sample temperatures [23, 33]. Therefore the increase in
continuous sample biasing. By comparing the tail heights in the negative ion yield as the sample temperature is increased
these figures, it is observed that the amount of sputtering from suggests that when utilising both a ‘low’ positive ion energy
a pulsed sample bias appears to be larger than that observed and a pulsed sample bias, the contribution of sputtering to the
when using a continuous sample bias. This is consistent with overall negative ion yield is reduced or even absent.
previous work which suggested that a non-continuous flux of To explain the mechanism for a reduced sputtering contri-
positive ions allows for the re-adsorbtion of deuterium lost bution with a ‘low-energy’ pulsed positive ion bombardment,
through the sputtering process when the sample bias is being it is worth considering previous work and differences in the
10J. Phys. D: Appl. Phys. 54 (2021) 435201 G J Smith et al
negative ion yield at sample temperatures above 500 ◦ C when
using a continuous sample bias. Previous studies have determ-
ined that the threshold energy for the sputtering of hydrogen
from carbon occurs at approximately 15 eV [29]. As previ-
ously described in section 2.3, the sheath of the plasma in front
of the samples can reasonably be expected to be collision-less.
Therefore, the dominant positive ion, D+ 3 , upon impact with
the sample surface will have an energy of 8 eV when using
a −20 V bias [29]. This is below the calculated threshold for
sputtering, suggesting that only a small amount of sputtering
can occur when using a −20 V bias, where the lighter positive
ions (D+ +
2 and D ) are able to exceed the threshold energy. An
issue with this interpretation is that in figure 6(b), when util-
ising a continuous sample bias of −20 V, the negative ion yield
is observed to decrease as the sample temperature is increased
from 500 ◦ C to 700 ◦ C which is consistent with a reduction
in the sputtering contribution from the samples, despite the
Figure 9. NIEDF measurements for MCD using pulsed or
positive ion energy being below the threshold for sputtering continuous bias of −130 V at 600 ◦ C. Low pressure deuterium
to occur. The difference between these two cases is the type plasma is operated at 2 Pa and 130 W.
of sample biasing being used. Therefore, this observation sug-
gests that the use of a −20 V pulsed sample bias reduces the
contribution of sputtering to the negative ion yield and is pos- ion current within the pulse was not available in order to cal-
sibly linked to defect formation caused by a continuous posit- culate the negative ion yield and confirm that it is higher with
ive ion bombardment. a pristine surface [30].
It is interesting to note that the negative ion yield observed The observation of a lower negative ion yield when using
when using a −20 V pulsed sample bias for MCD and a pulsed sample bias compared to a continuous one means
MCNDD (figures 6(b) and (d), respectively) is similar at sim- it is reasonable to suggest that there is a change in the sur-
ilar sample temperatures, compared to MCD and MCNDD face state of the samples that occurs as a result of the posit-
when using a −130 V pulsed sample bias (figures 6(a) and ive ion bombardment. This is because, as the pulse bias duty
(c), respectively). This suggests that the when using a pulsed cycle is increased, the time the bias is applied to the sample
sample bias, the surface state of the samples is similar des- will increase and will eventually be equivalent to a continu-
pite the differences in the applied voltages. This further ous sample bias, meaning the yield must increase as the pulse
supports the argument that the pulsed bias preserves the sur- duration is increased. There are two proposed mechanisms
face state of the samples. that could change the surface state of the sample and there-
fore increase the negative ion yield. One is a change in the
adsorbed deuterium which is responsible for sputtering from
3.3. Comparing the negative ion yield between pulsed and
the samples, and the other is an increase in the number of sp2
continuous bias operation
bonds created on the sample surface that has been reduced by
In figures 6(a) and (b), when using a −130 V and −20 V using a pulsed sample bias.
continuous sample bias respectively with MCD, the negat- As described previously, the deuterium content of the
ive ion yield is observed to be almost 1.6 times higher than samples is observed to be higher when using a pulsed sample
that observed from a similar sample when applying a −130 V bias. This can be observed in figure 9, which shows the
pulsed sample bias at a sample temperature of 550 ◦ C. Simil- NIEDFs for a continuous bias and a pulsed bias at 600 ◦ C.
arly for MCNDD, in figures 6(c) and (d), the negative ion yield The tail height of the pulsed bias in figure 9 is lower than
is observed to be 1.4 times higher when using a continuous bias the continuous bias, which means that the negative ion yield
compared to when applying a pulsed sample bias at a sample contribution via the sputtering process is higher when using a
temperature of 550 ◦ C. In addition to this, the differences pulsed bias. If the deuterium content of the sample is reduced
between the pulsed and continuous sample biases appears to when using a continuous bias, the negative ion yield can reas-
be consistent between all of the samples. This suggests that a onably be expected to be reduced [23]. However, if we con-
similar mechanism for negative ion formation exists between sider the results in figure 6, we instead observe a increase in the
each of the samples. negative ion yield when using a continuous sample bias com-
Previous work observed that a pulsed bias produced a pared to a pulsed sample bias. This therefore suggests that the
higher number of negative ion counts (ND− ) from diamond sputtering contribution changing between a pulsed and con-
samples and attributed this to a preserved surface state [30]. tinuous sample biasing is unlikely to be responsible for higher
This was based on the assumption that a pristine surface state negative ion yield observed when using a continuous bias.
composed primarily of sp3 is an ideal surface state for negat- The other suggested mechanism is that the negative ion
ive ion production from diamond, as discussed in section 3.1. yield is higher when using a continuous sample bias due to
However, in this previous work a measurement of the positive the bombardment of the sample surfaces creating sp2 defect
11J. Phys. D: Appl. Phys. 54 (2021) 435201 G J Smith et al
bonds. This appears to be contrary to the conclusions of pre- 2019–2020 under Grant Agreement No. 633053. The views
vious work. In previous work it has been shown that a sur- and opinions expressed herein do not necessarily reflect those
face composed entirely of sp2 bonds is detrimental to negat- of the European Commission. Financial support was received
ive ion yield [23], meaning techniques to preserve the surface from the French Research Agency (ANR) under Grant 13-
of diamond and minimise the number of sp2 bonds has been BS09-0017 H INDEX TRIPLED. The financial support of
of interest [30]. However, in this study the process of defect the EPSRC Centre for Doctoral Training in fusion energy is
formation appears to be the only difference between the pulsed gratefully acknowledged under financial code EP/L01663X/1.
and continuous biasing technique that could be responsible CGI (Commissariat á l’Investissement d’Avenir) is grate-
for changes in the negative ion yield. This suggests that some fully acknowledged for its financial support through Labex
degree of defect formation is important for increasing the neg- SEAM (Science and Engineering for Advanced Materials and
ative ion yield from diamond. The authors believe that these devices) (Nos. ANR 11 LABX 086, IDEX 05 02).
observations suggest that an optimum surface state for neg-
ative ion yield possibly exists on diamond that is dependent
on the pulsed bias frequency, doping, positive ion energy and ORCID iDs
temperature of the samples. This surface state will have an
Gregory J Smith https://orcid.org/0000-0001-8987-4983
optimum ratio of sp2 and sp3 defects as a result of the interplay
Jocelyn Achard https://orcid.org/0000-0001-7000-7230
of the positive ion energy and flux to the samples. Further work
Timo Gans https://orcid.org/0000-0003-1362-8000
to determine the optimum conditions is on going and in-situ
James P Dedrick https://orcid.org/0000-0003-4353-104X
time-resolved measurements of the sample surface state trans-
Gilles Cartry https://orcid.org/0000-0002-6081-0350
itioning away from a ‘pristine’ surface during plasma exposure
remains the subject of future work.
References
4. Conclusion [1] Ueno A, Oguri H, Ikegami K, Namekawa Y and Ohkoshi K
2010 Interesting experimental results in Japan proton
In this study the surface production of negative ions from accelerator research complex H- ion-source development
pulse-biased non-doped diamond (MCD) and nitrogen doped (invited) Rev. Sci. Instrum. 81 02A720
[2] Peters J 2000 Negative ion sources for high energy
diamond (MCNDD) within a low-pressure deuterium plasma
accelerators (invited) Rev. Sci. Instrum. 71 1069–74
is investigated. The pulsed negative bias is applied in a square [3] Moehs D P, Peters J and Sherman J 2005 Negative hydrogen
waveform pulse at 5 kHz, with a duty cycle of 3% to preserve ion sources for accelerators IEEE Trans. Plasma Sci.
the surface of the samples and allow for measurement of negat- 33 1786–98
ive ion yield in the absence of sample conductivity. The negat- [4] Lettry J et al 2014 Status and operation of the Linac4 ion
source prototypes Rev. Sci. Instrum. 85 02B122
ive ion yield from MCNDD films when using a pulsed biased,
[5] Faircloth D and Lawrie S 2018 An overview of negative
determined via mass spectrometry and measurements of the hydrogen ion sources for accelerators New J. Phys.
positive-ion current to the sample, is observed to be higher than 20 025007
non-doped films at temperatures between 150 ◦ C and 700 ◦ C, [6] Welton R F et al 2016 The status of the SNS external antenna
confirming that nitrogen doping of diamond can be used to ion source and spare RFQ test facility Rev. Sci. Instrum.
87 02B146
enhance negative ion yield when the surface state of the dia-
[7] Antolak A J et al 2016 Negative ion-driven associated particle
mond is preserved. The pulsed bias has also been shown to neutron generator Nucl. Instrum. Methods Phys. Res. A
have a lower peak negative ion yield compared to a continu- 806 30–5
ous bias, which suggests that there exists an optimum sp2 to [8] Alton G D 1994 High-intensity, heavy negative ion sources
sp3 ratio for diamond sample surfaces to maximise negative based on the sputter principle (invited) Rev. Sci. Instrum.
65 1141–7
ion yield.
[9] Middleton R 1974 A survey of negative ion sources for tandem
accelerators Nucl. Instrum. Methods 122 35–43
[10] Calcagnile L, Quarta G and D’Elia M 2005 High-resolution
Data availability statement accelerator-based mass spectrometry: precision, accuracy
and background Appl. Radiat. Isot. 62 623–9
The data that support the findings of this study are available [11] Yoneda M et al 2004 AMS14C measurement and preparative
upon reasonable request from the authors. techniques at NIES-TERRA Nucl. Instrum. Methods Phys.
Res. B 223-224 116–23 (SPEC. ISS.)
[12] Rafalskyi D and Aanesland A 2016 Brief review on plasma
propulsion with neutralizer-free systems Plasma Sources
Acknowldgements Sci. Technol. 25 043001
[13] Lafleur T, Rafalskyi D and Aanesland A 2015 Alternate
The authors would like to acknowledge the experimental sup- extraction and acceleration of positive and negative ions
port of Jean Bernard Faure and the rest of the PIIM group. This from a gridded plasma source Plasma Sources Sci. Technol.
work has been carried out within the framework of the French 24 015005
[14] Aanesland A, Rafalskyi D, Bredin J, Grondein P, Oudini N,
Federation for Magnetic Fusion Studies (FR-FCM) and of Chabert P, Levko D, Garrigues L and Hagelaar G 2015 The
the EUROfusion consortium, and has received funding from PEGASES gridded ion–ion thruster performance and
the Euratom research and training programme 2014–2018 and predictions IEEE Trans. Plasma Sci. 43 321–6
12You can also read


