Climate in the Pilbara - Bulletin 4873 Supporting your success - Agric.wa.gov.au
←
→
Page content transcription
If your browser does not render page correctly, please read the page content below
Climate in the Pilbara

Bulletin 4873

Supporting your success
Climate in the Pilbara

Bulletin 4873

Robert Sudmeyer
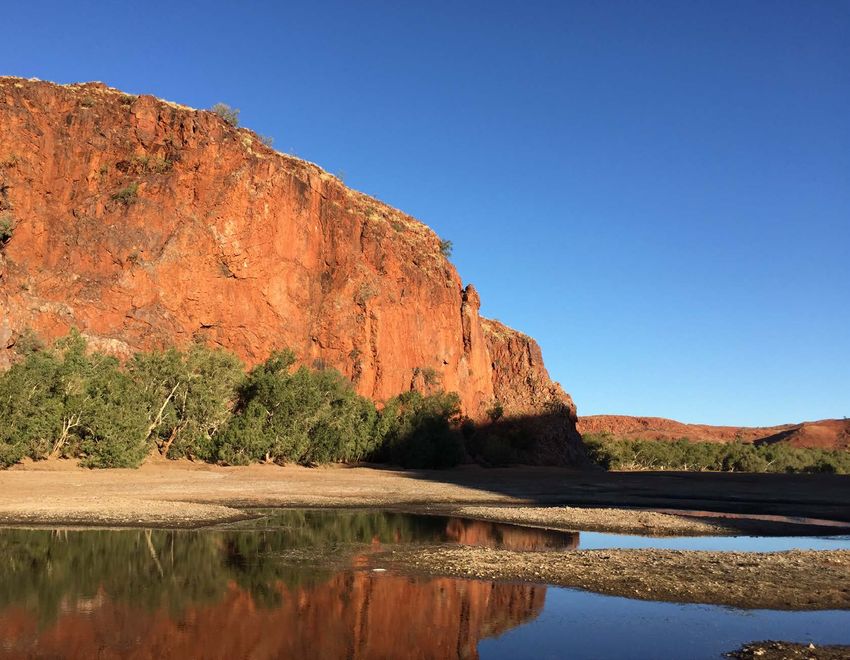
Copyright © Western Australian Agriculture Authority, 2016
November 2016
ISSN 1833-7236
Cover: Doolena Gorge, Marble Bar, Western Australia (photo: V White)
Recommended reference
Sudmeyer, R 2016, ‘Climate in the Pilbara’, Bulletin 4873, Department of Agriculture
and Food, Western Australia, Perth.
Disclaimer
The Chief Executive Officer of the Department of Agriculture and Food and the State
of Western Australia accept no liability whatsoever by reason of negligence or
otherwise arising from the use or release of this information or any part of it.
Copies of this document are available in alternative formats upon request.
3 Baron-Hay Court, South Perth WA 6151
Telephone: +61 (0)8 9368 3333
Email: enquiries@agric.wa.gov.au
Website: agric.wa.gov.au
Climate in the Pilbara

Contents
Acknowledgements .............................................................................................. iv
Summary ................................................................................................................ v
1       Introduction ................................................................................................... 1
2       Climate characteristics ................................................................................. 3
        2.1 Temperature ........................................................................................... 4
        2.2 Rainfall ................................................................................................... 7
        2.3 Evaporation .......................................................................................... 10
        2.4 Solar radiation ...................................................................................... 13
3       Climate drivers ............................................................................................ 15
4       Historical climate trends ............................................................................ 21
        4.1 Rainfall ................................................................................................. 21
        4.2 Temperature ......................................................................................... 21
        4.3 Evaporation .......................................................................................... 22
        4.4 Tropical cyclones .................................................................................. 23
5       Projected effects of global warming on future climate ............................ 24
        5.1 Temperature ......................................................................................... 24
        5.2 Rainfall ................................................................................................. 26
        5.3 Tropical cyclones .................................................................................. 29
        5.4 Wind speed .......................................................................................... 29
        5.5 Evaporation .......................................................................................... 30
        5.6 Fire risk ................................................................................................. 30
Appendices .......................................................................................................... 31
Appendix A Tropical cyclone intensity ratings................................................. 32
Appendix B Simulating future climate ............................................................... 33
Appendix C Confidence levels in projected climate changes ......................... 35
Appendix D Historical and projected values of rainfall and temperature in the
Pilbara .................................................................................................................. 36
Appendix E Online climate information and data sources .............................. 41
Shortened forms.................................................................................................. 42
References ........................................................................................................... 43

                                                                                                                                iii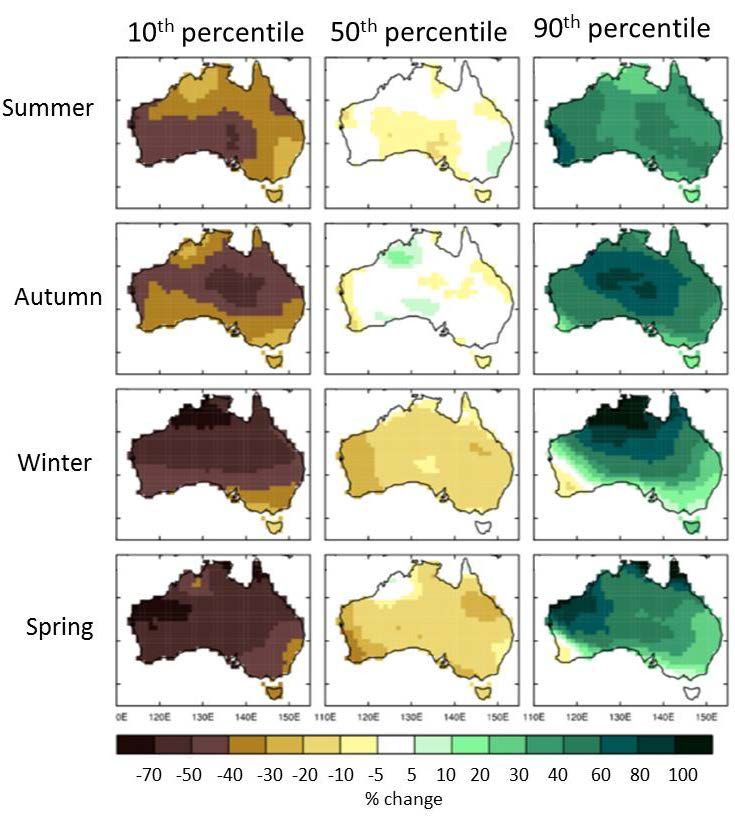
Climate in the Pilbara

Acknowledgements
The Department of Agriculture and Food, Western Australia (DAFWA) is planning for
the future of irrigated agriculture development in the Pilbara through the Pilbara
Hinterland Agricultural Development Initiative (PHADI), made possible by Royalties
for Regions investment. PHADI is delivered by DAFWA in partnership with the
Pilbara Development Commission and the Department of Regional Development,
and works closely with the mining industry, Aboriginal groups and the pastoral
industry.
Thanks to Ian Foster (DAFWA) and Stephen Charles (CSIRO) for providing
comments and suggestions to improve this bulletin, Peter Gardiner (DAFWA) for
creating some of the figures and Angela Rogerson (DAFWA) for editing the bulletin.

iv
Climate in the Pilbara

Summary
The Pilbara is characterised by very hot summers, mild winters and low and variable
rainfall. It is classified as hot desert in northern and inland areas and hot grasslands
in the north-west. The Pilbara claims a number of climate records:
• seven of Western Australia’s top 10 hottest days, with Mardie recording the hottest
  day on record — 50.5 degrees Celsius (°C)
• most sunshine hours a day in Australia (more than 10 hours a day)
• second highest inter-annual variability in rainfall (second only to central Australia)
• the most cyclone-prone area along the Australian coastline.
During summer and early autumn (December to March), average daily temperatures
exceed 30°C across the region, with average daily maxima exceeding 35°C from
October to March. In northern inland areas, such as Marble Bar, average maxima
exceed 40°C during summer and temperatures exceeding 45°C are common. During
the winter months (June to August), average temperatures are around 20°C across
the region. Coastal areas have a smaller annual temperature range compared to
inland areas and winter temperatures rarely drop below 10°C. Except for the upland
areas of the Hamersley Ranges and south-eastern inland areas, there is minimal risk
of frost.
Rainfall is spatially and temporally variable. There is a general trend for annual
rainfall to decline from 300–350 millimetres (mm) in the north-east to less than 250
mm in the south and west. However, elevated areas in the Hamersley Ranges
average more than 500mm. Rainfall is greatest during summer and autumn and least
during winter and spring. Rainfall in the eastern Pilbara is most influenced by tropical
and monsoonal drivers, which are predominantly active in summer and autumn, while
rainfall in the western Pilbara is also influenced by southern mid-latitude drivers, such
as frontal systems, during autumn and winter.
Tropical cyclones (TCs) cause the most extreme rainfall events and generate 25–
34% of the total annual rainfall near the Pilbara coast and as much as 21% up to
450km inland. While TCs make a critical contribution to rainfall in the north-west, their
inter-annual contribution to summer rainfall ranges from 0 to 86%. Historically, TCs
have caused considerable damage and loss of life in the Pilbara, but modern design
regulations ensure that buildings and other infrastructure are now far less susceptible
to damaging winds. However, even the threat of a TC can cause substantial
economic losses to the mining and offshore oil and gas industries through lost
production or disruptions to shipping activities.

Hot, dry and sunny conditions mean the Pilbara is subject to very high evaporative
demand. Point potential evaporation represents the evapotranspiration that would
occur from small, well-irrigated fields surrounded by non-irrigated land and exceeds
3000 millimetres per year (mm/y) over much of the Pilbara. The higher areas of the
Hamersley Ranges are cooler and subject to greater summer cloud cover and so
have the lowest evaporative demand. Potential evaporation is greatest during the

                                                                                           v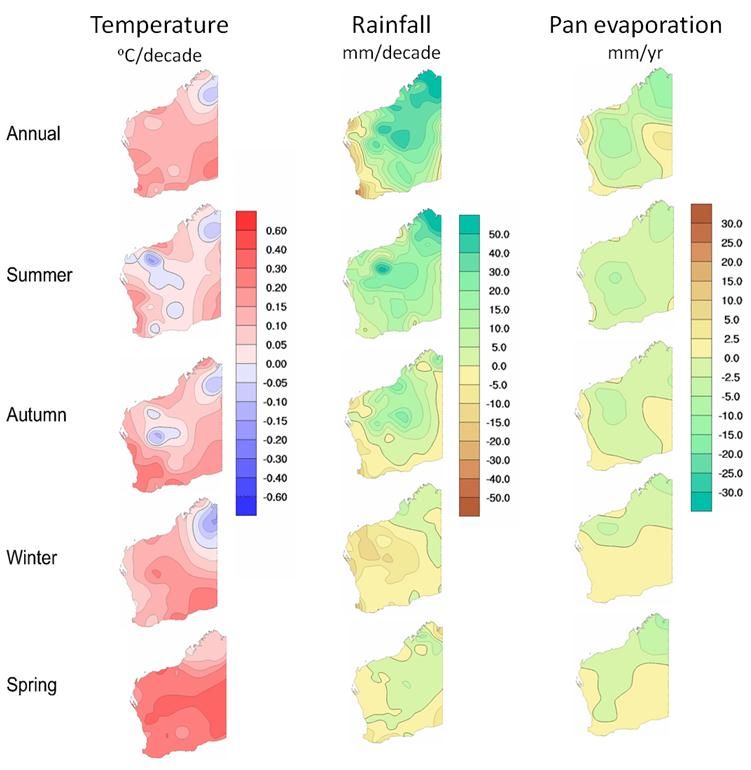
Climate in the Pilbara

summer months — averaging 10–14 millimetres per day (mm/d) — and least during
winter, averaging 4–7mm/d.
Over the last 40–60 years, average annual temperatures have increased across most
of Western Australia (WA). In the Pilbara, temperatures increased most during winter
and spring and cooled during autumn and summer. Warming during the largely
cloudless winter and spring is in line with global trends, and summer cooling is likely
caused by increasing summer rainfall and associated cloud cover over north-western
Australia. Annual rainfall increased over most of the Pilbara, except in the west where
it decreased. Rainfall intensity and number of rain days have also increased in the
central and eastern parts and decreased in the west. A decline in autumn and winter
rainfall over the western Pilbara has coincided with major shifts in the large-scale
atmospheric circulation of the southern hemisphere. These changes include a
southward shift in the subtropical ridge and the southern hemisphere westerly jet
stream.
Future climate
Climate projections show very high confidence (see Appendix D) for substantial
temperature increases to continue in the Pilbara, with the north-west of WA warming
more than elsewhere in Australia. Annual average temperature is projected to
increase by 0.6–1.5°C by 2030 for all emission scenarios and by 1.5–3.1°C and 3.1–
5.6°C by 2090 for medium (RCP4.5) and high (RCP8.5) emission trajectories,
respectively (Appendix C explains the emission trajectories).
Annual rainfall is projected to remain largely unchanged to 2090 and there is high
confidence that natural rainfall variability will remain the primary driver of rainfall
changes to 2030. There is medium confidence that TCs will become less frequent in
future but will increase in intensity.
There is high confidence that potential evaporation will increase but only medium
confidence in the magnitude of the change.

vi
Climate in the Pilbara
1 Introduction
This bulletin is one of the Pilbara Hinterland Agricultural Initiative (PHADI) report
series and provides a general description of the climate in the Pilbara region in
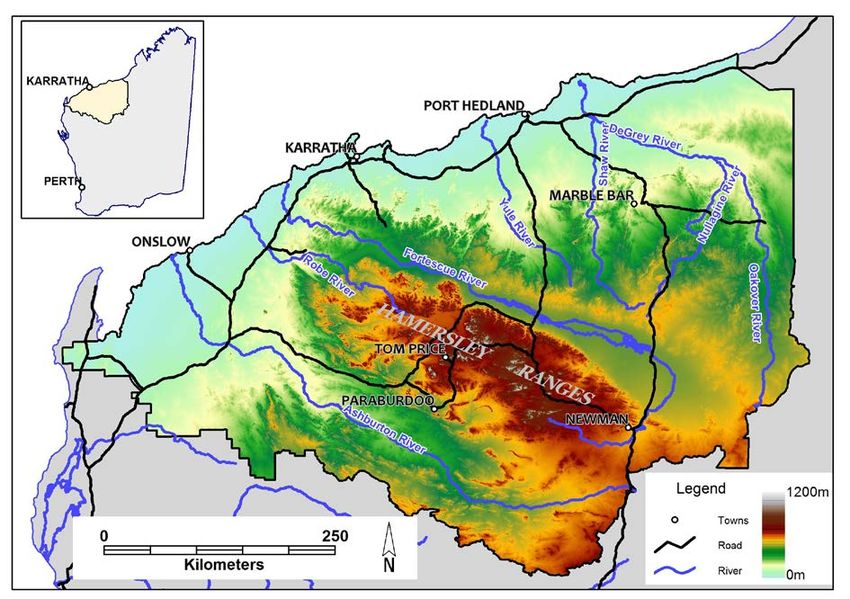
Western Australia and the main climate drivers. Figure 1.1 shows the PHADI study
area.
Map of the PHADI study area, showing location of major roads, principal rivers and
major towns
Figure 1.1 The PHADI study area, showing principle roads, rivers and towns and
height above sea-level. Inset map shows the PHADI study area within Western
Australia
Long-term daily temperature and rainfall records are available from the Bureau of
Meteorology (BoM) sites, Marble Bar Comparison (4020), Port Hedland Airport
(4032), Coolawanyah (5001), Mardie (5008) and Mt Vernon (7059) (Figure 1.2). The
Indian Ocean Climate Initiative (IOCI) used data from these sites to develop
projections of future climate (2047–64 and 2082–99) under various emission
scenarios (Barton et al. 2011). These sites broadly represent the Pilbara and
historical and projected daily temperature and rainfall data were downloaded from the
SILO database and CSIRO Data Access Portal, respectively. Historical data for the
period 1970–2014 for these sites are summarised in this bulletin. Hourly temperature
data for a shorter time period is available from BoM sites, Marble Bar Comparison,
Port Hedland Airport, Mardie, Onslow Airport (5017), Newman Aero (7176) and
Paraburdoo Aero (7185) (Figure 1.2). Hourly data for the period 2000–14 were used
to estimate Winter Chill values in this bulletin.
1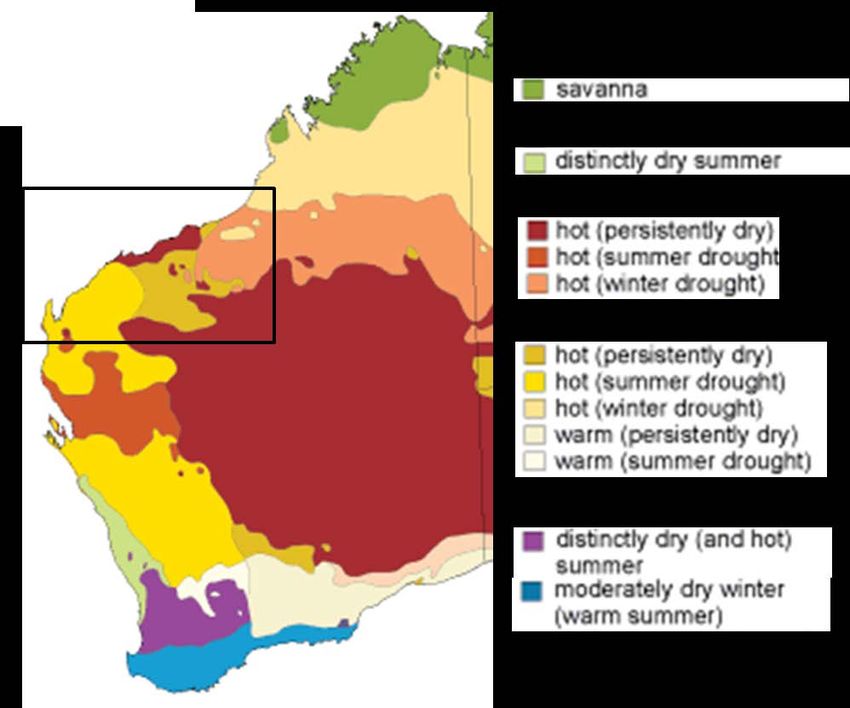
Climate in the Pilbara

Figure 1.2 Location of BoM meteorological stations in the PHADI study area and their
height above sea level (m)

2
Climate in the Pilbara
2 Climate characteristics
The Pilbara is characterised by very hot summers, mild winters and low and variable
rainfall (Barton et al. 2011, Regional Development Australia Pilbara 2013). Under the
Köppen system, the region is classified as hot desert in northern and inland areas
and hot grasslands in the north-west (Figure 2.1).
Figure 2.1 The climate classes in Australia, according to the Köppen classification
system (BoM 2005). The box outlines the PHADI study area
From late spring to early autumn (November–April), the Pilbara is hot with daily
maximum temperatures averaging 36–37 degrees Celsius (°C) (Barton et al. 2011,
Regional Development Australia Pilbara 2013). This is also the time when most
areas receive summer (wet season) rains associated with the Australian monsoon
and occasional tropical cyclones (TCs). While the timing and amount of rainfall varies,
the Pilbara is within the most cyclone-prone region of Australia, with 36 TCs crossing
the Pilbara coast between 1980 and 2007.
From late autumn to mid-spring (May–October), temperatures are cooler with daily
maximum temperatures averaging 28–29°C. During these months, the subtropical
ridge moves north bringing dry easterly and south-easterly winds. Little rain falls
during this period and what does is erratic and largely confined to the south-west of
the region.
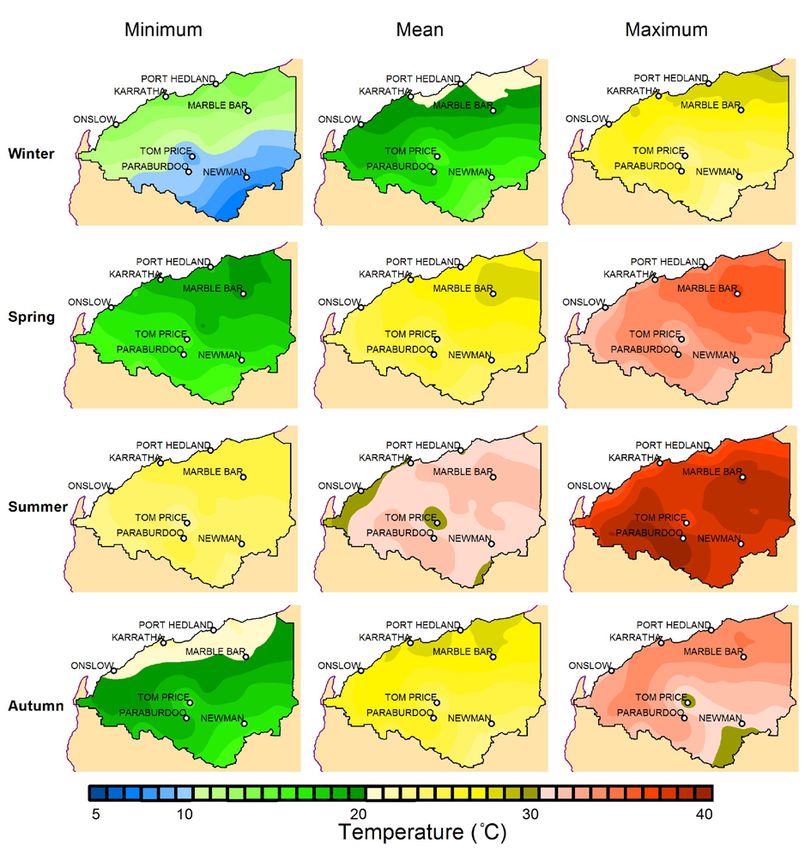
3Climate in the Pilbara 2.1 Temperature There is a general trend for temperature to increase from south to north but the moderating effect of the ocean results in temperature isotherms that are generally oriented west-south-west to north-north-east (Figure 2.2). Inland, temperatures tend to be cooler in elevated parts of the Hamersley Ranges and hottest in the basins of the Fortescue, Yule and De Grey rivers in the north and the Ashburton River in the south-west. Figure 2.2 Seasonal averages of daily maximum, minimum and mean temperature in PHADI area between 1970 and 2014 During summer, average temperatures exceed 30°C across the region, with average maxima exceeding 35°C from October to March (Figure 2.3). In northern inland areas, such as Marble Bar, average maxima exceed 40°C during summer (Figure 2.3c) and 4
Climate in the Pilbara

Figure 2.3 Monthly averages of daily maximum and minimum temperature at (a) Port
Hedland, (b) Mardi, (c) Marble Bar, (d) Coolawanyah and (e) Mt Vernon 1970–2014
(source SILO Patched Point Dataset 2014)

                                                                                5
Climate in the Pilbara temperatures exceeding 45°C are common. Marble Bar set a world record in 1923– 24 when it experienced 160 consecutive days with maxima above 37.8°C (Charles et al. 2015). Seven of the top 10 hottest days recorded in WA were in the Pilbara and the hottest day on record, 50.5°C, was at Mardie (BoM 2015). During winter, average temperatures are around 20°C across the region and minimum temperatures are significantly lower than at other times of the year, particularly in elevated and southern inland areas (Figure 2.2 and Figure 2.3). Coastal areas have a smaller annual temperature range compared to inland areas (Figure 2.3) and winter temperatures rarely drop below 10°C. Frost is only a risk in the upland areas of the Hamersley Ranges and the far south-east of the region (Figure 2.4). Figure 2.4 Average number of frost days (minimum temperature less than 2°C) per year in WA, 1976–2005 (BoM viewed November 2014 bom.gov.au/jsp/ncc/climate_averages/frost/index.jsp?period=an&thold=lt2deg) The estimated time temperatures are low enough to meet the winter dormancy requirements of horticultural crops (Winter Chill) ranges from zero along the Pilbara coast and low-lying inland sites, to 8 chill portions/267 chill hours at an upland site such as Newman (Table 2.1). 6
Climate in the Pilbara
Table 2.1 Winter Chill at selected Pilbara sites estimated using the Dynamic Model*
(CP = chill portions, Fishman et al. 1987) and the Chill Hours Model† (CH =
cumulative chill hours, Weinberger 1950). id = insufficient data
Marble Bar Newman Paraburdoo Port Mardie Onslow
Aero Aero Hedland Airport
Year CP CH CP CH CP CH CP CH CP CH CP CH
2004 id id 11 396 0 25 0 0 id id 0 0
2005 id id 12 261 1 36 0 0 id id 0 0
2006 id id 10 416 3 117 0 7 id id 0 0
2007 0 0 5 320 0 9 0 0 id id 0 0
2008 0 0 3 231 0 18 0 5 id id 0 0
2009 0 0 6 204 0 24 0 0 0 2 0 0
2010 0 0 4 149 1 13 0 0 0 0 0 0
2011 0 2 id id 1 2 0 2 0 0 0 0
2012 0 13 10 326 0 43 0 9 0 6 0 0
2013 0 0 5 107 2 1 0 0 0 0 0 0
2014 0 4 10 255 0 20 0 0 0 1 0 0
Mean 0 3 8 267 1 28 0 2 0 2 0 0
*
Cumulative chill portions (per year) estimated using the University of California
spreadsheet, available at ucanr.edu/sites/fruittree/How-
to_Guides/Dynamic_Model_-_Chill_Accumulation/
†
Cumulative hours (per year) when air temperature is between 0 and 7.2°C
2.2 Rainfall
Annual rainfall generally averages less than 350 millimetres (mm), with high intra-
annual and inter-annual variability (Figure 2.5 and Figure 2.6). There is a general
trend for annual rainfall to decline from 300–350mm in the north-east to less than
250mm in the south and west (Figure 2.5). Elevated areas in the Hamersley Ranges
are wetter and average more than 500mm.
Rainfall is greatest during summer and autumn (December–May) and results from
tropical lows and occasional TCs. Rainfall is least between August and November.
Rainfall in the eastern Pilbara is mostly influenced by tropical and monsoonal drivers,
which are predominantly active in summer and autumn, while the western Pilbara is
also influenced by southern mid-latitude drivers, such as frontal systems, during
autumn and winter (Charles et al. 2015) (Figure 2.6b). The area receiving most
summer rain stretches from the north-east of the Pilbara to the Hamersley Ranges
(Figure 2.5). This rainfall is related to thunderstorm development (Figure 2.7)
following advection of moist air from the coast and high temperatures and topography
causing uplift (Charles et al. 2015).
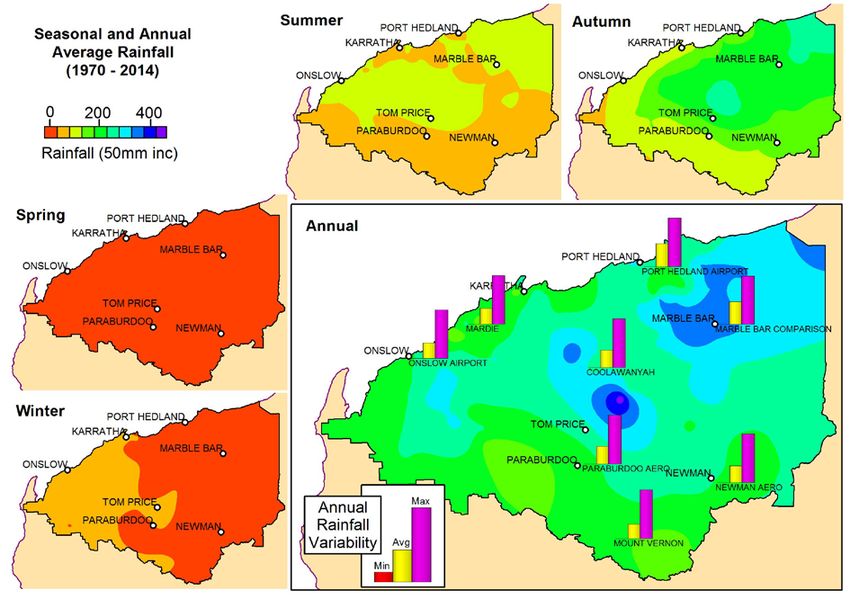
7Climate in the Pilbara Figure 2.5 Average seasonal and annual rainfall for PHADI area between 1970 and 2014. Bars show maximum, minimum and mean annual rainfall at principle towns sites The Pilbara has the second highest inter-annual variability in rainfall in Australia, second only to central Australia (Charles et al. 2015). This variability is seen at all of the sites in shown in Figure 2.6 where average rainfall significantly exceeds the median for most months, reflecting the heavy rainfall received in some years (90th percentile). 1924 was the Pilbara’s driest year on record, receiving only 17% of the long-term (1911–2011) average annual rainfall. The wettest year was 2000 when annual rainfall was 140% above the average, or 14.5 times the 1924 minimum (Charles et al. 2015). TCs are responsible for most of the extreme rainfall events and generate 25–34% of the total annual rainfall near the Pilbara coast and as much as 21% up to 450km inland (Charles et al. 2015). The rainfall contribution from other events, such as tropical depressions and convective storms, makes up the rest of the summer rainfall totals (Charles et al. 2015). While TCs make a critical contribution to rainfall in the north-west, their inter-annual contribution to summer rainfall can range from 0 to 86%. The inter-annual and spatial variability of TCs strongly affects their reliability as a source for water supplies (Bates et al. 2012, Charles et al. 2015). 8
Climate in the Pilbara

Figure 2.6 Average and median monthly rainfall at (a) Port Hedland, (b) Mardi, (c)
Marble Bar, (d) Coolawanyah and (e) Mt Vernon, 1970–2014. The shaded area
indicates the 90th and 10th percentiles (source SILO Patched Point Dataset 2014)

                                                                                     9
Climate in the Pilbara Figure 2.7 Number of thunder days in WA, 1990–99 (BoM viewed November 2014 bom.gov.au/jsp/ncc/climate_averages/thunder-lightning/index.jsp?maptype=tdays) 2.3 Evaporation The Pilbara is subject to very high evaporative demand. Pan evaporation represents the potential evapotranspiration from small, open water bodies surrounded by non- irrigated land and exceeds 3000mm per year over much of the region (Figure 2.8a). The higher areas of the Hamersley Ranges are cooler (Figure 2.3) and subject to greater summer cloud cover (Figure 2.7) so have the less evaporative demand. Pan evaporation averages 10–14mm/d during summer and drops to 4–7mm/d during winter (Figure 2.9). Areal actual evapotranspiration is an estimate of actual evapotranspiration from soil and vegetation as constrained by water availability (principally rainfall) (Figure 2.8b). 10
Climate in the Pilbara

Figure 2.8 Average annual (a) pan evaporation (1975–2005) and (b) areal actual
evapotranspiration (1961–90) for WA, (Source BoM viewed February 2016
bom.gov.au/climate/averages/maps.shtml )

                                                                                 11
Climate in the Pilbara Figure 2.9 Monthly average and median daily pan evaporation at (a) Port Hedland, (b) Mardi, (c) Marble Bar, (d) Coolawanyah and (e) Mt Vernon1970–2014. The shaded area indicates the 90th and 10th percentiles (source SILO Patched Point Dataset 2014) 12
Climate in the Pilbara

2.4 Solar radiation
The western Pilbara receives more sunshine than anywhere else in Australia,
averaging more than 10 hours a day, compared to 9–10 hours elsewhere in the
Pilbara and 5–6 hours in southern Australia (Figure 2.10). Average daily solar
radiation across the Pilbara generally ranges from a high of 22.25–22.50 megajoules
per square metre per day (MJ/m2/d) in the north-west to 20.75–21.00MJ/m2/d in the
south (Figure 2.11). Solar radiation is at the lower end of the range in the Hamersley
Ranges, reflecting the greater summer cloud cover.
  Daily solar radiation tends to be greatest during the dry spring months and least
during winter, with summer and autumn providing intermediate values (Figure 2.12).

Figure 2.10 Average annual daily hours of sunshine in WA (BoM viewed November
2014 bom.gov.au/jsp/ncc/climate_averages/sunshine-hours/index.jsp)

                                                                                    13
Climate in the Pilbara Figure 2.11 Average annual solar radiation (MJ/m2/d) (Charles et al. 2015) Figure 2.12 Monthly average daily solar radiation at Port Hedland 1970–2014. The shaded area indicates the 90th and 10th percentiles (source SILO Patched Point Dataset 2014) 14
Climate in the Pilbara
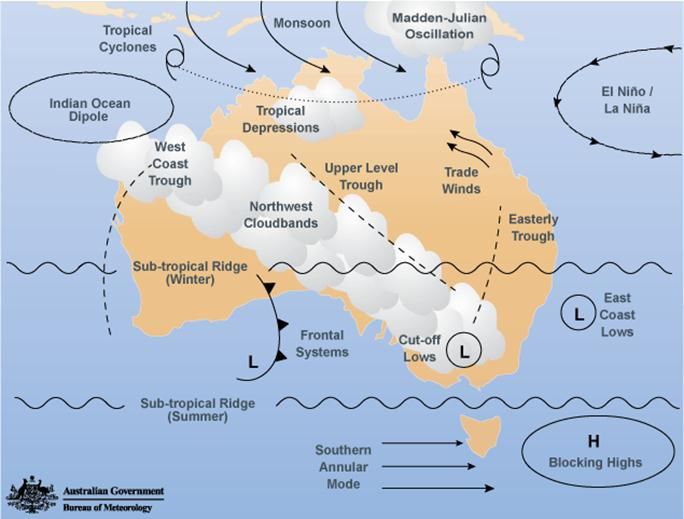
3 Climate drivers
The drivers for the Pilbara’s weather operate from the level of global circulation, such
as the subtropical ridge and the monsoon, to more regional drivers, such as north-
west cloud bands and the west coast trough (Table 3.1, Figure 3.1).
The subtropical ridge is an extensive area of high pressure that encircles the globe at
the middle latitudes (BoM 2008a). The position of the ridge varies with the seasons,
with conditions along the ridge tending to be stable and dry. In winter, the ridge is
located over the Pilbara and conditions are generally dry. However, north-west cloud
bands can bring rainfall when a trough of low pressure occurs in the upper levels of
the atmosphere, or warm, moist tropical air originating over the Indian Ocean moves
southwards.
In summer, the ridge moves south, allowing the monsoon to develop in the far north.
During the monsoon season, systems such as TCs and tropical depressions can
develop and bring intense rainfall.
The Indian Ocean Dipole (IOD) — quantified as the difference in sea temperatures in
the western and eastern Indian Ocean — and the El Niño Southern Oscillation index
(ENSO) — quantified as differences in atmospheric pressure across the Pacific
Ocean — can act individually or interact to affect tropical cyclone activity and rainfall
across northern Australia (Charles et al. 2015). These climate drivers are discussed
in more detail below.
Table 3.1 Summary of the main climatic drivers of weather in the Pilbara
Months when
Climate driver Phases Effect most active
Subtropical ridge not monsoon onset December–March
applicable
The Australian active widespread rainfall, often December–March
monsoon heavy
The Australian inactive isolated showers December–March
monsoon
Tropical cyclones not strong wind and rain December–April
applicable
North-west cloud band not rainfall, often heavy March–October
applicable
Indian Ocean Dipole positive less rain June–November
Indian Ocean Dipole negative more rain June–November
El Niño Southern El Niño less rainfall and fewer TCs May–April
Oscillation
El Niño Southern Oscillation La Niña more rainfall and more TCs May–April
15Climate in the Pilbara Figure 3.1 The major weather and climate drivers across Australia (BoM 2010a) 3.1.1 The subtropical ridge The subtropical ridge is a belt of high pressure encircling the globe in the middle latitudes. From November to April, it is generally located south of Australia (BoM 2008a). As it moves southward in spring, the continent heats up and the monsoon trough — a zone of low pressure, rising air — moves over northern Australia. The prevailing winds become north-westerly, drawing moist air from the tropical ocean over northern Australia and bringing cloud and rain. In autumn, the subtropical ridge moves northward, pushing the monsoon trough to the north of Australia. The prevailing winds during winter and spring are dry easterly or south-easterly – it is this climatic influence that causes the aridity of the Pilbara (Charles et al. 2015). 3.1.2 The Australian monsoon The monsoon contributes to rainfall across the Pilbara, but more so in the east than the west (Charles et al. 2015). The monsoon season usually extends from December to March (the wet season). The monsoon trough frequently generates individual low pressure systems (tropical lows or tropical depressions) that can produce heavy rain and flooding. However, the timing, extent and intensity of rainfall are highly variable because of oscillations between active and inactive monsoon phases (BoM 2008b). The active phase is usually associated with broad areas of cloud and rain across northern Australia, with sustained moderate to fresh north-westerly winds on the 16
Climate in the Pilbara

north side of the trough. An inactive period occurs when the monsoon trough
temporarily weakens or moves north of Australia.
Transitions from active to inactive monsoon phases are associated with the Madden-
Julian Oscillation (MJO) and delayed onset of the monsoon is often associated with
El Niño conditions in the Pacific, while La Niña is usually associated with early onset
(BoM 2008b, BoM 2012).
3.1.3 The Madden-Julian Oscillation
The MJO is a ‘pulse’ of cloud and rainfall that travels eastward around the globe near
the equator. It has an interval of 30 to 60 days and has its greatest effect during
summer (BoM 2012).
The MJO can affect the timing and intensity of active monsoon periods and increase
the intensity and duration of associated rainfall. TCs are also more likely to develop
in association with certain phases of a strong MJO event.
3.1.4 Tropical depressions
Tropical depressions can bring occasional thunderstorms, fresh to strong and gusty
winds and heavy rain that may cause flooding (BoM 2008c). They develop from
October to April and can last from a day to a couple of weeks.
Tropical depressions are moderate-strength low pressure systems which often occur
in association with the monsoon trough. They have the essential structure of a
cyclone and can develop into a TC if the surrounding conditions are favourable. A TC
reverts to a tropical depression once it weakens to below Category 1 strength
(Appendix A).
3.1.5 Tropical cyclones
The Pilbara coast is the most cyclone-prone area along the Australian coastline
(Figure 3.2), with the cyclone season running from mid-December to April and
peaking in February–March (BoM undated 2 and 3). Between 1980 and 2007, 36
TCs crossed the Pilbara, with another four either passing through the inland area or
moving along the coast. The number of TCs varied from none in six of those years to
four in 2006 (BoM undated 3).
Cyclone frequency tends to increase during La Niña years and when the MJO is in
an active phase, with synergies between the ENSO and MJO (Charles et al. 2013).
TCs that affect the Pilbara typically form over warm ocean waters to the north of WA
and intensify before crossing the coast. While TCs can develop from tropical
depressions that move offshore from the West Kimberley, they generally do not have
time to develop into a severe TC (BoM undated 2). Most TCs initially move west-
south-west down the coast at 5–20km/h and then take a more southerly track as they
continue south (Figure 3.3) (BoM undated 1 and 3). TCs moving south of about 22°S
or crossing the Pilbara coast tend to curve to the south-south-east and accelerate.
Within this broad pattern, the path of each cyclone can vary considerably in response
to other weather systems (Figure 3.3).

                                                                                     17
Climate in the Pilbara Figure 3.2 Places TCs crossed the Australian coast between 1970 and 2008. Red dots represent severe (Category 3 or higher) TCs and black dots represent non- severe (Category 2 or lower) TCs (BoM undated 3) Figure 3.3 Tracks of tropical cyclones that neared or crossed the Pilbara coast from 1980 to 2007 (BoM undated 3) 18
Climate in the Pilbara

TCs crossing the Pilbara coast tend to move further inland than in other parts of
Australia. TCs weaken as they move inland, particularly when moving over the
Hamersley and Chichester ranges (BoM undated 1). Consequently, inland towns
rarely experience the maximum winds of a severe TC, but stronger TCs can maintain
damaging winds for some time before being downgraded below Category 1.
About half of the TCs between 1910 and 2006 had an impact equivalent to a
Category 1 TC; however, TCs with damaging winds affect the Pilbara once every two
years on average (BoM undated 1, 4). The strongest wind gust recorded in the
Pilbara was 259 km/h during TC Trixie in 1975 (BoM undated 4).
Historically, TCs have caused considerable damage and loss of life in the Pilbara, but
modern design regulations ensure that buildings and other infrastructure are now far
less susceptible to damaging winds (BoM undated 4). However, even the threat of a
TC can cause substantial economic losses to the mining and offshore oil and gas
industries through lost production or disruptions to shipping activities.
In addition to damaging winds, cyclonic storm surges and associated flooding are a
major threat to coastal areas. A storm surge is a raised dome of water 60–80km
across and 2–5m higher than the normal tide level. It is caused by low air pressure
and strong onshore winds. A surge coinciding with a high tide can cause extensive
flooding of low-lying coastlines. The winds accompanying TCs also generate large
waves which endanger shipping and can cause serious coastal erosion (BoM
undated 2, 4).
In inland areas, the greatest impact from TCs is generally flooding. Heavy rainfall and
flooding along river systems can damage buildings and fences, affect mining
activities, cause transport delays and damage to road and rail infrastructure. While
most towns and communities are located away from flood-susceptible areas, some
— for example, Nullagine — often experience flooding and more remote communities
may be isolated for extended periods before water levels fall and roads and bridges
are passable (BoM undated 1, 2, 3, 4).
The flood potential of a cyclone is associated with its track, speed, areal extent and
saturation of catchments from prior rainfall rather than its intensity, with the greatest
rainfall usually found along or just east of the cyclone’s track. Rainfall totals
exceeding 100mm are common, with much heavier rainfall occurring in some years.
For example, in February 1997, a slow-moving tropical depression produced more
than 400mm of rainfall in parts and caused one of the highest floods recorded along
the Ashburton River. Flooding is enhanced when multiple TCs or tropical depressions,
occur within a few weeks of each other. In 1980, TCs Amy, Dean and Enid crossed
the eastern Pilbara and produced more than 600mm of total rainfall in some areas
(BoM undated 1, 2, 3, 4).
3.1.6 North-west cloud bands
North-west cloud bands can bring rain to the western Pilbara when they interact with
cold fronts (Charles et al. 2015). They form between March and October when warm,
moist tropical air from the Indian Ocean moves south-east and rises over colder air in
the mid-latitudes (BoM 2013). Formation typically occurs when the Indian Ocean sea

                                                                                     19
Climate in the Pilbara surface temperature (SST) to the north-west of Australia is warmer than average and air from this region moves southward on the western flank of a high pressure system over eastern Australia. North-west cloud bands generally last from a few days to a week (BoM 2013). 3.1.7 Indian Ocean Dipole SST in the Indian Ocean affects rainfall patterns over much of Australia (BoM 2010b). The influence of the Indian Ocean is generally quantified using the IOD, which is the difference in SST anomalies between the western and eastern Indian Ocean. When the Indian Ocean SST is warmer than average near Indonesia — a negative IOD — rainfall may increase; when it is cooler than the average SST — a positive IOD — rainfall may decrease. Positive IOD events sometimes occur during El Niño events, usually resulting in less rainfall over affected regions. Conversely, negative IOD events sometimes occur during La Niña events, usually resulting in increased rainfall over affected regions. IOD effects are generally seen between May and November, with the greatest impact between June and October. 3.1.8 El Niño Southern Oscillation The ENSO is the three-to-eight-year oscillation in SST between the western and eastern Pacific Ocean (BoM 2008d). The term El Niño refers to the negative phase of the ENSO when SST in the central and eastern tropical Pacific Ocean is warmer than average, while La Niña is the positive phase of ENSO when SST in the central and eastern tropical Pacific Ocean is cooler than average (BoM 2011a and b). El Niño and La Niña events normally last for about a year and tend to begin in autumn, mature during winter, spring and early summer, then begin to decay in late summer and end in the autumn. The greatest impact normally occurs during the winter, spring and early summer period. While El Niño and La Niña influence TC generation and strength, and the MJO, they generally do not have much effect on the Pilbara other than their interaction with the Australian monsoon (see above). 20
Climate in the Pilbara

4 Historical climate trends
4.1 Rainfall
Over the last 40–60 years annual rainfall has increased across most of the Pilbara,
except in the far west where it has decreased (Figure 4.1) (Bates et al. 2012, Charles
et al. 2015). A recent study of tree growth in the Pilbara found that five of the 10
wettest years in the last 210 years occurred in the last 20 years (O'Donnell et al.
2015). Rainfall intensity and number of rain days have increased in the central and
eastern parts of the Pilbara and decreased in the west (Charles et al. 2015). Rainfall
has generally increased during December, February and March, and declined during
May and June (Charles et al. 2015) (Figure 4.1). This trend has increased the
seasonality of rainfall — difference between the rainfall amount in the driest and
wettest periods — in the region (Feng et al. 2013).
Bates et al. (2012) linked increased rainfall in the eastern Pilbara to an increase in
the growth rate of the north-west cloud bands and an increase in the variability of the
MJO. Bates et al. (2012) suggested that particulate pollution from South-east Asia
might be exerting a cooling effect on climate and masking the effects of increasing
greenhouse gas concentrations.
High SSTs off the Pilbara coast and increased summer rainfall in the Pilbara have
coincided with major shifts in the large-scale atmospheric circulation of the southern
hemisphere (Bates et al. 2012, Charles et al. 2015). These changes include a
southward shift in the subtropical ridge and the southern hemisphere westerly jet
stream (Cai et al. 2012, Abram et al. 2014, O’Donnell et al. 2015).
The decline in autumn and winter rainfall over the western Pilbara is also attributed to
the southward shift in the subtropical ridge and the southern hemisphere westerly jet
stream (Bates et al. 2012, Cai et al. 2012, Charles et al. 2015, Abram et al. 2014).
The southern hemisphere westerly jet stream has strengthened, which has increased
high pressure anomalies over the mid-latitudes. The subtropical jet stream has
weakened, which has slowed the alternation of low pressure and high pressure
systems, and weakened surface low pressure systems and cold fronts. Consequent
rainfall reductions are associated with the persistence of high pressure systems over
the region, so while intense rainfall events still occur, they are interspersed by longer
dry periods (Bates et al. 2012, Abram et al. 2014).

4.2 Temperature
While average annual temperatures have increased over most of WA, changes in
seasonal average temperature have been mixed (Figure 4.1). In the Pilbara,
temperatures have increased most during winter and spring and cooled during
summer and autumn. Warming during the largely cloudless winter and early spring is
in line with global trends, and summer cooling is likely caused by increasing summer
rainfall and associated cloud cover over north-western Australia (Bates et al. 2012).

                                                                                      21
Climate in the Pilbara Figure 4.1 Trends in temperature, rainfall and pan evaporation in WA, 1970–2012 (source BoM viewed July 2013 bom.gov.au/climate/change/index.shtml#tabs=Tracker&tracker=trend-maps 4.2.1 Hot spells During 1958–2010, the intensity of hot spells decreased and the frequency and duration generally increased over north-west WA (Bates et al. 2012). 4.3 Evaporation Pan evaporation has generally declined over the period 1971–2011, with the greatest declines (0.040 mm/d/y) in the south-east Pilbara (Charles et al. 2015) (Figure 4.1). Charles et al. (2015) attribute this decline to declining wind speed. 22
Climate in the Pilbara

4.4 Tropical cyclones
Over the last 40 years the frequency of TCs has not significantly changed across the
region, although there is some evidence that the frequency of the most intense TCs
has increased (O’Connell et al. 2015). Also, the latitude at which TCs reach their
maximum intensity in the southern hemisphere is trending southward at about 63
kilometres per decade over the last 30 years (Kossin et al. 2014).
Haig et al. (2014) suggested that TC activity in WA is now at the lowest level in 3500
years. Their conclusion is based on stalagmites showing evidence of a repeated
centennial cycle of TC activity, with a sharp decrease in activity after 1960.

                                                                                    23
Climate in the Pilbara 5 Projected effects of global warming on future climate The Intergovernmental Panel on Climate Change (IPCC) Fifth Assessment Report (IPCC AR5) concluded there is very high confidence (Appendix D) that more than half of the observed increase in global temperature is caused by human activities increasing greenhouse gas concentrations in the atmosphere (Bindoff et al. 2013). As global temperature increases, the hydrological cycle intensifies and atmospheric circulation patterns change so the tropical belt widens, and storm tracks and subtropical dry zones move towards the poles (Marvel & Bonfils 2013). The latest climate projections for the northern Australian Rangelands, which includes the Pilbara, conclude that there is very high confidence that temperatures will continue to rise, high confidence that the intensity of heavy rainfall events will increase, and that natural variability will continue to be the primary driver for the amount of rainfall the region receives (Watterson et al. 2015). The following sections describe possible changes in the Pilbara climate to the end of this century. This information summarises data from: BoM; the Indian Ocean Climate Initiative (IOCI) Stage 3 (Bates et al. 2012); CSIRO and BoM (2007), which used emission scenarios and global climate models (GCMs) associated with the IPCC Fourth Assessment Report (IPCC AR4); and Charles et al. (2015) and Watterson et al. (2015) who used the Representative Concentration Pathways (RCP) emission scenarios and Coupled Model Intercomparison Project Phase 5 (CMIP5) GCMs associated with IPCC AR5. Appendix B provides a brief description of the various emission scenarios and some of the limitations of the climate modelling. CSIRO and BoM (2007, 2015) provide a comprehensive discussion of the sources of uncertainty around climate modelling and how to assess and use the data. 5.1 Temperature Average temperatures are projected to continue increasing to the end of the century. Bates et al. (2012) found that for a high-level emission scenario (A2), the annual average daily maximum temperatures were projected to increase by 2.0–3.2°C by 2050 and 3.8–4.6°C by 2100. Annual average daily minimum temperatures were projected to increase by 1.9–2.4 by 2050 and 4.1–4.6°C by 2100. The IOCI downscaled projections show that under an A2 emission scenario, temperature is projected to increase and will be outside of the current temperature range by 2050 (Appendix D). The changes in minimum and maximum temperatures are projected to be similar across all seasons (Appendix D). Climate projections from the CMIP5 GCMs and RCP emission scenarios gave very high confidence for substantial temperature increases in the Pilbara, with the north- west of WA warming more than elsewhere in Australia (Figure 5.1, Table 5.1) (Watterson et al. 2015). For the Northern Rangelands, which includes the Pilbara, annual average temperature is projected to increase by 0.6–1.5°C by 2030 for all emission scenarios, and by 1.5–3.1°C or 3.1–5.6°C by 2090 for RCP4.5 or RCP8.5, respectively (Watterson et al. 2015). This warming is large compared to natural 24
Climate in the Pilbara
variability and by 2050, a year with what is then below-average temperature will be
warmer than what is now considered a year with above-average temperature. Table
5.1 shows projected changes in average annual maximum temperature for Port
Hedland.
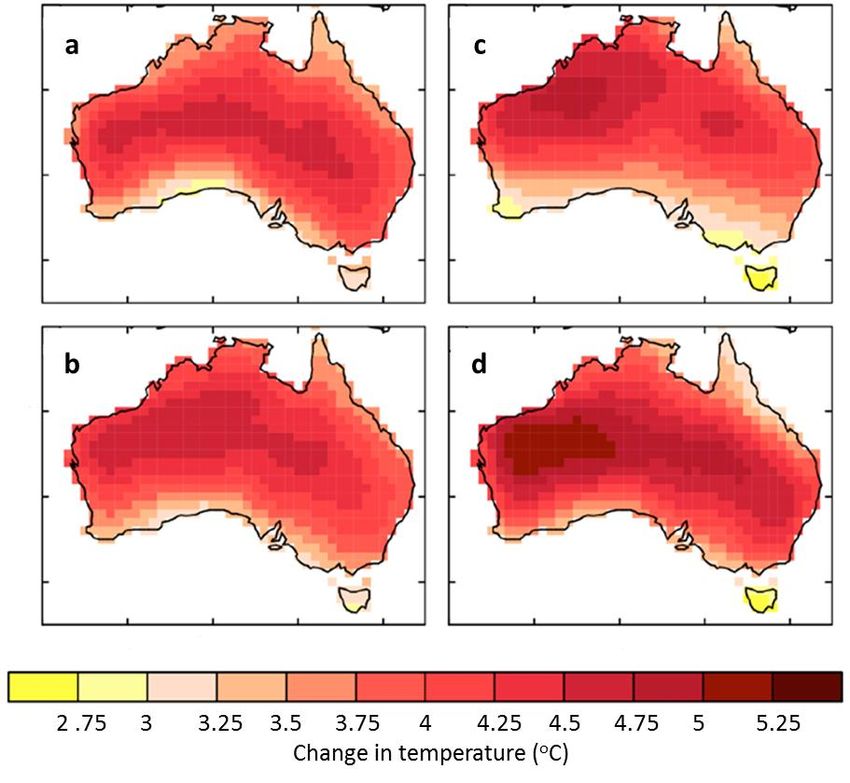
Figure 5.1 Projected annual average daily temperature change across Australia in
2090 for RCP8.5 in (a) summer, (b) autumn, (c) winter and (d) spring. Projections are
relative to the period 1986–2005 (CSIRO & BoM 2015)
25Climate in the Pilbara
Table 5.1 Annual average maximum temperature, rainfall and severe fire days at Port
Hedland for the 1995 baseline and the projected changes in 2030 and 2090 for
RCP4.5 and RCP8.5 emission scenarios (Watterson et al. 2015)
Baseline 2030 2030 2090 2090
Variable 1995 RCP4.5 RCP8.5 RCP4.5 RCP8.5
Temperature (°C) 33.4 0.9–2.1 1.1–2.1 2.1–2.7 3.1–5.4
Rainfall (mm) 314 -116–4 -92–10 -52–3 -122–23
Severe fire danger 10.7 0.2–16.1 1.6–10.5 3.7–9.5 2.9–35.4
days (days)
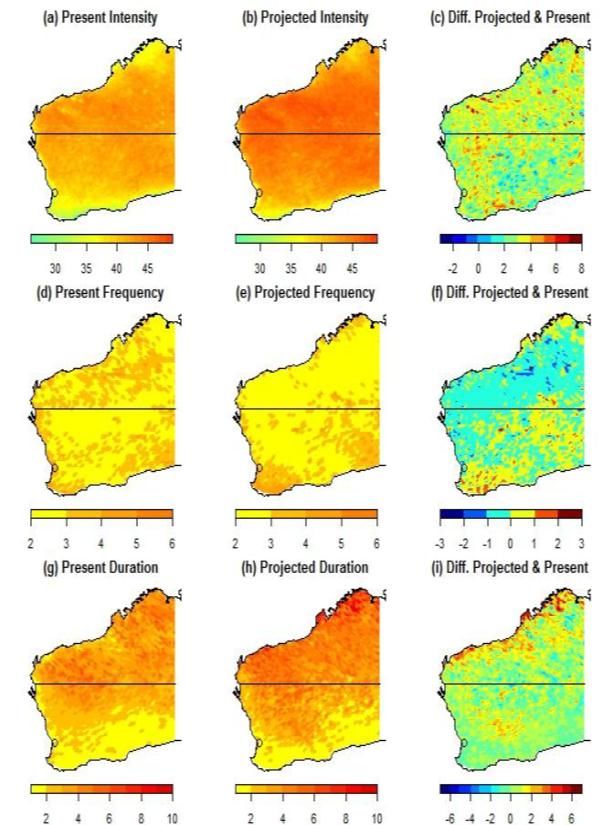
5.1.1 Hot spells
Hot spell thresholds range from 33 to 46°C for the Pilbara coast, up to 45°C for inland
areas (Bates et al. 2012). The intensity and duration of hot spells may increase over
much of the region, while the frequency may decline (Figure 5.2).
5.1.2 Frost
While climate models have difficulty reproducing the observed occurrence of frost,
frost frequency is projected to decrease as temperature increases (CSIRO & BoM
2007, Watterson et al. 2015).
5.2 Rainfall
Modelling by Bates et al. (2012) suggested annual rainfall across the region will
decline by 1–24% by 2050 and 9–24% by 2100, for the A1B emission scenario and
5–14% by 2050 and 5–28% by 2100for the A2 emission scenario. The IOCI
downscaled projections show that while rainfall is projected to decline throughout this
century, it will largely remain within the historical range at the five sites examined
(Appendix D).
More recent modelling for the Pilbara found little change in annual rainfall for the
RCP4.5 scenario and median rainfall reductions of 1.5% by 2030 and 2% by 2050 for
the RCP8.5 scenario (Charles et al. 2015) (Table 5.1). Rainfall was predicted to
decrease in western parts of the Pilbara and increase in eastern parts. Watterson et
al. (2015) found that there is high confidence that natural rainfall variability will remain
the primary driver of rainfall changes to 2030 (Figure 5.3).
26Climate in the Pilbara
Figure 5.2 Changes in the characteristics of hot spells across WA for the A2
emissions scenario. Intensity, in degrees Celsius, for (a) 1981–2010, (b) 2070–99,
and (c) the difference between (a) and (b). Frequency, as the number of events, for
(d) 1981–2010, (e) 2070–99 and (f) the difference between (d) and (e). Duration, in
days, for (g) 1981–2010, (h) 2070–99 and (i) the difference between (g) and (h). The
black line demarcates the north–south boundary (Bates et al. 2012)
27Climate in the Pilbara Figure 5.3 Projected seasonal rainfall change by 2090 for RCP8.5. Projections are relative to 1986–2005 (CSIRO & BoM 2015) CSIRO & BoM (2007) suggest the number of dry days is likely to increase, while Kirono et al. (2011) suggest that the extent and frequency of drought would not significantly change. Watterson et al. (2015) concluded there was low confidence in projections of the frequency and duration of extreme drought (when the standardized precipitation index, SPI, is -2 0r less, CSIRO& BoM 2015) may change, but medium confidence that the duration of droughts will increase throughout the century for RCP8.5. There is broad agreement that rainfall intensity — the amount of rain falling on a day — is likely to increase but it is not clear by how much (CSIRO & BoM 2007, Charles et al. 2015, Watterson et al. 2015). Watterson et al. (2015) concluded there was high 28
Climate in the Pilbara

confidence that the intensity of heavy rainfall would increase but there was low
confidence about the magnitude of change. O’Connell et al. (2015) suggest that if
current trends for the poleward shift in global circulation continues and intensifies,
rainfall in summer and autumn might increase in north-western Australia.

5.3 Tropical cyclones
TC frequency is projected to decline and intensity is projected to increase over this
century (Moise et al. 2015, Watterson et al. 2015). Modelling by Bates et al. (2012)
suggest that the frequency of TCs may decrease by as much as 50% by 2100, with
rainfall intensity increasing by 23% within 200km of the storm centre and 33% within
300km of the storm centre. Haig et al. (2014) suggest this reduction in frequency may
have begun in the 1960s. Watterson et al. (2015) concluded there was medium
confidence that TCs would become less frequent and increase in intensity.

5.4 Wind speed
Projections suggest there may be a small increase in wind speed in northern coastal
areas during summer and a decrease during winter (Figure 5.4). While there is low
confidence in the direction of any changes, there is medium confidence that the
changes will be small (Watterson et al. 2015).

Figure 5.4 Average wind speed (m/s) for 1986–2005 during (a) summer and (b)
winter, and percentage change in the median projected wind speed during (c)
summer and (d) winter in 2090 for RCP8.5 (Watterson et al. 2015)

                                                                                         29
Climate in the Pilbara 5.5 Evaporation Watterson et al. (2015) found there was high confidence that potential evaporation would increase, but only medium confidence in the magnitude of the change (Figure 5.5). Projections for the Pilbara using CMIP5 GCMs suggest median potential evaporation may by 3% by 2030 and 4.46% by 2050 for the RCP4.5 scenario, and increase by 3.4% and 6.5%, respectively, for the RCP8.5 scenario (Charles et al. 2015). Figure 5.5 Projected seasonal potential evaporation change in 2090, relative to 1986–2005 (shown in grey). Bars show the range of projections and boxes show the 10th and 90th percentiles. Projections are for RCP2.5 (green), RCP4.5 (blue) and RCP8.5 (red) (Watterson et al. 2015) 5.6 Fire risk There is only low confidence in the projected future fire risk (Table 5.1); however, warmer and drier conditions may increase extreme fire behaviour in future (Watterson et al. 2015). 30
Climate in the Pilbara

Appendices
A Cyclone intensity ratings
B How future climates are simulated
C Confidence levels in projected climate changes
D Historical and projected values of rainfall and temperature at five sites
E Further information

                                                                                31
Climate in the Pilbara
Appendix A Tropical cyclone intensity ratings
Table A1 Intensity ratings for tropical cyclones (BoM
bom.gov.au/cyclone/about/intensity.shtml)
Category Typical Central Typical effects
strongest pressure
gust (hPa)
(km/h)
1 90–125 >985 Negligible house damage; damage to some
crops, trees and caravans; craft may drag
moorings.
2 125–164 985–970 Minor house damage; significant damage to
signs, trees and caravans; heavy damage to
some crops; risk of power failure; small craft
may break moorings.
3 165–224 970–955 Some roof and structural damage; some
caravans destroyed; power failures likely.
4 225–279 955–930 Significant roofing loss and structural damage;
many caravans destroyed and blown away;
dangerous airborne debris; widespread power
failures.
5 >280Climate in the Pilbara
Appendix B Simulating future climate
Long-term emission scenarios (Table C1) and global climate models (GCMs) are
used to simulate how increasing atmospheric GHG concentrations may affect future
climate. GCMs are the primary tool for investigating and testing how the atmosphere
is likely to respond to changes in GHG concentrations. They simulate the physical
relationships behind the major weather and climate features (Figure 3.1), and how
they interact with the land and ocean. Emission scenarios are designed to account
for a wide range of demographic, economic and technological drivers of greenhouse
gas and sulfur emissions from now until 2100 (Nakicenovic et al. 2000).
It should be noted that the GCMs do not deal well with phenomena that might induce
abrupt changes in the climate system or some of its components (Stocker et al.
2013). While there is information about potential consequences of some abrupt
changes, there is low confidence and little consensus on the likelihood of such
events over this century (Stocker et al. 2013).
Modelling studies of climate change are commonly run as ensembles of multi-model
simulations. This is to deal with uncertainties arising from the internal variability of the
oceans and atmosphere, and from limitations in the models’ ability to simulate all
processes in sufficient detail. To account for this variability (or uncertainty) among
models, the results from a suite of models and the range of values and the median
projection.
Most of the variability in near-term (e.g. 2020) climate simulations result from
differences among GCMs rather than emission trajectories; however, differences in
emission trajectories become increasingly important in determining medium-term
(2050) and longer-term (2070) climate outcomes (CSIRO & BoM 2007). Differences
in climate projections reported in IPCC AR5 compared to previous reports largely
stem from differences in the emission scenarios rather than outputs from the GCMs.
The relatively coarse spatial resolution of GCMs can also lead to inaccurate
projections, particularly in coastal and mountainous areas (CSIRO & BoM 2007).
This source of error can be reduced by downscaling using local climate data. Bates
et al. (2012) did this for the five sites listed in Table 1.1. One hundred runs of
downscaled data for each of the six GCMs for each site were downloaded (IOCI data
portal) and compared with measured data for the period 1970–99 (Appendix D). All of
the models simulated average maximum and minimum temperatures within 2% of
measured values. Prediction of rainfall was less accurate, particularly prediction of
extremely dry or wet years. The MK35 model best simulated rainfall, and was within
±3% of measured annual rainfall for all sites except Mt Vernon (+9%). Projections of
the 90th percentile were within ±10% and the 10th percentile were within ±59% of
measured values for all sites except Mt Vernon (±191%). The 10th percentile for the
measured values was less than 20mm for all sites except Marble Bar, which was
71mm, so errors in this estimate were small in absolute terms.
33Climate in the Pilbara
Table B1 Projected atmospheric carbon dioxide (CO2) concentrations and global average surface warming for SRES illustrative
emission scenarios and Representative Concentration Pathways (RCP). Temperature (T) values are relative to conditions in 1990
for SRES and 1986–2005 for RCP trajectories (source: Nakicenovic et al. 2000, Solomon et al. 2007, Collins et al. 2013, Prather et
al. 2013)
Emission 2030 2050 2090 2030 2050 2090
trajectory Scenario CO2 (ppm) CO2 (ppm) CO2 (ppm) T (°C) T (°C) T (°C)
A1F1 Rapid economic growth, global population peaks in 2050, rapid introduction of 455 567 885 0.9 1.9 4.5
new technologies, intensive use of fossil fuels.
A1T Rapid economic growth, global population peaks in 2050, rapid introduction of 440 501 577 1.0 1.8 2.5
new technologies, increasing use of renewable energy.
A1B Rapid economic growth, global population peaks in 2050, rapid introduction of 454 532 685 0.9 1.6 3.0
new technologies, mixed energy sources.
A2 High global population growth, slow economic development, slow economic 448 527 762 0.7 1.4 3.8
development, disparate living standards.
B1 Global population peaks in 2050, convergent living standards, rapid move to 434 628 542 0.8 1.2 2.0
service and information economies.
B2 Intermediate population and economic growth, emphasis of solutions to 429 478 589 0.9 1.4 2.7
economic and environmental sustainability.
RCP2.6 Emissions rapidly decline to zero and by the middle of the century, 431 443 426 0.7 (0.5–1.2) 0.9 (0.5–1.7) 0.9 (0.2–1.8)
sequestration technologies will begin to reduce atmospheric CO2.
RCP4.5 Not available 435 487 534 0.8 (0.6–1.2) 1.2 (0.8–2.0) 1.7 (1.1–2.6)
RCP6.0 Assumes that despite a gradual reduction in emissions, atmospheric CO2 429 478 636 0.7 (0.4–1.2) 1.2 (0.7–1.8) 2.0 (1.5–3.2)
concentration will continue to increase until it stabilises around 2100.
RCP8.5 Assumes that emissions and atmospheric CO2 concentration will continue to 449 541 845 0.9 (0.7–1.4) 1.7 (1.2–2.4) 3.6 (2.6–4.8)
increase at current rates.
34Climate in the Pilbara
Appendix C Confidence levels in projected climate
changes
Table C1 Definition of confidence levels in projected climate outcomes (Mastrandrea
et al. 2010, Stockler et al. 2013, CSIRO & BoM 2015)
Confidence level Likelihood of outcome
Very high 90–100% probability
High 66–100% probability
Medium 33–66% probability
Low 0–33% probability
35Climate in the Pilbara Appendix D Historical and projected values of rainfall and temperature in the Pilbara Downscaled data (calculated median and 10th and 90th percentiles of 100 runs) from the MK35 model are presented for Port Hedland, Mardi, Marble Bar, Coolawanyah and Mt Vernon. Figure D1 Historical and projected values of (a) monthly and (b) annual rainfall, and (c) monthly and (d) annual temperature at Port Hedland. Values are actual values for the period 1970–99 and projected values using the MK35 GCM and A2 emission scenario for the periods 2047–64 and 2082–99 36
Climate in the Pilbara

Figure D2 Historical and projected values of (a) monthly and (b) annual rainfall, and (c) monthly and (d) annual temperature at
Mardie. Values are actual values for the period 1970–99 and projected values using the MK35 GCM and A2 emission scenario for
the periods 2047–64 and 2082–99

                                                                                                                               37
Climate in the Pilbara Figure D3 Historical and projected values of (a) monthly and (b) annual rainfall, and (c) monthly and (d) annual temperature at Marble Bar. Values are actual values for the period 1970–99 and projected values using the MK35 GCM and A2 emission scenario for the periods 2047–64 and 2082–99 38
Climate in the Pilbara

Figure D4 Historical and projected values of (a) monthly and (b) annual rainfall, and (c) monthly and (d) annual temperature at
Coolawanyah. Values are actual values for the period 1970–99 and projected values using the MK35 GCM and A2 emission
scenario for the periods 2047–64 and 2082–99

                                                                                                                                  39
You can also read