Measuring the Economic Impact of Climate Change on Crop Production in the Dry Zone of Myanmar: A Ricardian Approach - MDPI
←
→
Page content transcription
If your browser does not render page correctly, please read the page content below
climate
Article
Measuring the Economic Impact of Climate Change
on Crop Production in the Dry Zone of Myanmar:
A Ricardian Approach
Aung Tun Oo * , Guido Van Huylenbroeck           and Stijn Speelman
 Department of Agricultural Economics, Faculty of Bioscience Engineering, Ghent University,
 9000 Gent, Belgium; Guido.VanHuylenbroeck@UGent.be (G.V.H.); stijn.speelman@ugent.be (S.S.)
 * Correspondence: aunghtunoo717.yau@gmail.com

 Received: 21 November 2019; Accepted: 27 December 2019; Published: 9 January 2020

 Abstract: Myanmar is the country with the highest economic vulnerability (EV) to climate change in
 the Southeast Asian region. The dry zone of Myanmar occupies two-thirds of the agricultural lands
 and it has higher temperatures than elsewhere in the country. Climate change has severe impacts
 on agricultural production in this region. Moreover, changes in the precipitation patterns increase
 the likelihood of crop failures in the short-run and production declines in the long run. Therefore,
 an assessment of the economic impacts of climate change on crop production in the dry zone of
 Myanmar is very relevant. This paper examines the interactions between agriculture and climate and
 assesses the economic impact of climate change while using a Ricardian model. A cross-sectional
 survey covering three regions in the central dry zone: (Magwe, Mandalay, and Sagaing regions) was
 conducted, yielding a sample of 425 farmers. A non-linear relationship between climate indicators
 (temperature and precipitation) and revenue of land was found. The marginal effects were calculated
 by selecting economic and socio-demographic variables. The estimated marginal impacts suggest
 that the projected changes in temperature will affect the crop productivity of the region. The results
 also show that the temperature and rainfall components of global warming are both important.
 Predictions from three global circulation models all confirm that temperature is predicted to increase
 in all seasons. A significant marginal impact of increasing temperature on the net revenue of farm
 households was observed in the region. These findings call for policy makers and development
 planners to articulate the necessary climate change adaptation measures and mitigation options for
 reducing the negative impacts of climate change. Improved management and conservation of the
 available water resources could generate water for irrigation purposes and the dissemination of
 climate smart agricultural practices could lessen the negative impacts of climate change effects on
 agriculture in the dry zone of Myanmar.

 Keywords: economic vulnerability; climate change adaptation; ricardian model; agriculture; dry
 zone of myanmar

1. Introduction
     Agriculture is one of the most climate dependent human activities, as it is highly sensitive to
different hydro-climatic conditions, such as rising of temperature and changes in rainfall. Myanmar,
as an agricultural based country, is prone to the adverse effects of climate change. According to
Asian Disaster Preparedness Centre (ADPC), it has the highest economic vulnerability (EV) to climate
change in Asia [1]. In terms of agro-climatic conditions, Myanmar is a diverse country that exhibits
different challenges [2,3]. Historical climatic data show that temperatures are increasing and the
length of the wet season and monsoon intensity are decreasing, while rainfall has also become more

Climate 2020, 8, 9; doi:10.3390/cli8010009                                   www.mdpi.com/journal/climate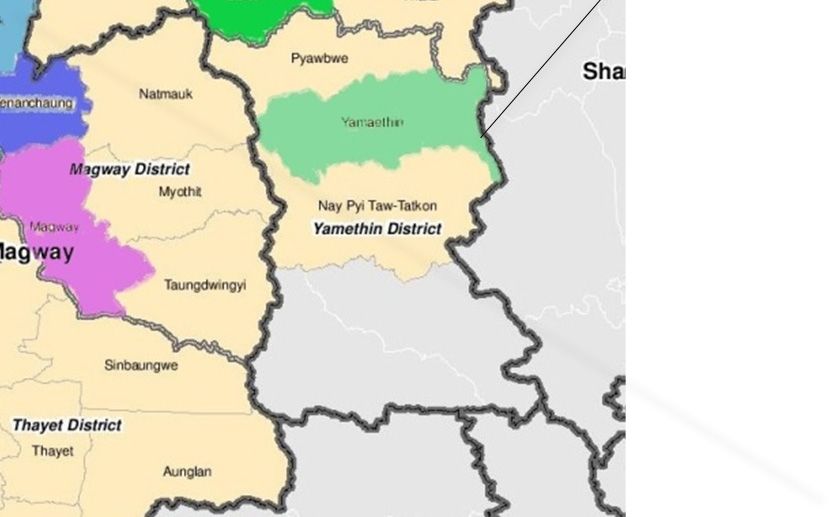
Climate 2020, 8, 9                                                                                   2 of 15

erratic. Although climate change impacts on agriculture can already be witnessed, they are likely to
be aggravated in the future [1,4]. Myanmar will remain one of the most vulnerable countries [2–5],
given the projected changes in extreme weather and climate events, agricultural productivity loss,
and sea-level rise.
      The Central Dry Zone (CDZ) of Myanmar occupies two-thirds of the agricultural land in Myanmar.
The agricultural productivity of this region is crucial for the country, as the agricultural sector alone
contributes nearly 40% to the Gross Domestic Product (GDP), making the CDZ an important region
for national planning. However, increasing droughts and rising temperatures are clearly affecting
agriculture in CDZ [6–10]. Understanding the vulnerability of the agricultural sector to exogenous
pressures is important in the development of agriculture and rural areas for the policy makers and
development planners. Notwithstanding the importance of the region, the understanding of the
magnitude of the impacts of climate change on agriculture in the CDZ is still limited. In the light of the
changing climate, Myanmar lacks detailed estimates of climate change and the impacts on agriculture.
Therefore, this study estimates the climatic and non-climatic determinants of farm profitability on farm
households in the CDZ and assesses the projected impacts of climate change (changes in precipitation
and temperature normal) on agricultural performance while using a Ricardian model. The paper is
structured, as follows. Section 2 gives an overview of the agricultural system and observed changes
in climate in the CDZ, Section 3 reviews the agro-ecological features of the sample districts/regions
and Section 4 reviews the data types and methodologies. Section 5 discusses the results and Section 6
concludes and suggests policy options.

2. Observed Climate Change Patterns and an Overview of Agriculture in CDZ
     The population of the CDZ is approximately 16 million. The region is subdivided in three regions
or states: Magwe, Mandalay, and Sagaing [10]. The CDZ is situated in the middle of Myanmar and it
is part of the central inner Myanmar basin and lowland area. It is located between 19 and 23◦ N and
between 94 and 96◦ E. While the CDZ is typically dry, the wide range of soil types, geomorphology,
vegetation types, water balance, and human activities makes it a diversified zone. The region has
an arid to semi-arid climate. The Bago Yoma Mountain range creates a monsoon’ rainfall shadow.
Seasonal water scarcity is reported to be the primary challenge for the dry zone region [9,11]. The CDZ
receives limited rainfall (500–900 mm) with an unpredictable spatial and temporal variation when
compared to country averages (2353 mm). Temperature can be as high as 43 ◦ C, with April and May
being the hottest months. The highest mean temperature is around 32 ◦ C and the range between the
maximum and minimum temperature is 15 ◦ C [2,3,9,11].
     The production of oil crops, pulses, and rice dominate the agricultural system in the dry
zone [2,11]. According to Matsuda [12], crop productivity in the dry zone region suffers from the high
variation in rainfall. Moreover, the high temperatures reduce the yields of the most important crops.
Other constraints to crop production reported include the traditional farming practices, poor quality
seeds, lack of investments in inputs and their use (fertilizer, pesticide, fungicide dosages), and uncertain
crop prices [6–8,11]. The ongoing adverse changes in precipitation patterns increase the likelihood of
crop failures and decrease farm revenues and the incomes of farmers [6,7,13]. As a coping strategy
for crop failure farmers in the region typically diversify their agricultural production. Most of the
farmers are smallholder subsistence farmers. Approximately 37% of farmers own less than four acres
of land [9,14].

3. Agro-Ecological Features of the Sampled Districts/Regions
     Three agro-ecological zones can be identified based on the type of land (upland or lowland)
and the access to irrigation: a zone with intensively farmed croplands with access to irrigation all
season, a zone with croplands with access to supplementary irrigation and river beds, and a zone with
rain-fed production, including both upland and low-land and extensive rain-fed upland agriculture [9].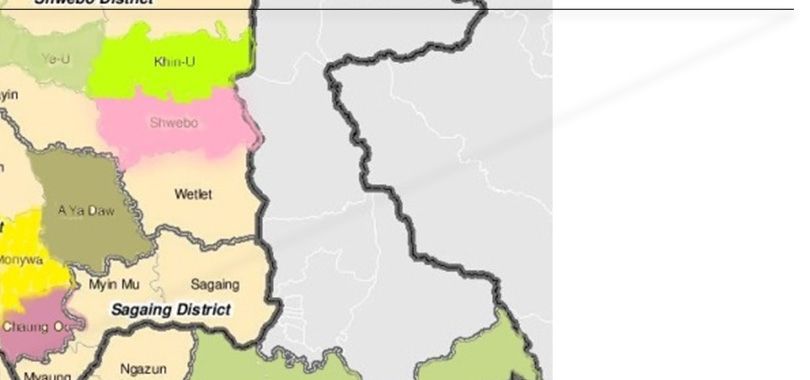
Climate 2020, 8, 9 3 of 15
There are three main cropping seasons: summer crop, monsoon crop, and post monsoon crop or
winter crop.
The characteristics for the dry zone are the clay and sandy soils with high risks of water shortage
and wind erosion lead to land degradation and a decline in agricultural production [6,7]. The soil types
and rainfall patterns are not conducive to rice cultivation in CDZ, especially in the Magwe region.
However, rice is cultivated under irrigation in the Sagaing region. In the CDZ, agriculture is the main
livelihood and income generating activity for households. Approximately 11.74 million peoples out of
the 16 million of the CDZ live in rural areas and their livelihoods mainly rely on agriculture [10]. A large
proportion of the rural population depends on agriculture for their incomes, employments, and food
security. With water availability being their main constraint, farmers normally practices deep tillage,
manure application, and mulching in order to maximize the water storage during rainfall periods.
4. Research Methodology
4.1. Data
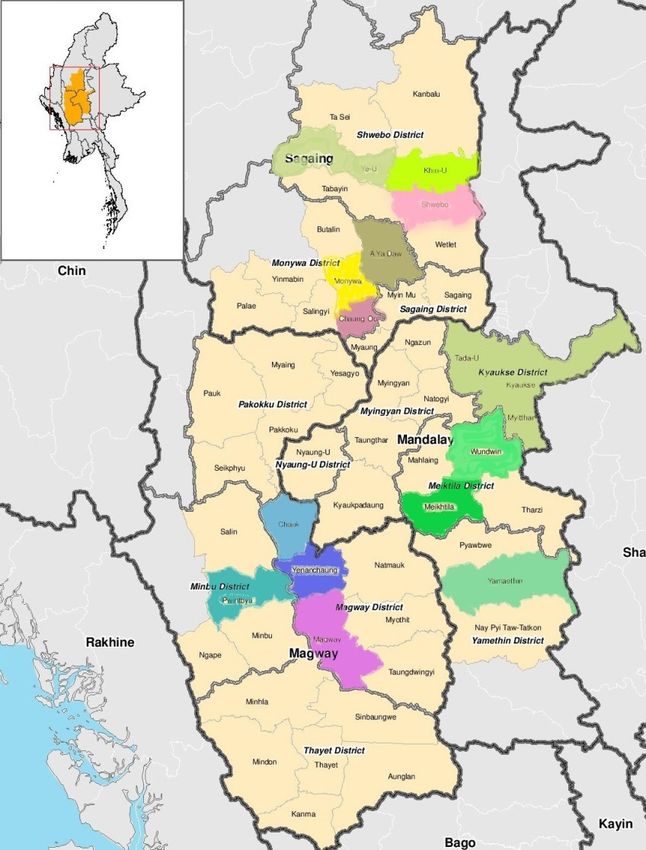
As mentioned above, a cross-sectional survey was conducted in 16 Townships, which cover five
districts and three regions (Sagaing, Mandalay and Magwe) in 2016 to quantify the potential impacts
of climate change on agriculture in the CDZ (see Figure 1). This study uses the mean temperatures of
the different regions of CDZ. This study uses the mean temperatures in different seasons because it is
important to capture the effects of temperature at different key times (three seasons) in the production
cycle for farmers. There are three seasons in Myanmar; summer, winter, and monsoon season. Moreover,
this study uses the average precipitation and temperature from the past 30 years. These climate
data are checked with climate data from regional meteorological departments in the dry zone and
additional weighting of these climate data was carried out, so that the data variation of the average
mean temperature and precipitation are reduced. All precipitation and temperature variables are
expressed by the differences in means across the 30 years of data to ensure that the linear and quadratic
terms are not collinear, see also [15]. In addition, projected climate data were also acquired from the
World Bank data web portal. Following the three cropping seasons (summer, monsoon, and winter),
the strategy of using rainfall averages at each single month permits a more throughout reflection of
accumulation of precipitation in soils over a period. Similar to the precipitation, the temperature at key
times in the production cycle is important for farmers, and the mean temperatures at each single month
are taken into account. The summer season goes from February–May, while monsoon is normally from
June-September, and winter is from October–January. Linear and quadratic terms are included since
climate variables could have non-linear impacts on net revenues, as in [16,17].
It was observed that there is a significant variation in temperature across the different geographic
locations of the Dry Zone. An independent variable that represented the effect of different seasonal
rainfall patterns across the year was fitted in our model. This will avoid any serious serial correlation
in the independent variables and it will be an effective measure to capture the precipitation effects
relative to using a monthly mean.
In addition, this study combines household data with data on long-term climate normals.
The structured interviews looked at socioeconomic characteristics, climate change adaptation measures,
and institutional characteristics. The interview was carried out face-to-face. At the village-tracts
level, the sample villages were randomly chosen and, within the villages the respondents, were also
randomly selected. In total, 425 complete questionnaires were obtained. The socioeconomic and
demographic characteristics of farm households and crop production data were collected. Moreover,
secondary data, such as land use data, and production data of major crops from the Department of
Agriculture were also acquired.
Climate 2020, 8, 9 4 of 15
Climate 2020, 8, x FOR PEER REVIEW 4 of 15
6 townships in
Sagaing region
6 townships in
Mandalay region
4 townships in
Magwe region
Figure 1. Map of the Dry Zone region in Central Myanmar (Source: Myanmar Information
Figure 1. Map of the Dry Zone region in Central Myanmar (Source: Myanmar Information
Management Unit).
Management Unit).
In addition, this study combines household data with data on long-term climate normals. The
The farmer’s fixed costs (i.e., non- cash cost), such as owned cattle and manure cost, their seed
structured interviews looked at socioeconomic characteristics, climate change adaptation measures,
storage, and family labor costs were considered, and variable costs (i.e., cash cost), such as hired cattle,
and institutional characteristics. The interview was carried out face-to-face. At the village-tracts level,
farm-machines and labor cost, purchased manure, fertilizer, and pesticide costs, were included in the
the sample villages were randomly chosen and, within the villages the respondents, were also
total farmersselected.
randomly costs forInproduction and calculated
total, 425 complete on a hectare
questionnaires basic. Net
were obtained. Therevenues per hectare
socioeconomic and are
calculated as the difference between revenues and costs, divided by the number
demographic characteristics of farm households and crop production data were collected. Moreover, of hectares farmed,
seesecondary
more [15].data,Other
suchsocioeconomic
as land use data, characteristics of farmers,
and production data ofsuch
majoras crops
having draught
from animals, access
the Department of to
irrigation facilities, farm
Agriculture were also acquired.size, and size of households, and distance to market (accessible), were also
considered. In the interview
The farmer’s fixed costswith(i.e., farmers,
non- cashunits
cost),that
suchprevailed
as owned in the and
cattle country
manureandcost,
region
theirwere
seedused
andstorage, and family
the conversion ratelabor costs were
(equivalents inconsidered,
SI units) areand variable
shown, costs (i.e.,
as follows: ac =cost),
onecash 0.405such as hired
ha, one basket of
cattle,rice
husked = 34 kg, oneand
farm-machines laborofcost,
basket sesame = 24.5 manure,
purchased fertilizer,
kg, one basket of pigeon peas =costs,
and pesticide were
32.7 kg, included
and one basket
of in the total
other farmers
pulses (green costs
gram) = 31.3 kg, and
for production see calculated
also [18]. on Thea hectare
currentbasic. Net revenues
exchange per hectareKyat
rate of Myanmar
are calculated as the difference between revenues and costs, divided
(MMK) was approximately 1 $ (United State Dollars) = 1250–1300 MMK during the surveying by the number of hectaresperiod.
farmed, see more [15]. Other socioeconomic characteristics of
A production function approach was used to generate the crop revenues of farmers. The farmers, such as having draught
reference
animals, access to irrigation facilities, farm size, and size of households, and distance to market
period for the production data analysis was captured as one-year production cycle from pre-monsoon
(accessible), were also considered. In the interview with farmers, units that prevailed in the country
2015–2016 to post-monsoon of 2016. The farmers were asked the production of major crops and
and region were used and the conversion rate (equivalents in SI units) are shown, as follows: one ac
the diversification of crops upon their owned land over the reference period. For the calculation of
= 0.405 ha, one basket of husked rice = 34 kg, one basket of sesame = 24.5 kg, one basket of pigeon
farm
peasproductivity
= 32.7 kg, and andoneprofit,
basketdata from the
of other previous
pulses (green five
gram)years
= 31.3regarding
kg, see alsocosts andThe
[18]. production
current of
specific or major crops, such as rice (monsoon and summer), groundnut,
exchange rate of Myanmar Kyat (MMK) was approximately 1 $ (United State Dollars) = 1250–1300 sesame, peas and beans
(pigeon
MMK peas,duringblack gram, green
the surveying gram),
period. maize, and
A production sunflower,
function etc. was
approach wereusedacquired from the
to generate the crop
regional
Department of Agriculture. The market prices of different crops at different times
revenues of farmers. The reference period for the production data analysis was captured as one-year (previous five years)
were used in the calculation to estimate the net revenue per hectare. The study only estimates the
farm income obtained from the major crops. Therefore, the amount of net crop revenues per hectare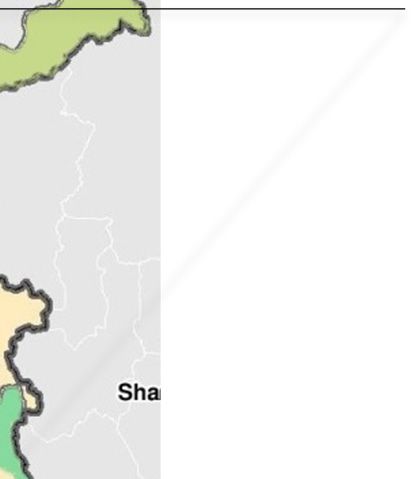
period. For the calculation of farm productivity and profit, data from the previous five years
regarding costs and production of specific or major crops, such as rice (monsoon and summer),
groundnut, sesame, peas and beans (pigeon peas, black gram, green gram), maize, and sunflower,
etc. were acquired from the regional Department of Agriculture. The market prices of different crops
at different
Climate 2020, 8,times
9 (previous five years) were used in the calculation to estimate the net revenue per
5 of 15
hectare. The study only estimates the farm income obtained from the major crops. Therefore, the
amount of net crop revenues per hectare of each individual farm household was obtained. The
of each individual
following farm household
Figure 2 presents wasnet
the resulted obtained. The following
farm revenue Figure 2 presents
of crop production ($ per ha)the
in resulted
CDZ. Maize net
farm revenue of crop production ($ per ha) in CDZ. Maize and green gram give the highest
and green gram give the highest return of the farmers by 224$ and 191$ per hectare, respectively. return of
the farmers
However, by 224$
farmers and oil
report 191$ per hectare,
crops, respectively.
such as groundnut andHowever,
sesame, asfarmers report
their major oil crops,
crops such
and they were as
groundnut and sesame, as their
dominated in the CDZ see also [19]. major crops and they were dominated in the CDZ see also [19].
250 224
Net Return $ per hectare
182 191
200 173
143 148 146
150 130 124
100
50
0
Figure 2. Farm revenue of crops ($) per hectare.
Three climate
Three projection
climate models
projection (i.e., PCM
models (Parallel
(i.e., PCM Climate
(Parallel Model),
Climate CGCM3
Model), (Coupled
CGCM3 Global
(Coupled
ClimateClimate
Global Model),Model),
and CSIRO
and (Commonwealth
CSIRO (Commonwealth Scientific and Industrial
Scientific ResearchResearch
and Industrial Organization Climate
Organization
Model_ Australia)
Climate for Myanmar
Model_ Australia) were used
for Myanmar werefor used
the scenario analysis analysis
for the scenario to projecttothe future
project theimpacts
future
of climate ◦
at 1 × at ◦
impacts of change. Data areData
climate change. presented
are presented 1 1° global grid spacing,
× 1° global produced
grid spacing, through
produced bi-linear
through bi-
interpolation.
linear The study
interpolation. does does
The study not consider
not considerthe income generated
the income fromfrom
generated livestock rearing,
livestock and and
rearing, the
revenues
the from
revenues thethe
from sales of livestock
sales products
of livestock products (milk,
(milk,butter,
butter,meat,
meat,etc.),
etc.),and
andalso
alsoexcludes
excludes subsidies
fromgovernment
received from governmentand andincomes
incomes received
received fromfrom hiring
hiring out out
farmfarm equipment
equipment or own
or their theirlabor.
own
labor. This study excludes these variables, as a part of study focusing on climate
This study excludes these variables, as a part of study focusing on climate change impacts on cropchange impacts on
crop production.
production.
4.2. Theory:
4.2. Theory: Ricardian
Ricardian Analysis
Analysis
In this
In this study,
study, aa hedonic
hedonic approach,
approach, known
known as as the
the Ricardian
Ricardian approach,
approach, waswas used
used toto estimate
estimate the
the
marginal effect of various climatic, economic, and other factors on farmland values.
marginal effect of various climatic, economic, and other factors on farmland values. This approach is This approach
is also
also known
known asasa aduality
dualityapproach,
approach,because
becauseititexamines
examinesthe the relationship
relationship between
between agricultural
agricultural land
land
values and climate data [16,20–22]. The traditional Ricardian approach
values and climate data [16,20–22]. The traditional Ricardian approach has two key assumptions:has two key assumptions:
first, there
first, there is
is aa long
long run
run equilibrium
equilibrium in in factor
factor markets (especially land),
markets (especially land), but,
but, secondly,
secondly, there
there are
are no
no
adjustment costs, such that land rents fully reflect the value of climate at any
adjustment costs, such that land rents fully reflect the value of climate at any given location [23]. given location [23].
Mendelsohn et
Mendelsohn et al.
al. [16]
[16] proved
proved thatthat the
the Ricardian
Ricardian approach
approach could
could bebe developed
developed with
with individual
individual farm
farm
data and with district-level data. A lot of research has been carried out while using
data and with district-level data. A lot of research has been carried out while using Ricardian models Ricardian models
at the
at thedistrict
districtororregional
regional level
level [20,21,24,25].
[20,21,24,25]. LikeLike
otherother studies,
studies, such such as Sanghi
as Sanghi [26], Kumar
[26], Kumar and
and Parikh
Parikh
[27], [27], Kurukulasuriya
Kurukulasuriya and Ajwad and [15],
Ajwad and[15], and Mendelsohn
Mendelsohn et al.
et al. [28], the[28], the net
annual annual net revenue
revenue per
per hectare
hectare is used for representing the agricultural land values, as data on land prices
is used for representing the agricultural land values, as data on land prices were not available in were not available
in Myanmar. This study assumes that the net revenue per hectare depends on climate and a number of
exogenous determinants.
Z Z X
∝t
NR = PLE e dt= { Pi − Qi (X, F, M, G) − R.X}e∝t dt
where: PLE is the net revenue per hectare, (t) is the time, and (∝) is the discount rate. We assume that
the net revenue per hectare, (PLE ) depends upon (Pi ), the market price of crop (i), (Qi ) the output of
crop (i), (R), a vector of input prices, and (X), a vector of purchased inputs (other than land). The cropClimate 2020, 8, 9 6 of 15
output, (Qi ), is in turn a function of the purchased input (X); a vector of climate variables (F), a vector
of labor (M), and a set of farm characteristics (G), such as market access, livestock asset, and irrigation
access, etc. Therefore, the net revenue per hectare depends upon the market price of the crop, the crop
output, and a vector of input prices and purchased inputs.
This study assumed that farmers make a series of production choices that aimed at maximizing
profit at the farm level. Farm households, however, are price takers and, hence, individual farmers
have no impact on market prices [15]. Thus, the estimated specification of net revenues per hectare can
be written as:
PLE = β0 + β1 F + β2 G + β3 M + ε
where, (βi ) are estimated coefficients, (ε) is the unexplained portion that is assumed to be independent
and identically distributed. As said by Kurukulasuriya and Ajwad [15], the potential change in farm
profitability due to changes in climate can be estimated as the difference between the changes in net
revenues per hectare evaluated with the climate variables set to those before the climate change (PbLE )
and after the climate change (PaLE ).
In an econometric assessment of the impacts of climate change, the parameter and modeling
methods are very uncertain. Blanc [29] pointed that a limiting assumption is that estimates are based
on past events, which will continue in the future. In addition, the limitations of this approach are
that it explicitly examines crop and farmer responses to climate, as well as implicitly assuming the
biophysical and economic adjustments that are imposed by climate change [20]. Thus, studies using a
Ricardian analyses need to be carefully evaluated for robustness [20–22,25]. For instance, it is not based
on controlled experiments across farms and does not usually fully include all non-climatic factors (soil
quality, market access, and solar radiation, etc.) in the model [20,21,24,25]. In addition, the Ricardian
model captures the manner in which farmers adjust to climate change over decades, not year by year,
and, thus, we assume that the predictions are a snapshot of the long run profits [19].
In addition, Kurukulasuriya and Mendelsohn [30] mentioned that technology variables also need
to be carefully evaluated in the model. The access to electricity and irrigation could increase the farm
net revenue and reflect either higher technology or better access to market. In this study, the irrigation
costs were not counted in the net revenues, but an irrigation dummy was considered for the analysis.
The reason is that the utilization of irrigation water in Myanmar is normally free of charge as provided
by the government [31]. However, the costs that were related to fertilizer and compost application of
each individual farm’ households were considered and used in the model. The effects of these strategies
on crop net revenue were carefully integrated and calibrated in the model for policy purposes because
the farm households can take these decisions individually as climate change adaptation strategies [21].
The Ricardian technique also considers the adaptations as implicit and endogenous and it assumes
that each farmer maximizes net revenue subject to the exogenous conditions of the farm [16].
However, this study does not consider future technology changes and changes in the future
adaptation strategies following changing climate conditions. In addition, this analysis does not take
extreme climate change events into account [21]. Moreover, the Ricardian model does not reflect price
effects, and it does not take changes in output and input prices that result from the global changes in
production and that might affect farm-level adaptation decisions into account [15,16,32,33]. Therefore,
prices are kept constant in the model [15,24,34]. In addition, this study assumed that the only thing
that changes in the future is climate, mostly in forecasting climate change impacts. Although many
other things, such as population, technologies, institutional conditions, and reliance on agriculture
and livestock, will change over the century [21,35], this study does not account for these changes in
the future. One of the key assumptions of this method is that farm revenue per hectare is sensitive
to climate and a set of exogenous determinants. In this study, it is assumed that climate change will
decrease the major crop’s yields, which, in turn, will reduce the mean income of the farm households.
However, one key assumption is that the return over investment (cost) of the sampled farmers at a
given price was considerably similar in all cases of each crop production. However, in this study,
the number of diversified crops of the farm’ households were objectively considered and interviewedClimate 2020, 8, 9 7 of 15
and, thus, the farm incomes were separately included. Therefore, the data represents the agricultural
land values and the model reflects the economic impacts of climate change on agriculture in the CDZ.
5. The Regression Results
Table 1 presents the basic summary statistics of the dataset for the relevant variables of the study.
The average age of the household head is above 47 years and more than 65 % of the respondents have
followed secondary education. Households cultivate approximately 3.56 hectares of land and about
77% of the farmers reported to receive irrigation water. The average distance to the market is about
9.23 miles. Moreover, the data show that roughly about 78% of the farmers use draught cattle for
cultivation, which means that the majority of the farmers are cultivating crops in a traditional way.
In addition, above 80% of those farms apply compost and manure. Compost and manure are usually
by-products of livestock or crop production. The average household counts five people.
Table 1. Descriptive statistics: Variables for net revenue regression model.
Variables Mean Std.Dev
Net Revenue ($ ha−1 ) 554.969 204.815
Summer Temperature (◦ C) 29.061 2.571
Monsoon Temperature (◦ C) 28.166 2.363
Winter Temperature (◦ C) 22.381 2.405
Squared Summer Temperature (◦ C) 851.133 137.354
Squared Monsoon Temperature (◦ C) 798.946 122.998
Squared Winter Temperature (◦ C) 506.704 97.945
Summer Rain (mm) 82.942 32.145
Monsoon rain (mm) 163.562 46.753
Winter rain (mm) 11.347 4.037
Squared Summer Rain (mm) 7910.354 6710.132
Squared Monsoon rain (mm) 28,933.308 15,930.675
Squared Winter rain (mm) 145.025 98.063
Men headed household (1 = male, 0 = female) 0.77 0.419
Size of the cropping area (ha) 3.556 2.661
Farm practicing with draught cattle (1 = yes, 0 = no) 0.78 0.414
Distance to market (miles) 9.23 3.989
Farm with access to irrigation (1 = yes, 0 = no) 0.77 0.420
Farms practicing compose & Manure (1 = yes, 0 = no) 0.81 0.395
Age of the household head (years) 47.11 13.892
Size of the household (number) 5.64 1.946
Educational status of the household head (1 = secondary,
0.66 0.495
0 = less than secondary education)
We tested various regression specifications in order to capture the effect of climate variables
on different seasons on agriculture in the CDZ of Myanmar. Table 2 presents the resulted findings.
The table shows the Ordinary Least Squares (OLS) estimates of the determinants of net revenues per
hectare while using two models. Model 1 only take the marginal impacts of the seasonal temperature
and precipitation on farm net revenues into account, while model 2 also considers the socioeconomic
characteristics of farm households and farm-level adaptation measures. In Model 2, we exclude the
insignificant and collinearity associated seasonal temperature and precipitation measures from the
model 1. We find that the R2 was about triple from 0.15 when climate and socioeconomic characteristics
of farm household are used as in model 2, and thus the inclusion of the socioeconomic characteristics
is jointly significant and the model has strong explanatory power. Model 3 was additionally regressed
for the parsimonious estimation from the model 2. The test shows that the model was significant at the
1% level. Kurukulasuriya and Ajwad [15] mentioned that demeaning the climate variables does not
correct for the multicollinearity that is associated with the linear and quadratic variables. Therefore,Climate 2020, 8, 9 8 of 15
this study has followed the concepts on the Ricardian technique and the literature on the determinants
on farm net revenues.
Table 2. Determinants of net farm revenue per hectare ($ ha−1 ).
Model 3 (Parsimonious
Variables Model 1 Model 2
Model 2)
Summer Temperature (◦ C) −7.179 −13.325
Monsoon Temperature (◦ C) −7.917 −16.719
Winter Temperature (◦ C) 211.841 −12.178
Squared Summer Temperature (◦ C) −0.168 −0.917 + −0.220 ***
Squared Monsoon Temperature (◦ C) −1.392 ** 0.177
Squared Winter Temperature (◦ C) −3.871 −1.313
Summer Rain (mm) 4.894 −1.527
Monsoon rain (mm) −14.922 ** −0.636 + 0.468 *
Winter rain (mm) 92.761 −0.417
Squared Summer Rain (mm) −0.020 + −0.017 + −0.009 ***
Squared Monsoon rain (mm) 0.050 * 0.032
Squared Winter rain (mm) −4.421 −3.796
Men headed household (1 = male, 0 = female) 11.628
Size of the cropping areas (ha) −29.259 ** −23.390 *
Squared size of the cropping areas(ha) 2.060 ** 1.620 +
Educational status of the household head (1 =
51.809 * 50.466 **
secondary, 0 = less than secondary)
Farm practicing with draught cattle (1 = yes, 0 = no) 71.562 ** 54.408 **
Distance to market (miles) −2.155
Squared distance to market (miles) −0.327
Farm with access to irrigation (1 = yes, 0 = no) 190.988 *** 190.473 ***
Farms practicing compose & Manure (1 = yes, 0 = no) 62.140 ** 85.051 ***
Age (years) 2.086
Squared age (years) −0.016
Size of the household (number) 23.074
Squared size of household (number) −2.285 −0.493 +
Constant (Intercept) −214.337 129.845 517.641
Observation 425 425 425
R-Squared 0.156 0.471 0.438
F-test 8.515 * 16.221 *** 32.297 ***
+ Significant at 15%, * Significant at 10%; ** Significant at 5%; *** Significant at 1%.
In this study, a marginal impact analysis was conducted to assess the effect of a change in
temperature and rainfall on production of major crops. The coefficients that resulted from model 2
were used to estimate the marginal impacts of global warming on net revenues (see Table 2). Increasing
temperature in all seasons marginally decreases the crop revenue per ha, while increases in precipitation
in all seasons might lead to slight decreases or increases of crop revenue per ha. Therefore, the OLS
model implies that increases in temperature are generally harmful in all regions, but increases in
rainfall are basically beneficial, although changes of rainfall in the winter season would be harmful to
crop production.
In this study, a non-linear relationship between climate and net crop revenue is found, which is
consistent with the available literature [16,30,36]. In addition to the climate variables, this study has
found many interesting results that are related to farmers’ characteristics. Most of the household
variables have a significant impact on crop revenue. The size of the cropping areas negatively affects
crop net revenues, as the estimated coefficient of crop area suggests that there are increasing returns to
scale in farm size. This could be due to the fact that smallholder farmers with less than one hectare
of land dominate the agriculture in the dry zone [6,7]. In addition, shortage of farm land is one of
the barriers to the uptake of climate change adaptation strategies in the dry zone of Myanmar [37].
A similar result is observed in Kurukulasuriya and Ajwad [15] who stated that households that cultivateClimate 2020, 8, 9 9 of 15
a single crop are less profitable than households that plant multiple crops. Nevertheless, the quadric
term of size of the cropping area is likely to positively affect crop net revenue.
This study also considers the household head’s education. This could be seen as a proxy for the
ability of the households to adopt new technologies, and climate change adaptation measures that
are available at the farm-level. Farmers with middle school education have higher net crop revenue
per hectare than the farmers with a lower education level. It seems like farmers with middle school
education are more likely to adopt new technologies for the purpose of maximizing farm’ productivity.
However, this study did not directly consider the effect of the level education on the adoption of
new technologies at the farm-level. In addition, this study does not consider information about the
farmer’s experience and its effects on farm productivity. However, the age of the household head
was considered as a variable in the model. This study found that age of the household head affects
crop revenues in the setting of changing social and environmental conditions. The finding suggests
that an increase in age of household head is negatively affecting net revenue, but the relation was not
significant. In addition, no significant relation was found for the effects of the gender variable (men
headed household). In Myanmar, household members substitute paid labor on the farm. Interestingly,
this study did not find an effect of household size on farm profitability, as the available data do not
show a significant impact on net revenues. The distance to the market from the farm location is
also negative, but is insignificantly related with crop revenue. The quadric term of distance to the
market is negatively affects net revenues, but the effects seem to be small. Nevertheless, investing in
infrastructure development, such as road, is strongly recommended in the dry zone of Myanmar, as it
was also indicated in the findings of Belton et al. [19].
With the use of draught cattle and compost and manure has a positive and significant influence
on net revenues. Draught cattle help farmers in land preparation processes and enables farmers to
grow crops timely. The application of compost and manure (and green straw) is one of the climate
change adaptation measures of farm household in the region. It has a large and positive effect on the
net revenues of farm’ household in the study areas. The application of compost and manure improves
the soil fertility and structure and, therefore, increases crop productivity [38]. In the dry zone region,
access to dam irrigation rapidly increased since the mid-1970s. With irrigation, farmers have the
potential to obtain more income from farming [19]. This study also finds that farms with access to dam
irrigation have significantly higher net revenues. The results indicate that farms with access to irrigation
water are more profitable than farms that only relied on rain-fed agriculture. Rain-fed agriculture is
less profitable and, thus, productivity will even decrease in the changing climatic conditions in the
region. Under such conditions, access to irrigation water could enable farmers to avoid the risks that
are related to water scarcity at the farm and reduce the negative effects of increasing temperatures and
drought on crop net revenues. Therefore, investing in irrigation development and infrastructure could
enable farm households to grow more crops and to obtain more income from farming.
Predications of Forecasted Climate Scenario on Net Farm Revenue ($ per ha)
This study uses climate scenarios that are specific to Myanmar to analyze the impact on farm
profitability (see Table 3). The future climate change scenarios may have a significant effect on the
cropping patterns and crop productivity in the CDZ. Table 4 shows the effects of predicted changes
of temperature and precipitation on the net crop revenue per hectare (marginal value changes) over
the forecasted scenarios and Table 5 presents the estimated percentage changes. In this section,
the stimulated impacts of climate change projections for the Dry Zone of Myanmar were estimated.
As mentioned above, three climate change projection scenarios were used to stimulate the impacts
of climate change on Dry Zone’ agriculture in Myanmar: the PCM, CGCM3, and CSIRO scenarios.
The A2 emission scenario was used. Each model predict the temperature and precipitation until 2100,
assuming that greenhouse gas emissions continue unabated [15]. The likely impact of climate change
on economic or biophysical systems was analyzed by using future climate change scenarios from
climate change models [20,22,30]. In this study, future net revenues are calculated by multiplyingClimate 2020, 8, 9 10 of 15
the climate coefficients by the future climate. The previous analysis suggests that temperature and
precipitation have different effects on the net revenues in the Dry Zone.
Table 3. Projected changes in temperature and rainfall by three climate models.
Region Temperature (◦ C) Rainfall (mm)
Summer Monsoon Winter Annual Summer Monsoon Winter Annual
PCM
Value in 2020-39 0.97 0.68 0.77 0.81 −3 −1 −8 −4
Value in 2040-59 1.35 1.04 1.22 1.2 12.7 6.8 −5.6 4.6
Value in 2060-79 2.14 1.84 1.99 1.99 22 11 −5 9
Value in 2080-99 3.4 2.8 3 3 13 16 −14 5
CGCM3
Value in 2020-39 1.5 1.1 1.4 1.3 4.7 10.8 0.1 5.2
Value in 2040-59 1.9 1.8 1.9 1.8 9.3 20.8 1.9 10.7
Value in 2060-79 2.65 2.51 2.84 2.67 22.5 19 −1.2 13.4
Value in 2080-99 3.4 3.3 3.8 3.5 23.9 32.1 0.5 18.8
CSIRO
Value in 2020-39 1.5 1 0.8 1.1 −10.6 12.9 −3.2 −0.3
Value in 2040-59 2.2 1.7 1.6 1.8 −10.1 20.9 −2.2 2.9
Value in 2060-79 3.05 2.41 2.5 3.2 −11 22 −3 3
Value in 2080-99 4.5 3.3 3.2 3.7 −19 49 −3 9
Table 4. Marginal effect of temperature and precipitation on net revenue per hectare ($ ha−1 ).
Temperature Effects Rainfall Effects
Scenario Projection
Summer Monsoon Winter Summer Monsoon Winter
pcm20-39 −12.9253 −11.3689 −9.37706 4.581 0.436 3.336
pcm40-59 −17.99 −17.39 −14.86 −19.3334 −2.97261 2.328872
pcm60-79 −28.57 −30.84 −24.19 −33.0167 −4.88543 2.037754
pcm80-100 −45.9241 −46.0207 −36.6071 −19.4177 −6.7856 5.964477
cgcm3_20-39 −19.9875 −18.3909 −17.0492 −7.1769 −4.7088 −0.0417
cgcm3_40-59 −25.00 −29.35 −22.67 −14.2011 −9.0688 −0.7923
cgcm3_60-79 −35.33 −41.97 −34.62 −34.3306 −8.26326 0.493901
cgcm3_80-100 −45.7545 −55.3093 −45.8658 −36.5302 −13.9871 −0.19457
csiro_20-39 −19.9875 −16.719 −9.7424 16.1862 −5.6244 1.3344
csiro_40-59 −29.04 −28.61 −19.63 15.34708 −9.1094 0.929108
csiro_60-79 −40.62 −40.33 −30.40 16.04482 −9.80657 1.307409
csiro_80-100 −59.7436 −55.4882 −38.5124 29.41234 −21.4432 1.268073Climate 2020, 8, 9 11 of 15
Table 5. Climate predictions of Special Report on Emissions Scenarios (SRES) from 2020–2100 years.
Climatic Scenarios 2020–2039 2040–2059 2060–2079 2080–2099
Changes of temperature on crop net revenue (% changes)
Climate change
Summer Monsoon Winter Summer Monsoon Winter Summer Monsoon Winter Summer Monsoon Winter
model/Seasons
PCM −10.0 −8.8 −7.2 −13.9 −13.4 −11.5 −22.1 −23.8 −18.7 −35.5 −35.5 −28.3
CGCM3 −15.4 −14.2 −13.2 −19.3 −22.7 −17.5 −27.3 −32.4 −26.7 −35.3 −42.7 −35.4
CSIRO −15.4 −12.9 −7.5 −22.4 −22.1 −15.2 −31.4 −31.1 −23.5 −46.1 −42.9 −29.7
Changes of precipitation on crop net revenue (% changes)
Summer Monsoon Winter Summer Monsoon Winter Summer Monsoon Winter Summer Monsoon Winter
PCM 3.5 0.3 2.6 −14.9 −2.3 1.8 −25.5 −3.8 1.6 −15.0 −5.2 4.6
CGCM3 −5.5 −3.6 0.0 −11.0 −7.0 −0.6 −26.5 −6.4 0.4 −28.2 −10.8 −0.2
CSIRO 12.5 −4.3 1.0 11.9 −7.0 0.7 12.4 −7.6 1.0 22.7 −16.6 1.0Climate 2020, 8, 9 12 of 15
Temperature is predicted to increase in all seasons, according to the PCM model. A significant
marginal impact of increasing temperature on the net revenue of farm households was observed.
Thus, using the PCM climate model suggests that increasing temperatures will affect farm households
in the CDZ. If the temperature increases 2–4 ◦ C during the period 2060–2100, the likely impacts of
increasing temperature on crop net revenue will range from −18% to −35%. In the PCM climate model,
precipitation is projected to increase until 2070. However, precipitation is predicted to decrease again in
the last 20 years of the century (2080–2100), especially in the summer and winter seasons. In the winter
season, the crop net revenues could increase by 1.5% to 4.5% in the first period, but decreases of 5% to
25% in crop net revenue are also expected during the period 2060–2100. As stated by Kurukulasuriya
and Mendelsohn [30], climate change is not likely to be uniform with some areas getting dryer and
other wetter. This study indicates that the climate change scenarios by the PCM model were not
uniform. However, the PCM scenarios are relatively mild when compared to other climate scenarios,
such as CGCM3 and CSIRO.
In addition, the results from the CGCM3 climate model point out that increasing temperature
will have impacts on crop revenue of farmers in CDZ. However, temperature is predicted to slightly
decrease in the first quarter of the century, but it will increase again afterwards. Until 2050, there will be
not much change in net revenue, but a significant impact of increasing temperature on net revenue of
farm households in the last 40 years of century (2060–2100) was observed while using projections of the
CGCM3 climate model. According to the data resulting from the CGCM3 climate model, the negative
impacts on crop revenue by increasing temperatures range from 15% to 42%. Positive net revenues of
crops were observed by the projected increase in rainfall in winter season. However, a negative impact
of projected changes in the precipitation on crop net revenue was observed in summer (ranging from
5% to 28%) and monsoon seasons (ranging from 3.6% to 10%). These predictions more or less show the
magnitude and direction of future impacts on agriculture [20,24,30].
The CSIRO climate model was additionally formulated for understanding the trends and potential
impacts of a changing climate on crop revenues of farmers in CDZ. Temperature is predicted to be
stable until 2040, but it is projected to increase after that until 2100. Again, there will not be many
changes in net revenue until 2050, but a significant impact of increasing temperatures on net revenue of
farm households in the last 50 years of century was observed when using the CSIRO climate projections.
The CSIRO climate model projects the monsoon precipitation to increase until 2100. However, there will
not be much fluctuation in the precipitation in the winter and summer seasons. Farmers are expected
to receive positive net revenue from farming, due to the changes in precipitation in the summer
and winter season. In the monsoon season, a slightly negative impact on net revenue is predicted,
with changes from 4.3% to 16%. However, farm households will have a lower crop net revenue in all
seasons and changes are expected from 7.52% to 46% because of the projected changes in temperature.
Therefore, all of the models show that climate change will have serious impacts on crop production in
the CDZ.
6. Conclusions and Recommendations
This study examines the effects of climate change in different regions in the Dry Zone of Myanmar
on crop production, based on a cross-sectional analysis. The empirical results from this study showed
that the net revenue per hectare was sensitive to marginal changes in climate variables (temperature
and precipitation). The estimated coefficients from the OLS model were presented to show the effects
of climate change variables and farm’ household characteristics on crop net revenue. The prediction
of the impact of climate change on crop production is just an estimation of what would likely be the
impact on the economy of farm households, but it is not a prediction of what may actually occur in the
future. The crop net revenues per hectare of farm households in the CDZ were changed along with the
marginal changes in climate variables (temperature and precipitation). The results from the regression
analysis reveal that improving access to dam irrigation is necessary for the farmers to cultivate crops in
hard climatic conditions. Therefore, it is also recommended to invest in the development of irrigationClimate 2020, 8, 9 13 of 15
facilities in the region, so that irrigation water can be utilized from the purpose of development
of agriculture and rural areas. Moreover, improving access to markets would lessen the negative
impacts of climate change on agriculture. In addition, the application of recommended climate change
adaptation strategies, such as systemic utilization of manure or compost, could lead to an increase in
crop revenues.
The marginal effects of climate change on crop revenues suggest that climate change might have
very different effects on different farmers in CDZ. Predictions from the three global circulation models
confirm that global warming will have a substantial impact on the net crop revenue in the dry zone of
Myanmar. Overall, this paper suggests that there is a large range of impacts on agriculture in CDZ.
However, these results may be relatively biased by our net revenue specification, in which assumptions
were made regarding constant prices or full adaptation, or that does not take into account annual capital
cost, and family labor costs. In addition, the Ricardian model is not suited to identify the perceptions
of farmers on current climate conditions and their adoption of climate change adaptation strategies
in the future, as well as policy interventions and, thus, this study cannot predict if the agriculture in
CDZ of Myanmar might be changed in the near or mid-terms in the future. However, our study has
provided empirical based research findings from the perspective of climate change impact assessment
on farm incomes in dry zone of Myanmar. We can conclude that prevention is more effective than
treatment as the CDZ experiences the negative consequences of climate change and variability and,
thus, investment in agricultural research and rural development projects, such as integrated water
management projects, sustainable agriculture, and organic farming, is strongly encouraged, so that the
adaptive capacity of farmers can be increased and climate change vulnerability be reduced. In addition,
policy makers and development planners should articulate or implement climate change adaptation
measures and mitigation options to reduce the negative impacts of climate change on agriculture in
the Dry Zone of Myanmar.
Author Contributions: A.T.O. and S.S. conceived and designed the study; A.T.O. run the Ricardian model and
collected and analyzed all of the data. A.T.O. wrote the first draft of the paper, G.V.H. extensively reviewed the
article. S.S. and G.V.H. reviewed the paper and suggested valuable inputs as well as also provided partial funding
for research. All authors have read and agreed to the published version of the manuscript.
Funding: The corresponding author greatly acknowledges the World Wildlife Fund for nature (WWF) _Russell E.
Train Education for Nature Program (EFN) for the financial support during the first two years of PhD program
and grateful to the funding received from Ghent University in the final year of PhD program.
Acknowledgments: Heartfelt thanks to the farmers who were involved in the study. The authors would like to
express their sincere gratitude to the Department of Agriculture (DoA) in Magwe, Mandalay and Sagaing Region
for their support of the field survey and for providing required data used in this research article and for their
effective response. The authors would like to extend gratitude to Peter Bossier, Pieter De Frenne, Marijke D’Haese,
Brent Bleys and Myo Kywe for their time reading and reviewing this chapter of my PhD dissertation.
Conflicts of Interest: There is no conflict of interest as per the authors.
References
1. Asian Disaster Preparedness Centre (ADPC). Risk Assessment Roadmap, Myanmar. Technical Collaboration
with ADPC, Funded by UNICEF; Disaster Risk Assessment and Monitoring, Technical paper 2015.
Available online: https://www.google.com.hk/url?sa=t&rct=j&q=&esrc=s&source=web&cd=1&ved=
2ahUKEwi8ifHizfXmAhXPw4sBHXboCacQFjAAegQIAhAC&url=https%3A%2F%2Fwww.adpc.net%
2Figo%2Fcategory%2FID937%2Fdoc%2F2015-x1SFw3-ADPC-Myanmar_Risk_Assessment_Roadmap.
pdf&usg=AOvVaw1WRqvB7ZhNigeBmsHLlIFO (accessed on 14 October 2015).
2. Baroang, K. Myanmar Bio-Physical Characterization: Summary Findings and Issues to Explore; Background Paper
No. 1; Michigan State University: East Lansing, MI, USA, 2013; 56p, Available online: https://mdricesd.
wordpress.com/2013/05/30/background-paper-bio-physical-characterisation/ (accessed on 3 May 2013).
3. Regional Integrated Multi-Hazard Early Warning System (RIMES). Managing Climate Change Risks for Food
Security in Myanmar; Technical Reports; RIMES: Bangkok, Thailand, 2011.Climate 2020, 8, 9 14 of 15
4. Kerft, S.; Eckstein, D.; Junghans, L.; Kerestan, C.; Hagen, U. Global Climate Risk Index 2015, Who Suffers Most
from Extreme Weather Events? Weather-Related Loss Events in 2013 and 1994 to 2013; Think Tank & Research;
Germanwatch: Bonn/Berlin, Germany, 2014; Available online: https://germanwatch.org/en/cri (accessed on 1
December 2014).
5. Department of Meteorology and Hydrology (DMH). Presentation of Climate Change Made at the Monsoon
Forum Stakeholder Meeting Held during February 2011. Available online: http://www.dmh.gov.mm/
sites/default/files/articles/14-Brief-National%20Monsoon%20Forum-Myanmar%281%29.pdf (accessed on 4
October 2011).
6. World Food Programme (WFP). Food Security Assessment in the Dry Zone Myanmar; Prepared by Poe, C. A,
Food Security Analysis Services (ODXF); World Food Programme (WFP): Rome, Italy, 2011; Available online:
www.wfg.org (accessed on 2 February 2011).
7. World Food Programme (WFP). food security focus in dry zone, regional integrated multi-hazard early
warning system (RIMES). In Proceedings of the 9th Monsoon Forum, Nay Pyi Taw, Myanmar, 26 October
2012; Available online: www.wfg.org (accessed on 5 March 2013).
8. MES; MGS; MIMU; ADPC; DMH; Union of Myanmar; Hazard Profile of Myanmar (HPM). Institutional
Arrangements for Disaster Management in Myanmar; Ministry of Social Welfare, Relief and Resettlements,
the Republic of the Union of Myanmar: Naypyidaw, Myanmar, 2009. Available online: https://www.scribd.
com/document/244359911/Myanmar-Hazard-Profile-2009-July (accessed on 8 July 2009).
9. Japan International Cooperation Agency (JICA). The Development Study on Sustainable Agricultural and Rural
Development for Poverty Reduction Programme in the Central Dry Zone of the Union of Myanmar; Report No.
RDJR10-502; SANYU Consultants Inc.: Tokyo, Japan, 2010; Available online: https://www.lift-fund.org/sites/
lift-fund.org/files/uploads/Dry_Zone/JICA_Central_DZ_Report.pdf (accessed on 3 August 2010).
10. Ministry of Immigration and Population (MIP). The 2014 Myanmar Population and Housing Census; The
Union Report_Census Report Volume 2_C; UNFPA: New York, NY, USA, 2015; Available online: http:
//www.themimu.info/census-data (accessed on 13 July 2016).
11. Haggblade, S.; Boughton, D.; Denning, G.; Todd, R.K.; Cho, K.M.; Wilson, S.; Wong, L.C.Y.; Oo, Z.;
Than, T.M.; Mwee, N.E.; et al. A Strategic Agricultural Sector and Food Security Diagnostic for Myanmar;
Prepared for USAID/Burma; Michigan State University: East Lansing, MI, USA, 2013; 99p, Available online:
https://ideas.repec.org/p/ags/midiwp/161372.html (accessed on 1 July 2013).
12. Matsuda, M. Upland Farming Systems Coping with Uncertain Rainfall in the Central Dry Zone of Myanmar:
How Stable is Indigenous Multiple Cropping under Semi-Arid Conditions? Hum. Ecol. 2013, 41, 927–936.
[CrossRef]
13. Yi, T.; Hla, W.M.; Htun, A.K. Drought Conditions and Management Strategies in Myanmar; Report Prepared for
United Nations-Water; Department of Meteorology and Hydrology: Yangon, Myanmar, 2012; 9p. Available
online: www.ais.unwater.org/ais/pluginfile.php/597/mod_page/content/78/Myanmar.pdf (accessed on 21
October 2012).
14. International Fund for Agricultural Development (IFAD). Country Strategic Opportunities Programme; Republic
of the Union of Myanmar, 111th Section; International Fund for Agricultural Development (IFAD): Rome, Italy,
2014; Available online: https://webapps.ifad.org/members/eb/111/docs/EB-2014-111-R-6.pdf (accessed on 4
May 2014).
15. Kurukulasuriya, P.; Ajwad, M.I. Application of the Ricardian technique to estimate the impact of climate
change on smallholder farming in Sri Lanka. Clim. Chang. 2007, 81, 39–59. [CrossRef]
16. Mendelsohn, R.; Nardhaus, W.; Shaw, D. The impact of global warming on agriculture: A Ricardian analysis.
Am. Econ. Rev. 1994, 84, 753–771.
17. Mendelsohn, R.; Dinar, A. Climate, water, and agriculture. Land Econ. 2003, 79, 328–341. [CrossRef]
18. Japan International Cooperation Agency (JICA). Data Collection Survey on Agricultural Sector in the
Republic of the Union of Myanmar; Final Report; SANYU Consultants Inc.: Tokyo, Japan, 2013; Available
online: http://www.themimu.info/sites/themimu.info/files/documents/Assesst_Survey_on_Agriculture_
JICA_Dec2013.pdf (accessed on 10 December 2013).
19. Belton, B.; Filipski, M.; Chaoran, H.; Oo, A.T.; Htun, A. Rural Transformation in Central Myanmar: Results
from the Rural Economy and Agriculture Dry Zone Community Survey; Food Security Policy Project (FSPP),
Working Paper, MDI_CESD; Michigan State University: East Lansing, MI, USA, 2017; Available online:
www.foodsecuritylab.msu.edu (accessed on 3 July 2017).Climate 2020, 8, 9 15 of 15
20. Deressa, T.T.; Hassan, R.H. Economic Impact of Climate Change on Crop Production in Ethiopia: Evidence
from Cross-Section Measures. J. Afr. Econ. 2009, 18, 529–554. [CrossRef]
21. Seo, N.S.; Mendelsohn, R. A Ricardian Analysis of the Impact of Climate Change on South American Farms.
Chil. J. Agric. Res. 2008, 68, 69–79. [CrossRef]
22. Seo, N.S.; Mendelsohn, R.; Dinar, A.; Hassan, R.; Kurukulasuriya, P. A Ricardian analysis of the distribution
of climate change impacts on agriculture across agro-ecological zones in Africa. Environ. Res. Econ. 2009, 43,
313–332. [CrossRef]
23. Hertel, T.; Rosch, S. Climate change, agriculture, and poverty. Appl. Econ. Perspect. Policy 2010, 32, 355–385.
[CrossRef]
24. Deressa, T.T. Measuring the Economic Impact of Climate Change on Ethiopian Agriculture: Ricardian Approach;
World Bank Policy Research Paper No. 4342; World Bank: Washington, DC, USA, 2007.
25. Kurukulasuriya, P.; Rosenthal, S. Climate Change and Agriculture: A Review of Impacts and Adaptations; Climate
Change Series 91, Environment Department Papers; The World Bank: Washington, DC, USA, 2003; Available
online: http://hdl.handle.net/10986/16616 (accessed on 1 June 2013).
26. Sanghi, A. Global Warming and Climate Sensitivity: Brazilian & Indian Agriculture. Ph.D. Thesis, University
of Chicago, Chicago, IL, USA, 1998.
27. Kumar, K.; Parikh, J. Climate change impacts on Indian agriculture: The Ricardian approach. In Measuring
the Impact of Climate Change on Indian Agriculture; Dinar, A., Mendelsohn, R., Everson, R., Parikh, J., Sanghi, A.,
Kumar, K., Mckinsey, J., Lonergan, S., Eds.; World Bank Technical Paper No 402; The World Bank: Washington,
DC, USA, 1998.
28. Mendelsohn, R.; Basist, A.; Dinar, A.; Kurukulasuriya, P.; Williams, C. What explains agricultural performance:
Climate normal or climate variance? Clim. Chang. 2007, 81, 85–99. [CrossRef]
29. Blanc, E. The impact of climate change on crop yields in sub-Saharan Africa. Am. J. Clim. Chang. 2012, 1,
1–13. [CrossRef]
30. Kurukulasuriya, P.; Mendelsohn, R. A Ricardian Analysis of the Impact of Climate Change on African Cropland;
The World Bank: Washington, DC, USA, 2007; Available online: http://hdl.handle.net/10986/7508 (accessed
on 1 March 2008).
31. Ra, K. Water and Land Productivity Challenges in Myanmar. In Proceedings of the 21st International
Congress on Irrigation and Drainage, Tehran, Iran, 15–23 October 2011. ICID_Paper.
32. Cline, W. The Impact of Climate Change on Agriculture: Comment. Am. Econ. Rev. 1996, 86, 1309–1311.
33. Feenstra, R.C.; Markusen, J.A.; Rose, A.K. Understanding the Home Market Effect and the Gravity Equation:
The Role of Differentiating Goods; NBER Working Paper 6804; National Bureau of Economic Research:
Cambridge, UK, 1998.
34. Mendelsohn, R.; Tiwari, D. Two Essays on Climate Change and Agriculture: A Developing Country Perspective;
FAO Economic and Society Development paper 145; Food and Agriculture Organization of the United
Nations: Rome, Italy, 2000.
35. Seo, N.S.; Mendelsohn, R. Measuring Impacts and Adaptations to Climate Change: A Structural Ricardian
Model of African Livestock Management. Agric. Econ. 2008, 38, 151–165. Available online: http:
//hdl.handle.net/10986/4933 (accessed on 3 March 2012). [CrossRef]
36. Seo, N.S.; Mendelsohn, R.; Munasinghe, M. Climate change and agriculture in Sri Lanka: A Ricardian
valuation. Environ. Res. Econ. 2005, 10, 581–596. [CrossRef]
37. Tun Oo, A.; Huylenbroeck, G.V.; Speelman, S. Determining factors for the application of climate change
adaptation strategies among farmers in Magwe District, dry zone region of Myanmar. Int. J. Clim. Chang.
Strateg. Manag. 2017, 9, 36–55. [CrossRef]
38. Deressa, T.T. Assessment of the Vulnerability of Ethiopian Agriculture to Climate Change and Farmers’
Adaptation Strategies. Ph.D. Thesis, University of Pretoria, Pretoria, South Africa, 2010. Available online:
http://hdl.handle.net/2263/28969 (accessed on 24 October 2010).
© 2020 by the authors. Licensee MDPI, Basel, Switzerland. This article is an open access
article distributed under the terms and conditions of the Creative Commons Attribution
(CC BY) license (http://creativecommons.org/licenses/by/4.0/).You can also read