Impact of climate change on crop suitability in sub-Saharan Africa in parameterized and convection-permitting regional climate models - IOPscience
←
→
Page content transcription
If your browser does not render page correctly, please read the page content below
Environmental Research Letters

LETTER • OPEN ACCESS

Impact of climate change on crop suitability in sub-Saharan Africa in
parameterized and convection-permitting regional climate models
To cite this article: Sarah Chapman et al 2020 Environ. Res. Lett. 15 094086

View the article online for updates and enhancements.

                               This content was downloaded from IP address 46.4.80.155 on 16/10/2020 at 00:17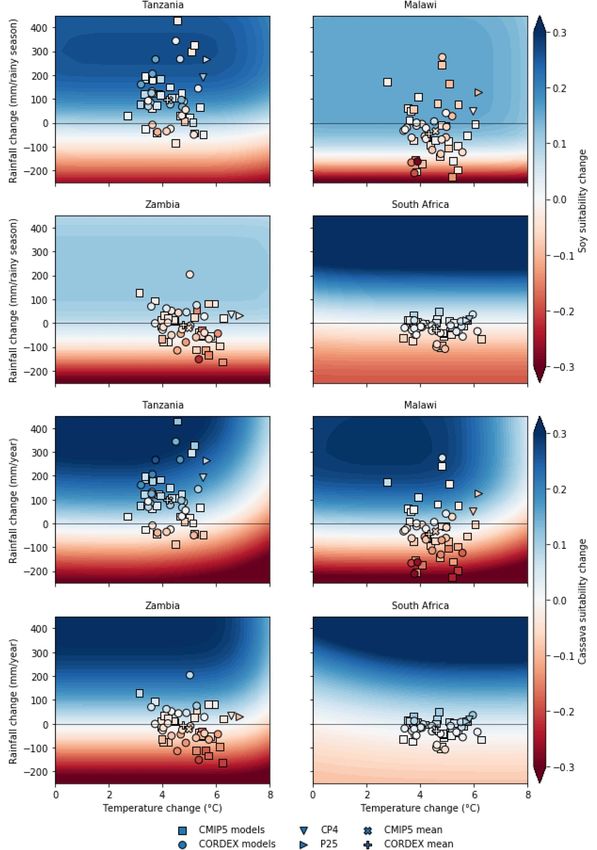
Environ. Res. Lett. 15 (2020) 094086 https://doi.org/10.1088/1748-9326/ab9daf
Environmental Research Letters
LETTER
Impact of climate change on crop suitability in sub-Saharan Africa
OPEN ACCESS
in parameterized and convection-permitting regional climate
RECEIVED
18 May 2020 models
ACCEPTED FOR PUBLICATION
17 June 2020 Sarah Chapman1, Cathryn E Birch1, Edward Pope2, Susannah Sallu1, Catherine Bradshaw2,3, Jemma Davie2
PUBLISHED and John H Marsham1,4
2 September 2020
1
School of Earth and Environment, University of Leeds, Leeds, United Kingdom
2
Met Office Hadley Centre, Exeter, United Kingdom
Original content from 3
this work may be used
The Global Systems Institute, University of Exeter, Exeter
4
under the terms of the National Centre for Atmospheric Science, United Kingdom
Creative Commons
Attribution 4.0 licence. E-mail: earsch@leeds.ac.uk
Any further distribution
of this work must Keywords: climate change, crop, Africa, CORDEX, CMIP5, convection-permitting
maintain attribution to
Supplementary material for this article is available online
the author(s) and the title
of the work, journal
citation and DOI.
Abstract
Due to high present-day temperatures and reliance on rainfed agriculture, sub-Saharan Africa is
highly vulnerable to climate change. We use a comprehensive set of global (CMIP5) and regional
(CORDEX-Africa) climate projections and a new convection-permitting pan-Africa simulation
(and its parameterized counterpart) to examine changes in rainfall and temperature and the
impact on crop suitability of maize, cassava and soybean in sub-Saharan Africa by 2100 (RCP8.5).
This is the first time an explicit-convection simulation has been used to examine crop suitability in
Africa. Increasing temperatures and declining rainfall led to large parts of sub-Saharan Africa
becoming unsuitable for multiple staple crops, which may necessitate a transition to more heat and
drought resistant crops to ensure food and nutrition security. Soybean was resilient to temperature
increases, however maize and cassava were not, leading to declines in crop suitability. Inclusion of
sensitivity to extreme temperatures led to larger declines in maize suitability than when this was
excluded. The results were explored in detail for Tanzania, Malawi, Zambia and South Africa. In
each country the range of projections included wetting and drying, but the majority of models
projected rainfall declines leading to declines in crop suitability, except in Tanzania.
Explicit-convection was associated with more high temperature extremes, but had little systematic
impact on average temperature and total rainfall, and the resulting suitability analysis. Global
model uncertainty, rather than convection parameterizations, still makes up the largest part of the
uncertainty in future climate. Explicit-convection may have more impact if suitability included a
more comprehensive treatment of extremes. This work highlights the key uncertainty from global
climate projections for crop suitability projections, and the need for improved information on
sensitivities of African crops to extremes, in order to give better predictions and make better use of
the new generation of explicit-convection models.
1. Introduction (Asafu-Adjaye 2014, IPCC 2014). For example, rising
temperatures will likely shorten the growing season
Sub-Saharan Africa is one of the most food insecure for current crop varieties in arid and semi-arid areas
regions in the world (FAO et al 2018). This is partly (Calzadilla et al 2013), while extreme temperatures
because agricultural yields, particularly maize, are low can damage crops, particularly if they occur at sens-
compared to other major producers such as the USA, itive points during development, such as flowering
China and Brazil (Cairns et al 2013). This region is (Teixeira et al 2013). Rainfall amount and variability
also highly vulnerable to climate change due to high also impacts crop yields (Lema and Majule 2009,
present-day temperatures combined with a reliance Rowhani et al 2011); however uncertainty in the sign
on rain-fed agriculture and low adaptive capacity and magnitude of rainfall projections (e.g. Rowell and
© 2020 The Author (s). Published by IOP Publishing Ltd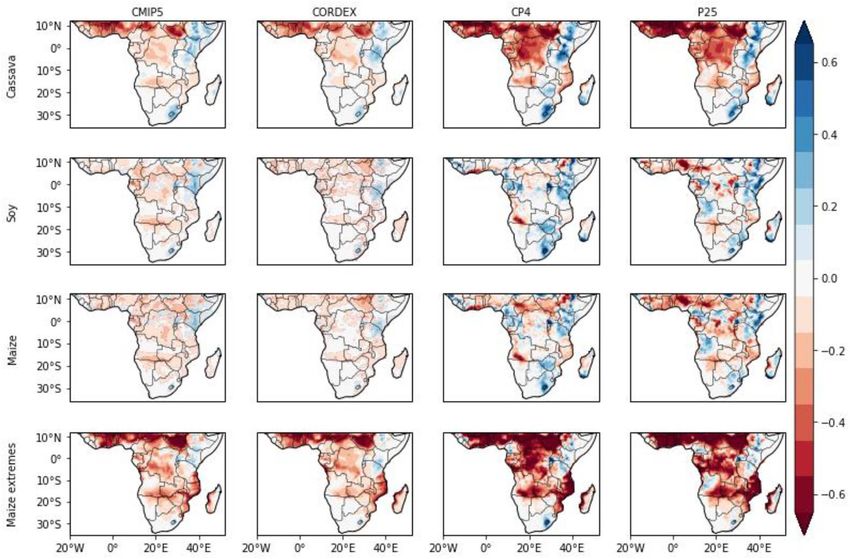
Environ. Res. Lett. 15 (2020) 094086                                                                    Sarah et al

Chadwick 2018, Kendon et al 2019) makes adapting               The convection-permitting RCM available for
to changing rainfall patterns challenging (Jones et al     Africa is known as CP4 A (4 kilometre resolution
2015).                                                     Pan-African Convection-Permitting Regional Cli-
     Previous work on climate change impacts for           mate Simulation with the Met Office Unified Model;
sub-Saharan African agriculture found that without         Stratton et al 2018). CP4 A has improved the rep-
adaptation, yields of most crops, including wheat,         resentation of regional rainfall in southern and west-
maize, and rice, are expected to decline in the second-    ern Africa (Hart et al 2018, Stratton et al 2018).
half of the century (Lobell et al 2008, Knox et al 2012,   Across Africa, CP4 A has similar biases in mean
Challinor et al 2014, Adhikari et al 2015, Serdeczny       rainfall to the parameterized configuration of the
et al 2017). However, much of this work used only a        same model, but demonstrates improved represent-
limited number of the available global climate mod-        ation of rainfall occurrence, intensity and extremes
els (GCMs), and impact assessments for sub-Saharan         (Stratton et al 2018, Finney et al 2019, Kendon et
Africa have only recently been derived from larger         al 2019). The improved representation of rainfall
GCM ensembles (Knox et al 2012, Zougmoré et al            characteristics holds the potential for improving our
2016, Dale et al 2017). Using a broad ensemble of cli-     understanding of climate impacts on agriculture in
mate models in impact assessments is necessary to          Africa.
avoid under-estimating the range of uncertainty in             This study explores projected end-of-century
climate projections (Hawkins and Sutton 2011) and,         (RCP8.5; Representative Concentration Pathway)
therefore, in projected crop yields.                       changes in climate suitability for maize, soybean and
     There has been limited work on agricultural           cassava in sub-Saharan Africa, with a focus on Tan-
impacts in Africa using regional climate mod-              zania, Malawi, Zambia and South Africa. We use
els (RCMs); however the CORDEX (COrdinated                 the CMIP5 (Coupled Model Intercomparison Pro-
Regional Downscaling EXperiment) project (Ker-             ject 5) GCM and CORDEX-Africa RCM ensembles
andi et al 2017, Lennard et al 2018) provides an           to evaluate whether GCMs and RCMs give differ-
effective source of regional climate model data for        ent results for crop suitability assessment. We also
impact assessments. Using RCMs helps to further            use one convection-permitting simulation (CP4 A),
explore key sources of uncertainty because they may        and its parameterized counterpart (P25) to highlight
respond differently to climate forcings than their         the differences between the results for convection
driving GCM, particularly for precipitation (Dosio         permitting and parameterized climate models. This
and Panitz 2016, Giorgi 2019). This occurs because         also allows us to see how the CP4 A model and its
the higher resolution of RCMs can improve the rep-         parameterized counterpart, P25, fit into the range of
resentation of smaller-scale processes and extremes        climate models already available. Maize and cassava
(Paeth and Mannig 2013, Diallo et al 2015, Gibba et al     were chosen for this study due to their importance
2018). The differences can be as large as a change in      as staple crops in the target countries, while soy-
the sign of projected precipitation changes (Saeed         bean was chosen as it may be an important climate-
et al 2013), which would significantly alter crop          resilient crop for Africa in the future (FAO 2019,
responses.                                                 Foyer et al 2019). All CMIP5 and CORDEX models
     The parameterization of deep convection in            use parametrisations for convection which intro-
GCMs and RCMs makes up a large part of the                 duce well established biases to rainfall characterist-
uncertainty in climate projections for tropical regions    ics (Stephens et al 2010). As such, although CP4 A
(Prein et al 2015). In contrast, convection-permitting     and P25 are regional models run for only one model
(i.e. explicit-convection) RCMs, are run at high           realisation of global change, the difference between
enough horizontal resolution to allow the deep con-        them gives unique insight into how the biases from
vection parameterisation to be switched off. This cap-     convection parametrisation affects crop suitability
ability represents a step-change in model perform-         analysis.
ance, potentially reducing key model uncertainties,
and has recently become available for Africa (Stratton
et al 2018). Convection-permitting models have been        2. Methods
shown to improve the representation of precipitation
and dry spells compared to parametrized convection         2.1. Model description
RCMs (such as those available through CORDEX),             This work uses a set of 28 bias-corrected CMIP5 GCM
which generally produce too widespread light rain-         simulations (Famien et al 2018), the CORDEX-Africa
fall and insufficient heavy rainfall (Prein et al 2015,    RCMs (Jones et al 2011), and a pair of RCM simu-
Kendon et al 2019). Convection-permitting models           lations; one convection-permitting (CP4 A) and one
can also improve representation of the West African        with parametrized convection (P25) (Stratton et al
Monsoon (Marsham et al 2013, Birch et al 2014b),           2018, Kendon et al 2019).
the Indian monsoon (Willetts et al 2017), and the              The CMIP5 models are described in Taylor
simulation of crop planting dates (Garcia-Carreras et      et al (2012). We use the GCM simulations which
al 2015).                                                  were bias-corrected as part of the AMMA-2050

                                              2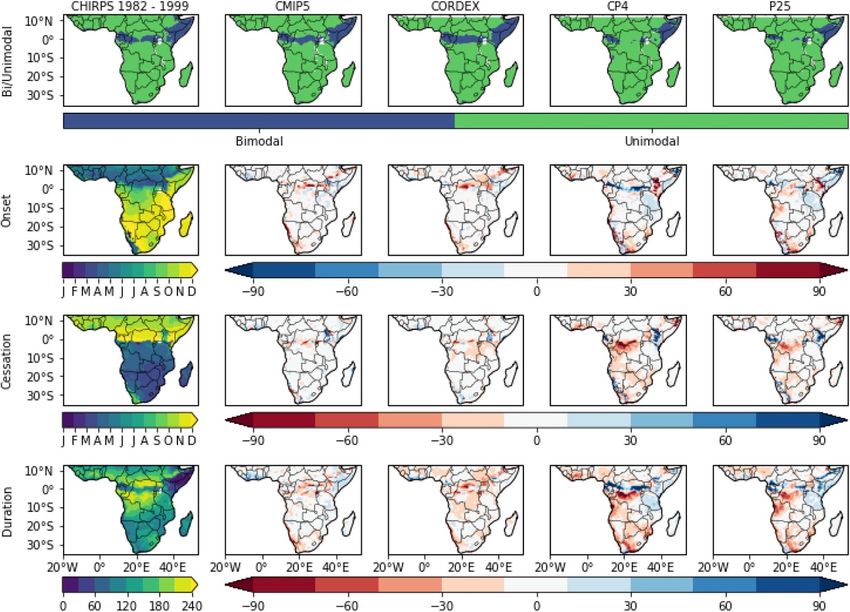
Environ. Res. Lett. 15 (2020) 094086                                                                     Sarah et al

(African Monsoon Multidisciplinary Analysis) pro-        CMIP5 models (except for the HadGEM models,
ject (Famien et al 2018), excluding the ACCESS1-         which finish in 2099) and 2097–2106 for CP4 A and
3 model due to issues with bias-correction (see          P25. While CP4 A and P25 cover different time peri-
supplementary material 2 (available online at            ods to CORDEX and CMIP5, there is a 100-year dif-
stacks.iop.org/ERL/15/094086/mmedia)).                   ference between the future and historical periods for
    The CORDEX-Africa model data are given at            all sets of models, and so we expect the changes to be
0.44◦ × 0.44◦ horizontal resolution and the multi-       similar.
model ensemble includes 6 RCMs with 11 different
GCMs providing initial and boundary driving con-         2.2. Bias correction
ditions. The matrix of GCM/RCM combinations is           As part of the AMMA-2050 project (Famien et al
presented in table 1.                                    2018), 29 of the CMIP5 GCM simulations were bias
    The CP4 A and P25 configurations of the MetUM        corrected to the EWEMBI reference dataset using a
(Met Office Unified Model) are both driven by an         cumulative distribution function transform (CDF-
N512 resolution (0.35◦ × 0.234◦ ) protoype version       t) method (Michelangeli et al 2009). EWEMBI is a
of the MetUM Global Atmosphere 7.0 (Kendon et al         merged dataset which includes longwave and short-
2019). CP4 A and P25 are atmosphere-only simula-         wave radiation from EartH2Observe and WFDEI,
tions and cover the pan–Africa region with a hori-       and ERA-Interim data (Lange 2018). The CMIP5 data
zontal grid-spacing at the equator of 4.5 × 4.5 km and   was first interpolated to a 0.5◦ x 0.5◦ grid using bilin-
26 km × 39 km, respectively (Stratton et al 2018). P25   ear interpolation. The CDF-t method was applied
has the same land surface as CP4 A, but there are key    to daily near-surface average, maximum, minimum
differences in the cloud and boundary layer schemes,     temperature, surface-downwelling shortwave radi-
while moisture conservation is applied in CP4 A but      ation, wind speed and specific humidity (Famien et
not P25 (Stratton et al 2018). Most importantly, in      al 2018). A different method was applied to rainfall,
CP4 A, convective clouds are explicitly represented      which corrects both rainfall occurrence and intens-
by model dynamics, whereas P25 uses the Edwards-         ity (Vrac et al 2016, Famien et al 2018). The list
Slingo convective parameterization (Stratton et al       of bias-corrected CMIP5 models used here are the
2018). For large-scale clouds, CP4 A uses the Smith      same as those listed in Famien et al (2018), excluding
scheme while P25 uses the PC2 scheme. Both models        ACCESS1-3.
use Wilson and Ballard for cloud microphysics (Strat-         Prior to estimating crop suitability, it was neces-
ton et al 2018). CP4 A uses a blended boundary layer     sary to bias-correct the daily mean temperature and
scheme, which transitions from the one-dimensional       rainfall diagnostics from the CORDEX, CP4 A and
vertical scheme of (Lock et al 2000), suitable for low   P25 simulations. We did not use the AMMA-2050
resolutions, to a three-dimensional turbulent mixing     bias-correction method due to its complexity and the
scheme based on Smagorinsky (1963). In the histor-       number of variables required. Temperature was bias-
ical period, both models are forced by sea surface       corrected using the linear scaling method described
temperatures (SSTs) from the Reynolds daily obser-       in Teutschbein and Seibert (2012) and the Climatic
vations (Reynolds et al 2007, Kendon et al 2019). For    Research Unit (CRU) TS4.03 reference dataset (Har-
future climate, the average SST change between 1975–     ris 2019, University of East Anglia Climatic Research
2005 and 2085–2115 in the HadGEM2-ES RCP8.5              Unit 2019). Rainfall amounts, rainfall intensity and
run is added to historical SSTs (Kendon et al 2019).     number of wet days were corrected using the local
This corresponds to a global mean SST increase of 4 K    intensity scaling method described in Fang et al
and a global mean 1.5 m air temperature change of        (2015) and the CHIRPS (Climate Hazards Group
5.2 K for the period of the future simulations (Kendon   InfraRed Precipitation with Station Data) v2.0 refer-
et al 2019). Further details on CP4 A and P25 are        ence dataset (Funk et al 2015). After bias-correction,
available in Stratton et al (2018) and Kendon et al      the seasonal mean temperatures of CORDEX, CP4 A
(2019).                                                  and P25 were within 0.1 ◦ C of CRU and seasonal
    For all models, we compare the ‘historical’          mean rainfall was within 1 mm/month of CHIRPS
period and the ‘business-as-usual’ end-of-century        rainfall in most areas. See supplementary material 2
RCP8.5 scenario. RCP8.5 was selected as it has           for further detail.
a strong climate change signal compared to nat-               Despite using a different reference dataset, the his-
ural climate variability, and is the only scenario       torical (1971–2000) average temperatures were very
for which CP4 A and P25 simulations are avail-           similar between the AMMA-2050 dataset and a sub-
able. Data for all models were regridded using area-     set of the CMIP5 models tested using our bias cor-
weighting to the bias-corrected CMIP5 0.5◦ x 0.5◦        rection method (< 0.1 ◦ C difference). The climate
grid.                                                    change temperature signal (magnitude and sign of
    The CORDEX-Africa and CMIP5 models use a             change) is also the same, as both methods use lin-
historical period of 1971–2000, whereas CP4 A and        ear scaling. The bias-correction method also has min-
P25 models use 1997–2006. The future time period         imal impact on the climate change signal for rain-
was from 2071–2100 for the CORDEX-Africa and             fall and rainy season duration (see supplementary

                                             3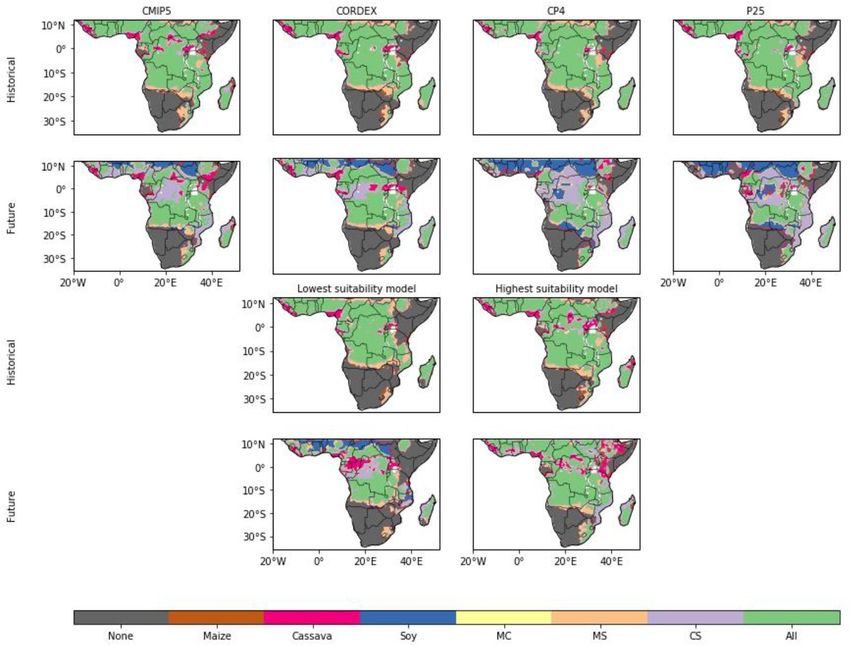
Environ. Res. Lett. 15 (2020) 094086

                                   Table 1. The GCM/RCM combinations available for CORDEX Africa for historical and future (RCP8.5) scenarios.

                                                                                                     RCM
    GCM                SMHI-RCA4           CLMcom-CCLM4-8-17               MPI-CSC or GERICS              KNMI-RACMO22 T                  DMI-HIRHAM5   CCCma-CanRCM4
                                                                           REMO2009

4
    HadGEM2-ES         X                   X                               X                              X
    EC-EARTH           X                   X                               X                              X                               X
    MPI-ESM-LR         X                   X                               X
    CNRM-CM5           X                   X
    MIROC5             X                                                   X
    CSIRO-Mk3-6-0      X
    IPSL-CM5 A-MR      X
    IPSL-CM5 A-LR                                                          X
    CanESM2            X                                                                                                                                X
    NOAA-GFDL-ESM2 M   X
    NorESM1-M          X
                                                                                                                                                                        Sarah et al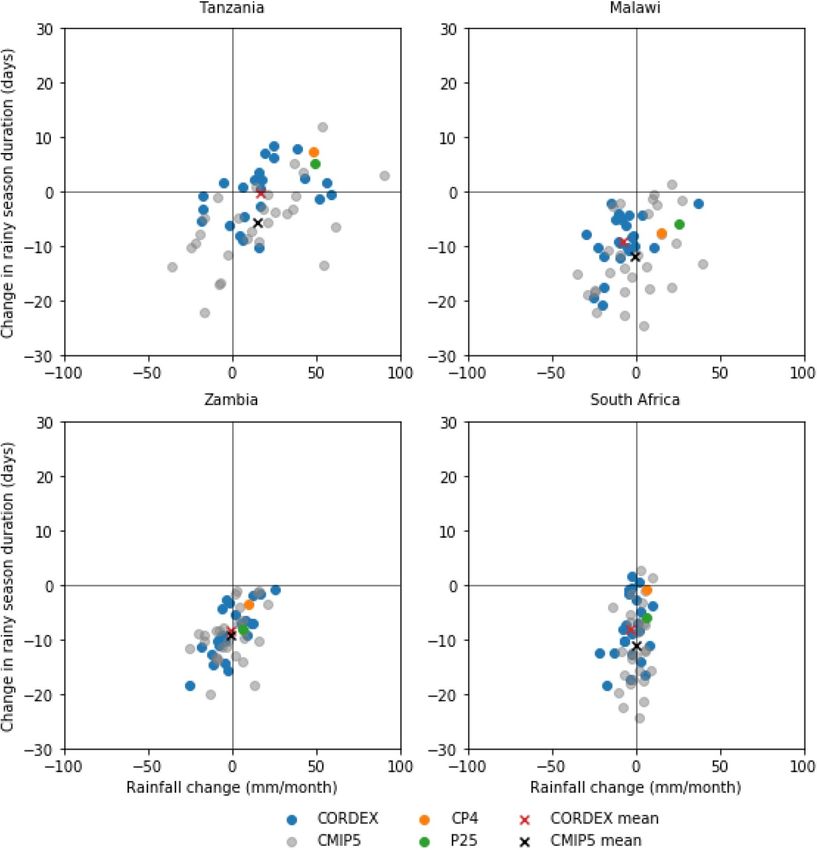
Environ. Res. Lett. 15 (2020) 094086 Sarah et al
material 2 for further comparison of the bias cor- 2.4. Crop suitability
rection methods). The difference in reference data- Crop suitability was estimated based on the EcoCrop
sets and bias correction methods between CMIP5 and method (Ramirez-Villegas et al 2013) using temperat-
CORDEX should therefore account for only a small ure and rainfall during the growing period to determ-
part of any differences in climate change impacts ine a suitability index that varies between 0 and 1.
between these sets of models across most of the study For soybean and maize, the rainy season defines the
area. growing period; cassava is perennial, meaning that the
entire year was used as the growing period.
2.3. Rainy season onset Total suitability was calculated by multiplying
The rainy season onset, cessation and duration were temperature and rainfall suitability (equation (1)),
estimated following the method of Dunning et al which are shown in equations (2) and (3).
(2016). We compared model and rainy season charac-
TotalSuitability = Tsuit ∗ RSuit (1)
teristics from the CHIRPS reference dataset (CHIRPS
compares well with other satellite observational data-
sets in most areas of Africa; Dunning et al 2016).
0 Tmean < Tabs_min
0 Tmean > Tabs_max
Tsuit = 1 Topt_min ≤ Tmean ≤ Topt_max (2)
1−
Topt_min +Tmean
Tabs_min ≤ Tmean < Topt_min
Topt_min −Tabs_min
1− Topt_max +Tmean
Topt_max −Tabs_max Topt_max < Tmean ≤ Tabs_max
0 Rtotal < Rabs_min
0 Rtotal > Rabs_max
Rsuit = 1 Ropt_min ≤ Rtotal ≤ Ropt_max (3)
1−
Ropt_min +Rtotal
Rabs_min ≤ Rtotal < Ropt_min
Ropt_min −Rabs_min
1− Ropt_max +Rtotal
Ropt_max −Rabs_max Ropt_max < Rtotal ≤ Rabs_max
where Tmean refers to mean growing season temper- on how they are affected by extreme temperatures.
ature and Rtotal refers to total growing season rainfall
(see figure 1). Topt_min , Topt_max , Tabs_min and Tabs_max TotalMaizeSuitability = MIN(Tsuit , Tmax_suit ) ∗ RSuit
refer to the optimal minimum and maximum tem- (4)
peratures, and the absolute minimum and maximum
temperatures (table 2). The optimal and absolute Tmax_suit = 100 − %ofgrowingseasonwithdailyTmean > 30◦ C
thresholds come from the FAO (Food and Agriculture (5)
Organization) EcoCrop database, which are based The optimum temperature threshold for maize
on literature and expert views on crops (Ramirez- was also set to 30 ◦ C rather than 33 ◦ C as in the Eco-
Villegas et al 2013) (table 2). For cassava, we also Crop database, for consistency with the daily temper-
tested the thresholds used by Rippke et al (2016), as ature threshold.
the maximum temperature threshold is 10 ◦ C higher See supplementary material 1 for a comparison of
than the FAO EcoCrop threshold (see supplementary the suitability scores estimated from climate model
material 1, figure S13). data for the historical period with the MIRCA2000
For maize, we included an additional constraint: (Monthly Irrigated and Rainfed Crop Areas) rainfed
the minimum of suitability due to mean temperature observational dataset (Portmann et al 2010).
or suitability due to extreme temperatures. Suitabil-
ity due to extreme temperatures was calculated from 2.5. Best and worst futures for crop suitability
the fraction of the growing season with daily average To present the average crop suitability as one met-
temperature above 30 ◦ C (equation (2)), and motiv- ric, we combined the suitability of maize (includ-
ated by the link between high temperatures and lower ing extremes), soy and cassava. For this, a grid cell
maize yield in Africa (Lobell et al 2011). We were was considered suitable for a crop if the suitability
unable to include sensitivity to extreme temperatures was ≥ 0.55, following the standard of using 0.5 as
for cassava and soybean due to a lack of information ‘marginal’ for crop growth (Ramirez-Villegas et al
5Environ. Res. Lett. 15 (2020) 094086 Sarah et al
Figure 1. Suitability curves for maize, soybean and cassava. Maize and soybean use total rainfall and average temperature during
rainy season, cassava uses annual data. Maize overall suitability uses the minimum of temperature suitability or percent of
growing season with daily average temperature > 30 ◦ C.
Table 2. Temperature and rainfall thresholds used in calculating crop suitability for soybean, maize and cassava. Thresholds came from
the FAO EcoCrop database (2007). Second set of cassava thresholds is from Rippke (2014) and Rippke et al (2016). Maize optimal
maximum temperature set to 30 ◦ C rather than 33 ◦ C for consistency with daily average temperature threshold.
Temperature (◦ C) Rainfall (mm/growing period)
Optimal Absolute Optimal Absolute
Crop Min Max Min Max Min Max Min Max
Soybean 20 33 10 38 600 1500 450 1800
Cassava 20 29 10 35 1000 1500 500 5000
Cassava Rippke 22 32 15 45 800 2200 300 2800
Maize 18 30 10 47 600 1200 400 1800
2013). In order to show the variation in future crop long. The CP4 A and P25 rainy seasons are similar
suitability across the different climate models, we to each other, showing that explicit-convection gives
also identified the models with the ‘best’ and ‘worst’ little to no improvement over parameterized convec-
futures for crop growth, out of the full model set tion for describing broad rainy season characterist-
(CMIP5, CORDEX, CP4 A and P25). For this assess- ics. For both CP4 A and P25, the rainy season tends
ment we counted the number of grid cells where each to be too short, except in Tanzania. The underestim-
crop had a suitability ≥ 0.55. The models with the ated rainy season duration in CP4 A and P25 com-
highest and lowest suitability counts respectively were bined with overestimated seasonal rainfall suggests
considered the ‘best’ and ‘worst’ futures. that rainfall intensity during the rainy season is higher
than in CHIRPS. Kendon et al (2019) found a similar
3. Results result when examining CP4 A and P25 rainy season
rainfall intensity.
3.1. Rainy season
Even after bias-correction, there are still areas of mis- 3.2. Climate change impact
match between the models and CHIRPS rainy sea- For end-of-century rainfall, the CMIP5 and COR-
son characteristics, with all models having difficulty DEX ensemble means show a projected increase near
in capturing the observed border between the unim- the equator and a decrease in more southerly areas
odal and bimodal areas. The bias-corrected ensemble (figure 3). This is consistent with a slower south-
mean of CMIP5 performs best, which may be partly ward retreat of the tropical rain belt in northern-
due to the more extensive bias-correction used in the hemisphere autumn (Dunning et al 2018). The per-
AMMA2050 project. centage change in rainfall is similar for both the
Figure 2 also shows that the CORDEX ensemble CMIP5 and CORDEX ensemble means, except in the
mean rainy season duration tends to be too short. Congo; however, this is also an area of model dis-
South of the equator this is due to early cessation; agreement, as shown by the stippling in figure 3. The
north of the equator it is mainly due to late onset, pattern of rainfall change is also similar in CP4 A
i.e. the tropical rain belt stays too far south for too and P25 for 2097–2106, with both showing rainfall
6Environ. Res. Lett. 15 (2020) 094086 Sarah et al
Figure 2. Bimodal/unimodal rainfall classification (first row) and difference (in days) between average onset, cessation and
duration of the rainy season in CHIRPS and the bias-corrected ensemble mean of CMIP5 and CORDEX and the CP4 A and P25
models. In bimodal areas data from the short rains (October–December) are used (supplementary material 1 shows equivalent
using March–May). CORDEX and CMIP5 data from 1982–1999 compared to CHIRPS data from 1982–1999. CP4 A and P25 data
from 1998–2005 compared to CHIRPS data from 1998–2005. All data regridded to 0.5◦ x 0.5◦ .
increases across most of the study area during the (figure 4). Relative to the spread in projections for
rainy season. Bias correction had a minor impact the set of CORDEX and CMIP5 models, the future
on the results for the dry season (supplementary rainfall changes produced by CP4 A and P25 are fairly
material 2). similar to each other. The magnitudes of the future
The CP4 A and P25 temperature projections are rainfall increases in CP4 and P25 are higher than
broadly similar and show larger increases than the for those CORDEX RCMs driven by HadGEM2-ES.
CMIP5 and CORDEX ensemble mean (figure 3). P25 This is not unexpected since, although CP4 and P25
and CP4 A temperature and rainfall changes are, how- receive SSTs from HadGEM2-ES, their atmospheric
ever, within the ensemble member range for temper- boundary conditions are provided by a different con-
ature and rainfall in the focus countries (figure 4). figuration of the Met Office Unified Model, of which
Climate change impacts on rainy season charac- HadGEM is one variant.
teristics were similar for the CORDEX and CMIP5
ensemble means, with the mean onset of the rainy 3.3. Crop suitability
season being later by up to 2 weeks across most of Crop suitability was calculated using the bias-
sub-Saharan Africa, and little change in cessation corrected climate model data for both the histor-
dates (< 2 weeks) (supplementary material, figure S2 ical and future periods. Figure 5 shows the com-
and S3) leading to declines in rainy season duration. bined suitability of all three crops. In the historical
This occurred even in areas where seasonal rain- period, most areas north of 20◦ S, except the Horn
fall increased, suggesting some increases in rainfall of Africa (HOA), were suitable for all three crops
intensity and/or frequency during the rainy season— (figure 5). Future declines in suitability were primar-
see Dunning et al (2018) for more details on projected ily driven by reductions in rainfall (supplementary
changes in rainy season characteristics for the CMIP5 material, figures S5–S7). Most countries across Africa
ensemble. are presently within the optimal temperature range
For the CMIP5 and CORDEX models, the for all three crops, meaning that the suitability is rel-
ensemble mean projected change in rainfall is often atively insensitive to small changes in mean temper-
close to zero, obscuring large differences between ature. As such, projected temperature increases led
the individual model responses to climate change to no change or increases in suitability for soybean,
7Environ. Res. Lett. 15 (2020) 094086 Sarah et al
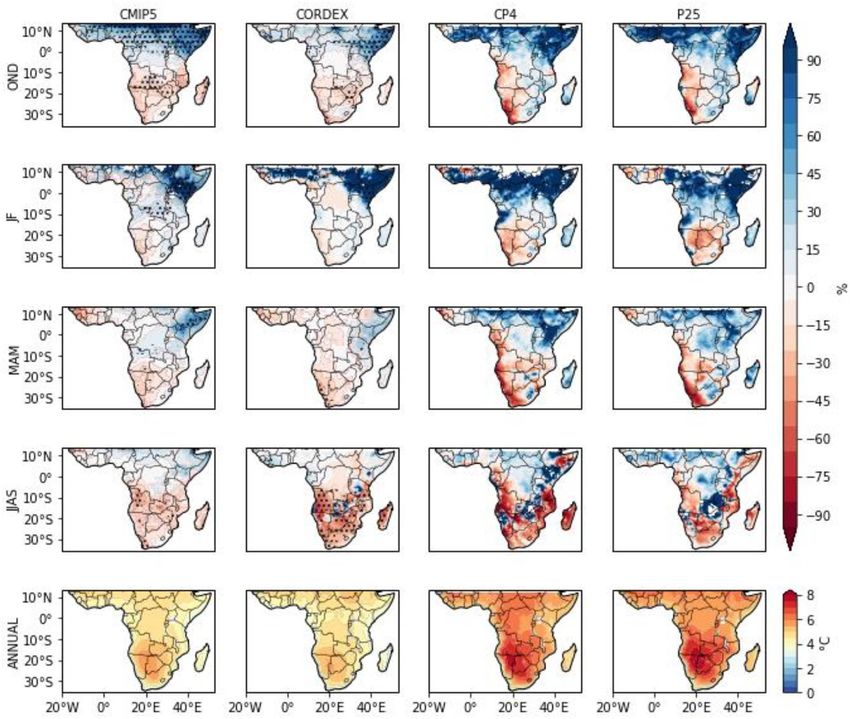
Figure 3. Percentage change in seasonal rainfall with climate change (i.e. 100% × (Future/Historical–1) for the bias-corrected
CMIP5 ensemble, CORDEX ensemble CP4 A and P25 data and annual change in near-surface air temperature. Historical and
future periods for CMIP5 and CORDEX data are 1971–2000 and 2071–2100 respectively, historical and future periods for CP4 A
and P25 data are 1997–2006 and 2097–2106 respectively. Stippling shows areas where over two-thirds of models (> 15 for
CORDEX, > 18 for CMIP5) agree on sign of change. No stippling is shown for temperature plot as all models show increasing
temperatures. OND = October, November, December. JF = January, February. MAM = March, April, May. JJAS = June, July,
August, September. All data regridded to 0.5◦ x 0.5◦ .
and reduced suitability for maize and cassava near the 3). Maize suitability was also very sensitive to the
equator. Crop suitability increases occurred only in inclusion of the number of days above 30 ◦ C (fig-
South Africa, due to present-day temperatures being ure 6 and table 3), showing the importance of
too low for all three crops. accounting for extremes in suitability. For example,
More generally, the projected changes in maize when temperature extremes were included, most
and soybean suitability are similar (when extremes countries became unsuitable for growing maize;
are excluded) because their thresholds are similar (fig- when excluded, large parts of sub-Saharan Africa
ure 6). Therefore, the difference in soybean and maize remained suitable for maize at the end of the cen-
suitability shown by figure 5 largely reflects the inclu- tury. Despite CP4 A having slightly higher increases
sion of extreme temperatures for maize. in extremes than P25, reductions in maize suit-
By the end of century, non-HOA bimodal areas ability were larger in P25 due to more wide-
in CORDEX models show higher suitability for spread declines in rainfall (supplementary material,
cassava than soybean and maize. This is because figure S7).
the total rainfall in the individual rainy seasons Focussing on the four countries of interest, we
was too low to meet cassava’s requirements. How- find that most individual models projected declines
ever, these suitable areas are mostly in the Congo in suitability within Zambia and Malawi for soybean
which, while climatically suitable, is predominantly and cassava (figure 7, see also supplementary material
rainforest. figures S8–S12 for individual model soybean results).
By the end-of-century, there were reductions in In Tanzania, soybean suitability changes were closely
the total area with high suitability (i.e. suitabil- related to changes in rainfall, more so for CORDEX
ity ≥ 0.8) for maize, soybean and cassava (table models than CMIP5 models. CORDEX models that
8Environ. Res. Lett. 15 (2020) 094086 Sarah et al
Figure 4. End-of-century climate change impact on rainy season duration and amount of rainfall for each focus country during
main rainy season months (RCP8.5—historical) for bias-corrected CMIP5 models and bias-corrected CORDEX, CP4 A and P25.
For Tanzania, the main rainy season months (October—November, and March—May) are combined. For all other countries the
rainy season is defined as November—April. Historical and future periods for CMIP5 and CORDEX data are 1971–2000 and
2071–2100 respectively, historical and future periods for CP4 A and P25 data are 1997–2006 and 2097–2106 respectively.
Table 3. Percentage decrease in the number of grid cells classified as highly suitable (suitability ≥ 0.8) for crops with climate change
(RCP8.5) for CMIP5 and CORDEX ensemble mean, CP4 A and P25. Any decline refers to any decline in suitability in highly suitable
areas. Declines > 0.4 refers to highly suitable areas where suitability changed by more than 0.4.
Crop CMIP5 CORDEX CP4 A P25
Cassava Any decline 84 84 91 92
Declines > 0.4 13 9 35 34
Soybean Any decline 68 65 50 60
Declines > 0.4 4 3 3 7
Maize Any decline 94 92 98 98
Declines > 0.4 38 33 67 71
Maize (no extremes) Any decline 81 77 82 89
Declines > 0.4 4 3 5 11
projected rainfall declines in Tanzania, or only small ensemble mean of annual future climate had lower
increases in rainfall, had declines in soy suitability. declines in average crop suitability than individual
Interannual climate variations contribute to over- models, particularly in Malawi (figure 7 suitability
all declines in average crop suitability. The CORDEX contours). Individual models had larger interannual
9Environ. Res. Lett. 15 (2020) 094086 Sarah et al
Figure 5. Combined crop suitability in historical and future periods for bias-corrected ensemble mean of CMIP5 and CORDEX
models, and CP4 A and P25. Historical and future periods for CMIP5 and CORDEX data are 1971–2000 and 2071–2100
respectively, historical and future periods for CP4 A and P25 data are 1997–2006 and 2097–2106 respectively. Maize suitability
includes sensitivity to extreme temperature. Crop shown as suitable if average suitability in the grid cell over the time period
(historical or future) ≥ 0.55. Lowest and highest suitability model refer to the model out of the full set (CMIP5, CORDEX, CP4
and P25) which scored lowest and highest for future total suitability. Highest future suitability model = BNU-ESM, lowest future
suitability model = HadGEM2-ES CCLM4. MC = Maize and cassava, MS = Maize and soybean, CS = Cassava and soybean. All
data regridded to 0.5◦ x 0.5◦ .
rainfall and temperature variability than the ensemble rainfall increases and decreases. Ensemble mean rain-
mean (CORDEX ensemble mean rainfall and tem- fall, however, decreased in the focus countries, lead-
perature standard deviation = 46 mm/year, 0.2 ◦ C, ing to reduced crop suitability. In Tanzania and
standard deviation for individual models ranged South Africa, models simulating decreased rainfall,
from 152–238 mm/year, 0.5–0.8 ◦ C). Of the COR- or only small increases in rainfall, showed decreased
DEX models, CanESM2_CanRCM4 had the highest crop suitability, while the models simulating large
rainfall increases for Malawi. Despite overall rainfall increases in rainfall showed increased suitability. In
increases in this model, the high frequency of low Zambia and Malawi, models with overall increasing
rainfall years led to lower average crop suitability, par- rainfall showed reduced suitability because of annual
ticularly in southern Malawi. Soybean appears more variability in rainfall. CMIP5 and CORDEX gave
vulnerable to this than cassava, despite having a lower similar crop suitability results, which suggest these
absolute rainfall threshold, perhaps because soybean results are robust to differences in bias-correction
suitability is calculated from rainy season rainfall, methods.
whereas cassava suitability is based on total annual The reductions in crop suitability across large
rainfall. parts of sub-Saharan Africa found here are consist-
ent with previous work showing projected reduc-
tions in yields of tropical during the second-half
4. Discussion and conclusions of the century (Challinor et al 2014, Rippke et al
2016, Serdeczny et al 2017) and that including the
We used bias-corrected CMIP5, CORDEX, CP4 A impact of extreme events leads to larger reductions
and P25 climate model simulations to examine the in crop suitability with climate change (Mangani et
impact of climate change on the crop suitability of al 2019). However, the results presented here are also
maize, soybean and cassava in sub-Saharan Africa. dependent on the specific thresholds used to calcu-
For many locations the model ensemble shows both late the suitability for each crop, highlighting a key
10Environ. Res. Lett. 15 (2020) 094086 Sarah et al
Figure 6. End-of-century change in crop suitability with RCP8.5 of soybean, cassava and maize in bias-corrected CMIP5,
CORDEX, CP4 A and P25 models, relative to the historical period. Historical and future periods for CMIP5 and CORDEX data
are 1971–2000 and 2071–2100 respectively, historical and future periods for CP4 A and P25 data are 1997–2006 and 2097–2106
respectively. Change in maize suitability shown with and without extreme temperature. Change in suitability in bimodal areas is
the average of change in both seasons. All data regridded to 0.5◦ x 0.5◦ .
challenge in identifying robust adaptation decisions season, as this was calculated using daily data and
particularly at small spatial scales. For example, if not long-term averages. However, the bias-corrected
cassava is only as heat tolerant as suggested by CP4 A had similar rainy season characteristics and
the EcoCrop database (absolute maximum temper- projected rainfall changes to the bias-corrected P25
ature threshold of 35◦ ), some cassava areas may parameterized-convection counterpart simulation.
have to transition to more heat resistant variet- Therefore, while CP4 A did not improve on the rep-
ies by the end of the century. In contrast, if cas- resentation of the rainy season over P25, it contrib-
sava’s heat tolerance is as high as suggested by utes to the robustness of the results provided by the
Rippke et al (2016), it may remain a viable crop in global and regional models, by showing convection-
most areas of sub-Saharan Africa at the end of the permitting models give results within the range of
century. results from those models. The differences between
To our knowledge, this is the first crop suitab- CP4 A and P25, may translate to the differences that
ility assessment that uses a convection-permitting could be expected between convection-permitting
climate model. CP4 A and P25 gave similar crop and parameterized versions of other regional models.
suitability results, and the difference between them These results suggest that GCM uncertainty, rather
was small compared to the spread in the COR- than convection parameterizations, still makes up the
DEX and CMIP5 ensembles. Most added-value from largest part of the uncertainty in projecting future
convection-permitting models comes from small changes to crop suitability. However, had it been
scales and extreme values (Prein et al 2015), and possible to include extremes more comprehensively
so averaging over large areas and long time peri- in the suitability analysis (requiring other Africa-
ods may eliminate some of the added value from specific crop thresholds), the results for CP4 A and
convection-permitting models. However, previous P25 may have been more different, since CP4 A
work has found that convection-permitting mod- has both higher increases in rainfall extremes and
els can provide a more accurate representation of dry spells with climate change than P25 (Kendon
regional climates and improve on biases present in the et al 2019). For this reason, future convection-
driving global model (Marsham et al 2013, Birch et permitting models may be more useful in agricul-
al 2014a, Willetts et al 2017, Hart et al 2018, Strat- tural impact assessments that incorporate the impact
ton et al 2018). In this study, CP4 A had the potential of extreme daily rainfall and length of dry spells on
to improve the most on representation of the rainy crops.
11Environ. Res. Lett. 15 (2020) 094086 Sarah et al
Figure 7. Future climate change impact on mean rainfall, temperature and soybean and cassava suitability (RCP8.5—present) for
bias-corrected CMIP5, CORDEX, CP4 A and P25 (maize not shown as three metrics are used in the calculation), relative to the
historical period. Historical and future periods for CMIP5 and CORDEX data are 1971–2000 and 2071–2100 respectively,
historical and future periods for CP4 A and P25 data are 1997–2006 and 2097–2106 respectively. The contours show the change in
suitability as a function of the CORDEX ensemble mean for temperature and rainfall. Colours (for markers and contours) show
the change in suitability.
There are also several important caveats to con- model, in this case focussing only on how total rain-
sider in interpreting the results presented here. First, fall and mean temperature impact crop suitability.
the EcoCrop model is a simple crop suitability Second, we only considered the impact of extreme
12Environ. Res. Lett. 15 (2020) 094086 Sarah et al
temperatures for maize, due to a lack of documented Acknowledgments
Africa-specific crop thresholds. Including sensitivity
to high temperatures had a large, negative impact This work was supported by the Biotechnology and
on future maize suitability, which suggests that the Biological Sciences Research Council through UK
future suitability for soybean and cassava could be Research and Innovation as part of the Global Chal-
similarly over-estimated. Third, the analysis does not lenges Research Fund, AFRICAP programme, Grant
account for other factors such as soil moisture and Numbers BB/P027784/1. Marsham was funded by
evapotranspiration or non-climatic factors such as HyCRISTAL, IMPALA and the NCAS ACREW pro-
soils, pests and diseases, which will constrain suitabil- gramme. We would also like to thank Caroline Wain-
ity more than shown here (Piikki et al 2015). Fourth, wright for the use of her rainy season onset code.
we did not consider the impact of climate change
on cassava toxicity, which increases during droughts, Data availability statement
particularly when combined with high temperatures
(Bokanga et al 1994, Burns et al 2010, Oluwole 2015, The data that support the findings of this study are
Brown et al 2016). Finally, we did not explicitly con- available upon reasonable request from the authors.
sider adaptation options, such as changing variet-
ies, irrigation or crop management which could res- ORCID iD
ult in yields 7%–15% higher than without adapta-
tion according to some models (Challinor et al 2014). Sarah Chapman https://orcid.org/0000-0002-
However, our analysis used rainfall and temperature 3141-8616
during the rainy season, the timing of which varied
between the present and future—this can be effect- References
ively viewed as allowing planting dates to vary with
climate change. Adhikari U, Nejadhashemi A P and Woznicki S A 2015 Climate
change and eastern Africa: a review of impact on major
Despite these caveats, the key benefit of using the
crops Food Energy Secur. 4 110–32
EcoCrop model is that it is transparent and straight- Asafu-Adjaye J 2014 The economic impacts of climate change on
forward to apply, the amount of data needed is lim- agriculture in Africa J. Afr. Econ. 23 ii17–49
ited, and we have greater confidence in both obser- Birch C E, Marsham J H, Parker D J and Taylor C M 2014a The
scale dependence and structure of convergence fields
vations and model representations of temperature
preceding the initiation of deep convection Geophys. Res.
and rainfall than in soil moisture or evapotranspir- Lett. 4769–76
ation (Ramirez-Villegas et al 2013, Myeni et al 2019). Birch C E, Parker D J, Marsham J H, Copsey D and
Despite its simplicity, the climate change impacts of Garcia-Carreras L 2014b A seamless assessment of the role
of convection in the water cycle of the West African
EcoCrop are consistent with the results found using
Monsoon J. Geophys. Res. 119 8245–67
more complex crop models (Ramirez-Villegas et al Bokanga M, Ekanayake I J, Dixon A G O and Porto M C M 1994
2013). Genotype-environment interactions for cyanogenic
Given the crops we examined are drought and potential in cassava Acta Hortic. 375 131–40
Brown A L, Cavagnaro T R, Gleadow R and Miller R E 2016
heat tolerant, we expect similar or greater reduc-
Interactive effects of temperature and drought on cassava
tions in suitability for other crops. However more growth and toxicity: implications for food security? Glob.
drought and heat tolerant crops may do better. There Change Biol. 22 3461–73
were fewer suitable areas for crop growth in the Burns A, Gleadow R, Cliff J, Zacarias A and Cavagnaro T 2010
Cassava: the drought, war and famine crop in a changing
future in the CORDEX ensemble than in the CMIP5
world Sustainability 2 3572–607
ensemble, mainly due to differences in rainfall. Over- Cairns J E, Hellin J, Sonder K, Araus J L, Macrobert J F, Thierfelder
all, however, the ensemble mean suitability change in C and Prasanna B M 2013 Adapting maize production to
CORDEX and CMIP5 was similar, as was the inter- climate change in sub-Saharan Africa Food Secur. 5 345–60
Calzadilla A, Rehdanz K, Betts R, Falloon P, Wiltshire A and Tol R
model spread. This intermodal spread was far greater
S J 2013 Climate change impacts on global agriculture Clim.
than the difference between the pair of convection- Change 120 357–74
permitting simulations that were driven by the same Challinor A J, Watson J, Lobell D B, Howden S M, Smith D R and
GCM, showing that the difference between GCMs Chhetri N 2014 A meta-analysis of crop yield under climate
change and adaptation Nat. Clim. Change 4 287–91
is more important than the within-model setup
Dale A, Fant C, Strzepek K, Lickley M and Solomon S 2017
when considering sub-Saharan African crop suitab- Climate model uncertainty in impact assessments for
ility. Reducing this model uncertainty is necessary to agriculture: a multi-ensemble case study on maize in
be able to project with confidence the impact of cli- sub-Saharan Africa Earth’s Future 5 337–53
Diallo I, Giorgi F, Sukumaran S, Stordal F and Giuliani G 2015
mate change on crop suitability. Most benefits from
Evaluation of regCM4 driven by CAM4 over Southern
RCMs and convection-permitting models over GCMs Africa: mean climatology, interannual variability and daily
are realised when considering climate extremes. To extremes of wet season temperature and precipitation Theor.
make better use of the next generation of climate Appl. Climatol. 121 749–66
Dosio A and Panitz H J 2016 Climate change projections for
models, more information on the impact of extremes
CORDEX-Africa with COSMO-CLM regional climate
on crop suitability and ways to include this are model and differences with the driving global climate
needed. models Clim. Dyn. 46 1599–625
13Environ. Res. Lett. 15 (2020) 094086 Sarah et al
Dunning C M, Black E and Allan R P 2018 Later wet seasons with East Africa: a case study for the Tana River basin in Kenya
more intense rainfall over Africa under future climate Theor. Appl. Climatol. 130 401–18
change J. Clim. 31 9719–38 Knox J, Hess T, Daccache A and Wheeler T 2012 Climate change
Dunning C M, Black E C L and Allan R P 2016 The onset and impacts on crop productivity in Africa and South Asia
cessation of seasonal rainfall over Africa J. Geophys. Res. 121 Environ. Res. Lett. 7 034032
11405–24 Lange S 2018 Bias correction of surface downwelling longwave
Famien A M, Janicot S, Ochou A D, Vrac M, Defrance D, Sultan B and shortwave radiation for the EWEMBI dataset Earth Syst.
and Noel T 2018 A bias-corrected CMIP5 dataset for Africa Dynam. 9 627–45
using the CDF-t method—A contribution to agricultural Lema M A and Majule A E 2009 Impacts of climate change,
impact studies Earth Syst. Dynam. 9 313–38 variability and adaptation strategies on agriculture in semi
Fang G H, Yang J, Chen Y N and Zammit C 2015 Comparing bias arid areas of Tanzania: the case of Manyoni District in
correction methods in downscaling meteorological variables Singida region, Tanzania Afr. J. Environ. Sci. Technol. 3
for a hydrologic impact study in an arid area in China 206–18
Hydrol. Earth Syst. Sci. 19 2547–59 Lennard C J, Nikulin G, Dosio A and Moufouma-Okia W 2018
FAO 2019 FAOSTAT http://www.fao.org/faostat/en/#data/QC On the need for regional climate information over Africa
FAO, IFAD, UNICEFF, WFP, and WHO 2018 The state of food under varying levels of global warming Environ. Res. Lett. 13
security and nutrition in the world 2018: building climate 060401
resilience for food security and nutrition (Rome: FAO) Lobell D B, Bänziger M, Magorokosho C and Vivek B 2011
Finney D L, Marsham J H, Jackson L S, Kendon E J, Rowell D P, Nonlinear heat effects on African maize as evidenced by
Boorman P M, Keane R J, Stratton R A and Senior C A 2019 historical yield trials Nat. Clim. Chang. 1 42–45
Implications of improved representation of convection for Lobell D B, Burke M B, Tebaldi C, Mastrandrea M D, Falcon W P
the East Africa water budget using a convection-permitting and Naylor R L 2008 Prioritizing climate change
model J. Clim. 32 2109–29 adapation needs for food security in 2030 Science
Foyer C H et al 2019 Modelling predicts that soybean is poised to 319 607–10
dominate crop production across Africa Plant Cell Environ. Lock A P, Brown A R, Bush M R, Martin G M and Smith R N B
42 373–85 2000 A new boundary layer mixing scheme. Part I: Scheme
Funk C et al 2015 The climate hazards infrared precipitation with description and single-column model tests Mon. Weather
stations - A new environmental record for monitoring Rev. 128 3187–99
extremes Sci. Data 2 1–21 Mangani R, Tesfamariam E H, Engelbrecht C J, Bellocchi G,
Garcia-Carreras L, Challinor A J, Parkes B J, Birch C E, Nicklin K J Hassen A and Mangani T 2019 Potential impacts of extreme
and Parker D J 2015 The impact of parameterised weather events in main maize (Zea mays L.) producing areas
convection on the simulation of crop processes J. Appl. of South Africa under rainfed conditions Reg. Environ.
Meteorol. Climatol. 54 1283–96 Change 19 1441–52
Gibba P, Sylla M B, Okogbue E C, Gaye A T, Nikiema M and Kebe Marsham J H, Dixon N S, Garcia-Carreras L, Lister G M S, Parker
I 2018 State-of-the-art climate modeling of extreme D J, Knippertz P and Birch C E 2013 The role of moist
precipitation over Africa: analysis of CORDEX added-value convection in the West African monsoon system: insights
over CMIP5 Theor. Appl. Climatol. 137 1051–57 from continental-scale convection-permitting simulations
Giorgi F 2019 Thirty years of regional climate modeling: where Geophys. Res. Lett. 40 1843–9
are we and where are we going next? J. Geophys. Res. 124 Michelangeli P A, Vrac M and Loukos H 2009 Probabilistic
2018JD030094 downscaling approaches: application to wind cumulative
Harris I 2019 Release Notes for CRU TS v4.03 (available at: distribution functions Geophys. Res. Lett. 36 2–7
https://crudata.uea.ac.uk/cru/data/hrg/cru_ts_4.03/Release Myeni L, Moeletsi M E and Clulow A D 2019 Present status of soil
_Notes_CRU_TS4.03.txt (accessed 15 May 2019)) moisture estimation over the African continent J. Hydrol.
Hart N C G, Washington R and Stratton R A 2018 Stronger local Region. Stud. 21 14–24
overturning in convective-permitting regional climate Oluwole O S A 2015 El Niño-southern oscillation and cassava
model improves simulation of the subtropical annual cycle production in Tanzania and Brazil Clim. Change
Geophys. Res. Lett. 45 11334–42 131 273–85
Hawkins E and Sutton R 2011 The potential to narrow Paeth H and Mannig B 2013 On the added value of regional
uncertainty in projections of regional precipitation change climate modeling in climate change assessment Clim. Dyn.
Clim. Dyn. 37 407–18 41 1057–66
IPCC 2014 Climate change 2014: impacts, adaptation, and Piikki K, Winowiecki L, Vågen T-G, Parker L and Söderström M
vulnerability. Part B: regional aspects Contribution of 2015 The importance of soil fertility constraints in modeling
Working Group II to the Fifth Assessment Report of the crop suitability under progressive climate change in
Intergovernmental Panel on Climate Change ed V R Barros Tanzania Procedia Environ. Sci. 29 199–200
et al (Cambridge: Cambridge University Press) Portmann F T, Siebert S and Döll P 2010 MIRCA2000-Global
Jones C, Giorgi F and Asrar G. 2011. The coordinated regional monthly irrigated and rainfed crop areas around the year
downscaling experiment: CORDEX An International 2000: a new high-resolution data set for agricultural and
Downscaling Link to CMIP5 ed A Pirani (Southampton: hydrological modeling Global Biogeochem. Cycles
CLIVAR Exchanges) 24 1–24
Jones L et al 2015 Ensuring climate information guides Prein A F et al 2015 A review on regional convection-permitting
long-term development Nat. Clim. Chang. climate modeling: demonstrations, prospects, and
5 812–4 challenges Rev. Geophys. 53 323–61
Kendon E J, Ban N, Roberts N M, Fowler H J, Roberts M J, Chan S Ramirez-Villegas J, Jarvis A and Läderach P 2013 Empirical
C, Evans J P, Fosser G and Wilkinson J M 2017 Do approaches for assessing impacts of climate change on
convection-permitting regional climate models improve agriculture: the EcoCrop model and a case study with grain
projections of future precipitation change? Bull. Am. sorghum Agr. Forest Meteorol. 170 67–78
Meteorol. Soc. 98 79–93 Reynolds R W, Smith T W, Liu C, Chelton D B, Casey K S and
Kendon E J et al 2019 Enhanced future changes in wet and dry Schlax M G 2007 Daily high-resolution-blended
extremes over Africa at convection-permitting scale Nat. analyses for sea surface temperature J. Clim.
Comm. 10 1794 20 5473–96
Kerandi N M, Laux P, Arnault J and Kunstmann H 2017 Rippke U 2014 Thresholds of crop suitability: When does
Performance of the WRF model to simulate the seasonal and Sub-Saharan Africa need transformational climate change
interannual variability of hydrometeorological variables in adaptation? University of Bonn
14Environ. Res. Lett. 15 (2020) 094086 Sarah et al
Rippke U, Ramirez-Villegas J, Jarvis A, Vermeulen S J, Parker L, Taylor K E, Stouffer R J and Meehl G A 2012 An overview of
Mer F, Howden M, Diekkrüger B, Challinor A J and Howden CMIP5 and the experiment design Bull. Am. Meteorol. Soc.
M 2016 Timescales of transformational climate change 93 485–98
adaptation in sub-Saharan African agriculture Nat. Clim. Teixeira E I, Fischer G, Van Velthuizen H, Walter C and Ewert F
Chang. 6 605–9 2013 Global hot-spots of heat stress on agricultural crops
Rowell D P and Chadwick R 2018 Causes of the uncertainty in due to climate change Agr. Forest Meteorol. 170 206–15
projections of tropical terrestrial rainfall change: East Africa Teutschbein C and Seibert J 2012 Bias correction of regional
J. Clim. 31 5977–95 climate model simulations for hydrological climate-change
Rowhani P, Lobell D B, Linderman M and Ramankutty N 2011 impact studies: review and evaluation of different methods
Climate variability and crop production in Tanzania Agr. J. Hydrol. 456–457 12–29
Forest Meteorol. 151 449–60 University of East Anglia Climatic Research Unit 2019 CRU TS
Saeed F, Haensler A, Weber T, Hagemann S and Jacob D 2013 Version 4.03 https://crudata.uea.ac.uk/cru/data/hrg/
Representation of extreme precipitation events leading to cru_ts_4.03/
opposite climate change signals over the Congo basin Vrac M, Noël T and Vautard R 2016 Bias correction
Atmosphere 4 254–71 of precipitation through singularity stochastic removal J.
Serdeczny O, Adams S, Baarsch F, Coumou D, Robinson A, Hare Geophys. Res. Atmos. 121 5237–58
W, Schaeffer M, Perrette M and Reinhardt J 2017 Climate Willetts P D, Marsham J H, Birch C E, Parker D J, Webster S and
change impacts in Sub-Saharan Africa: from physical Petch J 2017 Moist convection and its upscale effects in
changes to their social repercussions Reg. Environ. Change simulations of the Indian monsoon with explicit and
17 1585–600 parametrized convection Q. J. R. Meteorol. Soc.
Stephens G L, L’Ecuyer T, Forbes R, Gettlemen A, Golaz J C, 143 1073–85
Bodas-Salcedo A, Suzuki K, Gabriel P and Haynes J 2010 Zougmoré R, Partey S, Ouédraogo M, Omitoyin B, Thomas T,
Dreary state of precipitation in global models J. Geophys. Ayantunde A, Ericksen P, Said M and Jalloh A 2016 Toward
Res. Atmos. 115 1–14 climate-smart agriculture in West Africa: A review of climate
Stratton R A et al 2018 A Pan-African convection-permitting change impacts, adaptation strategies and policy
regional climate simulation with the met office unified developments for the livestock, fishery and crop production
model: CP4-Africa J. Clim. 31 3485–508 sectors Agric. Food Secur. 5 1–16
15You can also read