Global Landscape of Climate Finance 2021 - Preview Supported by
←
→
Page content transcription
If your browser does not render page correctly, please read the page content below

Global Landscape of
Climate Finance 2021
Preview
Supported by:

Authors: Baysa Naran, Pedro Fernandes, Rajashree Padmanabhi, Paul Rosane, Matthew Solomon, Sean Stout, Costanza Strinati, Rowena Tolentino, Elvis
    Wakaba, Yaxin Zhu, and Barbara Buchner

    Acknowledgements: The authors would like to thank contributions from Angela Falconer, Caroline Dreyer, Chavi Meattle, Daniela Chiriac, Rob Kahn, and
    Sandra Guzman for advice, editing and internal review and Josh Wheeling, Angela Woodall, Elana Fortin, and Julia Janicki for layout and graphic design.
    The authors also acknowledge contributions from Jake Connolly, Rob Macquarie, Greta Dobrovich, Oisin Canney and Priyam Deka for database
    maintenance, data cleaning, research and project support.

    The authors appreciate the review and guidance from the following experts outside CPI (in alphabetical order): Amelia Ash, Sophie Mendes, Amanda
    Penistone, Giulia Robinson, Alastair White (BEIS), Susan Krohn (BMU), Gabriela Blatter (FOEN), Michael Waldron (IEA), Charlene Watson (ODI), Raphael
    Jachnik (OECD), Eric Usher (UN PRI) and Joe Thwaites (WRI).

    Data collaboration: The Global Landscape of Climate Finance 2021 authors would like to thank Convergence, Climate Bonds Initiative and IEA as well as
    over 40 public development finance institutions for the continued data collaboration.

    Recommended citation: Climate Policy Initiative. 2021. “Preview: Global Landscape of Climate Finance 2021.”
    Related CPI works:
    Net Zero Finance Tracker
    Global Landscape of Climate Finance 2019
    Paris Misaligned – An Assessment of Global Power Sector Investment
    Framework for Sustainable Finance Integrity
    Energizing Finance: Understanding the Landscape 2021

    Contact:       Baysa Naran            baysa.naran@cpiglobal.org
                   Matthew Solomon        matthew.solomon@cpiglobal.org
                   Jake Connolly          jake.connolly@cpiglobal.org

    About CPI: CPI is an analysis and advisory organization with deep expertise in finance and policy. Our mission is to help governments, businesses, and
    financial institutions drive economic growth while addressing climate change. CPI has six offices around the world in Brazil, India, Indonesia, Kenya, the
    United Kingdom, and the United States.

    Copyright © 2021 Climate Policy Initiative www.climatepolicyinitiative.org
    All rights reserved. CPI welcomes the use of its material for noncommercial purposes, such as policy discussions or educational activities, under a Creative
    Commons Attribution-NonCommercial-ShareAlike 3.0 Unported License. For commercial use, please contact admin@cpisf.org
2
Table of Contents
    How to use
    this         1. Executive Summary and Key Findings        4
                 2. Sources and Intermediaries               11
    template?        2.1 Public Finance                      12
                     2.2 Private Finance                     13
                 3. Instruments                              14
                 4. Mitigation: Energy Supply                19
                 5. Mitigation: High-Energy Demand Sectors   26
                 6. Adaptation Finance                       31
                 7. Geographic Flows                         36
                 8. Recommendations                          39

                 Annex: Data Tables                          42

                 References                                  51
3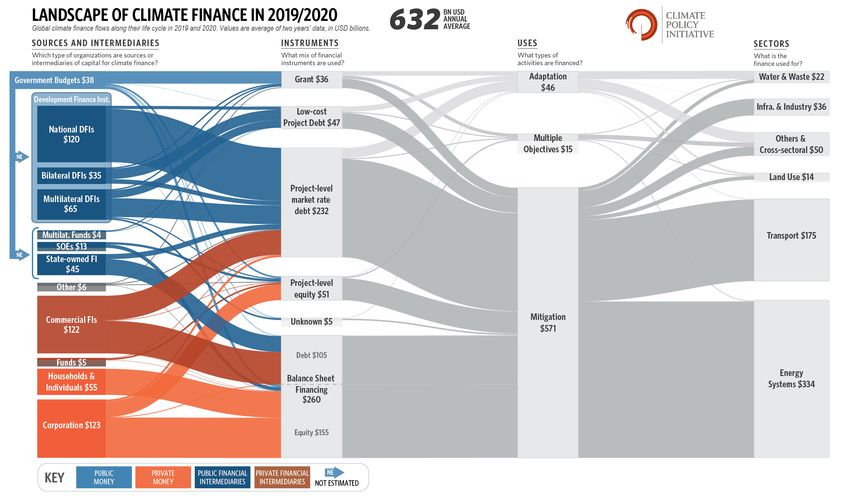
1. Executive Summary
The Global Landscape of Climate Finance provides the most comprehensive
overview of global climate-related primary investment.

CPI reports two-year averages in USD billions (2019 and 2020) to smooth out
annual fluctuations in data.

Note: Numbers in figures in this report may not sum exactly due to rounding

Executive summary

     Global climate finance flows reached USD 632 billion in
     2019/2020, but with tepid growth rate
    Figure 1.2: Global climate finance flows between 2011 – 2020, biannual
    averages (USD bn)
                                                                             Public and private actors steadily increased
                                                                             their climate investments in the last decade,
                                                                             but flows largely plateaued in the last few
                                                                             years.
                                                                             This is worrying given COVID-19’s impact on
                                                                             climate finance is yet to be observed.
                                                                             The increase between 2017/2018 and
                                                                             2019/2020 was only 10%, much slower than
                                                                             previous periods.
                                                                             Annual climate finance flows between
                                                                             2013/2014 and 2017/2018 grew more than
                                                                             24% each period.

                                                                             Note: 2020 investment numbers were based on preliminary
                                                                             estimates. Further primary data on 2020 international public
                                                                             finance becomes available in 2022.
6
Executive summary
Current investment levels are nowhere near enough to
limit global warming to 1.5 °C
Figure 1.3: Global tracked climate finance flows and the average estimated annual climate investment need through 2050
We have analyzed and
aggregated data sources and
scenarios that explore climate
finance needs for energy
systems, buildings, industry,
transport, and other mitigation
and adaptation solutions.
And to meet our climate
objectives, by 2030 annual
climate finance must increase
by at least 454% to USD 4.13
trillion.
Note: Further details on the investment need
and the data sources used are available in
Annex II.
7Executive summary
Achieving net zero will require all public and private
actors to align their finance with Paris goals
Figure 1.4: Renewable power consumption compared to overall electricity consumption and climate
positive investment compared to overall investment in light vehicles and new building construction
Climate-positive investment
still represents only a small
fraction of the overall
investment in high-emitting
sectors. In the meantime, the
world largely consumes fossil
fuel based electricity.
While many institutions have
started to take some action
on climate change through
net zero pledges and emission
reduction targets, action in
the real economy lags.
8Executive summary
A majority of climate finance went to mitigation, but
adaptation finance is gaining momentum
Figure 1.5: Biannual average climate finance by mitigation, adaptation and dual
objectives (USD bn) Mitigation finance reached USD 571 billion
in 2019/2020, while adaptation finance
commitments totaled USD 46 billion.
A further USD 15 billion went to projects
with dual benefits (mitigation and
adaptation).
Annual adaptation finance increased by
almost 53% in 2019/2020 compared to
2017/2018. Projects with dual objectives
increased by 23%, showing increased
participation from the private sector.
The public sector continues to provide
almost all of adaptation finance, while the
private sector mostly provides mitigation
finance.
9Executive summary
Data gaps and methodological issues limit our
understanding of progress and impact
Figure 1.6: Data gaps in climate finance (USD bn, 2019/2020 annual average)
Qualitative information on the impact of
climate finance continues to be
dispersed and scarce.
Metrics and definitions are non-
standardized.
For example, finance for buildings with
high energy and thermal insulation
performances – green buildings – is
growing fast but lacks transparency.
102. Sources and Intermediaries The Landscape tracks direct primary investment in climate-related infrastructure by each of the public and private actors.
Sources and intermediaries

     Public actors provided 51% (USD 321 billion) of annual climate
     finance
     Figure 2.1: Public investment by institutions (USD bn)   Tracked climate finance provided by public
                                                              sources remained largely stable at 51% of the
                                                              total. By refining* our understanding of state-
                                                              owned entities’ role, we see that the public sector
                                                              plays a more prominent role than previously
                                                              thought.

                                                              DFIs continue to provide the majority of public
                                                              finance, contributing 68% (USD 219 bn).

                                                              State-owned FI share increased to 14% in
                                                              2019/2020. This increase is partly due to improved
                                                              data points on the flows in East Asia and Pacific as
                                                              well as an uptake of renewable energy financing
                                                              in the region.

                                                              Tracked climate finance from government
                                                              increased 17% in 2019/2020, accounting for 12% of
                                                              public flows. As in previous years, the growth is
                                                              driven by low-carbon transport and delivered
                                                              primarily through grants.

                                                               * This methodological change can be found in the Updated
12
                                                               View on the Global Landscape of Climate Finance 2019.
Sources and intermediaries
Private actors provided 49% (USD 310 billion) of annual
climate finance
Figure 2.2: Private investment by institution type (USD bn)
Private investment increased 13% from the
2017/2018 average.
Commercial financial institutions made the
biggest stride in growth, increasing their share
from 18% to 39%.
Banks are playing a more prominent role as
an intermediary of sustainable and green
debt instruments as well as broader trend of
setting climate related targets.
Households provide the third largest share of
annual climate finance. Households’ annual
spending on electric vehicles was USD 25
billion on average over 2019/2020.
133. Instruments The Landscape categorizes transactions by the instrument used to structure the provision of climate finance. It includes both debt and equity instruments, both of which are differentiated between arrangements at the project level and on balance sheets. Grants, which do not usually require repayment, is the third and final category.
Financial instruments

     Debt remains the main instrument for climate finance, but
     equity’s share and amount has increased
     Figure 3.1: Climate Finance by instrument (USD bn)

                                                          The majority of climate finance — 61%
                                                          (USD 384 billion) — was raised as debt in
                                                          2019/2020.

                                                          Equity investments, the next-largest
                                                          category after debt, came to 33% of
                                                          total climate finance, up from 29%
                                                          during the previous period.

                                                          Grant finance comprised 6% of total
                                                          flows (compared to 5% in 2017/2018).

15
Financial instruments
Market-rate debt accounted for 88% of all total climate
finance debt
Figure 3.2: Debt by type (USD bn)
Figure 3.2: Debt by type (USD bn) Public institutions provided 75% of project-level
market-rate debt, primarily multilateral and national
DFIs.
Debt issued directly through balance sheets
comprised 31% of total annual market-rate debt. The
vast majority of this finance was capital raised by
commercial financial institutions (66%) for direct
expenditure in renewable energy projects.
Low-cost project-level debt decreased 27% from the
2017/2018 annual average. Almost all (99.8%) is
provided by public institutions.
16Financial instruments
Equity investments increased their share of total climate
finance flows
Figure 3.3: Equity by type (USD bn)
Balance sheet equity investments
represented 75% of total equity finance,
accounting for USD 155 billion in annual
flows, on average.
Annual financing through project-level
equity accounted for the remaining 25% of
total equity. The vast majority of this
finance was capital raised by corporations
(65%).
17Financial instruments
Grants have increased 32% on average from 2017/2018 to
2019/2020, but remain a small part of climate finance
Figure 3.4: Grants by source (USD bn)
Almost 55% of tracked grants were
international flows, and 37% domestic
flows.
Governments are the main source of
grants. Though flows increased by 33%
from 2017/2018, the share remained
largely stable at 73% of all flows.
All domestic grants were provided for the
transport sector.
22% of international grants were
channeled towards the Energy Systems
sector, and 11% for the Agriculture sector.
184. Mitigation: Energy Systems Energy systems investments include investments in renewable fuel production (i.e., biofuels and biogas), renewable power and heat generation assets, transmission and distribution networks, as well as support to policy and national budget and capacity building.
Sectors   Energy supply: Renewable energy

     Annual renewable energy investments need to at least triple to
     keep warming within 1.5° C by mid-century
     Figure 4.1: Annual renewable energy investments (2015-2020) vs investment needs through 2050

      Energy-sector scenarios show that the current level of renewable energy investment is insufficient to put the
      world on a 1.5°C trajectory by 2050. Based on these scenarios, annual investment ranging between USD 831
      billion and USD 1.9 trillion is needed over the period through 2050.
20
Sectors Energy supply: Renewable energy
Renewable energy remains the largest mitigation sector
Figure 4.2: Renewable energy investments by sector as a share of mitigation finance (USD bn, 2019/2020 average)
Solar PV and onshore wind continued to be the main recipient of renewable energy finance, attracting over 91% of
mitigation investment.
According IRENA (2021b), in 2020, the global average levelized cost of electricity of newly commissioned onshore wind
projects declined by 13%, compared to 2019, followed by offshore wind (down 9%) and utility-scale solar PV (down by
21 7%).Sectors Energy supply: Renewable energy
Private sources continue to provide the majority of renewable
energy finance
Figure 4.3: Investment by public/private source – renewables vs. mitigation (USD bn)
The private sector provided, on average,
69% of renewable energy finance (USD 223
billion), in line with the share observed in
2017/2018 and confirming the maturity of
the renewable energy sector.
Owing to their higher competitiveness
(especially of solar PV), renewables are
generally able to attract greater shares of
private finance compared to other
mitigation solutions. Private investors
accounted for over half (54%) of all
mitigation finance flows.
22Sectors Energy supply: Renewable energy
Commercial FIs emerge as the main providers of private capital
for renewables
Figure 4.4: Private renewable energy investments by type of institution (% of total share)
Commercial financial institutions provided
45% of the total (or USD 104 bn per year),
followed by corporations (41%) and
households and individuals (11%).
Compared to 2017/2018, commercial
financial institutions, especially from the US,
China, and Western Europe, more than
doubled their commitments to renewables,
while capital provided by corporations
almost halved.
23Sectors Energy supply: Renewable energy
State-owned FIs provided 44% of public finance for renewables,
followed by national DFIs at 28%
Figure 4.5: Public renewable energy investments by type of investor (% of total share)
Public finance came in mainly via state-
owned financial institutions, which provided
USD 45 billion per year, doubling their share
in total public finance from the previous
period.
National DFIs provided USD 28 billion in
2019/2020, or 28% of public renewable
energy investments, down from USD 36
billion (or 35%) in 2017/2018.
Investments from state-owned enterprises
were down 53% compared to 2017/2018.
24Sectors Renewable energy infrastructure
Growing investments and more private participation in greening
transmission and distribution
Figure 4.6: Energy T&D by investment source (USD bn)
Global investments in transmission and distribution
(T&D) reached an average of USD 8.03 billion per
year in 2019/2020, a USD 4.96 billion increase from
2017 and 2018 annual levels.
Although the public actors almost exclusively
financed the T&D in 2017/2018, private actors'
participation became visible in 2019/2020, mainly
from corporations for the construction of new grids.
In 2019, 38.9% of the investments came from the
East Asia and Pacific region, while in 2020 the
leading role shifted to the Middle East due to large
sized projects.
255. Mitigation: High Energy Demand Sectors In the following sections, we discuss climate mitigation investments dedicated to decarbonizing high energy demand sectors. Further breakdown of other climate mitigation investment are available in Annex I, Table A.4.
Sectors   High energy demand: Transport

        Low-carbon transport is the fastest-growing sector in 2019/2020
        Figure 5.1: Low-carbon transport sub-sector investment

     Low-carbon transport is still the fastest-growing sector in 2019/2020 with an average increase of 23% compared to 2017/2018.

     In 2019/2020, investment tracked to private road transport (battery electric vehicles and chargers) accounted for 48% of low-carbon
     transport finance – building on multiple years of government subsidy policies and falling technology costs.

     In comparison, despite gaps in data coverage, low-carbon investments in Rail & Public transport are lagging. In many countries, rail and
27   public transport networks are underdeveloped and fail to offer low-carbon alternatives to private vehicles and road freight.
Sectors High energy demand: Transport
Battery Electric Vehicle (BEV) sales showed remarkable
robustness
Figure 5.2: Volume of BEV sales vs. battery prices Last year, growth in global BEV sales accelerated (+31%
year-to-year increase,) while the global vehicle market fell
by 16% compared to 2019 due to the pandemic (IEA,
2021c). BEV’s sharp market increase was driven by surging
sales in Europe (+108%). Early findings suggest global sales
could double in 2021 (Strategy&, 2021).
The 2020 expansion of the BEV market triggered an even
greater year-to-year investment increment (+88%) as the
average BEV price also increased. While falling battery
costs had been making BEVs cheaper over time –
contributing to their growing popularity (Figure 4.8) - the
recent emergence of energy and tech-intensive electric
SUVs is competing with this trend. Compared to lighter BEVs,
the mitigation benefit of such vehicles is not as clear (CPI,
2020).
With expiring subsidy policies, private actors are now
compensating for more expensive vehicles (Fuel Economy,
2021). On average, government incentives covered 24% of
BEV price in 2019 down to only 10% in 2020. In 2019/2020,
household and corporation down payments were 68% of
private flows, while commercial FIs provided the remaining
share through auto loans.
28 Sources: BNEF, 2020b; IEA, 2021bSectors High energy demand: Building
Building sector tracking hindered by uncoordinated action,
stacked actors, and missing climate threshold definitions
Figure 5.3: Building sub-sector investment (USD bn)
Tracked mitigation investment in Buildings & Infrastructure totalled USD 27.7 billion on average in 2019/2020. Limited data availability,
especially in the private sector, means the amount tracked represents only a partial view.
However, several mitigation solutions stand out. Distributed solar thermal water heaters make up most of HVAC & Water Heaters tracked
finance, although the sector suffered due to tightened household budgets during the pandemic (SHC, 2021).
Finance for buildings with high energy and thermal insulation performances – green buildings – is growing fast but lacks transparency.
Private sector investments are hard to capture (6% of total), but more importantly shared science-based standards are missing. Given the
inertia in infrastructure stocks, some buildings that currently qualify for green certifications are not compatible with tomorrow’s
29 decarbonization pathways (CRREM, 2020).Sectors High energy demand: Industry
Industry remains the hidden face of climate finance with limited
data disclosure and a key role in broader supply chains
Figure 5.6: Industry sub-sector investment (USD bn)
In 2019/2020 tracked mitigation investments flowing to the industrial sector remained low, averaging USD 6.7 billion per year. Climate
finance in the industry is particularly hard to track as industrial processes are prone to confidentiality restrictions. Some industries are also
known to be technically hard to decarbonize (steel, cement) as they rely on energy-intensive processes.
A large share of tracked flows come from Western Europe DFIs (48%) and are used for energy efficiency improvements (50.6%).
In the EU, the recent surge of the EU-ETS carbon market (EMBER, 2021) combined with gas prices volatility (Bloomberg, 2021) could soon
outweigh CO2 abatement costs in numerous industries. Should these trends persist, new finance to energy efficiency and carbon
30 capture, utilisation and storage (CCUS) technologies could be unlocked.6. Adaptation Finance Adaptation finance increased substantially in 2019/2020 despite methodological difficulties involved with tracking adaptation activities, particularly in the context of the private sector.
Adaptation

     Adaptation finance gained momentum in 2019/2020 but
     remains well short of estimated needs
     Figure 6.1: Adaptation finance and needs (USD bn)

                                                         Adaptation finance gained
                                                         momentum in 2019/2020,
                                                         increasing 53% to an annual
                                                         average of USD 46 billion from USD
                                                         30 billion in 2017/2018. This
                                                         increase stems from an uptick in
                                                         Water & Wastewater as well as
                                                         other cross-sectoral projects, with
                                                         adaptation increasingly prioritized
                                                         in development finance climate
                                                         portfolios. However, adaptation
                                                         finance falls well short of
                                                         estimated annual needs through
                                                         to 2030 (GCA, 2020).

32
Adaptation
Almost all adaptation finance tracked in the Landscape was
funded by public actors
Figure 6.2: Adaptation investment sources by actor (USD bn, 2019/2020 annual average)
Adaptation finance accounted
for 14% of all 2019/2020 public
finance flows.
Commitments from all DFIs
together accounted for 80% (USD
36.8 billion) of average
adaptation financing. Multilateral
DFIs therein accounted for the
largest share of adaptation
finance (35%, 16.1 billion) followed
by national DFIs (34%, 15.4 billion).
33Adaptation
The largest recipient of international adaptation finance is Sub-
Saharan Africa, but commitments fall well short of region’s needs
Figure 6.3: Adaptation finance by region (USD bn, 2019/2020 annual average)
The top ten most vulnerable countries to
climate change are all in Sub-Saharan
Africa (SSA) (ND-GAIN, 2021). SSA received
the greatest share (25%) of international
adaptation finance, but commitments are
at the lower end of regional adaptation
needs estimates of USD 7-15 billion per
year by 2020 (AfDB 2019; UNEP 2014).
Adaptation in East Asia and Pacific (EAP) is
primarily financed by public domestic
actors. 37% of all adaptation flows are
sourced domestically, with EAP (largely
China) accounting for the majority of
those domestic commitments (88%, USD
14.7 billion).
34Gender
A gender lens in climate finance is emerging in the public
sector, but data is scarce
Figure 6.4: Climate finance and gender tagging (USD bn, 2019/2020 annual average)
Adaptation and projects with Multiple Objectives appear to offer the most potential for incorporating gender-tagging, currently reporting
11% and 27% respectively. Only 0.7% of tracked mitigation projects were gender-tagged.
More granular, project-level reporting can help to assess the landscape of gender-sensitive climate finance, in turn allowing us to
measure progress towards attaining several different sustainable development goals simultaneously. Currently, gender-tagging is scarce
amongst private institutions.
357. Geographic Flows
Geographic

     Three-quarters of tracked investments flowed domestically

     Figure 7.1: Domestic and international climate finance flows by region of destination (USD bn, 2019/2020 annual average)

                                                                                  Around USD 479 bn of climate investments were
                                                                                  raised and spent within the domestic territories,
                                                                                  highlighting the continued importance of
                                                                                  strengthening national policies and domestic
                                                                                  regulatory frameworks to encourage domestic
                                                                                  investments and address risks.
                                                                                  The USD 153 billion of international flows registered
                                                                                  an increase of USD 13 billion from 2017/2018,
                                                                                  primarily driven by increased public investments from
                                                                                  multilateral and national DFIs.
                                                                                  Climate finance flows are concentrated in East Asia
                                                                                  and Pacific, Western Europe, and North America,
                                                                                  while only a quarter went to Sub-Saharan Africa,
                                                                                  South Asia, Other Oceania, Middle East & North
                                                                                  Africa, Latin America & Caribbean, and Central Asia
                                                                                  & Eastern Europe.

37    Notes: The list of countries for each region are available in Annex III
Geographic
East Asia & Pacific remained the main region of destination for
climate finance
Figure 7.2 : Destination region of climate finance, by public/private (USD bn, 2019/2020 annual average)
Almost half (USD 292 billion) of 2019/2020 tracked
global climate investments went to East Asia &
Pacific (EAP), up by USD 43 billion compared to
2017/18. An estimated 81% of the investments in the
EAP region were concentrated in China which could
be attributed to continuing strong government
support through public spending and national
policies towards better investment climate.
Climate projects in economically advanced regions
of Western Europe, US & Canada, and Other
Oceania were primarily funded by private finance,
while the rest sourced their climate investments
mostly from public sources.
All regions were mainly funding mitigation actions,
with 80% of the mitigation investments concentrated
in the high-emitting regions of US & Canada,
Western Europe, and East Asia & Pacific.
Notes: The list of countries for each region are available in Annex III
38East Asia & Pacific remained the main region of destination for
climate finance
Figure 7.2 : Destination region of climate finance, by public/private (USD bn, 2019/2020 annual average)
398. Recommendations
Conclusion

     Conclusions and key recommendations
     1. Increase the scale of finance - this decade will make or break the transition to a sustainable, net zero world
     •   Finance flows are nowhere near the estimated needs. High-emissions investment in the meantime continues to flow in key sectors,
         which are curbing the impact of new finance in climate mitigation and adaptation. Climate investment should count in the
         trillions, whereas fossil fuel investments should virtually stop in this decade.
     •   Over the past few years, we’ve seen a flurry of initiatives targeting net zero emissions and aligning finance with the Paris
         Agreement. However, real economy investment volumes and emission trends are yet to show.
     •   No sector is on track to meet the required investment levels. For example, annual renewable energy investments need to at least
         triple and adaptation finance needs to increase at least fourfold. Moreover, private sector investment falls short in most emerging
         economies which is alarming considering limited public finance space post-COVID.
     •   Enabling policies and innovative financial solutions are needed to create bankable investment. With policy incentives that
         support the low-carbon shift, and due to falling technology costs, private climate mitigation finance at scale will make financial
         sense in most regions and sectors.

     2. Public and private actors should prioritize data on credible climate action and impact on the ground
     •   Currently available disclosure initiatives fall short of providing standardized information on climate investment. Information on
         investment levels in adaptation, buildings, and industry sectors are scarce, particularly from the private sector, and lack shared
         science-based standards. This information is essential in assessing collective progress, crafting effective policies, and directing
         finance where it will have the most impact.

     •   More data is required at the country level. Domestic public budget expenditure on climate related activities is not universally
         available. This is critical information to mainstream and integrate climate framework, policies, and laws into national and sectoral
         budgets. Public bodies should embed the process of assessing climate finance flows at the programmatic level as we need to
         better monitor progress and needs of climate finance by country, sectors, and actors to ensure we are on track and filling gaps.

41
Conclusion
Conclusions and key recommendations
3. We need credible and coordinated net zero commitments with clear transition plans, including interim goals
• Achieving net zero by 2050 will require all public and private actors to align practices, investments, and portfolios with our
collective goal of limiting the global warming to 1.5C.
• However, public and private sectors do not have a commonly accepted definition of climate finance nor an understanding
of what all financial actors should be doing at minimum. The siloed approach on the common definitions could impede the
pace of change and impact on the real economy.
• Coordination across silos of public and private financial actors are needed to ensure coherence and impact on net zero and
sustainability, in alignment with science and with support of civil society.
4. Call for structural changes by focusing on the nexus between the environment, the economy, and the people
The urgent ramping up of mitigation investments is imperative, particularly for developed economies, while building resilience and
adaptative capacity should be the critical agenda of climate finance for all economies.
Structural changes could lead us to identify broader benefits and indicators, considering planetary and social boundaries:
─ Just transition: Consider the needs and wellbeing of the most vulnerable (rural poor, women, youth, indigenous population)
─ Real economy: Consider broader impacts of financial sector’s net zero efforts
─ Planetary and environmental boundaries: Consider how the transition can ensure avoiding the destruction of natural capital
and biodiversity
42Annex
I. Data Tables for climate finance in 2019/2020
     Table A.1: Breakdown of global climate finance by public and private actors (USD bn)

     Actor                                                                2019      2020    2019/2020 Average
     Private                                                              280       340     310
     Commercial FI                                                        111       134     122
     Corporation                                                          111       136     124
     Funds                                                                8         3       5
     Households/Individuals                                               47        64      55
     Institutional Investors                                              3         4       3
     Public                                                               343       300     321
     Bilateral DFI                                                        47        23      35
     Export Credit Agency (ECA)                                           1         1       1
     Government                                                           41        35      38
     Multilateral Climate Funds                                           4         3       4
     Multilateral DFI                                                     62        67      65
     National DFI                                                         137       103     120
     Public Fund                                                          2         2       2
     SOE                                                                  12        13      13
     State-owned FI                                                       38        52      45
     Total                                                                623       640     632
44
Table A.2: Financing for adaptation & mitigation split by public and private sources (USD bn)
Sources 2019 2020 2019/2020 Average
Private 280 340 310
Adaptation 0 2 1
Mitigation 279 335 307
Multiple objectives 1 3 2
Public 343 300 321
Adaptation 42 48 45
Mitigation 288 240 264
Multiple objectives 14 12 13
Total 623 640 632
Table A.3: Breakdown of global climate finance by instruments (USD billion)
Instrument 2019 2020 2019/2020 Average
Balance sheet financing (debt portion) 97 113 105
Balance sheet financing (equity portion) 131 179 155
Grant 38 34 36
Low-cost project debt 58 37 47
Project-level equity 56 46 51
Project-level market rate debt 239 226 232
Unknown 5 5 5
45 Total 623 640 632Table A.4: Breakdown of global climate finance by Use and by Sector (USD bn)
Use/Sector 2019 2020 2019/2020 Average
Adaptation 42 49 46
Agriculture, Forestry, Other land uses and Fisheries 5 4 4
Buildings & Infrastructure 1 1 1
Energy Systems 1 0.2 0.3
Industry 0.03 0.01 0.02
Information and Communications Technology 0.25 0.24 0.24
Others & Cross-sectoral 19 25 22
Transport 2 1 1
Waste 0.01 0.02 0.01
Water & Wastewater 15 19 17
Mitigation 566 576 571
Agriculture, Forestry, Other land uses and Fisheries 7 9 8
Buildings & Infrastructure 35 22 28
Energy Systems 321 342 332
Industry 9 5 7
Information and Communications Technology 0.1 0.1 0.1
Others & Cross-sectoral 21 17 19
Transport 169 177 173
Waste 1 3 2
Water & Wastewater 2 1 1
Multiple objectives 15 15 15
Agriculture, Forestry, Other land uses and Fisheries 2 2 2
Energy Systems 2 1 2
Others & Cross-sectoral 9 10 9
Transport 1 0.1 0.4
Water & Wastewater 1 2 2
46 Total 623 640 632Table A.5: Breakdown of Energy System Sector total climate finance by sub-sector (USD billion)
Energy System Sub-sector 2019 2020 2019/2020 Average
Fuel Production 1 1 1
Other/Unspecified 1 1 1
Policy & National Budget Support & Capacity Building 1 1 1
Power & Heat Generation 313 332 322
Power & Heat Transmission & Distribution 8 8 8
Total 324 343 334
Table A.6: Breakdown of Transport Sector total climate finance by sub-sector (USD billion)
Transport Sub-sector 2019 2020 2019/2020 Average
Aviation 0 0 0
Other/Unspecified 92 60 76
Policy & National Budget Support & Capacity Building 2 0 1
Private Road Transport 59 106 82
Rail & Public Transport 17 10 14
Transport-oriented Urban Development and Infrastructure 1 1 1
Waterway 0 0 0
Total 171 178 175
47Table A.7: Breakdown of Buildings & Infrastructure Sector total climate finance by sub-sector (USD billion)
Buildings & Infrastructure Sub-sector 2019 2020 2019/2020 Average
Appliances & Lighting 0 0 0
Building & Infrastructure Construction Work 21 9 15
HVAC & Water Heaters 14 14 14
Other/Unspecified 0 0 0
Policy & National Budget Support & Capacity Building 0 0 0
Total 36 23 29
Table A.8 – International and domestic climate finance flows (USD billion)
OECD/Non-OECD destination 2019 2020 2019-2020 Average
Domestic 478 479 479
non-OECD 294 302 298
OECD 184 176 180
Unknown 0 0 0
International 145 161 153
From Non-OECD to OECD 3 4 3
From Non-OECD to Other Non-OECD 19 29 24
From OECD to non-OECD 78 79 78
From OECD to Other OECD 44 49 46
From Transregional to Non-OECD 1 1 1
From Transregional to OECD 0 0 0
Total 623 640 632
48 Note: International public finance flows with transregional destination are assumed to be directed to non-OECD countries.Table A.9: Breakdown of global climate finance by region of destination (USD billion)
Region 2019 2020 2019/2020 Average
Central Asia and Eastern Europe 35 29 32
East Asia and Pacific 278 305 292
Latin America & Caribbean 37 33 35
Middle East and North Africa 16 15 15
Other Oceania 10 8 0
South Asia 30 30 0
Sub-Saharan Africa 19 19 19
Transregional 11 10 11
US & Canada 88 79 84
Western Europe 100 110 105
Total 623 640 632
49II. Available data on climate investment need through 2050
CPI Sector Annual investment needs (USD bn) # Scenario Data Sources
Low Mean High
Total Mitigation: 4,961 7,272 11,098
Energy Systems: 1,495 3,287 6,594
Renewable Energy: 662 1,142 1,983
Renewable Power 620 1,074 1,896 5 BNEF, 2021; IRENA, 2021a; IEA, 2021a
Biofuel & Biogas 42 68 87 3 IRENA, 2021; IEA, 2021a; IEA, 2020b
Electricity T&D 556 727 854 5 BNEF, 2021; IRENA, 2021; IEA, 202a
Innovation: 277 1,418 3,757
Integration solutions (Hydrogen, Pumped Hydro, Storage) 277 1,286 3,266 5 BNEF, 2021; IRENA, 2021; IEA, 2021a
CCUS 0 132 491 5 BNEF, 2021; IRENA, 2021; IEA, 2021a
Buildings & Infrastructure: 480 800 1,119
Energy efficient buildings 441 749 1,057 2 IEA, 2021a; IRENA, 2021a
Renewables direct uses and district heat 39 50 62 2 IEA, 2021a; IRENA, 2021a
Industry, Waste & Wastewater: 280 364 448
Efficient and Low-carbon processes 280 364 448 2
Transport: 2,449 2,565 2,681
BEV 1,422 1,445 1,468 2 BNEF, 2021b; IEA, 2021a; CPI
EV Chargers 100 125 150 2 IEA, 2021a; IRENA, 2021
Rail & Urban Transport 770 770 770 1 IEA, 2019
Energy Efficiency 157 225 293 2 IEA, 2021a; IRENA, 2021
AFOLU: 256 256 256
Forestry - Re/Afforestation 152 152 152 1 UNEP, 2021
Agriculture – Sylvopasture 104 104 104 1 UNEP, 2021
Total Adaptation: 180 180 180 1 GCA, 2020
Mangrove and Peatland Restoration 11 11 11 1 UNEP, 2021
50 Total CF 5,141 7,452 11,278III. Description of regions by countries
Region Countries and territories
Albania, Armenia, Azerbaijan, Belarus, Bosnia and Herzegovina, Bulgaria, Croatia, Cyprus, Estonia, Georgia, Hungary, Kazakhstan, Kosovo,
Central Asia and Eastern Europe Kyrgyzstan, Latvia, Lithuania, Moldova, Montenegro, North Macedonia, Poland, Romania, Russia, Serbia, Slovakia, Tajikistan, Turkey,
Turkmenistan, Ukraine, Uzbekistan
Cambodia, China, Cook Islands, Fiji, Guam, Hong Kong, Indonesia, Japan, Kiribati, Korea, Democratic People's Republic, Korea, Republic,
East Asia and Pacific Lao PDR, Malaysia, Marshall Islands, Micronesia, Mongolia, Myanmar, Nauru, Niue, Palau, Papua New Guinea, Philippines, Samoa,
Singapore, Solomon Islands, Taiwan, Thailand, Timor Leste, Tonga, Tuvalu, Vanuatu, Vietnam, Wallis and Futuna
Antigua and Barbuda, Argentina, Bahamas, Barbados, Belize, Bolivia, Brazil, Chile, Colombia, Costa Rica, Cuba, Dominica, Dominican
Republic, Ecuador, El Salvador, French Guiana, Grenada, Guadeloupe, Guatemala, Guyana, Haiti, Honduras, Jamaica, Mexico,
Montserrat, Nicaragua, Panama, Paraguay, Peru, Puerto Rico, Saint Kitts and Nevis, Saint Lucia, Saint Vincent and the Grenadines,
Latin America & Caribbean Suriname, Trinidad and Tobago, Uruguay, Venezuela, Anguilla, Aruba, Bonaire, Sint Eustatius and Saba, Cayman Islands, Curaçao, Falkland
Islands, French Guiana, Guadeloupe, Martinique, Montserrat, Puerto Rico, St. Barthélemy, Saint Martin, Turks and Caicos Islands, Virgin
Islands, West Indies
Algeria, Bahrain, Egypt, Iran, Iraq, Israel, Jordan, Kuwait, Lebanon, Libya, Morocco, Oman, Qatar, Saudi Arabia, State of Palestine, Syria,
Middle East and North Africa Tunisia, United Arab Emirates, West Bank and Gaza, Yemen
Australia, British Indian Ocean Territory, Christmas Island, Cocos (Keeling) Islands, French Polynesia, French Southern Territories, New
Other Oceania Caledonia, New Zealand, Norfolk Island, Northern Mariana Islands, New Caledonia, Pitcairn, Tokelau
South Asia Afghanistan, Bangladesh, Bhutan, India, Maldives, Nepal, Pakistan, Sri Lanka
Angola, Benin, Botswana, Burkina Faso, Burundi, Cameroon, Cape Verde, Central African Republic, Chad, Comoros, Congo, Democratic
Republic, Cote d'Ivoire, Djibouti, Equatorial Guinea, Eritrea, Ethiopia, Gabon, Gambia, Ghana, Guinea, Guinea-Bissau, Kenya, Lesotho,
Sub-Saharan Africa Liberia, Madagascar, Malawi, Mali, Mauritania, Mauritius, Mozambique, Namibia, Niger, Nigeria, Rwanda, Saint Helena, Sao Tome and
Principe, Senegal, Seychelles, Sierra Leone, Somalia, South Africa, South Sudan, Sudan, Swaziland, Tanzania, Togo, Uganda, Zambia,
Zimbabwe, Mayotte, Réunion, Saint Helena
US & Canada Bermuda, Canada, United States of America
Andorra, Austria, Belgium, Czech Republic, Denmark, Finland, France, Germany, Greece, Iceland, Ireland, Italy, Luxembourg, Malta,
Western Europe Netherlands, Norway, Portugal, San Marino, Slovenia, Spain, Sweden, Switzerland, United Kingdom
51References
References
     African Development Bank (AfDB), 2019. Analysis of Adaptation Components of Africa’s Nationally Determined
     Contributions (NDCS). Available at: https://www.afdb.org/fileadmin/uploads/afdb/Documents/Generic-
     Documents/Analysis_of_Adaptation_Components_in_African_NDCs_2019.pdf

     BNEF, 2021(a). New Energy Outlook 2021. Available at: https://www.bnef.com/insights/26813/view

     BNEF, 2021(b). Electric Vehicle Outlook 2021. Bloomberg New Energy Finance (BNEF). Available at:
     https://www.bnef.com/flagships/ev-outlook?tab=Commercial%20vehicles

     BNEF, 2020. Electric Vehicle Outlook 2020. Bloomberg New Energy Finance (BNEF). Available at:
     https://about.bnef.com/electric-vehicle-outlook-2020/

     CPI, 2021. Private Financial Institutions’ Commitments to Paris Alignment. Climate Policy Initiative (CPI).

     CPI, 2020. Paris Misaligned: A look at the transport sector. Climate Policy Initiative (CPI). Available at:
     https://www.climatepolicyinitiative.org/paris-misaligned-us-transport-sector/

     CRREM, 2020. CRREM Retrofit Harmonisation Roadmap. Carbon Risk Real Estate (CRREM). Monitor Available at:
     https://www.crrem.eu/wp-content/uploads/2020/05/CRREM-Retrofit-Harmonisation-Roadmap.pdf

     European Commission (2020). Renovation wave. Energy - European Commission. Available at:
     https://ec.europa.eu/energy/topics/energy-efficiency/energy-efficient-buildings/renovation-wave_en

     Fuel Economy, 2020. Federal Tax Credits for New All-Electric and Plug-in Hybrid Vehicles. U.S. Department of Energy
     (DOE). Available at: https://www.fueleconomy.gov/feg/taxevb.shtml

53
References
Global Center on Adaptation, 2020. State and Trends in Adaptation Report 2020. Available at:
https://gca.org/reports/
IEA, 2021(a). Net Zero by 2050. A Roadmap for the Global Energy Sector. Available at:
https://iea.blob.core.windows.net/assets/beceb956-0dcf-4d73-89fe-1310e3046d68/NetZeroby2050-
ARoadmapfortheGlobalEnergySector_CORR.pdf
IEA, 2021(b). Global EV Outlook 2021. International Energy Agency (IEA). Available at:
https://www.iea.org/reports/global-ev-outlook-2021
IEA, 2020 (a). Energy Investing: Exploring Risk and Return in the Capital Markets. Available at:
https://iea.blob.core.windows.net/assets/3d8c7c6f-bd94-43b8-94ef-
d30135c0c776/Energy_Investing_Exploring_Risk_and_Return_in_the_Capital_Markets.pdf
IEA, 2020 (b). Outlook for biogas and Biomass. International Energy Agency (IEA). Available at:
https://iea.blob.core.windows.net/assets/03aeb10c-c38c-4d10-bcec-
de92e9ab815f/Outlook_for_biogas_and_biomethane.pdf
IEA, 2021(c). Transport – Topics. Available at: https://www.iea.org/topics/transport
IEA, 2019. The Future of Rail. International Energy Agency (IEA). Available at:
https://iea.blob.core.windows.net/assets/fb7dc9e4-d5ff-4a22-ac07-ef3ca73ac680/The_Future_of_Rail.pdf
IRENA, 2021a. World Energy Transitions Outlook: 1.5°C Pathway. Available at: https://www.irena.org/-
/media/Files/IRENA/Agency/Publication/2021/Jun/IRENA_World_Energy_Transitions_Outlook_2021.pdf
54References
IRENA 2021b. Renewable Power Generation Costs in 2020. Available at:
https://www.irena.org/publications/2021/Jun/Renewable-Power-Costs-in-2020
Notre Dame Global Adaptation Initiative (ND-GAIN), 2021. ND-GAIN Country Index. Available at:
https://gain.nd.edu/our-work/country-index/
Savvidou, Georgia, Atteridge, Aaron, Omari-Motsumi, Kulthoum and Trisos, Christopher H., 2021. Quantifying
international public finance for climate change adaptation in Africa. Available at:
https://www.tandfonline.com/doi/full/10.1080/14693062.2021.1978053
SHC, 2021. Solar Heat Worldwide 2021. Solar Heating & Cooling Programme (SHC). Available at:
https://www.iea-shc.org/solar-heat-worldwide
Strategy&, 2021. Electric Vehicle Sales Review Q3. Available at:
https://www.strategyand.pwc.com/de/en/industries/automotive/electric-vehicle-sales-review-2021-q3.html
UNEP, WEF, ELF, 2021. State of Finance for Nature. United Nations Environment Programme (UNEP), World
Economic Forum (WEF), The Economics of Land Degradation (ELD). Available at:
https://www.unep.org/resources/state-finance-nature
United Nations Environment Programme (UNEP), 2016. The Adaptation Finance Gap Report. Available at:
https://www.researchgate.net/publication/307476564_The_Adaptation_Finance_Gap_Report_2016
United Nations Environment Programme (UNEP), AMCEN, Climate Analytics and African Climate Finance Hub,
2014. Africa’s Adaptation Gap 2. Technical Report. Available at:
https://climateanalytics.org/media/africa_adaptation_gap_2014_1.pdf
55Contact –
CPI: climatepolicyinitiative.org
The Lab: climatefinancelab.org
USICEF: usicef.org
Global Landscape of Climate Finance:
climatefinancelandscape.org
@climatepolicy
@climatepolicyinitiativeYou can also read


