ENVIRONMENTAL ASPECTS OF PHOTOVOLTAIC SOLAR POWER - The New Zealand Context - CORE
←
→
Page content transcription
If your browser does not render page correctly, please read the page content below
ENVIRONMENTAL ASPECTS
OF PHOTOVOLTAIC SOLAR
 POWER
 The New Zealand Context

 Luke Schwartfeger and Allan Miller

 EEA Conference & Exhibition 2015, 24 - 26 June, Wellington
Abstract

Photovoltaic (PV) systems have been utilised around the world for economic and
environmental benefits; they allow the owner to produce their own electricity and operate
with zero emissions, reducing the electricity sector’s impact on the environment. However
when examining the life cycle of the photovoltaic system (cradle to grave), the manufacturing
process, transportation and disposal of the system have associated emissions and other
environmental impacts.
Recently New Zealand has seen rapid growth in the installation of grid connected PV solar
systems despite the economics of PV systems to individual households and to New Zealand
being unclear. Research by the GREEN Grid project shows a variety of reasons why people
install PV systems, including increased independence from electricity suppliers, insulation
from further power price rises, and the chance to try out an innovative technology.
Environmental concerns do not feature highest amongst the reasons for the early adopters in
New Zealand to install PV. Despite this finding, the public conversation of PV and its
environmental benefit has grown over the last few years, and at a national level policies have
been mooted to encourage PV to assist New Zealand in reaching its 90% renewable
electricity target.
PV might aid New Zealand in two major ways: (1) contributing to the country’s renewable
electricity generation and (2) reducing greenhouse gas (GHG) emissions. It is prudent to be
realistic about how PVs are produced and integrated into the New Zealand grid from the
environmental perspective. This paper first covers the different types of photovoltaic panels
that are currently available and their corresponding manufacturing methods, as well as other
life cycle stages. Secondly PV systems will be viewed in the New Zealand context,
specifically how they offset GHG emissions, which will be quantitatively affirmed by foreign
life cycle assessments.
The paper concludes that PV leads to a reduction in New Zealand’s GHG emissions.
However, PV’s potential to minimize New Zealand’s GHG emissions is very limited for the
following reasons: (1) the relatively small contribution from electricity generation to New
Zealand’s overall GHG emissions; (2) PV’s very small contribution to GHG reduction in
electricity generation; and (3) limited scope for GHG reduction into the future. There are
other environmental impacts that are localised to the area of panel manufacture, and which
New Zealand may not see. In addition there are issues related to end-of-life and disposal of
panels. PV technology is however changing rapidly, and it is likely that panels with higher
efficiencies will be available in approximately 10 years, which may make PV more attractive
to New Zealand.

 1
1. Introduction
A major driver for the recent boom in the photovoltaic (PV) solar industry has been financial
incentives provided by various governments to install PV solar to combat climate change.
From this boom the cost of PV solar has been significantly reduced, making it financially
viable in locations where it was previously not. Although the national economic benefit of
PV in New Zealand has not been clear, it has not stopped some people and companies
adopting it. The rate of uptake over the last year has been a constant 0.94 MW/month, and in
that time has increased by a factor of 2.441 [1]. With no set feed-in tariff legislation, the
economic viability of PV in New Zealand is still in question.
While the reason for governments incentivising PV solar systems internationally is primarily
for the environment, this is not as high on the list for most New Zealanders. Here consumers
appear to be looking for greater self-sufficiency of energy supply and insulation from future
electricity price rises [2]. Nevertheless, environmental considerations have been discussed at
a national level. For example, in the 2014 election year PV solar was promoted in the energy
policies of some political parties [3]. However, similar to the question of national economic
benefit, the environmental benefits to New Zealand are unclear [4].
This paper addresses the environmental aspects of PV solar and relates those to New Zealand
in the near future (up to five years). This timeframe was chosen as the industry is changing
rapidly, and is likely to change vastly after this time, especially with regard to PV panel
efficiency, technology types, and manufacturing processes. With the fluidity of the PV solar
industry, availability of various technology types and increased spread of manufacturing
locations, determining the exact environmental impacts associated with the installation of PV
is difficult. The approach taken in this paper is to briefly introduce the major PV panel
technologies and describe their life cycles. The paper then discusses the major environmental
impacts from the life cycle stages, with results of life cycle assessments on PV systems
installed overseas summarised. This is to provide an indication of what the impact might be
in New Zealand. Finally the New Zealand context will be explored with the goal of
determining the actual benefit of PV solar for New Zealand in terms of meeting New
Zealand’s renewable energy and Greenhouse Gas (GHG) emission targets.

2. PV Panel Technologies
A typical PV solar system is comprised of PV panels, which convert the sun’s radiation to
electrical energy, the associated panel mounting hardware and cabling, and an inverter. The
latter optimally matches and converts the panels’ direct current (DC) electrical output to
alternating current (AC) which is fed into the AC power system of the home and grid. The
key component that converts the sun’s radiation to electrical energy is the PV panel, and it is
this component where much of the cost reduction has taken place in the industry in the last 10
years. It is also where major research and development efforts are focused at present, and
where most of the energy of production of a PV system is embodied. While the inverter is a
key component in matching panels’ output to the grid, this paper focuses on PV panels. The
rest of the system, including the inverters, wiring, and mounting hardware, is referred to as
the balance of system (BOS).

1
 January 2014 to January 2015

 2
The PV industry has a broad range of technologies for PV panels. They can be classified by
generation as follows:
 1. First generation: mature technology which has been in mass production for a number
 of years;
 2. Second generation: technology that has entered production and the supply chain more
 recently than the first generation as a competing technology, although it has a much
 lower production capacity; and
 3. Third generation: very new technology which is still in research and development or
 possibly as small scale manufacture, but not in mass production.
Table 1 summarises the main technology types. This paper focuses on first and second
generation panels only, as they are likely to comprise the major technologies installed in New
Zealand over the next five years. History shows that the financial investment and amount of
time to form the supply chain for a brand new technology is significant. Hence the
installation of major quantities of third generation panels in New Zealand is not expected to
be seen in the next five years. All panels considered are used, or can be used, for residential,
commercial and industrial scale systems.
 Table 1: Photovoltaic Panel Technology Types [5] [6]
 Technology Type &
Gen. Specific Technologies
 Information
 Crystalline Silicon (c-Si) Mono-crystalline silicon (also called single-crystalline)
 st
 1
 90% of 2013 global production
 [7] [8] Multi-crystalline silicon (or polycrystalline)

 Cadmium telluride thin film technology (CdTe)
 Thin Film

 2nd 10% of 2013 production Copper indium gallium (di) selenide thin film technology (CIGS)
 Manufacturing capacity is
 expanding [9] [10] [11] [12]
 Amorphous silicon

 3rd / Organic, dye-sensitized, quantum dot / concentrator based, multi-
Other junction

Of the specific technologies summarised in Table 1, mono and multi crystalline silicon panels
are investigated further due to their market dominance, and CdTe and CIGS are also
investigated further due to expanding manufacturing capacities for these technologies.
Amorphous silicon is not covered. Table 2 gives comparisons of the PV panel technologies
considered, while Section 3 discusses the life cycles of the technologies considered.
 Table 2: PV Panel Technology Types Overview.2
Technology Top Cell Efficiency Best Industrial Panel Efficiency Market Share
 Type (Achieved in 2014) [13], [14] (Achieved in 2012) [8] (2013) [7] / [8]
c-Si Mono- 25.0% 35.9% / 23.4%
 20.5%
c-Si Multi- 20.8% 55.0% / 66.2%
 CdTe 21.5% 12.1% 4.9% / 4.1%
 CIS/CIGS 21.7% 14.5% 2.1% / 3.2%

2
 A panel is made up of interconnected cells. The efficiencies presented above are for each of those accordingly.

 3
3. Life Cycle of Photovoltaic Panels
It is necessary to briefly examine the life cycles of PV panels to understand how these stages
contribute to their environmental impacts. Figure 1 outlines the generic process for all PV
technology types, with the highlighted steps being the major contributors to environmental
impacts. Each highlighted step is described in the following sub-sections. Having introduced
the life cycle, Section 4 discusses the environmental impacts of each of the stages that have
major environmental impacts.

 Raw
 Manufacture
 Material Freight Installation Operation End-of-Life
 of the panel
 Acquisition

 Figure 1: Life cycle stages of PV panels

3.1 Manufacturing
The manufacture of mono- and multi- crystalline silicon based panels involves energy
intensive purification and casting stages; the energy use is the major point to note [15] [16].
The production of CdTe and CIGS panels differs greatly from this as its process is the
deposition of the various materials onto a glass pane [17] [18] [19]. This process is less
energy intensive than the manufacturing of crystalline silicon based panels. The presence of
cadmium in CdTe panel is important when considering one of the environmental impacts. A
more detailed description of the manufacturing processes can be found in the Appendix.
3.2 Operation
Once the system has been commissioned it will generate energy and thereby reduce the load
from the grid of the house or business to which it is connected, and at times export excess
energy to the grid. Naturally generation only occurs during sunlight hours. The major
difference between the types of panels is the efficiency between them; the energy produced
per unit of area is greater from the more efficient panels.
3.3 End-of-Life
The end-of-life stage of PV panels generally occurs after 20 to 30 years of operation. This is
due to the generation capability of the panels decreasing over time; usually after 20 years
they have degraded to 80% of their original rating. However, being a relatively new industry
this has not been fully tested.
Each technology type has materials that are able to be reused so recycling the panels is an
option. Processes to dismantle and recover the materials of all panel types have been
developed across multiple scales (lab through to major processing facilities) [20] [21] [22].

 4
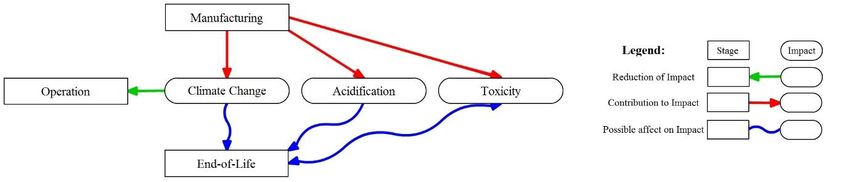
4. Environmental Impacts
The highlighted life cycle stages from the previous section and their environmental impacts
are covered in this section.3 In addition, assessments of lifecycles in terms of absolute
environmental impacts, such as grams (g) of CO2-e emitted, from studies conducted by other
researchers are summarised to give an indication of quantitative environmental impacts.4 The
three environmental impacts from each of the life cycle stages considered are divided into the
following categories (Reference [23] explains these in greater detail):
 1. Climate change – the warming of Earth’s atmosphere over recent human history due
 to GHGs being emitted from industrialisation, through the greenhouse effect. In the
 electrical energy system the main emitter of greenhouse gasses is fossil fuel
 generation, in particular coal, oil, diesel, and gas.
 2. Acidification – the increased acidity of soil and waterways through leeching or
 dumping of disposed waste (i.e. acid forming substances) or from acid rain. The main
 gases that cause acidification through acid rain are sulphur dioxide and nitrogen
 oxides which are emitted mainly from coal based generation.
 3. Toxicity – is the introduction of toxic or hazardous substances into an environment
 that may adversely affect the health of people or animals.
Figure 2 depicts the relationships between the stages and impacts.

 Figure 2: Stages and Impacts Relationships. Note that the End-of-Life stage’s effect on the impacts depends on how it is
 implemented (i.e. recycled or disposed of in a landfill).

4.1 Manufacturing
4.1.1 Climate Change and Acidification
As alluded to in the Section 3.1, manufacturing of PV panels, particularly c-Si, requires
substantial electrical energy. The countries where the bulk of the PV manufacturing industry
is located have high fossil fuel thermal generation (shown in Table 3) which emit significant
amounts of GHGs and acidifying gases. Hence the manufacturing stage of PV panels is the
main contributor to climate change and acidification.

3
 This is not intended to imply that the other stages or environmental impacts do not exist or are not important.
The stages covered are considered to be the most notable and relevant. Examples of stages not considered, but
which do create environmental impacts, are transport modes using fossil fuel and eutrophication (ecosystem
response to the addition of artificial or natural substances) resulting from emissions during the manufacturing
process.
4
 CO2-e is CO2 equivalents. As there are many greenhouse gases, to present them in a concise manner, their
impact as a GHG is compared to CO2, scaled accordingly, and shown as CO2-e.

 5
Table 3: Locations of PV manufacturing facilities and percentage of thermal based generation
 % thermal
 Location Technology type Source of figures
 generation (2012)
 China c-Si (mainly) 77.1 [24]
 Ohio, U.S.A. CdTe 84.0 [25]
 Malaysia CdTe 92.2 [24]
 Japan CIGS 85.8 [24]

Table 4 presents the electrical energy use by panel technology type as a percentage of energy
required to produce mono-crystalline silicon panels, from the study by Wild-Scholten [26],
which is consistent with the studies presented in [27] and [28]. The energy requirement for c-
Si is higher than thin film technologies due to the Siemens process, which produced 92.8% of
the solar (or higher) grade silicon in the world in 2013 [29]. As c-Si based panels are the
dominant panel type and the most energy intensive, the remaining discussion on climate
change is focused on c-Si.
 Table 4: Energy usage of manufacturing as a percentage of mono-crystalline [26] (2013)
 Mono-crystalline Multi-crystalline CIGS CdTe
 100% 58.6% 40% 22.9%

Through all the major stages of c-Si panel manufacturing, China is the dominant producer.
Chinese manufacturers supplied around 60% of cells, 70% of panels [8] [30] and 36% of the
solar grade silicon in 2013. Coincidental with the PV industry boom in China, less energy
efficient solar grade silicon purification technology has been installed in China [31].
The above discussion shows that c-Si panels, and indeed all panel types, are produced with
electricity from emission intensive generation. It is unavoidable that panels purchased have
contributed to the GHGs and acidification during their manufacture. From the environmental
perspective however, not all technologies or suppliers are equal.
An aspect to consider when examining environmental impacts is the geographical scale they
affect [23]. Climate change is considered to be a global impact; that is, the location of where
the GHGs are emitted does not greatly change the overall impact. For acidification, it is a
local and regional issue, as the deposition of the acid (through leeching or acid rain) is likely
to affect immediate or close by regions. A study conducted on a PV system both produced
and installed in China found that acidification was 1.5 times worse than the climate change
impact [31]. This is important for PV panels that are imported, as the effects of the
acidification are unseen at the location of installation and would not be offset. This suggests
that PV systems do not universally benefit the environment when geographical variability
between points of manufacture and installation is considered.

4.1.2 Toxicity
The concerns around toxicity from the manufacturing stages are from the management of the
by-products from production (c-Si) and exposure of staff during the construction of the
panels (c-Si and CdTe).
The purification of silicon uses hydrochloric acid (HCl), trichlorosilane (TSC) and
tetrachlorosilane (TES). Being an acid, HCl can cause irritation and burning of skin with
contact by operators. TSC is corrosive and can irritate the respiratory system; TES is similar.
HCl and TSC in the Siemens Process are enclosed, so staff have minimal exposure. TES is a
by-product and can be processed back into TSC for the silicon purification process. However
in 2009 the Washington Post outlined a case of dumping of TES in China [32]. TES reacts

 6
with water to form HCl which acidifies the waterways and soil [33]. In the case outlined by
the Washington Post, the dumping affected the health of local residents and livestock
downstream of where the dumping occurred. The reason the TES was not being re-processed
was due to the equipment being relatively expensive. In reaction, the Chinese Government
required that 98.5% of TES must be recycled, and purchasers of solar grade silicon
questioned their suppliers as how they were dealing with the TES.
With regard to CdTe thin film production, cadmium (Cd) is carcinogenic and can interfere
with lung, liver and kidney health [34]. In the manufactured product, Cd in the thin film
panels could be a concern in two ways: (1) exposure during the manufacturing process or (2)
leeching from the panel if disposed of in a landfill. The first is unlikely as the deposition
occurs in closed units, minimising exposure to staff. Regarding leeching after disposal,
testing of the panel’s leeching levels is conducted, and is required to meet a standard.
Another possible case is the release of Cd through fires burning the panels although the
chance of this is small [35].
4.2 Operation
As a PV system generates electricity, it offsets the energy required from the grid. Hence it
will avoid emissions in proportion to the energy it produces by some factor. It is common
when evaluating the avoided emissions to use a country’s average electricity grid mix GHG
emission factor (g CO2-e/kWh).5 Two metrics to assess this are:
 - GHG emissions payback period i.e. the number of years required for the PV system to
 operate for it to offset the emissions required to manufacture it; and
 - A direct comparison between the g CO2-e/kWh of the electricity mix and the PV
 system.
The issue with using the average electricity generation mix is the inherent assumption that the
energy produced from the PV system proportionally offsets the average generation mix by
fuel type in the grid. For countries dominated by fossil fuel thermal generation, this may be
appropriate. However for countries whose electricity mixes are highly renewable, this may do
PV a disservice by reducing its perceived benefit, even though PV may predominantly offset
fossil fuelled thermal generation. In New Zealand’s case, with a large proportion of
renewable generation, hydro storage and relatively little of fossil fuelled generation, an
argument can be made to show that the use of the average generation mix is not appropriate.
This is detailed in the Section 5.1.
4.3 End-Of-Life
PV panels at the end of their life are typically dealt with by either recycling the panels or
disposing of them in a landfill. Recycling reduces the environmental impacts of panels at the
end of their life. If they are sent to the landfill, practically no extra emissions of GHGs or
acidifying gases result, however there is increased contribution to toxicity.
In general using recycled materials reduces the energy required in production, as early stages
of material acquisition and processing are avoided [36]. For example, recycling c-Si panels
avoids mining and reduces the energy intensive purification required. Two recent cases in the
world that have been a significant influence on the recycling of panels are the European
Union’s directive and First Solar’s collection and recycling program.

5
 For consistency and ease of comparison, the paper uses units of g CO2-e/kWh throughout. Other papers and
reports use units such as kt CO2-e/GWh for example, which are a factor of 1,000 lower than g CO 2-e/kWh.

 7
In August 2012 the European Union (EU) included PV panels in its directive on Waste
Electrical and Electronic Equipment (WEEE) in response to the intensive installation of PV
throughout the EU in the preceding decade [37]. This directive requires the PV industry to be
responsible for the disposal and recycling of the panels it produces. The CdTe manufacturer,
First Solar, was the first manufacturer to invest in the end of life of panels. They have a
collection and recycling program dedicated to dealing with panels they produce at the end of
their life [20]. This applies globally and is designed to take into account the discontinuation
of First Solar as a company itself.
4.4 Foreign Life Cycle Assessments
Life cycle assessments are conducted to determine specific absolute values of environmental
impacts such as g CO2-e for climate change. Although life cycles assessments are beyond the
scope of this paper, a review of studies by other researchers was conducted. Table 5 and
Table 6 show the key relevant results of these studies.
As the majority of the studies were on systems installed in locations with differing conditions
to New Zealand, a direct comparison between them and New Zealand cases is not accurate.
Aspects that differ between New Zealand and the foreign studies that need to be kept in mind
are the freight required, the disposal of the system and the temperature and solar irradiance of
the location. The annual irradiation in New Zealand ranges from 1,273 kWh/m2 (Dunedin)
through to 1,684 kWh/m2 (Nelson). Auckland, Wellington and Christchurch are between
1,400 and 1,500 kWh/m2 [38].6 These systems include the impacts of the BOS components.
 Table 5: c-Si Life Cycle Assessment Results. Lifecycle emissions are the total equivalent GHG emissions during the ’cradle
 to end of operation’ of the PV system. Unknown values are left blank.
 Lifecycle
 Annual
 Lifetime, emissions Made Install
 Study Type Year Irradiation, Eff. %
 years g CO2-e / in Location
 kWh/m2/yr.
 kWh
 [27] Si 2006 1700 20 14% 167 EU EU

 [39] Mono 2009 1273 - 1684 30 52 – 71 GER NZ

 Mono 38.1 EU EU
 14.8%
 Mono 81.2 CHI EU
 [26] 2013 1700 30
 Multi 27.7 EU EU
 14.1%
 Multi 49.1 CHI EU

 [31] Multi 2014 1300 25 16% 50.9 CHI CHI

6
 Note that annual irradiation (kWh/m2/yr) is the annual accumulated irradiance (W/m2)

 8
Table 6: CdTe and CIGS Life Cycle Assessment Results. Lifecycle emissions are the total equivalent GHG emissions during
 the entire lifecycle of the PV system.
 Lifecycle
 Annual
 Life time emission Made Install
 Study Type Year Irradiation, Eff. %
 years g CO2-e / in Location
 kWh/m2/yr.
 kWh
 [27] 2006 1700 20 9% 48 EU EU

 15.8 EU EU
 [26] CdTe 2013 1700 30 11.9%
 20.1 CHI EU

 [40] 2013 1810 30 11.2% 15.1 MAL MAL

 [27] 2006 1700 20 11% 95 EU EU

 [41] 2009 1825 30 9% 30 GER SPN
 CIGS
 21.4 EU EU
 [26] 2013 1700 30 11.7%
 27.6 CHI EU

 Note – EU: Europe; CHI: China; MAL: Malaysia; GER: Germany; SPN: Spain

Over time all technologies’ life cycle emissions have decreased. Although monocrystalline
has the highest efficiency, this comes at the cost of higher life cycle emissions. Silicon based
panels contribute significantly larger amount of GHG emissions than CIGS and CdTe panels.

5. Photovoltaic Systems in New Zealand
This section examines how the energy produced from PV systems offsets other generation,
which is important to know in order to understand PVs GHG payback time. The reasons PV
would be considered in New Zealand are also discussed, as well as the benefit PV has
provided to date. Only GHG emissions (i.e. climate change) will be covered and the content
is based on the perspective of New Zealand as a whole, not as individuals or groups.
5.1 Operation of PV and GHG Offset in New Zealand’s Power System
PV is effectively a negative load, reducing load at the point where it is connected. Therefore,
the required energy from the grid is reduced and the type of generation it offsets determines
the GHG emissions offset by PV. As mentioned earlier, one method commonly used to assess
PV’s impact on GHG emissions of a country is the proportional offset of all generation. The
second case is New Zealand specific; the offset of gas generation. The rationale for this is
outlined below.
Both geothermal and coal based generation is relatively constant during the generating hours
of PV. Wind generation is dependent on the weather, generating whenever there is suitable
wind, and is unable to be dispatched to meet demand. Since PV reduces the demand, the
generation types stated are likely to operate in the same manner as if the PV system(s) were
not present.
Hydro and gas (both open and combined cycle) are the remaining types of generation to
consider. Both vary almost constantly with demand throughout the day, and will therefore be
reduced by the load reduction brought about by PV. The ideal case for PV’s generated energy
is to offset gas, as this would decrease the GHG emissions considerably more than the overall
proportional offset case (that being an electricity mix of predominantly renewable energy
with some fossil fuel thermal). At first glance, if hydro was offset, this would reduce or even
reverse the benefit of PV panels. However, in the short-term (hours to a few days) in
 9
offsetting hydro, a small amount of energy, as water, is stored in the hydro reservoirs, which
is able to be used at a later time. When it is used at a later time it will offset fossil fuel based
thermal generation, and most probably gas generation. It is therefore concluded that PV
primarily offsets gas generation, if not directly, then indirectly via short-term hydro storage.7
The New Zealand grid’s overall proportional emissions factor in 2012 was 171 g CO2-e/kWh.
The emission factor for gas generation is 430 g CO2-e/kWh which is around 2.5 times higher
than the electricity mix’s factor [42] [43]. These emission factors are greater than the life
cycle emissions shown in Table 5 and Table 6. Hence it is concluded that PV in New Zealand
has a positive impact on the world’s GHG emissions, noting that the emissions factors for gas
and the New Zealand generation are operational figures only, and do not include the life cycle
embodied environmental impacts of the existing gas plants.
5.2 Environmental Reasons for PV
The national targets of emissions and renewable energy levels might be considered major
nationwide factors for installing roof-top grid tied systems. For New Zealand these targets
are:
 - 2020 Emissions Target: Net Emissions at 95% of the level in 1990 [44]
 - 2025 Renewables Target: 90% of the energy produced in 2025 is to be from
 renewable sources (hydro inflows considered) [45]
 - 2050 Emissions Target: Net Emissions target at 50% of the level in 1990 [44]
The question is: what contribution PV can make toward these? To answer this, the recent
history of PV’s avoided emissions and generated energy in New Zealand is presented,
followed by an explanation of the targets.
The avoided emissions of PV generation (g CO2-e) are calculated according to:

 = × × × 8,760 (Eq. 1)

where
 is the emissions factor of the generation offset by PV (g CO2-e/kWh),
 is the installed PV capacity (kW),
 is the capacity factor of PV generation, and
 8,760 is the number of hours in a year
This was applied on a per region basis (which accounts for different capacity factors by
region and different levels of PV uptake), and both the overall grid’s and gas emissions
factors were used (as discussed in the Section 5.1). The installed PV capacity for the year was
taken as the amount at the beginning of the year (i.e. for all of 2012, the 1st January installed
capacity values were used). This discounts any generation installed during the year, making
the results an underestimate. The 2013 emission factors were used for 2014 and 2015, as
specific values for those years were not available at the time of writing.

7
 It is noted that gas, and coal, fulfil a ‘firming’ role for renewable generation (hydro, wind, and in the future
PV). It is expected that coal generation will be decommissioned in the next decade, during the life of PV panels
installed today. Hence it seems likely that gas will be the primary fuel for firming in the future.

 10
Figure 3 shows the installed capacity and avoided emissions. Although the installed capacity
of PV is increasing, the absolute value for avoided emissions is insignificant when
considering the overall emissions of the electricity sector. Using the case in which gas
generation is offset, the avoided emissions would be 5.7 Gg CO2-e (2014) compared to the
emissions of the electricity sector, which were 5,476 Gg CO2-e in 2014 [43]. 8 Note that the
life cycle emissions of the PV systems are not accounted for, making the values in Figure 5
an overestimate.
 20 14
 18
 12
 16
 14 10
 MW Installed

 12

 Gg CO2-e
 8
 10
 8 6

 6 4
 4
 2
 2
 0 0
 2012 2013 2014 2015
 Year
 MW Installed Avoided Emissions of Electricity Mix (Gg) Avoided Emissions of Gas (Gg)

 Figure 3: Installed Capacity and Avoided Emissions to Date9 [42] [43] [1]

Figure 4 shows the GHG emissions history and targets for New Zealand (green and blue) and
the New Zealand electricity sector (pale orange). The gross emissions have been plotted to
put the electricity generation emissions into perspective, and to show the slopes required to
achieve the various targets.10 The net emissions are plotted to put the emissions targets into
perspective. Note that the contribution from electricity is around 10% of New Zealand’s gross
emissions over the presented time period.

8
 Gg, giga-gram; equivalent to kt
9
 The 2014 emission factors used for 2015 values.
10
 Gross emissions refers to all GHG emissions, whereas net emissions refers to gross emissions less GHG
absorbers such as forestry.

 11
90
 Pg CO2-e (Petagrams ) 80
 70
 60
 50
 40
 30
 20
 10
 0
 1985 1990 1995 2000 2005 2010 2015 2020 2025 2030 2035 2040 2045 2050 2055
 Year
 Gross Emissions of New Zealand (Pg) Net Emissions of New Zealand (Pg)
 Electricity Generation Emissions (Pg) 2020 Target
 2050 Target Year of setting 2020 Target

 Figure 4: Emissions history and future targets [43] [46] [47]11

Given the relatively small contribution from electricity generation to New Zealand’s overall
GHG emissions and PV’s existing very small contribution to GHG reduction, it is clear that
PV’s potential to minimize New Zealand’s GHG emissions is limited. Avoiding the
development of new fossil fuelled thermal generation is a way in which PV systems in New
Zealand might aid future GHG emissions. It is also clear that even a reduction of electricity
generation emissions to zero cannot solely meet New Zealand’s GHG targets.
Figure 5 shows New Zealand’s percentage of generation that is renewable and the 90%
renewables target (note the y-axis starting values). With the increase in geothermal
generation [48] [49] capacity as well as the decrease in coal generation [50] the renewables
capacity proportion has increased. However the hydro inflows, load and geothermal capacity
largely determine the overall percentage.
 100% 42000

 95% 40000
 Renewable Gneeration %

 90% 38000
 36000
 85%
 34000
 GWh

 80%
 32000
 75%
 30000
 70% 28000
 65% 26000
 60% 24000
 1985 1990 1995 2000 2005 2010 2015 2020 2025 2030
 Year
 Year of setting 2025 Target 2025 Target Renewable Generation % Consumption

 Figure 5: Renewable generation percentage, electricity consumption and target [42]

11
 Pg, Peta-grams; equivalent to Mt

 12
It is difficult to say how New Zealand will proceed to this target or how PV may play a role.
At least 1.6 GW of potential wind generation capacity and over 300MW of geothermal
generation capacity are currently consented [51]. However with flat demand over the last few
years shown in Figure 5, constructing any new generation at present does not appear to be
likely. Instead of increasing the capacity of renewable generation, another option is to
manage existing resource and load in a way that decreases thermal generation. PV systems
could play a role in this with some amount of storage to better manage the intermittency of
the energy production.
In the future PV could be built to cater to future increases in demand, decreasing the possible
use of thermal generation to supply this. However in the short term PVs contribution to New
Zealand’s targets is likely to be minor.
5.3 Comparisons
When assessing different renewable generation options, it is of interest to compare the GHG
emissions of different generation options. This sub-section first compares different PV
technologies, in terms of GHG payback, and then compares PV with wind and geothermal, as
absolute CO2 emissions.
In order to compare PV technologies it was necessary to adjust the life cycle emission factors
from Table 5 and Table 6. The values used are based on both Chinese and European
manufacturing, and installation in southern Europe.12 The values were adjusted to
compensate for the difference between the study’s installation location and Auckland. The
adjustments were made to the capacity factor of Auckland, and based on the irradiance of the
locations and the efficiencies of each technology type. Table 7 shows the adjusted capacity
factors used. The varying performance of each technology type with temperature was not
accounted for, although the degradation of performance over time was accounted for.13
 Table 7: Adjusted Capacity Factors
Base Cap. Factor Mono c-Si Multi c-Si CdTe CIGS
 15.5% 13.4% 12.8% 10.8% 10.6%

Figure 6 shows estimates for the GHG emissions payback period for New Zealand installed
panels. These are approximate values, as they rely on studies of installations in other
countries, albeit translated to New Zealand, as discussed above. The purpose, however, is to
generally highlight the difference between:
 1. GHG payback of different panel technologies;
 2. panels manufactured in Europe compared to China (where the majority are
 manufactured); and
 3. a pure offset of gas generation in New Zealand versus offsetting the average
 generation mix (noting that the authors believe that the offset is predominantly gas,
 making the GHG payback about 2.5 times faster).
The result shows that CdTe would be the most beneficial environmentally (due to its lower
energy requirements for production).

12
 Data for these comparisons was exclusively from [28] (in Table 5).
13
 The 30 year lifetime degradation was 1% per year, consistent with the standard 80% limit after 20 years.

 13
CIGS Offset Class and Technology Type Gas Offset CdTe c-Si (Multi) c-Si (Mono) European Manufactured CIGS Elec. Mix Offset Chinese CdTe Manufactured c-Si (Multi) c-Si (Mono) 0 2 4 6 8 10 12 14 16 18 20 Year Figure 6: GHG Emissions Payback Period Table 8 displays the life cycle CO2 emissions of geothermal, wind and multi-crystalline PV generation (operation emissions are not included).14 The previous work in this section was used to derive the figure for PV.15 As shown, the life cycle of PV, even excluding operation, creates substantially more CO2 emissions than wind and geothermal, and therefore implied GHG emissions. Table 8: Life Cycle CO2 Emissions (avoided emissions during operation are excluded) Geothermal Wind PV (Multi c-Si) 5.6 g CO2/kWh [52] 3.0 g CO2/kWh [52] 50.7 g CO2/kWh Life cycle assessments that enable strict comparison between different generation options are complex and require extensive investigation. This is an approximate comparison to give an indication. To obtain a true representative perspective on a PV system in New Zealand, it is recommended that full life cycle assessments of PV operating in New Zealand be performed. 6. Discussion and Conclusion Assessment of the life cycles of technologies is a useful way to understand how they impact the environment, both positive and negative, as well as at different geographical scales. It is however a complex task, requiring thorough investigation if all impacts are to be understood. In this respect, the research undertaken for this paper has provided valuable insight to GREEN Grid researchers. Conclusions that can be made from this study of PV life cycles are: The PV life cycle stage that contributes the most environmental impact is the panel manufacture. This is due to the high energy inputs in combination with that energy being supplied by fossil fuel thermal based generation, resulting in significant GHG 14 For geothermal generation, the operational emissions (120 g CO 2-e/kWh) are not included as they are considered fugitive emissions and excluded from New Zealand’s greenhouse gas emissions according to the Intergovernmental Panel on Climate Change (IPCC) guidelines [53]. 15 The PV life cycle emissions include GHG’s other than CO 2. From the findings of a Chinese based study the CO2-e of the PV systems were scaled down by 15% [54] to give CO2 figures. 14
emissions. Panels used in New Zealand, but manufactured elsewhere, do contribute to global warming and more localised environmental degradation such as acid rain. The end-of-life stage is particularly difficult to detail, as the long lifetime of PV systems makes it easy to disregard it at the time of install. Furthermore, being a relatively new technology, not many panels have reached end-of-life to date. Some companies and jurisdictions are taking steps towards dealing with this future problem. For New Zealand, the issues will stem from the distance from major manufacturing centres. Disposal options include shipping the panels to the centres with recycling capabilities, to building a national recycling centre, to simply (but not necessarily simple for the environment) disposing of them in a landfill. Studying the impact of PV during the operation phase of its life cycle is also a complex task. New Zealand is fortunate to have high renewable generation already, and hence the case for PV is less clear than countries with far less renewable generation. However it is concluded that: In New Zealand’s power system, PV will predominantly offset gas fired thermal generation, indirectly through initially offsetting hydro generation, which would then offset gas generation at a later time. Despite this making PV more attractive to New Zealand in terms of reducing GHG emissions, the benefit of PV to reducing New Zealand’s GHG emissions is still small. This is because: (1) uptake of PV is low in New Zealand to date; and (2) wind and geothermal generation have the potential to reduce GHG emissions by more because they have far better capacity factors. Moreover, GHG emissions from New Zealand’s electricity sector are low compared to other sectors. PV might have a small positive impact on a sector that already has a relatively small impact, marginalising its benefit even more. Hence PV as a major component to deal with New Zealand’s GHG emissions and environmental impacts at this point in time is unlikely. PV also has a high GHG payback time than wind and geothermal. While this is not directly relevant to New Zealand meeting its own GHG emission obligations, it is something that warrants consideration if New Zealand considers subsidies for certain technologies. There are new technologies in production that have the potential to provide greater benefit than the existing crystalline-silicon panels, such as thin film technologies. While GHG payback time lower in New Zealand, they have other potential issues. For example, cadmium, which is used in some thin film PV technology, is carcinogenic. While it is bound in a relatively benign form in the PV panels, it may cause issues with leeching after panel disposal (this is as yet unknown given the relative low age of the PV industry and that this is a relatively new technology) or fires burning the panels and releasing Cadmium. However European WEEE directives are leading to more recycling and companies such as First Solar are undertaking panel collection programmes for CdTe panels. The overall conclusion of the paper is that PV does lead to a reduction in New Zealand’s GHG emissions. However PV’s potential to minimize New Zealand’s GHG emissions is very limited due to: (1) the relatively small contribution from electricity generation to New Zealand’s overall GHG emissions; (2) PV’s existing very small contribution to GHG reduction in electricity generation; and (3) limited scope for GHG reduction into the future. Moreover, the national economic benefit of PV is unclear. It is more costly than other forms of generation options, it offers only modest GHG benefits and has other non-trivial environmental harmful effects. However PV technology is changing rapidly, and it is likely 15
that panels with higher efficiencies will be available in approximately 10 years, which will
make PV more attractive to New Zealand.

Acknowledgement
The authors acknowledge the funding provided by the Ministry of Business Innovation and
Employment, Transpower, and the EEA for the GREEN Grid project that has enabled this
research to be carried out. They also acknowledge and thank the efforts of Gareth Wilson of
MBIE, Gari Bickers of Transpower, Emeritus Professor Pat Bodger, and Shreejan Pandey of
the EPECentre for their review of the paper.

 16
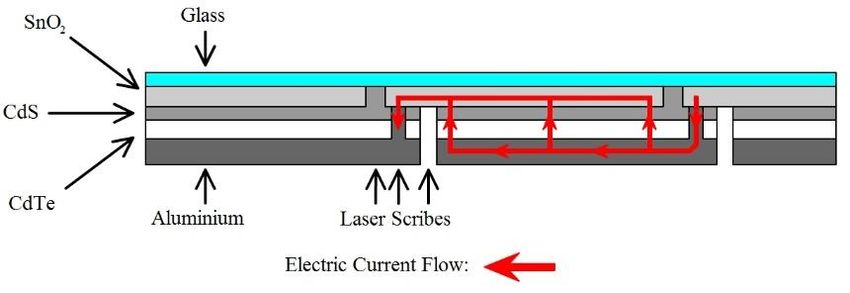
Appendix One
Crystalline Silicon (C-Si) Manufacturing Process
The silicon ore undergoes a carbothermic reduction which involves using a form of carbon as
a reductant to strip the oxygen atoms and produce molten silicon. Submerged-arc electric
furnaces are used to bring the reactants to 2000oC. The resulting silicon is called
metallurgical grade silicon (MG-Si) [15] [53].
Two dominant processes for purifying MG-Si into solar grade silicon (SG-Si) are the
Siemens process and Modified Siemens process. The former involves the addition of
hydrochloric acid to the MG-Si forming trichlorosilane (TCS). At a temperature of 1100oC
TCS is in a gas state and silicon is deposited onto silicon rods already within the reactor.
Tetrachlorosilane (TES) is a by-product of this process and is unsuitable for the formation of
silicon. It can be fed back into an earlier stage of the process to be recycled. The Modified
Siemens Process [54] also involves HCl, TCS, TES and MG-Si however a series of chemical
reactions occur to produce silane gas (SiH4). The silane gas is then deposited on heated rods
in the absence of oxygen (pyrolysis) and only requires a temperature of 800oC compared to
1100oC required for TCS.
For mono-crystalline panels, the SG-Si is melted under a vacuum or inert argon gas
atmosphere, and a seed crystal is planted in the molten silicon. The molten silicon begins to
crystalize around the seed and a cylinder of mono-crystalline is drawn out of the melt. For
multi-crystalline panels, the SG-Si is melted and, through temperature controlled cooling in a
quartz crucible, a multi-crystalline block is formed [16].

CdTe and CIGS Manufacturing Process
The manufacturing processes for CdTe and CIGS panels are similar. They consist of a series
of stages in which materials are deposited onto a glass pane with intermittent scribing stages
[17] [19]. There are a number of deposition methods ranging from high temperature (>500 oC)
to low temperature (
References

[1] A. Miller, M. Hwang and A. Wood, “Economics of Photovoltaic Solar Power and Uptake in New Zealand,” in EEA
 Conference & Exhibition 2015, Wellington, 2015.
[2] R. Ford, J. Stephenson, M. Scott, J. Williams, B. Wooliscroft, G. King and A. Miller, “Photovoltaic (PV) Uptake in NZ:
 The story so far,” Centre for Sustainability, University of Otago, Dunedin, 2014.
[3] The Green Party of Aotearoa New Zealand, “Solar School,” The Green Party of Aotearoa New Zealand, 27 1 2015.
 [Online]. Available: https://www.greens.org.nz/policy/smarter-economy/solar-schools. [Accessed Apr 2015].
[4] A. Smith, “Sunny Money - Are grid-tied solar photovoltaic systems a good investment,” Consumer NZ, pp. 20-22,
 November 2013.
[5] IT Power Australia Pty Ltd; Southern Perspectives Ltd, “Assessment of the Future Costs and Performance of Solar
 Photovoltaic Technologies in New Zealand,” New Zealand Ministry of Economic Development, Wellington, 2009.
[6] P. Malbranche, “Overview of PV Technologies,” 2014. [Online]. Available:
 http://www.iea.org/media/workshops/2014/solarelectricity/philippemalbranchepvmoduletechnologyoverview.pdf.
 [Accessed Mar 2015].
[7] S. Mehta, “Global 2013 PV Module Production Hits 39.8GW; Yingli is the Shipment Leader,” GTM Research, 23 Apri
 2014. [Online]. Available: http://www.greentechmedia.com/articles/read/Global-2013-PV-Module-Production-Hits-
 39.8-GW-Yingli-Leads-in-Production-a. [Accessed Dec 2014].
[8] Fraunhofer ISE, “Photovoltaics Report,” Fraunhofer ISE, Freiburg, 2014.
[9] C. Roselund, “First Solar to expand manufacturing capacities, but no yieldco,” PV Magazine, 6 Nov 2014. [Online].
 Available: http://www.pv-magazine.com/news/details/beitrag/first-solar-to-expand-manufacturing-capacities--but-no-
 yieldco_100017088/#axzz3TsPt2dnN. [Accessed Mar 2015].
[10] K.-E. Stromsta, “Solar Frontier looks overseas in downstream push,” NHST Media Group, 06 Mar 2015. [Online].
 Available: http://www.rechargenews.com/solar/1393737/solar-frontier-looks-overseas-in-downstream-push. [Accessed
 Mar 2015].
[11] M. Iwata, “Japan's Solar Frontier eyes expansion into U.S.,” MarketWatch Inc., 28 Sept 2014. [Online]. Available:
 http://www.marketwatch.com/story/japans-solar-frontier-eyes-expansion-into-us-2014-09-28. [Accessed Mar 2015].
[12] Solar Frontier K.K., “Advanced CIS Production Lines Feature in New Solar Frontier Plant as Construction Proceeds on
 Track,” Solar Frontier K.K., 5 Nov 2014. [Online]. Available: http://www.solar-
 frontier.com/eng/news/2014/C038171.html. [Accessed Mar 2015].
[13] National Renewable Energy Laboratory (NREL, USA), “Best Research-Cell Efficiencies - 18/12/2014,” National
 Renewable Energy Laboratory (NREL, USA), 2014.
[14] M. A. Green, K. Emery, Y. Hishikawa, W. Warta and E. D. Dunlop, “Solar cell efficieny tables (Version 45),” Progress
 in Photovoltaics, vol. 23, pp. 1-9, 2015.
[15] B. Ceccaroli and O. Lohne, “Solar Grade Silicon Feedstock,” in Handbook of Photovoltaic Science and Engineering,
 2nd ed., A. Luque and S. Hegedus, Eds., Chichester, Wiley, 2011, pp. 169-217.
[16] H. Robriguez, I. Guerrero, W. Koch, A. L. Endros, D. Franke, C. Habler, J. P. Kalejs and H. J. Moller, “Bulk Crystal
 Growth and Wafering for PV,” in Handbook of Photovoltaic Science and Engineering, 2nd ed., A. Luque and S.
 Hegedus, Eds., Chichester, Wiley, 2011, pp. 218-264.
[17] A. Bosio, D. Menossi, S. Mazzamuto and N. Romeo, “Manufacturing of CdTe thin film phtovoltaic modules,” Thin
 Solid, vol. 519, no. 21, pp. 7522-7525, 2011.
[18] W. N. Shafarman, S. Siebentritt and L. Stolt, “Cu(InGa)Se2 Solar Cells,” in Handbook of Photovoltaic Science and
 Engineering, Chichester, John Wiley & Sons, Ltd, 2011, pp. 546-599.
[19] W. A. Wohlmuth, “Thin Film CdTe Module Manufacturing,” in CS Mantech Conference, Tampa, 2009.
[20] V. M. Fthenakis and H. C. Kim, “CdTe photovoltaics: Life cycle environmental profile and comparisons,” Thin Solid
 Firms, vol. 515, no. 15, pp. 5961-5963, 2007.
[21] M. Marwede and A. Reller, “Estimation of Life Cycle Material Costs of Cadmium Telluride– and Copper Indium
 Gallium Diselenide–Photovoltaic Absorber Materials based on Life Cycle Material Flows,” Journal of Industrial
 Ecology, vol. 18, no. 2, pp. 254-267, 2014.
[22] PV Cycle, “SILICON BASED PV,” PV Cycle, 2013. [Online]. Available: http://www.pvcycle.org/pv-
 recycling/recycling-of-si/. [Accessed Mar 2015].
[23] K. Simonen, Life cycle assessment, London; New York: Routledge, 2014.
[24] U.S. Energy Information Administration, “International Energy Statistics,” U.S. Department of Energy, 2013. [Online].
 Available: http://www.eia.gov/cfapps/ipdbproject/IEDIndex3.cfm?tid=2&pid=2&aid=12. [Accessed Mar 2015].
[25] U.S. Energy Information Administration, “Ohio - State Profile and Energy Estimates,” U.S. Department of Energy, 27
 Mar 2014. [Online]. Available: http://www.eia.gov/state/?sid=OH. [Accessed Mar 2015].

 18
[26] M. de Wild-Scholten, “Energy payback time and carbon footprint of commercial photovoltaic systems,” Solar Energy
 Materials & Solar Cells, vol. 119, pp. 296-305, 2013.
[27] M. Raugei, S. Bargigli and S. Ulgiati, “Life cycle assessment and energy pay-back time of advanced photovoltaic
 modules: CdTe and CIS compared to poly-Si,” Energy, vol. 32, pp. 1310-1318, 2007.
[28] K. Bekkelund, “A Comparative Life Cycle Assessment of PV Solar System,” Dept. of Energy and Process Engineering,
 Norwegian University of Science and Technology, Trondheim, 2013.
[29] M. Munsell, “Polysilicon Capacity Growth to Accelerate, Enabling 85GW of Solar Panel Production in 2016,”
 Greentech Media, 14 Oct 2014. [Online]. Available: http://www.greentechmedia.com/articles/read/Polysilicon-
 Capacity-Growth-to-Accelerate-Enabling-85-GW-of-Solar-Panel-Pr. [Accessed Dec 2014].
[30] S. Metha, “Polysilicon 2015-2018: Supply, Demand, Cost and Pricing,” Greentech Media, 14 Oct 2014. [Online].
 Available: http://www.greentechmedia.com/research/report/polysilicon-2015-2018. [Accessed Dec 2014].
[31] Y. Fu, X. Liu and Z. Yuan, “Life-cycle assessment of multi-crystalline photovoltaic (PV) systems in China,” Journal of
 Cleaner Production, vol. 86, no. Jan, pp. 180-190, 2015.
[32] A. E. Cha, “Solar Energy Firms Leave Waste Behind in China,” The Washington Post, 9 Mar 2008.
[33] D. Mulvaney, “Solar Energy Isn't Always as Green as You Think,” IEEE Spectrum, 26 August 2014. [Online].
 Available: http://spectrum.ieee.org/green-tech/solar/solar-energy-isnt-always-as-green-as-you-think. [Accessed 22
 October 2014].
[34] W. D. Cyrs, H. J. Avens, Z. A. Capshaw, R. A. Kingsbury, J. Sahmel and B. E. Tvermoes, “Landfill waste and
 recycling: Use of a screening-level risk assessment tool for end-of-life cadmium telluride (CdTe) thin-film photovoltaic
 (PV) panels,” Energy Policy, vol. 68, no. May, pp. 524-533, 2014.
[35] V. M. Fthenakis, M. Fuhrmann, J. Heiser, A. Lanzirotti, J. Fitts and W. Wang, “Emissions and encapsulation of
 cadmium in CdTe PV modules during fires,” Progress in Photovoltaics, vol. 13, no. 8, pp. 713-723, 2005.
[36] M. Goe and G. Gabrielle, “Strengthening the case for recycling photovoltaics: An energy payback analysis,” Applied
 Energy, vol. 120, no. May-2014, pp. 41-48, 2014.
[37] P. Sinha, M. Cossette and J.-F. Menard, “End-of-Life CdTe PV Recycling with Semiconductor Refining,” in 27th
 European Photovoltaic Solar Energy Conference and Exhibition, Frankfurt, 2012.
[38] National Institute of Water and Atmospheric Research, “Solarview,” National Institute of Water and Atmospheric
 Research, 2015. [Online]. Available: http://solarview.niwa.co.nz/. [Accessed 2015].
[39] A. D. Moore, “Life Cycle Assessment (LCA) of a Solar Photovoltaic System Installed in Australia and New Zealand,”
 PE International, Perth, 2009.
[40] H. Kim, K. Cha, V. M. Fthenakis, P. Sinha and T. Hur, “Life cycle assessment of a cadmium telluride photovoltaic
 (CdTe PV) systems,” Solar Energy, vol. 103, pp. 78-88, 2014.
[41] A. Dominguez-Ramos, M. Held, R. Aldaco, M. Fischer and A. Irabien, “Prospective CO2 emissions from energy
 supplying systems: photovoltaic systems and conventional grid within Spainish frame conditions,” International
 Journal of Life Cycle Assessment, vol. 15, no. 6, pp. 557-566, 2010.
[42] Ministry of Business, Innovation and Employment, “Electricity - Data tables for electricity,” 19 December 2014.
 [Online]. Available: http://www.med.govt.nz/sectors-industries/energy/energy-modelling/data/electricity. [Accessed
 January 2015].
[43] Ministry of Business, Innovation and Employment, “Greenhouse gas emissions,” 19 Dec 2014. [Online]. Available:
 http://www.med.govt.nz/sectors-industries/energy/energy-modelling/data/greenhouse-gas-emissions. [Accessed Apr
 2015].
[44] Ministry for the Environment, “New Zealand's emissions reduction targets,” Ministry for the Environment, 31 Oct
 2014. [Online]. Available: https://www.climatechange.govt.nz/reducing-our-emissions/targets.html. [Accessed Mar
 2015].
[45] Ministry of Economic Development, “Developing our energy potential: New Zealand Energy Strategy 2011-2021,”
 Ministry of Economic Development, Wellington, 2011.
[46] Ministry of the Environment, “New Zealand's Greenhouse Gas Inventory 1900-2012,” 16 Apr 2014. [Online].
 Available: http://mfe.govt.nz/publications/climate/greenhouse-gas-inventory-2014/index.html. [Accessed Mar 2015].
[47] Ministry for the Environment, “New Zealand's Greenhouse Gas Inventory 1990-2013,” Ministry for the Environment,
 Wellington, 2015.
[48] Mighty River Power Ltd., “Ngatamariki Power Station,” Mighty River Power Ltd., Oct 2013. [Online]. Available:
 http://www.mightyriver.co.nz/Our-Business/Generation/Our-Power-Stations/Ngatamariki-Power-Station.aspx.
 [Accessed Mar 2015].
[49] Contact Energy Ltd., “Te Mihi Power Station,” Contact Energy Ltd., 2014. [Online]. Available:
 http://www.contactenergy.co.nz/aboutus/ourprojects/temihi. [Accessed Mar 2015].
[50] Genesis Energy, “Huntly Plant Description,” Genesis Energy, 2015. [Online]. Available:
 https://www.genesisenergy.co.nz/huntly-power-station-plant-description. [Accessed Mar 2015].
[51] New Zealand Wind Energy Association, “Consented Wind Farms,” New Zealand Wind Energy Association, [Online].
 Available: http://www.windenergy.org.nz/consented-wind-farms. [Accessed Mar 2015].

 19
[52] B. M. Rule, Z. J. Worth and C. A. Boyle, “Comparison of Life Cycle Carbon Dioxide Emissions and Embodied Energy
 in Four Renewable Electricity Generation Technologyies in New Zealand,” Environmental Science and Technology,
 vol. 43, no. 16, pp. 6406-6413, 2009.
[53] B. Xakalashe and M. Tangstad, “Silicon processing: from quartz to crystalline silicon solar cells,” in Southern African
 Institute of Mining and Metallurgy's Southern African Pyrometallurgy 2011 Conference, Johannesburg, 2011.
[54] D. Yue, F. You and S. B. Darling, “Domestic and overseas manufacturing scenarios of silicon-based photovoltaics: Life
 cycle energy and environmental comparative analysis,” Solar Energy, vol. 105, pp. 669-678, 2014.
[55] B. E. McCandless and J. R. Sites, “Cadmium Telluride Solar Cells,” in Handbook of Photovoltaic Science and
 Engineering, Chichester, John Wiley and Sons Ltd, 2011, pp. 600-641.
[56] Y. Yao, Y. Chang and E. Masanet, “A hybrid life-cycle inventory for multi-crystalline silicon PV moudle
 manufacturing in China,” Environmental Research Letters, vol. 9, no. 11, 2014.
[57] Intergovernmental Panel on Climate Change (IPCC), “2006 IPCC Guidelines for National Greenhouse Gas
 Inventories,” Apr 2007. [Online]. Available: http://www.ipcc-nggip.iges.or.jp/public/2006gl/. [Accessed Apr 2015].

 20
You can also read