INVESTMENT OPPORTUNITIES IN THE NEW ZEALAND SALMON INDUSTRY - February 2014
←
→
Page content transcription
If your browser does not render page correctly, please read the page content below
INVESTMENT
OPPORTUNITIES IN
THE NEW ZEALAND
SALMON INDUSTRY
February 2014
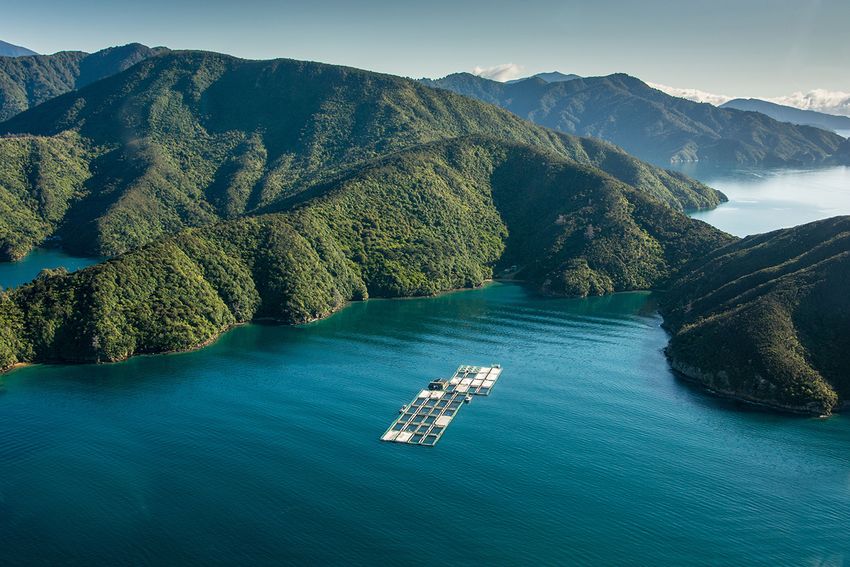
Cover image courtesy New Zealand King Salmon

                                                                                                                          Investment opportunities in the New Zealand                                           Salmon industry
                                                                                                                                                                                               Part of the Food & Beverage Information Project
                                                                                                                                                                                                                                  May 2012 v1.01

                                                                                                                                                                                                              www.foodandbeverage.govt.nz

                                               This information was prepared by Coriolis solely for the use of our client; it is not to be relied on by any third party without prior written consent.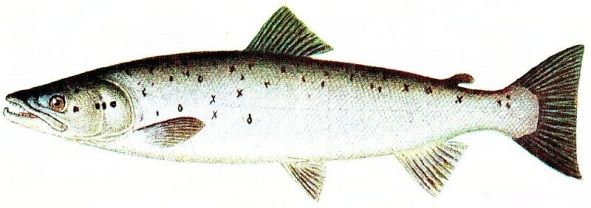
STAGE III
This document represents the third stage of a wider industry screen designed to identify, develop & highlight
emerging growth opportunities in New Zealand food and beverage exports for potential investors and other
interested parties

                         Stage I                                  Stage II             Stage III
                         Preliminary Screen                       Secondary Screen     Develop Opportunities

  Initial input                Met criteria                             Met criteria          Identified
   to process
                                 129                                       25                    20
     559

                                                                                             Explored in
                                                                                               depth
                                                                                                 3
                                                                                                               You are
                  See related Stage I & II document for details                                                 here
                  Available at www.foodandbeverage.govt.nz
                                                                                               Honey
                                                                                               Salmon
                                                                                                Spirits

PAGE 3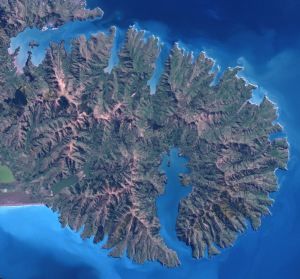
TABLE OF CONTENTS

Section                                                      Page

Contents                                                       4

Glossary of terms                                              5

Methodology & data sources                                     6

Summary & conclusions                                          7

    1. Salmon is an attractive product                         8

    2. Industry has achieved strong growth                    16

    3. Export markets are the prime driver of growth          31

    4. Strong hypothetical potential; unlikely in practice    38
GLOSSARY OF TERMS
This report uses the following acronyms and abbreviations

            ANZSIC    AU/NZ Standard Industry Classification
                 b    Billion
             CAGR     Compound Annual Growth Rate
                 e    Estimate
                  f   Forecast
               FOB    Free on Board
                FT    Full time
          HS Codes    Harmonised System Codes for commodity
                      classifications
                 m    Million
               n/a    Not available/not applicable
                NZ    New Zealand
          NZ$/NZD     New Zealand dollar
                PT    Part time
          S.H./N.H.   Southern/Northern Hemisphere
               T/O    Turnover
                  t   Tonne
           US/USA     United States of America
          US$/USD     United States dollar
                UK    United Kingdom

PAGE 5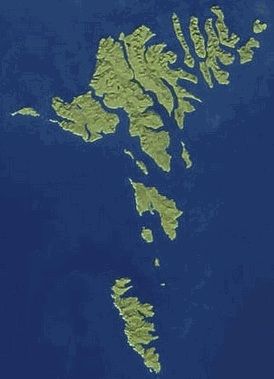
METHODOLOGY & DATA SOURCES
Data was from a variety of sources, and has a number of identified limitations

-        This report uses a range of information sources, both qualitative       -     Coriolis makes no representation, warranty or guarantee,
         and quantitative.                                                             whether express or implied, as to the quality, accuracy,
                                                                                       reliability, currency or completeness of the information
-        The numbers in this report come from multiple sources. While we               provided in the report.
         believe the data are directionally correct, we recognise the
         limitations in what information is available.                       -   All trade data analysed in all sections of the F&B Information
           -    In many cases different data sources disagree (e.g.              project are calculated and displayed in US$ (other than a few
                Statistics New Zealand vs. FAO* vs. UN Comtrade).                places where detailed data is not available). This is done for a
           -    Many data sources incorporate estimates of industry              range of reasons:
                experts.                                                           1. It is the currency most used in international trade
           -    As one example, in many cases, the value and/or volume             2. It allows for cross country comparisons (e.g. vs. Denmark)
                recorded as exported by one country does not match the             3. It removes the impact of NZD exchange rate variability
                amount recorded as being received as imports by the                4. It is more comprehensible to non-NZ audiences (e.g. foreign
                counterparty [for understood reasons].                                  investors)
                                                                                   5. It is the currency in which the United Nations collects and
-        In addition, in some places, we have made our own clearly noted                tabulates global trade data
         estimates.
                                                                             -   The opinions expressed in this report represent those of the
-        Coriolis has not been asked to independently verify or audit the        industry participants interviewed and the authors. These do not
         information or material provided to it by or on behalf of the           necessarily represent those of Coriolis Limited or the New
         Client or any of the data sources used in the project.                  Zealand Government.
          -     The information contained in the report and any
                commentary has been compiled from information and            -   If you have any questions about the methodology, sources or
                material supplied by third party sources and publicly            accuracy of any part of this report, please contact Tim Morris, the
                available information which may (in part) be inaccurate or       report’s lead author at Coriolis, on +64 9 623 1848
                incomplete.

PAGE 6          * Food and Agriculture Organisation of the United Nations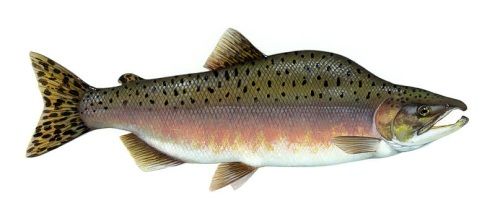
SUMMARY – THE SALMON OPPORTUNITY
 New Zealand salmon is unlikely to realise its potential and – as the industry is already highly consolidated – there
 are limited investment opportunities
Overview                                                                                                                has announced the desire to add +206 hectares, allowing it to grow turnover to
-     Salmon can only be farmed in a limited range of areas globally as the fish require                                $500m/year.
      cold water. In addition, the industry is highly capital intensive leading to salmon                          -    Sanford (24% of NZ production) is a NZX-listed seafood company with activities
      farming only occurring in a politically stable countries that offer long term sea                                 ranging from deep sea fishing through to mussel farming. Privately owned
      space leases. Salmon aquaculture emerged in Norway and Scotland in the early                                      Amalgamated Dairies is a cornerstone shareholder at 37%.
      60s and 70s. From there it has spread to a handful of other countries at any scale.                          -    Beyond these two large firms, there are four small scale salmon producers – three
-     The coastline of the South Island of NZ is highly suited to salmon farming in many                                in fresh water hydroelectric canals and 1 using sea-cages in Akaroa. Of these Mt
      areas. Sheltered bays containing cold waters can be found in the Marlborough                                      Cook salmon has recently announced a $20m expansion plan to fuel a 1,400%
      Sounds, Banks Peninsula, Stewart Island and Fiordland.                                                            production increase over the next four years.
Drivers of success                                                                                                 Growth potential?
-     NZ is able to farm Chinook salmon/King salmon as NZ waters lack the major                                    -    New Zealand has excellent theoretical potential to produce salmon: Norway, a
      diseases that impact this species elsewhere. Chinook is significantly differentiated                              country of a similar size to New Zealand, produces 75 times as much salmon; and,
      from Atlantic salmon and only available in low quantities, thus it achieves a 5-15%                               at a smaller scale, the Faeroe Islands produces 218 times as much salmon as the
      premium.                                                                                                          Banks Peninsula region.
-     Only Tasmania has sent any quantity of fresh salmon to New Zealand in the last                               -    However, this strong hypothetical potential for continued growth is unlikely to be
      decade (for unclear reasons1). This lack of competition has meant that growing NZ                                 realised. Unlike Norway or the Faeroes, the rule book has been regularly
      domestic consumption has been met by NZ firms.                                                                    changed. It is too early to tell at this stage whether the rules introduced last year
-     The devastation caused by ISA* in Chile over the past three years drove up world                                  will make things easier in practice.
      prices and hence the value of NZ salmon exports.                                                             -    The fundamental issue is that NZ as a society has yet to come to a consensus on
-     Relative to other proteins, salmon is a premium product farmed sustainably with                                   salmon aquaculture, with the proponents arguing for it to become a billion dollar
      positive health attributes.                                                                                       industry, while a wide ranging opposition of recreational fisherman, inshore
                                                                                                                        fishing companies, holiday home owners and environmental advocates oppose its
Investment opportunities
                                                                                                                        growth. There is also historic uncertainty around foreshore and seabed
-     The NZ salmon industry emerged in the late 70s early 80s with great fanfare.                                      ownership.
      Large numbers of firms entered, many listed on the stock exchange and were
                                                                                                                   -    In this environment it is difficult to recommend investment in the NZ salmon
      investment darlings for a period of time. However, the combined effect of falling
      global salmon prices (driven by increased efficiencies and increased production)                                  industry due to the high levels of risk, uncertainty and cost around ocean space
      and the on-going requirements for additional capital to fund growth pushed the                                    tenure and renewability of tenure. Any use change is slow, uncertain and costly.
      NZ salmon industry into crisis in the early 90s. From this crisis emerged two key                                 NZKS has recently spent NZ$6m on a resource consent and filed a 2,600 page
      industry players: New Zealand King Salmon (NZKS) and Sanford.                                                     application from 40 experts with an unclear chance of success. It is hoped that the
                                                                                                                        recently introduced EPA, deciding on consents of national significance, will
-     New Zealand King Salmon [NZKS] (68% of NZ production) is currently owned by                                       improve the process.
      the Tiong Group of Malaysia (an Asian conglomerate with interests ranging from
      palm oil to newspapers) and Direct Capital (a NZ based Private Equity Firm). It is                           -    NZ’s largest seafood company Sealord recently invested in salmon aquaculture in
      not obvious that either of these owners are clear long term holders. King Salmon                                  Tasmania.
 PAGE 7          1. We are told by industry that the cause is not biosecurity, but lack the resources to confirm this statement; *ISA = Infectious Salmon Anemia virus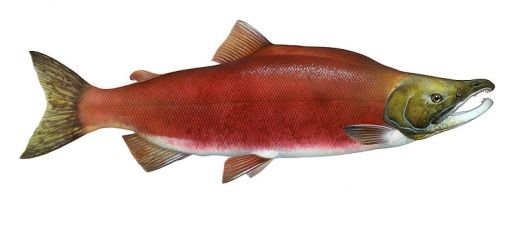
TABLE OF CONTENTS

Section                                                      Page

Contents                                                       4

Glossary of terms                                              5

Methodology & data sources                                     6

Summary & conclusions                                          7

    1. Salmon is an attractive product                         8

    2. Industry has achieved strong growth                    16

    3. Export markets are the prime driver of growth          31

    4. Strong hypothetical potential; unlikely in practice    38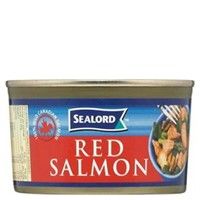
SALMON – PRODUCTION REGIONS
Salmon can only be produced in a limited range of areas globally

Salmon producing regions
(2011)

   Native Atlantic
 Introduced Pacific                                       Native Pacific
                                                       Introduced Atlantic
                                                                                                     Native Atlantic
                                                                                                   Introduced Pacific

                                                                              Range particularly
                                                                             limited in Southern
                                                                                 Hemisphere
                                 Introduced Atlantic
                                      & Pacific                                                     Introduced Atlantic
                                                                                                         & Pacific

PAGE 9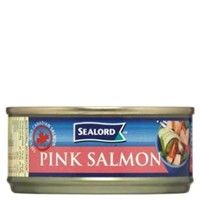
SALMON – KEY SPECIES
There are six key salmon species globally – three farmed (Atlantic, brown trout and Coho) and three wild (Pink,
Chum and Sockeye); New Zealand farms a minor species Chinook/King salmon
Overview of the key/secondary species in the global salmon industry
(various; 2008-2010 as available)

  Scientific name       Common name(s)                          Wild           Aquaculture    Key aquaculture producing    Comments/notes
                                                              capture          production     countries
                                                            (t; 000; 08)       (t; 000; 08)
  Salmo salar           Atlantic salmon                           3                1,457      Norway         Faeroe Isl.   -   Most important species globally
                                                                                              Chile          USA           -   Most suitable for farming
                                                                                              Scotland       Others        -   Strong breeding programs in place improving performance
                                                                                              Canada
  Salmo trutta          Brown trout                             TBD                    TBD
                        Sea trout
  Oncorhynchus          Coho salmon                              21                    105    Chile                        -   Valuable enough for farming
  kisutch                                                                                     Japan                        -   Primarily for Japanese market
  Oncorhynchus          Pink salmon                             307                     -     -              -             -   Of low value so not attractive to aquaculture
  gorbuscha             Humpback salmon
  Oncorhynchus          Chum                                    343                     -     -              -             -   Of low value so not attractive to aquaculture
  keta                  Dog salmon
                        Keta salmon
  Oncorhynchus          Sockeye salmon                          136                     -     -              -             -   Less adaptable for farming because it has lower growth and
  nerka                                                                                                                        survival rates, it has a lower fillet yield and it is more
                                                                                                                               susceptible to stress leading to poor product quality
  Oncorhynchus          Chinook salmon                            6                     9     N. Zealand                   -   Other countries getting out of not into this species due to its
  tshawytscha           King salmon                                                           Canada                           poor performance relative to Atlantic (e.g. rate of growth,
                        Columbia river salmon                                                                                  real world FCR, etc.)
                        Copper river salmon                                                                                -   Persistent fish health challenges in other markets (bacterial
                                                                                                                               kidney disease, rickettsia)
                                                                                                                           -   Effectively only two firm farming this species globally (NZKS
                                                                                                                               and Creative Salmon [B.C.. Canada]) at scale
                                                                                                                           -   New Zealand produces 70%+ of global farming output
PAGE 10          Source: UN FAO FishStat; UN FAO FIGIS; Wikipedia; Coriolis analysis
SALMON – CANNED VS. FRESH
In most markets farmed Atlantic salmon and trout are sold as a premium fresh or smoked product while wild
Pacific salmon is sold in canned form
Typical usage of three key salmon species by usage form
(2012)
Rainbow trout
Oncorhynchus mykiss
Sockeye or Red salmon Pink salmon or humpback salmon Atlantic salmon Brown trout
Oncorhynchus nerka Oncorhynchus gorbuscha Salmo salar Salmo trutta
PAGE 11 Source: various; photo credit (fish: public domain via Wikipedia; products: fair use; low resolution; complete product/brand for illustrative purposes); Coriolis analysisSALMON – GLOBAL PRODUCTION
Globally wild capture of salmon is flat; salmon aquaculture took off in the early 80’s and has achieved strong
growth such that aquaculture now exceeds wild capture
Global salmon production: wild capture and aquaculture
(t; 000; 1950-2008) 10 year
CAGR
(98-08)
2,500 4%
Aquaculture
Wild capture
2,000
Aquaculture 7%
1,500
1,000
500
Wild capture 0%
-
1950
1952
1954
1956
1958
1960
1962
1964
1966
1968
1970
1972
1974
1976
1978
1980
1982
1984
1986
1988
1990
1992
1994
1996
1998
2000
2002
2004
2006
2008
PAGE 12SALMON – FORECAST GROWTH
The rate of growth in farmed salmon production has slowed as the industry has matured; however Marine
Harvest (the global #1 salmon firm) forecasts 6% global production growth through 2030
Global salmon aquaculture production: actual and forecast
(t; 000; 1980-2030f)
5,000
4,500
4,000
Projected
3,500 CAGR
(10-30)
6%
3,000
Disease (ISA)
2,500 outbreak in
Chile1
CAGR
2,000
(00-08)
6%
1,500
CAGR
(90-00)
1,000 14%
CAGR
(80-90)
500 43%
-
1980
1981
1982
1983
1984
1985
1986
1987
1988
1989
1990
1991
1992
1993
1994
1995
1996
1997
1998
1999
2000
2001
2002
2003
2004
2005
2006
2007
2008
2009
2010
2011
2012
2013
2014
2015
2016
2017
2018
2019
2020
2021
2022
2023
2024
2025
2026
2027
2028
2029
2030
PAGE 13 Source: FAO FishStat (1980-2008); Kontali 2009-2010; Marine Harvest 2010-2030 (Oslo Salmon Summit 2010 How to satisfy the demand for salmon in 2011 and in 2030)SALMON – PRICE VS. OTHER MEATS
Salmon is a premium product that achieves higher prices than most other proteins
EXAMPLE: Price per kilogram of salmon and select other meats in the United States
(US$/kilogram; March 2011)
Smoked salmon $35.21
Fresh salmon $17.64
Frozen salmon $17.00
$16.53
Canned salmon
Canned salmon $10.60
$9.03
$7.70
$5.50
$3.95
PAGE 14 Source: Safeway US online grocery shopping website 20110305 (San Francisco post code); Coriolis analysis“FARMGATE” RETURN PER HECTARE
Salmon returns dramatically more per hectare than other forms of agri/aqua-culture; for example, salmon
returns 2,000 times as much per hectare as beef and sheep meat
Realised “New Zealand farmgate” value per hectare of space Incremental New Zealand “farmgate” value of +700ha of space
(NZ$; 2011 or as available) (NZ$; millions; 2011 or as available)
$1,450,000 Salmon $1,015
Another 700ha of
salmon would add a
Mussels $27
billion dollars
Oysters $20
2,000x
Kiwifruit $29
Dairy $4.3
$41,914 $28,889 $39,238
$721 $6,086 Another 700ha of
Cattle/Sheep meat $0.5
sheep/cattle would add
Cattle/Sheep Dairy Kiwifruit Oysters Mussels Salmon half a million
meat
PAGE 15 Source: Coriolis F&BIP Seafood p89; MAF SONZAF 2011; UN FAO AgStat database; Zespri annual report 2011; SNZ Agricultural census 2007 (last available); Coriolis analysisTABLE OF CONTENTS
Section Page
Contents 4
Glossary of terms 5
Methodology & data sources 6
Summary & conclusions 7
1. Salmon is an attractive product 8
2. Industry has achieved strong growth 16
3. Export markets are the prime driver of growth 31
4. Strong hypothetical potential; unlikely in practice 38TIMELINE
Salmon were introduced into New Zealand more than 100 years ago; salmon faming started in 1976 and the
industry has expanded since then
Timeline of salmon and salmon aquaculture development in New Zealand
(1860-2010)
Earlier 1960’s 1970’s 1980’s 1990’s 2000’s
Brown trout first introduced by Malaysian
Acclimatisation society from British Tiong Group
stock via Tasmania drives industry
1860’s consolidation
Rainbow trout introduced by
Ocean ranching
Acclimatisation society from West
King/Chinook NZ Government
Coast of North America
salmon puts moratorium
1883
1976 on new
aquaculture
Numerous attempts by various
Sea cage development
Acclimatisation societies to introduce
King/Chinook 2001
salmon and trout
1875 - 1900 salmon
1981
Chinook, Sockeye and Atlantic salmon
successfully introduced by
government Numerous
1901 - 1907 firms list to
attract
Atlantic salmon hatchery established additional
on Wanganui river capital
1924
PAGE 17 1. Successful in the sense of creating a meaningful amount of production and exports; Source: CoriolisINTRODUCED SPECIES
Five key members of the Salmon family were introduced to New Zealand over 100 years ago; only one species
(Chinook) is currently farmed at any scale
Key member of the Salmon (Salmonidae) family introduced in New Zealand1
(1850-1910)
Farmed Farmed in New
Illustration Species Year introduced Source Current status in wild elsewhere? Zealand?
Brown trout 1860’s British stock via Widespread south of Yes No
Salmo trutta Tasmania; Coromandel Peninsula (Primarily in UK) (illegal)
subsequent
introductions
Rainbow trout or steelhead 1883 From Sonoma N & S Island; rivers that Yes No
Oncorhynchus mykiss Creek, California flow into lakes (not (widespread) (illegal)
seagoing)
Atlantic salmon 1901 - 1907 British stock via Close to extinction2; Yes No
Salmo salar Australia; remnant wild stocks (widespread) (Past trials; no
numerous confined to lakes in current farms)
attempts to seed Southland’s upper Waiau
around country catchment
Sockeye or Red salmon 1902 Gift from Canadian Virtually extinct; remnant No Limited
Oncorhynchus nerka Government population around Lake (Not economic) (1 small firm)
Ōhau (S Island)
Chinook or King salmon 1875 (failed) From Baird Fish Mainly on South Island Limited Yes
Oncorhynchus tshawytscha 1901 - 1907 Station, McCloud East Coast (2 farms; disease; (Primary species
River in California. poor economics farmed currently)
PAGE 18 1. Also Salvelinus fontinalis (brook char) & Salvelinus namaycush (mackinaw); 2. Breeding stocks of Atlantic salmon are maintained at the Otago Fish and Game Council hatchery in Wanaka;
Source: various; photo credit (fish: public domain via wikipedia); Coriolis analysisWHY CHINOOK?
Unlike the rest of the world1, New Zealand farms Chinook salmon; this is the result of historical accident rather
than any plan or strategy
Identified reasons for and against Chinook salmon farming
(2012)
Why do other countries not farm Chinook? Why does New Zealand farm Chinook?
Disease - Chinook farming has persistent fish health challenges (Bacterial Kidney - Chinook in NZ are free of most diseases and parasites
Disease, Rickettsia) in other regions (Canada, Chile) which are profound
challenges to production for North American or European market - If key diseases were to arrive (cf. oysters, kiwifruit), the industry
- These diseases are difficult and expensive to treat2 would likely collapse (and need to transition to Atlantic)
Economics - Chinook grow more slowly than Atlantic salmon (time is money) - Significant fresh/frozen imports of salmon do not happen, for
unclear reasons, therefore New Zealand producers can be less
- Chinook have a poorer feed conversion ratio (FCR) than Atlantic salmon efficient
- Norway has a major breeding program underway for Atlantic salmon - Lack of diseases improves economics (cost of treatment, rate of
continuously improving the production efficiency of Atlantic growth, yield, survival rate)
History - “Atlantic salmon have become the dominant farmed species for a number of - Chinook salmon widespread around South Island of New Zealand
(path dependence) reasons. Most notable is that Norway's-and to a lesser extent Scotland's-early
development of Atlantic salmon aquaculture meant that the techniques and - Atlantic salmon only in one river (Waiau) at time salmon aquaculture
technologies for cultivating this particular species, as well as markets for its emerged in New Zealand (1976/1981)
sale, were well established by the time the industry spread to other
countries. In addition, Norway's dominance of the market, combined with its - Industry emerged locally rather than through investment by Top 10
pioneering role in developing salmon aquaculture, has meant that global (i.e. Norwegian) salmon aquaculture firms
aquaculture research and experience in Norway has strongly influenced the
industry's development. Well-established Norwegian breeding programs
have developed highly domesticated broodstock (Amos and Appleby, 1999)
with "...faster growth rates, greater tolerance for higher stocking densities,
superior disease resistance, and more efficient feed conversion rates" (The
Standing Senate Committee on Fisheries, 2001)
PAGE 19 1. Other than two farms in BC, Canada; 2. this is not to say Atlantic salmon do not have disease problems (e.g. ISA) but Atlantic diseases appear to be more manageable by
experienced farm operators; Source: Coriolis from various articles and reportsSALMON – NZ PRODUCTION
The New Zealand salmon industry experienced a period of strong growth through the mid-90’s; growth since was
slowing until a recent surge 09/10e
New Zealand salmon production
(t; 000; 1984-2010e)
Production increase is probably due
to NZ King Salmon's Clay Point (Tory
Channel) farm coming on line
12.4
CAGR
(05-10)
12% 10.7
CAGR
9.1 (00-05)
8.5 3% 8.5
CAGR 8.4
(90-95) 7.7
11% 7.4
7.2
6.7
CAGR 6.4
6.1
(90-95) 5.9
15% 5.0 5.1
4.4
4.0
CAGR 3.5
(84-90) 2.9 3.0
73% 2.5
1.5
1.2
0.9
0.6
0.1 0.2
1984 1985 1986 1987 1988 1989 1990 1991 1992 1993 1994 1995 1996 1997 1998 1999 2000 2001 2002 2003 2004 2005 2006 2007 2008 2009 2010
PAGE 20 Source: UN FAO FishStat (1984-1997); NZFSA (1998-2009+2010e); Coriolis analysisLISTED FIRMS
The excitement around salmon farming led to five salmon companies being listed on the stock exchange and one
listed firm (Salmond Smith Biolab) acquiring a salmon company; all were to be poor long term investments
New Zealand salmon farming companies which were publicly listed in New Zealand
(1980-1990
Listed firm When Details Effective outcome Today
listed
New Zealand Salmon 1983 - Set up; is listed; loses lots of money; diversified into vegetable Lost investors money; acquired by Now part of NZKS
processing (Cedenco) and packaging (Drum); gets export Regal; eventually acquired by
commendation from TradeNZ; didn’t achieve scale; was sold Tiong Group
Big Glory Seafoods Oct 1986 - First NZ sea cage operation set up by British Petroleum in 1981 Acquired by 80’s era Now a division of
- Went through a number of hands; was listed; diversified; gets conglomerate which became Sanford
export commendation from TradeNZ; was acquired; sold Montana Wines; sold salmon
operation
New Zealand Marine 1986 - Reverse takeover by Como Lost investors money; eventually Gone
Farms - Como sells salmon operations to South Pacific Salmon; SPS sells acquired
to Fleetwing Ent.; Fleetwing converts site to mussel farming
Regal Salmon Sep 1986 - Created in merger of South Island Salmon Partnership and the Lost investors money; eventually Now part of NZKS
South Island Salmon Company acquired by Tiong Group
- Initial success; further capital raising; diversifies into wine and
wasabi; loses money; wins TradeNZ export award; sells more
shares; alleged insider trading; Securities Commission
investigation; fined; loses more money; acquired by Tiong
Crowe Corporation Jan 1987 - Goat farming and ocean ranching of salmon Lost investors money; Gone
receivership; acquired by DFC
Salmond Smith Biolab [1965] - Listed firm buys into salmon industry pioneer, diversifies; loses Acquired by Tiong Group Now part of NZKS
money
PAGE 21EARLY HYPE
The industry initially had strong hype about the potential for growth
- “[Investors will] participate in two of the most exciting primary industries to emerge in New Zealand in the last five years, Goat farming and
ocean ranching of salmon.” Tony Crowe, Managing Director, Crowe Corporation, Jan 1987 (at time of listing)
PAGE 22MORE DIFFICULT THAN EXPECTED
Salmon farming proved more difficult than expected
- "The number of listed salmon companies is unjustified yet more are expected before the end of this year… Ocean ranching is a very volatile
business with no guarantee of returns after large initial capital costs. Operating costs are lower than for sea cages but it should not be
considered a low-cost exercise. Sea cage profit margins are at best moderate and are likely to deteriorate with salmon prices falling through
the world-wide production explosion... [We note] a similar pattern occurred in other glamour industries such as thoroughbred breeding and
goats. Initial prices for these stocks proved unsustainable and rationalisation of salmon stocks is expected over several years.” Analyst report,
O'Connor Grieve and Co. (sharebrokers), May 1987
- “Salmon farming is a new speculative venture capital industry carried out in remote areas… A combination of unforeseen circumstances had
led to the present position.” Sir Ronald Scott, Chairman, New Zealand Marine Farms, July 1987
- “Listed salmon farmer New Zealand Marine Farms Ltd is in a liquidity crisis and the future of the company depends on the banker devising a
rescue plan. The company yesterday reported to the stock exchange its plans to develop new licences in the newly identified Port Underwood
area had taken a severe setback through the company's share price falling below par ($1) on the stock exchange… A pilot salmon farming
scheme operated in the port Underwood area had shown good results, Mr Baigent said. However, more cash was needed to set up a full
operation but time had run out.” New Zealand Herald, Feb 1987
- “The New Zealand Salmon Co Ltd has not yet been able to identify the algae bloom responsible for killing a proportion of its salmon stock from
seacage farming operation in Big Glory Bay, Stewart Island.” New Zealand Herald, Jan 1989
PAGE 23WORLD PRICES DOWN
Increasing global production of farmed Atlantic salmon drove down world prices impacting New Zealand firms
- “A combination of losses from the January 1989 algae bloom, weaker world salmon prices and an international oversupply of fish has
prompted Regal Salmon to revise downwards its profit forecast.” New Zealand Herald, Feb 1990
- “New Zealand companies involved in salmon farming are being hit hard by a fall of 25 to 30 per cent in world prices for frozen and chilled
salmon.” New Zealand Herald, April 1990
- “News of a disappointing result from New Zealand Salmon Co Ltd has focused attention again on the skyrocketing world production of salmon,
and the question of how well New Zealanders can foot it in such a climate. Hard on the heels of Regal Salmon Ltd's 18-month loss of $940,000
to March 31, NZ Salmon turned in a six-month loss of $1.797 million to March 31, compared with a loss to the same time last year of $425,000.
Both companies have pointed to world oversupply as the main source of their woes on the salmon side of their businesses, but hold out hope
for a brighter future for the industry.” National Business Review, July 1990
- “Worldwide prices have not risen as expected.” Terry Shagin, Managing Director, Regal Salmon, June 1992
- “Trouble came in 1993 when [Regel Salmon] announced a $4.63 million loss for the six months ended September.. The company blamed the
loss on a 25% drop in prices for fish sold to Japan and a general world oversupply, stemming principally from an unanticipated increase from
Norway. Regal's share price immediately fell from 80c to 48c, both figures being a substantial slump from the $2.50 reached in 1992 for shares
issued at 50c in 1986.The company then came under the control of Malaysia's Tiong Group, which acquired Salmond Smith Biolab in late
1995/early 1996 and merged the two.” Peter V. O’Brien, National Business Review, Dec 1997
- “Regal Salmon yesterday reported an expected trading loss for the six months to September 30, but pulled a surprise by adding that its
prospects of meeting a predicted annual profit and dividend had diminished considerably. The company blamed the $4.63 million interim loss
on foreign exchange losses and a sharp decline in the price of salmon on the Japanese market.” New Zealand Herald, Dec 1993
PAGE 24INDUSTRY CONSOLIDATION
The New Zealand salmon farming industry went through a number of phases of industry consolidation in the late
80’s and early 90’s leading to the current situation of two key firms
Chart of key takeovers and acquisitions in the farmed salmon industry in New Zealand
(1978-1996)
New
Zealand
Newly Salmon
listed 1983
1992
South Island
Salmon
Partnership Regal
Salmon 1996
1986
South Island Tiong Group/
Salmon Oregon Group
Company
Marlborough
Salmon Co.
1989
Bubbling Southern Salmond
Springs Ocean Smith 1995
Salmon Salmon Biolab
1978 1987
British
Petroleum SaudiCorp Big Glory Corporate
Clypex Seafoods Investments 1993
1981 1986 1987 1990
PAGE 25KEY ACQUISITIONS
Acquisitions in the New Zealand salmon industry have been driven primarily by a search for additional scale
Key historical acquisitions in salmon farming sector in New Zealand
(1990 - Feb 2012)
Date Target Price Buyer Seller Details
Feb 1992 NZ Salmon $3.7m Regal Salmon NZ Salmon - Listed NZ Salmon sells domestic NZ salmon
farms leaving investment in Chilean salmon
farm
- sea cages at Stewart Island, the Trentburn
Hatchery, its 50% share in the feed mill
owned with Regal Salmon
Mar 1993 Big Glory Seafoods $14m Sanford Ltd. Corporate Investments - 700-800t/year production
- Includes other seafood assets
- Original BP sea cage business
Oct 1995 Salmond Smith Biolab N/A Tiong Group Listed - Tiong Group acquires listed salmon firm
Jul 1996 Regal Salmon N/A Tiong Group Listed - Tiong acquires Regal salmon operations in
stages during crisis leaving shell company
Oct 2008 Silverstream Hatchery N/A Salmon Smolt NZ NIWA (Government - Government hatchery bought by joint-
agency) venture of Mt Cook, Akaroa, Skeggs, High
Country, Benmore & Sanford
Jan 2011 Pacifica Salmon Limited NZ$950k New Zealand King Salmon (Tiong & Skeggs Group - Two salmon farms in Marlborough Sounds
(Island Aquafarms) (???) others) and a hatchery in Canterbury
- Part of Skeggs exit from aquaculture (sold
other operations to Sanford)
PAGE 26 Source: various published articles and press releases; Coriolis analysisSALMON – KEY NZ FIRMS
New Zealand has two salmon aquaculture firms producing more that 1,000 tonnes – New Zealand King Salmon
and Sanford – and a range of smaller, primarily river-based firms
Profiles of the key firms in New Zealand salmon aquaculture sector
(various; 2010 or as available)
Year Salmon Turnover Employees
Company founded prod (t) Ownership Note/comments
1996 7,9612 NZ$115m 420 Evergreen/Tiong 53% - Formed in 1996 merger of Southern Ocean &
merger Direct Capital 43.5% Regal Salmon
Management 3.5% - 7 sea farms (Marlborough Sounds (M.S)); 2
hatcheries; 4 processing facilities
- Recently acquired 2 salmon farms from Skeggs
- www.kingsalmon.co.nz
1993 2,613 Group NZ$421m 1,055 FT/PT Amalgamated Dairies 37% - 1 farm; Big Glory Bay, Stewart Island
acquired Others 63% - Purchased in 1993
- Recently acquired Pacifica Seafood, did not incl
salmon operations in M.S.
- NZ$7m upgrade in 2007; 1,900t to 3,000t
- www.sanford.co.nz
1994 256 N/A N/A Matt Evans - Operate in Central Otago hydroelectric canals
- Lease Isaac quarry
- www.smokedsalmon.co.nz
1984 189 $3m 22 Bates family - 1 farm; Lucas Bay, Banks Peninsula
- www.akaroasalmon.co.nz
1992 74 N/A N/A Various - Operate in Central Otago hydroelectric canals
- www.mtcooksalmon.com
1992 66 N/A N/A Logan family - Operate in Central Otago hydroelectric canals
- No website
N/A 15 (?) N/A N/A Isaac family - Ex-quarry; production highly variable
- www.isaac.co.nz/salmon_farm.html
PAGE 27 1. Includes non-salmon activities; 2. Includes Pacifica from Skeggs; Source: various industry publications; various published articles; company websites and annual reports; NZSFA;
Coriolis analysisNZ PRODUCTION SHARE
New Zealand salmon aquaculture production is now highly consolidated
New Zealand salmon aquaculture production share by key producers by species
(% of production volume; 2010)
River/Hydroelectric 6%
Other
1%
2%
2%
3%
24%
Sea Cage
94%
68%
TOTAL = 12,391
PAGE 28 Note: NZKS includes Pacifica (from Skeggs); Source: NZ Salmon Farmer’s Association (email); Coriolis analysisCONSOLIDATION ELSEWHERE
Other markets are also consolidated, indicating strong economies of scale in salmon farming
Farmed salmon production share by firm across select countries
(% of tonnes; 2010 or as available)
Tasmania Faeroe Islands British Columbia
2%
4%
14%
18% 14%
42% 15%
53%
25% 57%
38% 18%
TOTAL = 31,915 TOTAL = 41,357 TOTAL = 73,600
PAGE 29 Source: Salmon from the Faeroes (http://salmon-from-the-faroe-islands.com/producers.html); ABARE Australian Fisheries Statistics 2010; Marine Harvest; various company websites;
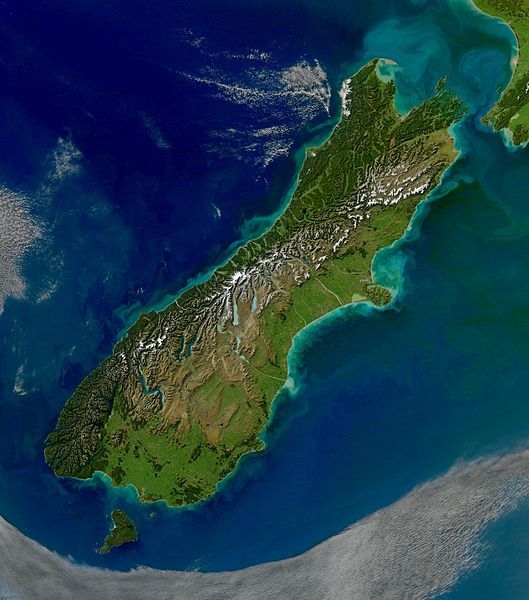
Coriolis analysis & estimatesFARM LOCATIONS
New Zealand has nine (~eleven) sea farms located across three regions and three producers in hydroelectric
canals
Location of salmon farming operations over 50t in New Zealand
(2011 or as available)
7/9 sea farms in Marlborough Sounds
- Otanerau (near Picton)
- Ruakaka (near Picton)
- Te Pangu (near Picton)
- Crail Bay (near Picton)
- Forsyth Bay (Marlborough Sounds)
Central Otago Hydroelectric canals - Waihinau (Marlborough Sounds)
3 firms operating - Clay Point (Marlborough Sounds)
- Plus recent acquisition of 2 farms
from Skeggs/Pacifica
One sea farm in Lucas Bay, Akaroa
One sea farm at Big Glory Bay
Less than 50t not shown
Isaac, Anatoki & Leslie
PAGE 30 Source: various published articles and company websites; photo credit (NASA; public domain); Coriolis analysisTABLE OF CONTENTS
Section Page
Contents 4
Glossary of terms 5
Methodology & data sources 6
Summary & conclusions 7
1. Salmon is an attractive product 8
2. Industry has achieved strong growth 16
3. Export markets are the prime driver of growth 31
4. Strong hypothetical potential; unlikely in practice 38SALMON – NZ UTILISATION
Growing NZ salmon production has gone to both domestic and export markets
Production and flow of salmon in and out of the New Zealand market (utilisation by market)
(t; 000; 1988-2010e)
Note: Recent surge
purely export driven 12.4
Note: Calculation is apparent consumption
(production-exports=domestic consumption); will
include wastage
10.7
9.1
Exports
8.5 8.4 8.4 6.8
from NZ
7.7 5.0
7.4
7.2
6.7
6.4 3.6 3.2 3.4
6.1
5.9
5.9
5.0 5.1 3.2 4.5
2.2 4.4
4.4
4.0 3.2 4.8
3.5 5.0 2.3
2.9 3.0 Domestic
2.5 3.9 5.7 consumption of
3.5 5.2 5.6
3.0 5.0 5.1
2.5 NZ production
1.5 2.1 2.4 3.9 4.0
1.2 1.7 3.1 3.1 3.2
2.6 2.8
1.1 1.9
1.1 1.4
0.4 0.8 0.8 0.6 1.0 1.0 1.1 0.8
0.1
-1.0 -0.8 -1.2 -0.8 -1.4 -1.0 Imports (almost
-1.8 -1.7 -1.9 -1.6 -1.7 -2.0 -1.7 -1.8 -1.8 -2.1 -1.9 -1.8 -1.5 -1.8 -1.5
-2.4 -2.1 totally canned)
1988 1989 1990 1991 1992 1993 1994 1995 1996 1997 1998 1999 2000 2001 2002 2003 2004 2005 2006 2007 2008 2009 2010
PAGE 32 Source: UN FAO FishStat (1984-1997); NZFSA (1998-2009+2010e); SNZ Infoshare (Import & Export database); Coriolis analysisNZ – CONSUMPTION PER CAPITA
After a period of strong growth, New Zealand salmon consumption per capita appears to have flattened and
stabilised
Apparent New Zealand salmon consumption by source
(kg/capita; 1988-2010e)
Note: Calculation is apparent consumption (production- CAGR
exports=domestic consumption); will include wastage; calculation (00-10)
does not include impact of tourists due to lack of data 1%
1.71
1.62 1.62
1.57
1.54
1.51
1.42
CAGR 1.24 1.25
Domestic (88-00) 1.18
14% 1.15
Imports 1.11
1.27
0.99 1.19
1.01
0.92 1.23 1.28 Domestic
0.95
0.83 0.74 1.32
0.79 0.78
0.36 0.76 0.72 0.76
0.74 0.69
0.31 0.48
0.29 0.22
0.57 0.55 0.28
0.47
0.23 0.16
0.36
0.32 0.23
0.02 0.12 0.63
0.50 0.52 0.54 0.50 0.51
0.46 0.43 0.44 0.44 0.46 0.44 0.47 0.42 0.43
0.34 0.39 0.34 0.34 Imports
0.29 0.25 0.24 0.22
1988 1989 1990 1991 1992 1993 1994 1995 1996 1997 1998 1999 2000 2001 2002 2003 2004 2005 2006 2007 2008 2009 2010
PAGE 33 Source: UN FAO FishStat (1984-1997); NZFSA (1998-2009+2010e); SNZ Infoshare (Import & Export database); SNZ Infoshare (Estimated Resident Population); Coriolis analysisSALMON – CONSUMPTION PER CAPITA
New Zealand salmon consumption per capita is at or above most peers suggesting limited domestic market
growth going forward
Salmon consumption per capita: New Zealand vs. select peers
(kg/capita; 2008-2010)
United Kingdom 1.9
New Zealand 1.6
Australia 1.6
Canada 1.3
United States 1.0
Spain 0.7
PAGE 34 Note: rounded to one decimal place; Source: UN FAO FishStat (1984-1997); NZFSA (1998-2009+2010e); SNZ Infoshare (Import & Export database); SNZ Infoshare (Estimated Resident
Population); UN Comtrade (various codes); National Marine Fisheries Service (USA); Coriolis analysisSALMON – NZ EXPORT VALUE
The value of New Zealand’s salmon exports were relatively flat until the last two years; we suggest the recent
surge is related to the Chilean ISA outbreak driving up world prices +18% (09) and +16% (10)
Value of New Zealand salmon exports by product type 10 year
(NZ$m; 2000-2010) CAGR
(00-10)
10%
$80.9
$0.1 Processed/Preserved (160411) -18%
Preserved $5.4 Smoked -3%
Likely Chile ISA (030541)
Smoked impact
$9.2 Frozen, fillets 29%
Frozen fillets (0304-200091/290078)
Frozen whole
$59.1
Fresh or chilled whole $0.1
$6.7
$1.6 $27.3 Frozen, whole 8%
(0303-10/11/19)
$43.5 $42.8
$0.3 $42.1
$0.1 $0.1
$4.9 $39.1
$37.3 $0.3 $4.9 $8.6 $22.9
$0.2 $0.8 $35.4 $35.1
$6.1 $0.1
$1.0
$0.1
$31.1 $7.9 $4.4 $1.4
$0.7 $7.8
$1.0 $0.6 $27.0 $13.3
$0.3 $8.7
$7.2 $0.0 $0.4
$25.0 $15.2 $12.3 $3.7 $4.0
$0.7 $12.5 $0.6
$7.0 $38.9 Fresh or chilled, whole 15%
(0302-12)
$12.9
$27.8
$22.7 $22.9 $24.1
$16.5 $16.7 $18.1 $15.7
$12.5
$9.3
2000 2001 2002 2003 2004 2005 2006 2007 2008 2009 2010
PAGE 35 Source: Statistics New Zealand Infoshare database (custom job); Coriolis analysisSALMON – NZ EXPORT VALUE
Growth has come from a surge in sales to Australia, the US and Taiwan (among others)
Value of New Zealand salmon exports by destination 10 year
(NZ$m; 2000-2010) CAGR
(00-10)
10%
Other
$80.9
Singapore
French Polynesia $8.0 Other 17%
Likely Chile ISA
impact Singapore 3%
Hong Kong French Polynesia 2%
Hong Kong 18%
Taiwan $5.5 Taiwan 37%
USA $59.1
Australia $3.2
$15.8 USA 38%
Japan $5.4
$43.5 $42.8
$42.1
$1.3 $39.1 $11.9
$2.4 $3.3
$37.3 $2.9 $0.3
$1.0 $1.5 $35.4 $35.1 $0.3 $19.4
$1.4 Australia 20%
$0.3 $4.0 $1.4 $1.8 $6.7
$31.1 $0.8 $1.1 $1.8 $8.8
$0.7 $0.2 $10.7
$1.7 $5.9 $6.5 $3.6 $27.0 $6.4
$0.2
$0.6 $1.5 $9.3
$3.1 $5.4
$0.5 $12.2
$3.2
$11.8
$5.9
$33.2
$27.7 $27.2 $26.1 $27.7 Japan 2%
$23.6 $22.9 $22.3
$14.9 $17.0
$13.8
2000 2001 2002 2003 2004 2005 2006 2007 2008 2009 2010
PAGE 36 Source: Statistics New Zealand Infoshare database (custom job); Coriolis analysisSALMON – INFLATION ADJUSTED $/KG
New Zealand export price tracks (above) the world price; as Chile recovers from ISA, we would expect prices to
return to their downward trend
Inflation adjusted export price per kilogram of fresh whole salmon
(US$/kilogram; inflation adjusted 2010$; 1988-2010)
$16.00
$14.00
$12.00
$10.00
Chile ISA impact
New Zealand (light blue)
$8.00
Scotland (yellow)
$6.00 Norway (green)
Chile (blue)
$4.00
Chile
$2.00 New Zealand
Norway
U.K.
$0.00
1988 1989 1990 1991 1992 1993 1994 1995 1996 1997 1998 1999 2000 2001 2002 2003 2004 2005 2006 2007 2008 2009 2010
PAGE 37 Note: USES SITC2-REV 2 code 030412; Source: UN Comtrade database; US BLS (US$ inflation); Coriolis analysisTABLE OF CONTENTS
Section Page
Contents 4
Glossary of terms 5
Methodology & data sources 6
Summary & conclusions 7
1. Salmon is an attractive product 8
2. Industry has achieved strong growth 16
3. Export markets are the prime driver of growth 31
4. Strong hypothetical potential; unlikely in practice 38NEW ZEALAND SALMON – SWOT ANALYSIS
While salmon has strong potential for continued growth, in practice this potential is unlikely to be realised
Strengths Weaknesses
- Farms King Salmon not Atlantic Salmon (low supply, no diseases, premium) - Farms King Salmon not Atlantic Salmon (slower growing)
- 30 years experience in sea cage salmon farming - Industry not at scale relative to competitors (~40,000t)
- Isolated South Pacific location, exposure to disease low - Large amount of best coast for salmon farming inside parks (areas highly valued by
other users of environment)
- Strong biosecurity system
- Increasing space requires huge investment of time, effort and money with unclear
- Industry consolidated around two firms (NZKS & Sanford)
chance of success; impossible to develop new sea area without going to court
- Competing land/sea uses and users
- Changeable government behaviour towards industry over past 30 years; limited clear
cross-party consensus going forward
- Close to impossible to introduce new genetics
- Negative attitudes towards genetic modification
- No presence of global top 30 salmon firms; not tied into their networks
- Residual uncertainty around ownership of foreshore and seabed
Opportunities Issues/Threats/Risk
- Strong theoretical potential for much greater production (NZKS plans to double - Potential arrival of salmon diseases, particularly those which impact King Salmon
production by 2015) severely (cf. PSA in kiwifruit; oyster “herpes”)
- Most recent new legislation (Aquaculture law reform October 2011) - Atlantic salmon imports from Tasmania – and potentially imported salmon from
other countries impacting profitability of domestic market
- Much larger Atlantic Salmon breeding program improving production economics
faster (compare Ross/Cobb chickens with any heritage breed)
PAGE 39 Source: Interviews; CoriolisSALMON – NZ VS. NORWAY
New Zealand has excellent theoretical potential to produce salmon; Norway, a country of a similar size to New
Zealand, produces 75 times as much salmon
1,190 km
1,156 km
75x
12,391t 936,980t
Salmon production
PAGE 40 Source: CIA World Fact Book; photo credit (CIA World Fact Book; public domain); Coriolis analysisSALMON – FAEROE ISLANDS VS. BANKS PENINSULA
As an example, the Faeroe Islands produces 218 times as much salmon as Banks Peninsula region
218x as much
farmed salmon
Banks Peninsula/Akaroa
~40km
Faeroe Islands
~40km 189t of salmon; 1 firm
41,357t of salmon; 4 firms One farm, similar in size to a Kentucky Fried
Chicken outlet (excluding the car park).
“There is a fish farm in almost every
suitable bay and fjord in the Islands. ”
PAGE 41 Source: photo credit (NASA; public domain); various sources; CoriolisPRODUCTION MATRIX
A comparison with peers suggests New Zealand is not intensively farmed
Salmon production matrix: coastline vs. coast productivity vs. total production for New Zealand and peer group countries
(2010 or as available)
t/km
110
100
Chile
90
Size of bubble = total salmon production
80
70
Salmon
production per
60
kilometre of
coastline Faeroe Islands
50
(t/km2; 2010)
40 Norway
30
20
10 Scotland
Tasmania
Stewart Island New Zealand
South Island British Columbia
0
0 2,000 4,000 6,000 8,000 10,000 12,000 14,000 16,000 18,000 20,000 22,000 24,000 26,000 28,000
Length of coastline (km2)
PAGE 42 Source: UN FAO FishStat; Wikipedia; CIA World Fact Book; Marine Harvest; other published articles and reports; Coriolis analysisSALMON – THE GREAT OPPORTUNITY
The salmon industry is heralded by many as a great opportunity with investors planning further expansions
- “The biggest opportunity is salmon. We just need to maintain the premium, it’s a premium product, high fat content, great eating quality, it’s a
very successful product.” Industry representative, 2011
- “We have worked out how to get a premium for King salmon; it’s a rare species. We have to because it takes more to feed, it’s not as efficient
as Atlantic salmon. We get a 30-40% premium.” CEO, Seafood company, large, 2011
- “Why not go for the low hanging fruit, like salmon, it is the biggest opportunity” Industry representative, 2011
- “Salmon is still in its infancy. There is such opportunity there.” GM, Seafood Company, medium, 2011
- “Growth will come from salmon.” CEO, large Seafood Company, 2011
- “New Zealand King Salmon is applying to increase its current production of 7,500 tonnes of salmon a year to 15,000 tonnes by 2015. If
successful, New Zealand King Salmon believes it can double its production in three to five years in support of the aquaculture industry’s target
of $1 billion in sales by 2025. ” New Zealand King Salmon, April 2011
- “Mt Cook Alpine Salmon CEO, Matthews is driving a bold $20 million expansion plan he says will fuel a 1400 per cent production increase for
the company within four years…When Matthews took over, Mt Cook was producing 160 tonnes per year. This year it will produce 400 tonnes.
And with a $20 million expansion, including a processing factory and a value-added plant, Mathews says they will be turning out 1000 tonnes
in 2012 and 2000 tones in 2013.” Matthews, CEO, Alpine Salmon, Aquaculture NZ, July 2011
PAGE 43CHALLENGES IN POTENTIAL GROWTH REGIONS
While four regions of New Zealand’s South Island have good hypothetical potential for salmon aquaculture, there
are significant limitations
Potential areas for salmon farming in New Zealand
(hypothetical model)
Nelson/Marlborough Sounds
Hypothetical potential: 40,000-100,000t
Similar in size to Northern Scotland
Significant tourism
Holiday homes
Recreational fishing
National parks
Inshore fishing
Fiordland
Hypothetical potential: 100,000-200,000t Banks Peninsula/Akaroa
Similar in size to Southwest Norway1 Hypothetical potential: 5,000-15,000t
Almost all land inside national park Similar in size to Faeroe Islands
Effectively uninhabited; poor access Significant tourism
Holiday homes
Recreational fishing
National parks
Stewart Island
Hypothetical potential: 5,000-15,000t
2/3 as much coastline as the Faeroe Islands
Almost all of the island owned by Government
80% of island is national park
PAGE 44 1. ~Oslo to Bergen; Source:; photo credit (NASA; public domain); Coriolis analysis and estimatesSALMON – CHALLENGE – ACCESS TO SPACE
The salmon industry, in particular, is restricted by space limitations
- “The salmon sector has got such huge potential. It’s a unique product which is getting its feed conversion rate down, which will increase
productivity. All it needs is additional space allocated and it will hum. ” Industry body representative, 2011
- “The biggest limitation with salmon is the access to water space in the Marlborough Sounds. Some of the decisions we make and the places
we deploy our efforts is so inefficient. We waste resources with bad decision-making. 70% of all marine assets are in the wrong place. They
are not producing what they should. We could move a farm 20 metres and double our production. The system is incapable of making
decisions. We make the choice to have a small 14,000 tonne salmon industry as opposed to a 1m tonne one. Ideally we would be in
Marlborough it has the infrastructure and great environment, close to the airport, town.” CEO, Seafood company, large, 2011
- “We want to change some space from mussels to salmon, the cost is just too prohibitive. The process is too much, it doesn’t make it feasible.”
CEO, Seafood Company, medium, 2011
- “The whole water space allocation is a debacle. Salmon compared to mussels has 5 times the value to the water space. There is complete halt
until the legislative reform. Salmon need more space to develop.” GM, Seafood Company, medium, 2011
- “The biggest hold up to development is the regulatory environment. Consenting process to get water space and the ability to change the use
of the water space. Even when you do get a change it still takes 18 months to 2 years to start developing and selling something.” Manager,
Seafood company, Medium, 2011
- “The industry needs scale. The government seems keen, yet access is still a huge issue.” CEO, Seafood Company, medium, 2011
- “Consent changes are a nightmare. We can change to salmon, but it is a huge cost.” Manager, Seafood company, Medium, 2011
PAGE 45www.foodandbeverage.govt.nz
You can also read