New Zealand Dairy Companies Review - April 2018 tdb.co.nz - TDB Advisory
←
→
Page content transcription
If your browser does not render page correctly, please read the page content below
New Zealand Dairy Companies Review

April 2018

tdb.co.nz

TDB Advisory Ltd   tdb.co.nz   New Zealand Dairy Companies Review   1
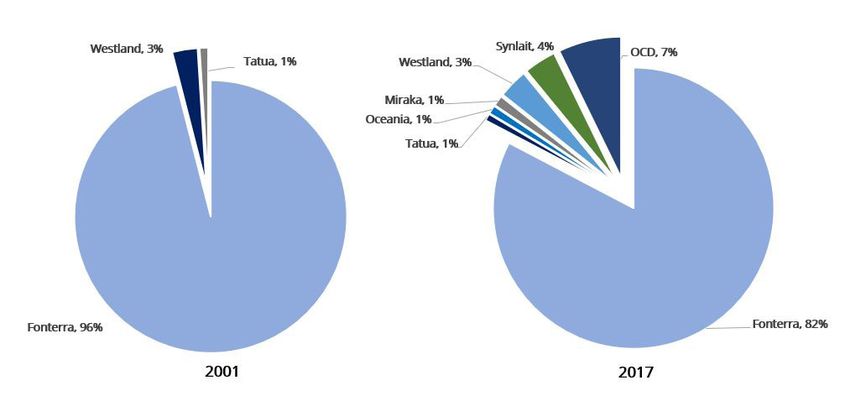
Table of contents

Overview                                                                    4
New Zealand dairy                                                           5
   The New Zealand dairy industry                                           5
   Industry growth                                                          5
   Industry market shares                                                   6
   NZ dairy processing competitors to Fonterra                              7
   Financial performance                                                    9
Benchmarks for the industry                                                 10
   Fonterra's performance versus the hypothetical efficient processor       10
   OCD, Synlait and a2 Milk as the market benchmarks                        11
Organisational form and capital structure                                   14
   Capital structures                                                       14
   Debt levels of the companies                                             14
   Access to capital                                                        15
   Invested capital since 2001                                              16
Market positioning and strategic direction                                  17
   Commodities through to consumer products                                 17
   Costs of supporting the different product mixes                          17
   Milk price differences and strategies                                    19
Outlook                                                                     20
   Forecast market shares                                                   21
   Forecast earnings performance                                            22
   Regulatory review                                                        23
Fonterra Co-operative Group                                                 24
Open Country Dairy                                                          26
Synlait Milk                                                                28
Tatua Co-operative Dairy Company                                            30
Westland Co-operative Dairy Company                                         32
The a2 Milk Company                                                         34
Oceania Dairy                                                               36
Mataura Valley Milk                                                         37
Miraka                                                                      38

TDB Advisory Ltd        tdb.co.nz      New Zealand Dairy Companies Review       2
TDB Advisory Limited
Level 5, Wakefield House
90 The Terrace
Wellington, New Zealand

Principal contacts for this report:

Geoff Taylor, Director                             Nigel Atherfold, Director                           Tom Stannard, Analyst
geoff.taylor@tdb.co.nz                             nigel.atherfold@tdb.co.nz                           tom.stannard@tdb.co.nz
027 465 0024                                       027 4650 057                                        027 800 8988

Disclosure and disclaimer

This report has been prepared by TDB Advisory Limited (TDB) with care and diligence. The statements and opinions given by TDB
in this report are given in good faith and in the belief on reasonable grounds that such statements and opinions are correct and
not misleading. However, no responsibility is accepted by TDB or any of its officers, employees or agents for errors or omissions
however arising in the preparation of this report, or for any consequences of reliance on its content, conclusions or any material,
correspondence of any form or discussions arising out of or associated with its preparation.

Statement of independence

TDB confirms that it has no conflict of interest that could affect its ability to provide an unbiased report. For completeness, it is
disclosed that in the last 24 months, TDB has advised on:

  •    the sale of shares in Open Country Dairy Limited;
  •    the sale of shares in Miraka Limited;
  •    the valuation of water rights for large-scale dairy farming; and
  •    the proposed changes to the Dairy Industry Restructuring Act for Goodman Fielder.

The principal contacts for this report, as noted above, are:

  •    investors in Fonterra (FSF) shares;
  •    investors in and former directors of Open Country Dairy Limited; and
  •    directors of other dairy farming businesses that are Fonterra Co-operative Group Limited suppliers and shareholders or
       Synlait Milk Limited suppliers or MyMilk suppliers.

TDB confirms that this report was not commissioned or sponsored by any entity and no other entity – including none of the
dairy companies nor Goodman Fielder – had any input into it whatsoever other than each entity covered in the report being
given to opportunity to check the factual accuracy of the section of the report relating to itself. The dairy company information
disclosed in this report is all publicly available information.

TDB Advisory Ltd         tdb.co.nz     New Zealand Dairy Companies Review                                                               3
Overview

The purpose of this report is to review the structures, strategies and financial performance of New Zealand’s dairy companies.
Last year’s report looked at the comparative performance of Fonterra’s New Zealand-based milk processing competitors. Those
competitors had in aggregate revenues of over $2.5b, a share of the NZ-based milk processing market of 16% and returns on
invested capital of over 10%. We found that the often promoted “move up the value chain” from commodities to more specialist
products had not been necessary to achieve strong risk-adjusted financial returns. Open Country Dairy’s (OCD) strategy of being a
low-risk commodity processor had proven to be successful while Tatua had performed the best of the companies on an adjusted
return on assets (ROA) basis. Tatuas value-add strategy required substantial investment across a relatively small pool of milk and
would be difficult to replicate across a much larger business. Synlait had delivered good risk-adjusted returns in the specialty
ingredients and infant formula markets and Westland had tried to move up the value-chain but had achieved the lowest return on
assets of the dairy companies.

In this year’s report we have increased our analysis of Fonterra and added The a2 Milk Company Ltd (ATM). As processors move
towards a higher value product mix, ATM is now the benchmark point of comparison in the consumer market segment.

We find that over the last three years, Tatua has achieved the highest adjusted return on assets of the traditional milk processors
(18% p.a.), followed by OCD (11%), Synlait (9%) and Fonterra (7%).

The Tatua outcomes remain outstanding and are often used as a benchmark amongst dairy farmers and commentators, however,
the relatively small volumes of milk processed by Tatua make it flawed as a valid benchmark for the industry. Other larger scale
NZ competitors have now differentiated more clearly into the market segments of commodities, value-added ingredients and
consumer products. The best performers in each of these segments are Open Country Dairy, Synlait and The a2 Milk Company
respectively. Bundled together these companies provide a comparator for the industry that suggests Fonterra’s global “volume
into value” strategy has not resulted in additional shareholder value beyond what could have been expected from a NZ-based
commodity and ingredients processor.

We have not seen evidence of growth in returns above the milk price, with Fonterra’s returns to farmers and shareholders being
behind those of its now higher growth and higher returning competitors. This value gap is made more relevant where we estimate
that these best performing companies will increase profits through to 2020 without investing in riskier offshore assets and while
paying higher milk prices to farmers.

Given the lack of evidence of an adequate risk-adjusted return for Fonterra’s supplier shareholders, it seems reasonable for
Fonterra’s shareholder farmers to ask how much capital is employed in the consumer and food service segments and whether an
improved return could be achieved by separating these segments into a transparent business that has to compete for its farmer
shareholders’ capital rather than be protected within the processing co-operative company.

Looking across the dairy industry, the processing sector has successfully transitioned into a more competitive segment since
the Dairy Industry Restructuring Act (DIRA). DIRA established Fonterra in 2001 and since then Fonterra’s market share has fallen
steadily, from 96% in 2001 to 82% in 2017. Our estimate is that, in the most probable low NZ milk growth scenario, Fonterra’s
NZ volume-based market share will fall further to around 78% by 2020. As Fonterra continues to lose market share, the case for
retaining special legislation that provides it with special privileges (and restricts Fonterra) gets weaker.

This report provides an overview of the NZ dairy industry, its current major participants, their market shares and financial
performance. The report also provides benchmarks for the NZ dairy industry and a comparison of capital structures and
organisational forms of the industry participants. Finally, we provide an analysis of the different companies’ market positioning
and strategic direction before commenting on the outlook for the industry.

TDB Advisory Ltd         tdb.co.nz       New Zealand Dairy Companies Review                                                       4
New Zealand dairy

The New Zealand dairy industry

The NZ dairy industry is notable for the very high proportion of production that is exported. Only 4% of the milk produced in NZ
is consumed domestically with the remaining 96% exported. Very little liquid milk is exported because milk is perishable. The
processors in NZ collect the liquid milk and transport it to manufacturing sites where water is extracted (milk is about 90% water) to
produce longer-life products that can be stored and shipped to export markets. These dried products are mainly bulk commodities
such as whole mil powder (WMP) and skim milk powder (SMP). With so much production exported, the milk price paid to NZ
farmers is largely a function of international commodity prices. NZ is consumed domestically with 96% being processed into export
products. Very little liquid milk is exported. The processors in NZ collect the liquid milk and transport it to manufacturing sites
where water is extracted (milk is about 90% water) to produce a product that can be stored and shipped to export markets. These
dried products are mainly base bulk commodities such as whole milk powder and skim milk powder. With so much production
exported, the milk price paid to NZ farmers is a function of international commodity prices.

Industry growth

As presented in Figure 1, milk volumes rose at an average annual growth rate of 3.6% during the 1980s and 1990s and 2.8% since
the 2001 regulatory changes to the industry. The tapering off in volume growth in recent years is expected to continue in 2018. With
two months left to go of the current season, the latest forecasts are for volumes to be down 1-2%.

                                           Figure 1: Milk production in New Zealand

Source: DairyNZ & TDB Advisory analysis

NZ’s milk volume growth has slowed over the past three years because of low milk prices and environmental limits. The new
Government reflects voters’ concerns about the environmental costs of the industry’s growth and has a coalition agreement that
includes a commitment to stop Government funding of irrigation schemes. The Minister of Agriculture has also announced a
comprehensive regulatory review of the industry. We expect the scope of the review to include a thorough examination of how
to remove the special regulation governing the industry or, at the very least, how to change the regulations to make them more
equitable for all existing and potential domestic industry participants and less onerous on Fonterra in the areas of new milk
collections and exported milk supply.

TDB Advisory Ltd               tdb.co.nz   New Zealand Dairy Companies Review                                                       5
Industry market shares

Since 2001 Fonterra’s market share of the milk processed in NZ has fallen from 96% to 82% and the number and scale of its
competitors has increased significantly. Figure 2 presents the change in the market share of milk volume collections between 2001
and 2017.

                                                Figure 2: Dairy companies’ volume-based market share

Source: DairyNZ, Company annual reports & TDB Advisory analysis

Despite the recent slowing in NZ milk production, from 2001 to 2017 total NZ milk volumes have grown by 52% or around 470m
litres per year. Therefore, while Fonterra’s market share has fallen, its milk volume collections have grown by 37%. For a highly
perishable product that can’t be stored, that growth carries with it the consequence of having to invest in increased processing
capacity for the forecast peak milk volumes1. This level of growth means that it has been very difficult to do anything with the
additional volume other than to channel it into commodity exports.

With Fonterra collecting over 300m of the average 470m litres of “new milk” per year, the remaining 170m litres has been going to
Fonterra’s competitors. Combined, these competitors now process 18% of NZ’s milk.

1          As context, average annual growth of close to 500m litres is approximately twice the current annual milk volumes of an average milk pow-
der plant and twice the volumes of the highest returning processor Tatua.

TDB Advisory Ltd               tdb.co.nz           New Zealand Dairy Companies Review                                                            6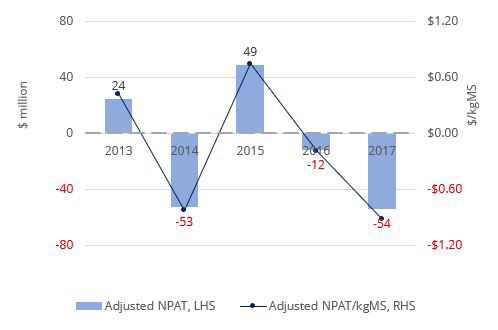
NZ dairy processing competitors to Fonterra

The collective size of Fonterra’s processing competitors has become significant. With more than $3 billion in sales their revenue is
approximately 50% of NZ’s total meat processors’ revenue and is now larger than the sheep and beef segments individually. With
total milk volumes of over 3.5 billion litres p.a. they are now 40% of the size of Australia’s total milk processing volumes.

Figure 3 presents the 2017 milk processing volumes for the six most substantial NZ competitors to Fonterra.

                                                         Figure 3: Processed milk volumes, 2017

Source: Company annual reports & TDB Advisory analysis

Fonterra’s two largest competitors are Open Country Dairy (OCD) and Synlait Milk Company (Synlait). Combined OCD and Synlait
represent 60% of the non-Fonterra market and had milk processing volume growth of 15% last year. Of more significance is the
growth implied by their estimated market values - the market value of OCD and Synlait’s combined equity is estimated to be $2.9
billion which translates into $15 of equity per kilogram of milksolids (kgMS) processed. By way of comparison, the market value of
Fonterra’s equity is $6 per kgMS. This value differential implies significantly higher forecast growth rates of volume and profitability
for Fonterra’s competitors. We discuss those forecast volume growth rates in the outlook section later in this report.

A summary of the major dairy processing companies is provided in Table 1. The table sets out past growth in volume processed,
total revenue for the 2016-2017 season and total revenue per kgMS. The table also outlines the key products, the sales channels
and the ownership structure of each firm.

TDB Advisory Ltd              tdb.co.nz           New Zealand Dairy Companies Review                                                  7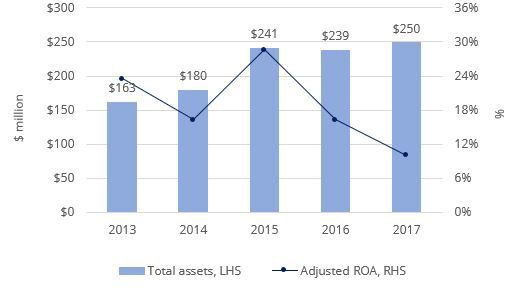
Table 1: Summary features of the dairy companies
Volume
Company and year growth Revenue Revenue per
Product positioning Sales channels Ownership
established rates 2012- 2017 kgMS 2017
2017
Co-operative ownership
for farmer shareholders/
suppliers who purchase
an ownership stake
Largest global consistent with their
Branded consumer
Fonterra exporter of dairy supply volume.
goods, dairy
2001 products. 95% of
0.12% $19.2b $12.60 ingredients, and
local production is Fonterra Shareholders
processed commodity
exported to over 100 Fund (FSF) is publicly
powders.
countries. traded on the NZX and
ASX and gives non-voting
right ownership to retail
and institutional owners.
Commodity powders 100% exports to
and cheese, with some over 64 countries
Open Country Dairy
movement recently Sells direct to trade NZ public unlisted
2002
into higher value customers company, Talley's 76%,
12% $1.1b $8.73
ingredients (mozzarella 20% of sales though OLAM 15%, sixty others
curd, mature cheddar, OLAM (a 15% share- 9%.
whey protein holder)
concentrate).
Sells direct to
Publicly owned and listed
business partners
Ingredient powders, on NZX and ASX.
and trade buyers.
Synlait infant formulas, cream,
8% $759m $11.69
2007 UHT and specialty Major shareholders are
2% of sales to
ingredients. Bright Dairy 39%, A2 Milk
Bright Dairy (a 39%
8.2% and Mitsui 8.4%.
shareholder)
Base commodities
through to branded
Westland Export to 60+ Co-op owned by 429
4% $630m $10.60 consumer products,
1938 countries. farmer suppliers.
powders, UHT milk,
butter, and yoghurt.
Progressively
High value speciality
established offshore
"Tatua ingredients, caseinate, Co-op owned by 113
3% $332m $22.16 offices once sepa-
1914" whey protein and anhy- farmer suppliers.
rated from NZDB/
drous milk.
Fonterra
Owned by 29 mainly
Maori incorporations. The
$125m+ 100% exports to two largest shareholders
(estimate over 23 countries. are Wairarapa Moana
Miraka 4%+ (TDB Whole milk powder,
based n/a Sells through broker, and Tuaropaki each with
2011 estimate) UHT Milk.
on plant Vinamilk, and 29%. Vinamilk is a dairy
capacity) Shanghai Pengxin. products enterprise in
Vietnam and has a 21%
stake.
Oceania $200m+
2013 (estimate Whole milk powder, Exported through
15%+ (TDB 100% Yili Industrial
based n/a infant powders, UHT Yili (100% owner)
estimate) Group.
on plant milk. sales channels
capacity)
Yashili does not collect
$200m+ any milk directly from
(estimate farmers, it purchases Exported though
Yashili 100%Yashili Group (25%
N/A based n/a ingredients from other Yashili and Danone
2013 owned by Danone).
on plant processors and then sales channels
capacity) manufactures infant
powders.
TDB Advisory Ltd tdb.co.nz New Zealand Dairy Companies Review 8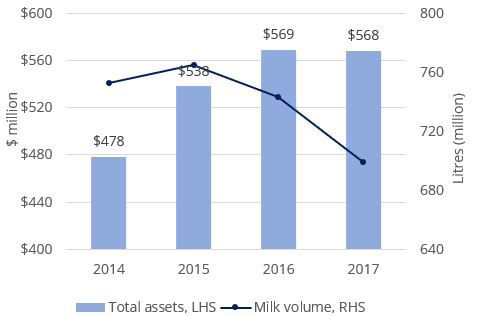
Financial performance

 This report focuses on an adjusted measure of return on assets2 as our primary measure of financial performance. Unadjusted
 return on assets3 does not provide a neutral basis for comparing the returns of the companies because the milk price paid by
 farmer-owned co-ops includes both a cost-of-milk portion and a portion of the co-op’s profit. Therefore, to assess the respective
 financial performances of the different dairy companies on a comparable basis, we have to adjust the EBIT results by standardising
 the cost of milk to the regulated farmgate milk price (FGMP). Further, to take out extraordinary outcomes from any particular year
 we have compared the average ROA across the last three years.

 Figure 4 below shows the average adjusted ROA of each firm over the last three years.

                                                  Figure 4: 3-year average Adjusted Return on Assets

 Source: Company annual reports & TDB Advisory analysis

 Once each company’s milk payout is adjusted to the regulated FGMP, Tatua shows the highest ROA at 18% p.a. on average over
 the last three years. OCD has averaged 11% over the period and Synlait 9%. Fonterra’s average adjusted return of 7% p.a. exceeds
 the regulatory weighted average cost of capital (WACC) of 5.6% for a commodity processor but not equity analysts’ estimate of the
 WACC for Fonterra given its investments in higher risk non-commodity business activities4. Westland’s adjusted return over the last
 three years has been only 1% p.a.

 2         Adjusted ROA is calculated as EBIT+(company payout-FGMP)*kgMS and allows comparability across company ownership structures.
 3         Unadjusted return on assets (ROA)=EBIT/Average[Opening Total Assets, Closing Total Assets].
 4         The industry WACC (of 5.6%) noted in the diagram is the regulator’s assessment of the expected return from a hypothetical efficient com-
 modity processor. While it is an appropriate benchmark for OCD, it is only relevant for the commodity business segments within the other companies.
 Based on equity analysts’ assessments of the different public dairy companies better WACC guidelines for the other businesses range f          rom
 8% to 10% (Fonterra 8.1%, Synlait 8.6%, ATM 9.3%).

TDB Advisory Ltd             tdb.co.nz           New Zealand Dairy Companies Review                                                             9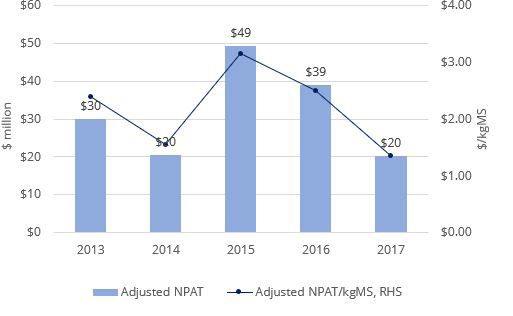
Benchmarks for the industry

This section addresses the industry benchmarks for performance. We compare the hypothetical efficient processor (HEP)
(constructed by Fonterra and reviewed by the Commerce Commission to set a farmgate milk price for Fonterra) to Fonterra as
well as some of its competitors. We then build a new market-based comparator for the benchmarking of Fonterra.

Fonterra’s performance versus the hypothetical efficient processor

When Fonterra was created in 2001 there were no reliable industry benchmarks. In the absence of these the regulator created a
hypothetical efficient processor (HEP)5 as the benchmark competitor to Fonterra. The HEP was created to, amongst other things,
establish a fair farmgate milk price (FGMP).

Figure 5 compares the estimated net profit after tax per kgMS for the HEP with Fonterra’s actual NPAT per kgMS.

                                Figure 5: Fonterra NPAT/kgMS vs. hypothetical efficient commodity processor

Source: Fonterra milk price statements, Fonterra annual reports & TDB Advisory analysis

Figure 5 shows that since 2010 Fonterra’s profits have been greater than would be expected from the theoretical efficient commodity
processor. However, Fonterra has invested in materially more than just processing commodities. It also has ingredients, food
service and consumer business segments. It is not transparent to us how much capital Fonterra has invested in the non-commodity
segments so we have estimated it by recognising Fonterra’s total assets of $18 billion and then deducting the regulator’s estimate
that $8 billion of NZ processing assets would be needed to efficiently process all of Fonterra’s NZ’s milk. This logic suggests that the
non-commodity investments are around $10 billion of assets. This estimate of the size of the investment and the fair milk price to
deliver an adequate return on that investment is becoming less relevant for the industry as large-scale export competitors have
emerged as a point of comparison for Fonterra. In the next section we introduce those market-based benchmarks.

5         As a proxy for NPAT/kgMS we use the hypothetical efficient processor’s capital cost allowance calculated in Fonterra’s Milk Price State-
ments adjusted for tax and depreciation.

TDB Advisory Ltd               tdb.co.nz            New Zealand Dairy Companies Review                                                         10
OCD, Synlait and a2 Milk as the market benchmarks
The previous section in this report indicates the best performing and largest scale companies competing in Fonterra’s commodity
and ingredient segments are OCD and Synlait6.
OCD is now the established low-cost commodity processor (in terms of both capital and operating costs) and is the largest of
Fonterra’s NZ competitors. OCD has four processing sites. It is a public unlisted company and has an estimated market equity
value of $1.3 billion7. The comparison of OCD with Fonterra in Figure 6 shows that Fonterra’s NPAT/kgMS (from all of its business
segments) has been similar to OCD’s. It would not be unreasonable for Fonterra’s farmer shareholders to query why Fonterra has
not achieved a higher return on average than OCD given Fonterra is invested in a range of more risky activities than just commodity
processing. We would also note the poor 2017 OCD and think that it will revert to a normalised and growing return in 2018.
Figure 6: NPAT/kgMS for Fonterra and OCD
Source: Company annual reports & TDB Advisory analysis
Synlait manufactures dairy ingredients and is the established market benchmark for the industry’s ingredients segment. It is a
publicly listed company and the market value of its equity is approximately $1.6 billion. Figure 7 compares Synlait’s and Fonterra’s
profits in-terms of NPAT/kgMS.
6 We have not chosen Tatua as the benchmark for the ingredients sector because its volumes are too low to be comparable.
7 OCD is not listed and so we have estimated a valuation range based off methodologies including: the most recent OCD valuation methodol-
ogy done under the takeover code in 2014 updated for current inputs; a current dcf value and comparables based off other NZ dairy companies. The
$1.3b estimate is a mid-point of that range and translates into $11 per KgMS for 100% of the company.
TDB Advisory Ltd tdb.co.nz New Zealand Dairy Companies Review 11Figure 7: NPAT/kgMS for Fonterra and Synlait
Source: Company annual reports & TDB Advisory analysis
The comparison shows that Synlait’s profits have also been similar to Fonterra’s for each unit of milk.
Both OCD and Synlait are public companies with good access to capital. They have both moved well beyond their start-up phases
with positive operating cashflows being reinvested in further growth opportunities. When we bundle OCD and Synlait together the
resulting consolidation is probably a fairer point of comparison (than just OCD) for the industry and Fonterra. A merged OCD and
Synlait would be a milk processing company with 6 sites spread evenly across the North and South Islands, with a commodity and
ingredients business collecting 11% of NZ’s milk volumes without any investment in offshore assets. The comparison with Fonterra
(again using the average of the last five years), is shown in Table 2.
Table 2: OCD/Synlait market-based benchmark portfolio
5-year average Consolidated
OCD Synlait Fonterra
(2013-2017) (OCD & Synlait)
NPAT ($m) $33 $23 $56 $600
NPAT/kgMS $0.34 $0.42 $0.37 $0.39
Dividend payout ratio 0% 0% 0% 79%
The above benchmark comparison shows a combined OCD/Synlait as having similar profits per kgMS as Fonterra. Both OCD and
Synlait currently elect to invest 100% of their profits in further growth whereas Fonterra distributes about three quarters of its
profits as a dividend.
The comparison has limitations because Fonterra has food service and consumer market segments while OCD and Synlait do
not. Fonterra has about one third8 of its revenue in the consumer segment (Anchor, Kapiti, Anlene, etc.) but does not disclose the
value of assets supporting that consumer business. The missing comparable segment to attain a market-based benchmark for
Fonterra is a multinational consumer brands business. Fortunately, The a2 Milk Company (ATM) is now of a size (with a consumer
8 Fonterra 2017 annual results presentation pg 29.
TDB Advisory Ltd tdb.co.nz New Zealand Dairy Companies Review 12product mix in Australasia, North America and Asia) that it can now be used as that comparable. ATM does not collect or process
any milk directly. It is a publicly listed company and has an equity market value of more than $10 billion (as at April 2018). ATM is
now profitable and cashflow positive. Figure 8 shows ATM’s revenue per kgMS, net profit after tax per kgMS and invested capital
per kgMS9.
Figure 8: ATM’s 2017 performance
Source: Company annual reports & TDB Advisory analysis
Interestingly, Figure 8 shows ATM has a similar volume of invested capital per kgMS as OCD, the benchmark commodity processor,
at $4. ATM’s NPAT per kgMS of $3 is well in excess of the processing companies.
We adopt ATM as a suitable comparator for Fonterra’s consumer brands business. When we merge ATM with OCD and Synlait we
get a benchmark that incorporates all of Fonterra’s and the industry’s consolidated business segments. Key 2017 metrics for the
four companies and the consolidated OCD, Synlait and ATM company are presented in Table 3.
Table 3: OCD/Synlait/ATM market-based benchmark portfolio
Consolidated
2017 actuals OCD Synlait ATM Fonterra
(OCD, Synlait & ATM)
NPAT ($m) $23 $38 $91 $152 $745
NPAT/kgMS $0.18 $0.59 $3.08 $0.79 $0.51
Market share 7% 4% 0% 11% 82%
Table 3 above shows that in 2017 an equally weighted benchmark portfolio of OCD/Synlait/ATM generated 79c per kgMS of NPAT
compared with Fonterra’s 51c.
9 We estimate ATM’s volume of milk sales by noting that Synlait reports supplying 225m litres to ATM for the 2017 year and that represents
65% of total A2 certified milk globally. This implies 29.4m kgMS of A2 milk.
TDB Advisory Ltd tdb.co.nz New Zealand Dairy Companies Review 13Organisational form and capital structure
This section reviews the organisational and capital structures of the NZ dairy companies. We discuss the ownership, debt levels
and access to capital of the companies as well as investment in capital and strategic acquisitions since the inception of Fonterra.
Corporate structures
The corporate structures of the dairy companies vary considerably. The different corporate forms include:
• a majority owned farmer co-operative (Fonterra);
• two wholly farmer-owned co-operatives (Tatua and Westland);
• a publicly-owned but unlisted NZ code company (OCD);
• NZX and ASX listed companies (Synlait & ATM) with proportions of the firms owned by offshore trade investors;
• a privately-owned company (Miraka) with an offshore trade investor with offshore distribution channels; and
• two privately-owned subsidiaries of offshore food companies (Oceania and Yashili) with significant offshore distribution
channels.
Debt levels of the companies
Given the long-life infrastructure nature of the assets of the dairy processors, it is not surprising that debt features as a permanent
source of capital for most of the companies. The amount of working capital debt employed during the year fluctuates significantly
owing to the seasonal nature of the industry. Figure 9 below presents the current leverage levels in the industry.
Figure 9: Net debt to total assets
Source: Company annual reports & TDB Advisory analysis
The three co-operatives have larger volumes of debt than the publicly owned firms. This leverage is not surprising given co-
operatives’ payments to farmer-suppliers rank behind bank debt and the co-operatives access to equity is limited compared with
the public companies.
TDB Advisory Ltd tdb.co.nz New Zealand Dairy Companies Review 14Access to capital
A concern raised when Fonterra was formed was that growth would be constrained because of a co-op’s relatively limited access to
capital. That does not appear to have been the case. Fonterra has accounted for approximately $15 billion of the $18 billion of new
investment in the industry with close to $3 billion invested by Fonterra’s competitors as Figure 10 below illustrates.
Figure 10: Change in invested capital, 2001-2017
Source: Company annual reports & TDB Advisory analysis
Fonterra’s average annual investment of close to $900m compares with its current annual depreciation charge of over $500m,
which suggests that Fonterra has been investing up to $400m p.a. more than the expected cost of the replacement of its old assets.
We estimate that Fonterra would have to be investing a minimum of $100m p.a. to build increased plant capacity for NZ milk
growth so that suggests that in the region of $300m p.a. has been invested in non-commodity and offshore assets.
It is difficult to identify the offshore portfolio in detail; however, a review of the last ten years of Fonterra news and financial
statements show these offshore investments included:
• Chinese farms, cows, processing and a branded infant formula business;
• Australian dairy processing, R&D, distribution and marketing assets;
• a US whey processing company;
• a joint-venture (49% stake) in Russia; and
• a 10 per cent equity stake in a Lithuanian dairy company.
We cannot unbundle the Fonterra investments beyond their disclosures in investor presentations of the ingredients business unit
and consumer and foodservice business unit. In the disclosures Fonterra reports 2017 returns on capital of 10.3% and 47.2% for
the respective business units. We find this difficult to reconcile10.
10 See page 11 https://www.fonterra.com/content/dam/fonterra-public-website/pdf/Fonterra_Annual_Results_presentation_2017_NZX.pdf.
TDB Advisory Ltd tdb.co.nz New Zealand Dairy Companies Review 15Invested capital since 2001
A breakdown of the estimated $3 billion of capital invested by Fonterra’s competitors since 2001 is shown in Figure 11.
Figure 11: Invested capital since 2001
Source: Company annual reports & TDB Advisory analysis
There has been a spread of investment across the commodities, ingredients and consumer business segments. The performance
of the individual companies is discussed in the individual company sections, presented later in this reoprt. Points to note include:
• several start-up failures in the “other” category;
• Westland’s returns being poor and the company now focussing on cost reduction;
• Tatua’s investment has been high relative to its volume of milk with returns of above 15%;
• OCD and Synlait’s invested capital of close to $500m each has tripled in value to be now worth close to $1.5 billion for
each company; and
• ATM’s investment of $120m is now worth around $10 billion.
TDB Advisory Ltd tdb.co.nz New Zealand Dairy Companies Review 16Market positioning and strategic direction
The competing processors have adopted a range of different strategies. In this section we look at the different strategies and
reflect on the trade-off between risk and return.
Commodities through to consumer products
Figure 12 below provides the revenue per kgMS of each company in 2017. The revenue per kgMS acts as a proxy for the product
mix of the firms. High revenue per unit of product output indicates more specialised and higher margin (and value-added)
ingredients production whereas low revenue per unit of output represents a commodity focus for the firm.
Figure 12: Revenue per kgMS, 2017
Source: Fonterra 2017 milk price statement, Company annual reports & TDB Advisory analysis
The line on the graph represents the regulator’s estimate of the NZ dollar value of a benchmark commodity product mix (milk
powders and bi products) of export sales calculated for the HEP and used as a benchmark for Fonterra in deriving the FGMP.
Costs of supporting the differing product mixes
Various industry commentators have referred to the benefit of growing the value-added component of milk sales. In last year’s
report we highlighted how difficult that could be. On the one hand the growth in milk volumes was overwhelming value-added
opportunities, but even if the industry were to produce a product mix similar to Tatua it would require an investment in fixed
assets of a further $675,000 (over $4kgMS11) per NZ farmer shareholder. To compare that with current invested fixed capital,
Figure 13 presents the 2017 fixed assets per kgMS by company.
11 DairyNZ 2016-2017 statistics reports average total production per herd was 157,560kgMS.
TDB Advisory Ltd tdb.co.nz New Zealand Dairy Companies Review 17Figure 13: Fixed assets per kgMS
Source: Company annual reports & TDB Advisory analysis
Figure 13 highlights that the higher margin, more value-added production carries with it an increased level of investment. In fact,
Tatua, the highest margin processor, has invested, in-terms of fixed assets, almost three times more than OCD (the lowest value-
added producer) per unit of production.
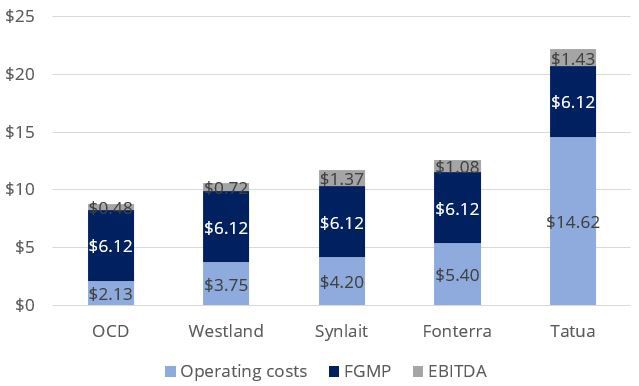
Operating cost comparisons similarly show the variation in product mix within the companies. Although there is not enough public
information to directly compare operating costs Figure 14 presents our estimate that is derived by taking each firm’s EBITDA per
kgMS (as a proxy for an earnings margin) and the FGMP from the total revenue per kgMS.
Figure 14: Breakdown of revenue per kgMS
Source: Company annual reports & TDB Advisory analysis
Our estimate of operating costs range from just over $2 per kgMS (in the case of OCD) to above $14 per kgMS (in the case of Tatua).
When the regulated cost of milk is added onto these it shows just how different the low-cost commodity processor (OCD) is from
the higher value model adopted by Tatua, with both being profitable.
TDB Advisory Ltd tdb.co.nz New Zealand Dairy Companies Review 18Milk price differences and strategies
While Fonterra is required to pay the regulated milk price (FGMP), other companies can negotiate their milk price with farmer
suppliers. Most companies in the start-up phase have paid a higher milk price and then moved down to the FGMP as volumes grew.
Figure 15 presents the distribution of the three-year average (2015-2017) premium or discount paid by Fonterra’s competitors at
the farm-gate. The data presented in Figure 15 shows a range around the FGMP of +$0.04 to +$0.27. The outlier is Oceania which
guaranteed a minimum milk price of $4.50 when the FGMP fell to $3.90.
Figure 15: Three-year average milk-payout surplus distribution
Source: Company annual reports & TDB Advisory analysis
On average the premium offered by competing firms was 12c/kgMS above the FGMP. This included Synlait paying on average
4c/kgMS above the FGMP, OCD paying on average 6c/kgMS above the FGMP and Miraka offering until recently 10c/kgMS above
the FGMP. The outlier has been Oceania that paid farmers a “floor” price materially above the rest of the industry when the milk
price fell below $4 in 2015. We have excluded Tatua and Westland because we are focusing on ‘new’ milk and the actions that
competitors are taking to acquire market share.
In addition to offering a premium for milk collections some companies have moved to differentiate themselves with quality
incentives, volume premiums, and transport differentials. For instance, OCD pays the full price of milk earlier than the rest of the
industry, a tactic which is worth approximately 5.7c per kgMS to farmers12 on an annual basis. OCD also offers a fixed price for
specific volumes of milk during the year.
If Fonterra was allowed to pay a higher milk price to defend its volumes, we would expect a continuation of premiums being paid
by the competitors. Also, we would expect an acceleration of the introduction of risk-transferring pricing structures that increase
the competitive edge and longevity of the competitors. Such arrangements could include:
• longer-term milk supply agreements;
• fixed milk price contracts; and
• toll processing pricing.
12 Estimated as the present value difference between the Fonterra and OCD sequential payments schedules. The assumed discount rate for
the calculation is 6.5% which is thought to be a reasonable rate associated with on farm debt cost.
TDB Advisory Ltd tdb.co.nz New Zealand Dairy Companies Review 19Outlook
This section presents a forecast market share analysis of the NZ milk processing market. The analysis assumes no growth in total
milk volumes over the three years to 2020.
We estimate the growth of each of the competitors to Fonterra based on their committed investments, access to capital, and in
Westland’s case, a return to competitiveness that retains its current volumes. Given our estimates for growth by the competitors
we assume that Fonterra makes up the remainder of the milk production.
Table 4 presents the historical and forecast growth, the current dividend pay-out ratio and net debt to total assets for each company.
Table 4: Company milk volume growth rates and leverage
Growth rates Dividend pay-out ratio Net Debt to Total
Companies Forecast growth rates 2018-2020
2012-2017 (% p.a.) 2017 Assets, 2017
Fonterra 0.12% -2.44% 83% 33%
OCD 12% 8% 0% 8%
Synlait 8% 7% 0% 11%
Westland 4% 0% not applicable 38%
Tatua 3% 0% not applicable 28%
Miraka 4%+ (TDB estimates) 0% not applicable not disclosed
Oceania 15%+ (TDB estimates) 28% not applicable not applicable
We project that OCD’s processing volumes will increase by 8% per year. This is a slow-down from its 2012-2017 growth rate of 12%
p.a. and is driven by its construction of a new plant in Waikato which is expected to be operational by 2018.
We project that Synlait’s processing volumes will increase by 7% p.a. until 2020. This again is a prudent estimate that is lower than
historical growth and is based on market expectations that the company will expand its high margin and lower volume product
lines.
We assume no growth for Westland, Tatua and Miraka because we are not aware of any planned increase in production or capacity
for these firms. Lastly, we project 28% p.a. growth in processing volumes for Oceania as it is expected to complete its new plant
which will add 220m litres of milk processing capacity by mid 2018.
If NZ’s total milk production remains constant out to 2020 our projections for the other companies imply that Fonterra will lose
1.6% of its processing volume each year.
TDB Advisory Ltd tdb.co.nz New Zealand Dairy Companies Review 20Forecast market shares
Taking the growth rates from the previous section, the forecast volumes for Fonterra to 2020 are shown in Figure 16.
Figure 16: Forecast milk collection volume, 2017-2020
Source: Company annual reports & TDB Advisory analysis
If we overlay those volumes assuming nil growth in industry milk volumes through to 2020, Fonterra would lose approximately one
billion litres of milk (representing 4% of its current market share). The resultant volumes and Fonterra market share is presented
in Figure 17. This milk loss is significant in such a capital-intensive business and represents the equivalent of three average sized
milk powder plants.
TDB Advisory Ltd tdb.co.nz New Zealand Dairy Companies Review 21Figure 17: NZ and Fonterra’s milk volumes, 2000-2020
Source: Company annual reports & TDB Advisory analysis
In that scenario, Fonterra’s market share would fall below 78% in both the North and South Islands. Under the original DIRA
legislation, that market share would have triggered a review and, subject to adequate competition, the expiration of DIRA. Those
market share thresholds no longer exist and last year the Commerce Commission found that there still isn’t sufficient competition
in the farm gate market .
Forecast earnings performance
In the second section of this report we concluded that OCD, Synlait and ATM are the benchmark dairy companies in the commodity,
ingredient and consumer segments, respectively.
All three are public companies (OCD is unlisted) and have a combined value of equity of over $12.9 billion, which is a significant
premium per kgMS above the equity value of Fonterra. This indicates a lot of growth is built into the values of OCD, Synlait and
ATM compared with Fonterra. We have therefore forecast the relative performance of the four companies out to 2020 and the
results are presented in Table 5.
Table 5: Forecast consolidated earnings, 2020
Consolidated
2020 forecast OCD Synlait ATM Fonterra
(OCD, Synlait & ATM)
NPAT ($m) $62 $97 $334 $493 $850
NPAT/kgMS $0.39 $1.21 $4.30 $2.05 $0.62
Market share 9% 5% 0% 14% 78%
TDB Advisory Ltd tdb.co.nz New Zealand Dairy Companies Review 22The consolidated position of the three benchmark companies shows how far ahead the aggregate benchmark is forecast to be
relative to Fonterra. If the three companies’ profits were bundled into the milk price there would be an additional payment of close
to $1.50 per kgMS by 2020 compared with Fonterra.
Regulatory review
A major issue impacting on the outlook for the dairy companies will be the new Government’s forthcoming review of the DIRA.
The review will take place against a backdrop of increasing concerns about the performance of Fonterra; questions around whether
the restrictions on Fonterra and the privileges it enjoys under the DIRA are still warranted; and increasing societal concerns about
the environmental impacts of dairy farming.
We expect that the review will trigger consideration of a number of issues, including:
• possible removal or phasing out of the regulated milk price;
• the potential for stranded assets and therefore those with spare capacity fighting harder to keep milk volumes resulting
in greater variations in milk prices from competing dairy companies; and
• the potential for reduced consumer protection in the domestic market if Goodman Fielder loses its guaranteed access
to Fonterra’s milk at the regulated price.
Despite the claimed strategic rationale for establishing Fonterra under special legislation, it is not clear, some seventeen years later,
that Fonterra has created value. We have not seen evidence of increased returns above the milk price, with Fonterra’s returns to
farmers and shareholders behind those of its now higher growth and higher returning competitors.
TDB Advisory Ltd tdb.co.nz New Zealand Dairy Companies Review 23Fonterra Co-operative Group
Organisation
Growth in assets and volumes collected
Fonterra is cooperatively owned by farmer shareholder suppliers
who purchase an ownership stake consistent with their supply
volume. In addition to the farmers’ capital, the Fonterra
Shareholders Fund (FSF) is publicly traded on the NZX and ASX
and represents a further 7% to 12% of total equity. FSF securities
are non-voting securities owned by retail (including farmers) and
institutional investors.
Market position and growth
Fonterra is the world’s largest dairy exporter and accounts for
approximately 30% of global dairy trade. It processes 17 billion
litres (82%) of NZ’s milk production and 2 billion litres of Australia’s Revenue/kgMS, 2017
milk production (making it the largest milk processor in Australia).
In addition to accessing other international milk pools it is vertically
integrated from commodities through to consumer brands and
has significant investment in offshore sales channels. While the
consolidated revenue mix is referred to as two thirds commodities
and ingredients and one third consumer and foodservice, it is not
clear what contributions come from commodities only.
Strategy
Fonterra has a strategy to optimise NZ milk supported by its offshore
milk pools. This strategy translates into an aim of shifting more NZ
volumes into higher value products alongside selective investment
in offshore milk pools and distribution channels to support higher Revenue/kgMS and FGMP
value offshore markets. The success of this strategy should show
up in its revenue/kgMS rising relative to the commodity value of
milk (FGMP).
TDB Advisory Ltd tdb.co.nz New Zealand Dairy Companies Review 24Fonterra Co-operative Group
Financial performance
Total Assets, ROA
Fonterra’s NPAT fell 11% in 2017 to $745m.
Within the business segments, the decrease in earnings in
Ingredients was partially offset by an increase in earnings in
Consumer and Foodservice.
Fonterra’s return on assets follows its EBIT performance. Returns
have consistently been below its WACC of 8% indicating that the
company has consistently failed to provide its shareholders with an
adequate risk-adjusted return.
The 2017 dividend remained the same as 2016 at 40c per share
(kgMS) and so was a higher percentage of NPAT than would
NPAT
normally be the case.
Capital structure
Fonterra’s debt is much the same as the previous year and supports
a stable S&P credit rating of A-. The co-operative payments system
(where NZ farmers as supplier shareholders are subordinate to
other creditors) gives Fonterra greater financial flexibility than a
company structure and supports a short-term credit rating of A1+,
the highest achievable and the same as the NZ Government.
The current level of debt is close to Fonterra’s long term optimal
capital structure and should give it continued access to debt capital.
Net Debt to Total Assets
TDB Advisory Ltd tdb.co.nz New Zealand Dairy Companies Review 25Open Country Dairy Organisation Growth in assets and volumes collected OCD began as a commodity cheese manufacturer in the Waikato in 2002. Since then OCD has expanded with powder plants in Southland and Taranaki. It has recently announced the addition of another Waikato plant at Horotiu. OCD is the second largest milk processor in New Zealand and the world’s second largest supplier of WMP (behind Fonterra). OCD is a public unlisted company with an initial public offer of securities in 2002. OCD is majority owned by Talley’s Group Limited (76%) with Olam International Limited owning 15% and more than 50 shareholders holding the 9% balance. Revenue/kgMS, 2017 Market position and growth OCD processed 6.9% of New Zealand’s milksolid volumes in the 2017 season, up from 6.2% in the 2016 season. OCD is the only one of the new processing companies to have grown its milk collection and processing presence across a number of regions – Waikato, Taranaki, and Southland. OCD has established itself as the benchmark low cost processor and with the lowest operating costs in the sector is profitable notwithstanding having the lowest value product mix in the industry. Revenue/kgMS and FGMP On a milk volume basis, OCD is the fastest growing processor in New Zealand. Its milk volumes have grown by almost 12% p.a. for the last five years. With the new capacity currently being built we expect growth to continue. TDB Advisory Ltd tdb.co.nz New Zealand Dairy Companies Review 26
Open Country Dairy

Strategy                                                                         Total Assets, ROA

OCD is continuing its volume-based strategy but is now extending
its product range to allow it to optimise production according to
prevailing commodity prices. It has invested in increased cheese
capacity and has recently referred to higher value product
development projects.

OCD has differentiated itself with farmer suppliers from the other
processors by paying the full milk price earlier than the rest of the
industry. We estimate that this is worth approximately 5.7c/kgMS in
terms of time value of cashflow. That could result in a higher return
for farmers while even on a like-for-like basis OCD has managed to
                                                                                        NPAT
slightly exceed the FGMP over the last 12 years.

Financial performance

FY2017 was a poor year for OCD. Its profitability at the EBITDA line
was almost half what it was the previous year.

The margin contraction is likely to have been from sales phasing.
We have compared OCD’s result with the calculations that are the
input to the regulatory milk price. Our analysis suggests that the
profit decline was a non-recurring fall in gross margin where OCD
under-performed at the revenue line (rather than milk cost per
kgMS) by approximately 15c per kgMS.
                                                                               Net Debt to Total Assets

Capital structure

OCD continues to use retained earnings to fund its expansion.
As at 30 September 2017 (OCD’s balance date versus 31 July for
the industry) OCD reported net debt of $57 million. At the end
of September OCD carries more (debt-funded) inventory on its
balance sheet than it does at the end of July. We estimate that OCD
had no core debt as at the end of July.

TDB Advisory Ltd        tdb.co.nz         New Zealand Dairy Companies Review                              27
Synlait Milk
Organisation Growth in assets and volumes collected
Synlait began in 2000 as a collection of large-scale Canterbury
dairy farms. Synlait Milk Ltd (SML) was established in 2007 and in
2008 began processing milk supplied from Synlait Farms and other
Canterbury farm suppliers in a newly constructed powder plant.
In 2010, Synlait Farms was separated from the milk processing
business and Bright Dairy became a 51% shareholder in SML. This
decreased to 39% when the firm listed on the NZX in 2013. Synlait
is now listed on both the NZX and ASX and has a number of trade
investors, including Bright Dairy (39%), The a2 Milk Company (8%)
and Mitsui (8%).
Revenue/kgMS, 2017
Market position and growth
Synlait is located in Canterbury and while it has so far concentrated
its manufacturing base in Dunsandel, it has more recently
purchased a canning facility in Auckland, opened an R&D centre in
Palmerston North and purchased a site in North Waikato for infant
formula manufacture.
Synlait processed 3.5% of New Zealand’s milksolid volumes in the
2017 season, up from 3.1% in the 2016 season. Its milk supply has
increased by almost 5% p.a. for the last five years.
Revenue/kgMS and FGMP
Synlait is well established with a high level of credibility with its
Canterbury farmer-suppliers. It has historically paid its farmer-
suppliers a milk price similar to the FGMP and has topped that up
with premiums paid to farmers with Synlait-accredited Lead with
Pride farming practises and to farmers who supply grass-fed milk
and A2-protein only milk.
Strategy
Since its 2013 IPO, Synlait has successfully positioned itself as a
business-to-business (B2B) manufacturer of high-value specialty
ingredients. It has progressively shifted more volume to infant
formula base powders, canned infant formulas and cream. As a
result, Synlait has generated an increasing premium per kgMS over
commodity values. Synlait has recently entered the domestic market
in the South Island through a supply contract with Foodstuffs South
Island.
TDB Advisory Ltd tdb.co.nz New Zealand Dairy Companies Review 28Synlait Milk
Financial performance Total Assets, ROA
Synlait forecast to investors during its 2013 IPO that growth into
higher-value products would flow through to the bottom line
relatively quickly. That has been the case with NPAT increasing by
almost 40% p.a. over the last four years.
Synlait's B2B strategy means that it is focused on making a margin
that reflects the value it brings to contracted relationships while
mitigating exposure to price risk, either on the farmer side with the
milk cost or on the customer side. Synlait’s increasing EBIT margin
trend over the last five years indicates that it has done this very well.
Capital structure NPAT
Synlait has used surplus cash to reduce debt. Its net debt to total
assets peaked at 45% two years ago and is now down to 11%. Synlait
has announced that it will use internally generated cash flows and
debt to fund its planned capex - $125 million for a liquid milk plant
in Canterbury and$260 million for the recently announced wet-mix
plant in Pokeno (North Waikato).
Net Debt to Total Assets
TDB Advisory Ltd tdb.co.nz New Zealand Dairy Companies Review 29Tatua Co-operative Dairy Company
Organisation Growth in assets and volumes collected
Tatua is a co-operative owned by its 113 farmer-suppliers. It has a
single manufacturing site and office just outside of Morrinsville in
Waikato. The company celebrated 100 years of operations in 2014.
Market position and growth
Tatua’s share of NZ milk collections is 1%. After making the decision
to not be part of Fonterra, it has successfully grown its high value
ingredient products business.
The company’s focus is on export markets with sales in over 60 Revenue/kgMS, 2017
countries. Since losing its sales channel through NZDB with the
establishment of Fonterra in 2001, it has established its own export
sales channels and opened offices in Japan, China and the USA.
Tatua has increased its value to its farmer-supplier shareholders by
making the highest milk payments in the industry while still retaining
sufficient earnings to fund its investment in modern manufacturing
capability that produce specialised ingredient products and small
volumes of consumer products. The products include caseinate,
whey protein concentrate and anhydrous milk fat.
Strategy
Revenue/kgMS and FGMP
Tatua has a strategy that is focussed on sustainability and returning
more to its suppliers than would be delivered under a milk-volume
growth strategy. Tatua aims to be the leading global supplier
of specialised dairy products. Across the last five years, it has
consistently achieved a high sales price per unit of milk relative to
the regulated commodity price model.
TDB Advisory Ltd tdb.co.nz New Zealand Dairy Companies Review 30Tatua Co-operative Dairy Company
Financial performance Total Assets, ROA
Tatua’s financial performance in FY2017 was good. It increased
its revenue/kgMS to $21.90 from $18.60 and its earnings before
interest, tax and milk price per kgMS (EBITMP/kgMS) to $7.80 from
$6.40.
Its revenue per unit of milk is still the highest in the industry and it
continues to generate the highest returns on its invested capital.
Tatua’s superior performance is reflected in it consistently paying
its farmers more for their milk than any other NZ processor.
NPAT
To compare Tatua’s performance with the other processors, we
have adjusted its financial results by changing its milk price to the
farmgate milk price. This change has significantly increased its EBIT
from $9.9m to $24.5m for 2017. The adjustment more correctly
shows Tatua’s return on invested capital of 9% in 2017 which is
down from 15% in 2016 and 27% in 2015 but still above the industry
average.
Capital structure
As a co-operative, Tatua has a limited base of equity from its
farmer-supplier shareholders and has used debt and retained
earnings to fund capital expenditure. Debt increased significantly in Net Debt to Total Assets
2015 to fund the purchase of a specialised powder dryer and it has
remained steady at around 25% to 30% of total assets since. Its debt
to assets ratio is relatively low given its underlying profitability and
compared with the other co-operatives.
TDB Advisory Ltd tdb.co.nz New Zealand Dairy Companies Review 31Westland Co-operative Dairy Company
Organisation Growth in assets and volumes collected
Westland is a co-operative company. It has 342 shareholders and
420+ supplying farms. It has its main manufacturing site in Hokitika
and additional manufacturing capacity in Canterbury. Its production
ranges from base commodities (powders, milk fats, butter) through
to consumer products (powdered yogurt, UHT and butter).
Market position and growth
Westland processed 3.5% of New Zealand’s milk solid volumes in
the 2017 season, down from 3.7% in the 2016 season.
Revenue/kgMS, 2017
Within its primary catchment its milk collection is protected by the
cost of transporting milk across the Main Divide. In Canterbury it
competes for milk supply with both Fonterra and Synlait.
Strategy
Westland has invested significantly since 2012 in product capability
that moves it away from base commodity production. The strategy
of offering differentiated products continues and has been
refreshed by new management.
Westland went through a large amount of organisational change
during FY2017 with the appointment of a new CEO and changes in Revenue/kgMS and FGMP
other senior management positions. These changes together with
recent under-performance from a financial perspective led to a
thorough examination of Westland’s business.
TDB Advisory Ltd tdb.co.nz New Zealand Dairy Companies Review 32You can also read