Prof. Virginia Trigo, Professor Emeritus, ISCTE Business School - EQUITY INCENTIVE SYSTEM IN ALIBABA, TENCENT AND BAIDU - ISCTE ...
←
→
Page content transcription
If your browser does not render page correctly, please read the page content below
EQUITY INCENTIVE SYSTEM IN ALIBABA, TENCENT
                 AND BAIDU

                           Panpan Zhang

      Project submitted as partial requirement for the conferral of

               Master in Human Resource management

                              Supervisor:
   Prof. Virginia Trigo, Professor Emeritus, ISCTE Business School

                               July 2017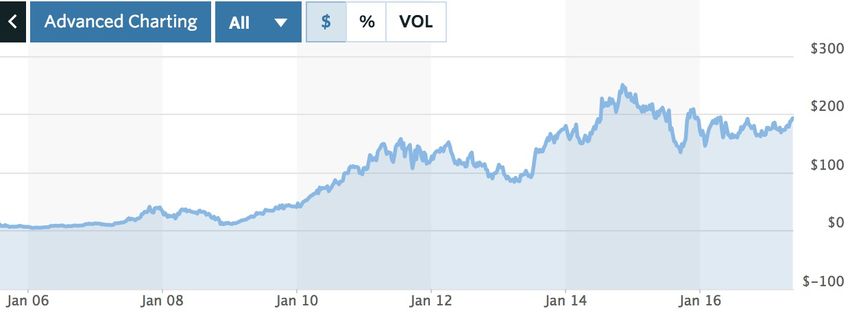
Abstract

More and more Chinese companies are applying equity incentive plans nowadays.
However, the effectiveness of these equity incentive systems is unclear as some
research shows a positive relationship between the equity incentive system and firm
performance whereas others show a negative relationship and still others found that
there is no relationship at all.

In this dissertation, we analyzed the equity incentive system in three Chinese high
tech companies: Baidu, Alibaba and Tencent, the so called BAT. The research used
secondary data from the latest 5 to 10 year Annual Financial Statements of these three
companies and applied Spearman’s correlation coefficient to calculate the relationship
between their equity incentive system and performance. Results showed a higher and
positive relationship in the case of Baidu and Tencent rather than in Alibaba. Finally
possible factors that may influence the effectiveness of the equity incentive system
were discussed.

This study and the results obtained may provide some guidance and suggestions not
only for the subject companies but also to others and assist them in selecting a
suitable type of equity incentive plan.

Key word: equity incentive, BAT, firm performance, Spearman’s correlation
coefficient.

JEL Classification: J33, M52

                                                                                    2
Resumo

Cada vez mais empresas chinesas aplicam hoje em dia programas de incentivos
baseados em ações. No entanto, a eficácia destes sistemas continua pouco clara.
Algumas investigações evidenciam uma correlação positiva entre o sistema de
incentivos baseado em ações e o desempenho da empresa, enquanto que outras
mostram uma correlação negativa e, outras ainda não evidenciam nenhuma
correlação.

Nesta investigação, foi analisado o sistema de incentivos baseado em ações de três
empresas chinesas de alta tecnologia, as designadas BAT: Baidu, Alibaba e Tencent.
A investigação baseou-se em dados secundários extraídos dos Relatórios Financeiros
Anuais destas três empresas e aplicou o coeficiente de correlação de Spearman para
calcular o tipo de correlação existente entre os seus planos de incentivos e o
desempenho. Os resultados revelaram que a correlação é melhor nas empresas Baidu
e Tencent e não tão positiva na Alibaba. Por fim foram discutidos os fatores que
podem influenciar a eficácia do sistema.

Os resultados poderão fornecer alguma orientação e sugestões não só para as
empresas estudadas mas para outras que pretendam adoptar planos de incentivos por
ações.

Palavras-chave: incentivos por ações, BAT, desempenho da empresa, coeficiente de
correlação de Spearman

Classificação JEL: J33, M52

                                                                                3
Contents
1. INTRODUCTION ............................................................................................................ 6
1.1 BACKGROUND OF THE RESEARCH ............................................................................... 6
1.2 SIGNIFICANCE OF THE RESEARCH ................................................................................ 9
1.3 RESEARCH QUESTIONS ............................................................................................... 10
1.4 STRUCTURE OF THE THESIS ........................................................................................ 10
2. THEORETICAL REVIEW .......................................................................................... 12
2.1 EQUITY INCENTIVE COMPENSATION SYSTEM ............................................................ 12
2.2 MOTIVATION THEORIES ............................................................................................. 13
2.3 EMPLOYEE EQUITY AND FIRM PERFORMANCE ........................................................... 15
3. METHODOLOGY ......................................................................................................... 21
3.1 RESEARCH METHOD ................................................................................................... 21
3.2 RESEARCH DESIGN ..................................................................................................... 22
3.3 DATA COLLECTION ..................................................................................................... 22
3.4 DATA ANALYSIS ........................................................................................................ 22
4. ANALYSIS ...................................................................................................................... 24
4.1 THE EQUITY INCENTIVE COMPENSATION SYSTEM IN BAT ....................................... 24
4.2 RELATIONSHIP BETWEEN EQUITY INCENTIVE SYSTEM AND FIRM PERFORMANCE .... 28
4.3 DIFFERENCES BETWEEN BAT .................................................................................... 38
5. DISCUSSION AND CONCLUSION ............................................................................ 41
5.1 DISCUSSION ................................................................................................................ 41
5.2 CONCLUSION .............................................................................................................. 43
5.3 LIMITATIONS AND DIRECTION OF FUTURE RESEARCH .............................................. 44
REFERENCE: ....................................................................................................................... 46
TABLE 1 SHARE-BASED COMPENSATION EXPENSES IN ALIBABA (IN THOUSAND, USD) ........................ 25
TABLE 2 SHARE-BASED COMPENSATION EXPENSES IN TENCENT (IN THOUSAND, HKD) ....................... 26
TABLE 3 SHARE-BASED COMPENSATION EXPENSES IN BAIDU (IN THOUSAND, USD) ............................ 27
TABLE 4 EQUITY INCENTIVES AND FIRM PERFORMANCE IN ALIBABA ................................................... 29
FIGURE 1 SCATTER PLOT OF ALIBABA ................................................................................................... 30
TABLE 5 LINEAR RELATIONSHIP RATIO IN ALIBABA.............................................................................. 30
TABLE 6 EQUITY INCENTIVES AND FIRM PERFORMANCE IN TENCENT (IN THOUSAND, HKD) ............. 32
FIGURE 2 SCATTER PLOT OF TENCENT ..................................................................................................... 33
TABLE 7 LINEAR RELATIONSHIP RATIO IN TENCENT ............................................................................. 33
TABLE 8 EQUITY INCENTIVES AND FIRM PERFORMANCE IN BAIDU (IN THOUSAND, USD) .................... 35
FIGURE 3 SCATTER PLOT OF BAIDU ....................................................................................................... 36
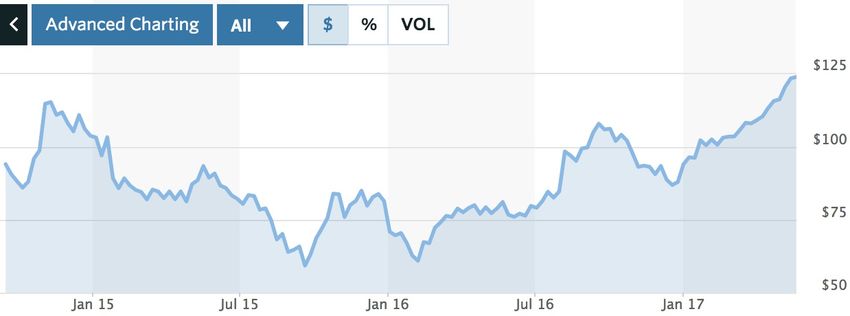
FIGURE 4 STOCK PRICE OF ALIBABA ..................................................................................................... 38
FIGURE 5 STOCK PRICE OF TENCENT ..................................................................................................... 39
4FIGURE 6 STOCK PRICE OF BAIDU.......................................................................................................... 39
51. Introduction
This dissertation is to analyze the equity incentive compensation system of Alibaba
group, and then compare it with two other companies in a similar industry named
Baidu and Tencent. The aim is to understand its structure and effects as a possible
contribution to help other similar companies and to add to the debate among HR
enterprises regarding a more in-depth study and discussion on the industry equity
incentive compensation system.
1.1 Background of the Research
1.1.1 Implementation of Equity Incentive Policy in China and other countries
The equity incentive compensation system was born at the end of the 20th century. In
the past decades, it suffered from not being taken seriously to being given extensive
attention. A privately held company often wants to offer key employees the right to
participate in the financial success of the business through an equity incentive
compensation plan (Barnes, 2016). The earliest practice of equity incentive
compensation was in a High-Tec company in Silicon Valley, California in the 1960s
(http://m.pj.com/article/20319.html, 2017/4/13). However, in the end of 1970s,
because of the rapid development of the senior talent mobility, the policy of
management shareholding has becoming more and more important for all the
companies, and it gained general approval in 1990s. According to the statistics, in the
top 500 American companies recorded in “Fortune” Magazine in 1998, more than 90%
of companies have implemented equity incentive compensation policy such as stock
options.
Since 2006, China published several laws and policies about the equity incentive
system and the legal environment in listed companies and, as a result, these have
gradually developed. According to the statistics from the National Bureau of Statistics
6of the People’s Republic of China, from January 1, 2006 to July 31, 2012, a total of
459 listed companies have announced equity incentive programs, and in July 31, 2016
the proportion of listed companies reached 18.94%. Among the 1400 listed companies
in Shanghai and Shenzhen, employees in about 500 have the shares of the company.
In 2005 China Securities Regulatory Commission also published the first version of
“The Measures for the Administration of Equity Incentives for Listed Companies (for
Trial Implementation)” to make it more effective. The new version of “The Measures
for the Administration of Equity Incentives of Listed Companies” have been
examined and approved at the 6th Chairman's Meeting of the China Securities
Regulatory Commission on May 4, 2016. It is hereby promulgated on August 13,
2016. However we must face up to the fact that the role of equity incentive to promote
the performance of the company did not achieve the desired level.
Although China has been applying the equity incentive system for about 10 years, the
application is not very mature in China now. Considering the differences of the
markets in China and in some Western countries, we cannot just make the system the
same as others. Companies should measure the type, the motivation object and the
effect of equity incentive compensation in their own situations. Alibaba, Tencent and
Baidu are three of the largest and most important companies in China and their
practices of the equity incentive system have very important model significance for
other companies. So this research shows the advantages and disadvantages of some
types of equity incentive systems in these three companies, and also the applicability
of each type of equity incentive method.
1.1.2 Introduction of Alibaba, Tencent and Baidu
Alibaba Group is one of the leaders of global E-commerce and also one of the earliest
E-commerce companies in China. The Alibaba group was founded in 1999 by 18
people led by Jack Ma, a former English teacher from Hangzhou, China. It has then
become a large company, and it has many subsidiaries companies, such as Taobao,
7Tmall, Alisoft, Alipay, Alimama, Yahoo China and Alibaba. In 1999, the number of
Internet user in China was 2.1 million; it increased to 59.1million in 2003, to 384
million in 2009 and to 640 million in 2016 (China Internet Network Information
Center, 1999, 2003, 2010, 2017). The increase in the number of Internet users in
China provides a good platform for the development of e-commerce. The founders
started this company to champion small businesses, in the belief that the Internet
would level the playing field by enabling small enterprises to leverage innovation and
technology to grow and compete more effectively in the domestic and global
economies. The headquarters of Alibaba Group is in Hangzhou, China, and it also has
branch offices in more then 30 cities in China, Sweden and America. Now, more then
30,000 people work for Alibaba Group.
Alibaba Group’s mission is to make it easy to do business anywhere. They provide
the fundamental technology infrastructure and marketing reach to help merchants,
brands and other businesses that provide products, services and digital content to
leverage the power of the Internet to engage with their users and customers. Their
businesses are comprised of core commerce, cloud computing, digital media and
entertainment, innovation initiatives and others. Through investee affiliates, they also
participate in the logistics and local services sectors.
However, in the High-Tec industry, Baidu and Tencent are two of the largest
competitors of Alibaba group. Also, these three companies, China 's Internet
Company Big Three are called BAT in China, B stands for Baidu, A for Alibaba and
T for Tencent. BAT has become China's largest three Internet companies. Chinese
Internet industry has been developing for 20 years already, and now these three
companies have their own system and strategic plan. They control China's
information-based data, transaction-based data, relational data, and then merge their
other innovative businesses with their own advantages. Over the past five years, the
three giants have invested in a total of 30 listed companies and in hundreds of unlisted
companies. Eighty percent of the top 30 unlisted companies in Chinese Internet
8industry are behind the BAT figure (https://www.huxiu.com/article/174425.html,
2017/4/13).
Baidu and Tencent also have their core business. Baidu mainly focuses on search
engine, and Tencent mainly focuses on game industry. Nowadays, there are already
more than 50,000 employees working for Baidu, and for Tencent, the number is more
than 30,000 (https://www.huxiu.com/article/174425.html, 2017/4/13).
1.1.3 Implementation of Equity Incentive Policy in BAT
Since Alibaba started its IPO in America in September 19, 2014, it has already started
its equity incentive plan, and at that time, its stock price was $68. For Baidu, it also
started its equity incentive plan since its IPO in America in August 7, 2005. However,
for Tencent, the situation is not the same. Tencent listed in HKEx in June 2004, but it
just started the equity plan in 2011 (https://zhuanlan.zhihu.com/p/25248376,
2017/4/15). The results of the policies are different in these three companies, so in
this research we will try to find out the differences of the equity incentive systems and
also the results they led to.
1.2 Significance of the research
The main purpose of an equity incentive system is for companies to motivate their
employees, and employee motivation both to stay and to perform is important for an
entrepreneurial firm to manage costs, stabilize the organization, and provide
organizational legitimacy (Cooper and Folta, 2000; Greiner, 1998; Reynolds, 1987).
However, the equity incentive system is only being used in China for about 10 years,
and its policies and practices of are not so perfect.
Alibaba, Baidu and Tencent, as the largest High-Tec enterprises in China, have
already been applying this strategy for few years. If their strategies have benefited the
growth of the firm performance has very important significance for other companies.
9Through analyzing the differences of the equity incentive systems of these three
companies, we can also find some characteristics of each type of equity incentive
method, and then other similar companies can learn from that and design an equity
incentive plan that will suit them.
1.3 Research questions
In this research, we will mainly focus on three questions. First, to what extent the
equity incentive compensation system influences the performance of Alibaba group?
Second, what are the differences between the equity incentive compensation systems
in Alibaba and other two companies in the same industry? Third, what are the
advantages and disadvantages of the equity incentive compensation systems in these
three companies?
1.4 Structure of the thesis
In this research Alibaba, Baidu and Tencent are chosen as the main study subjects.
The dissertation can be divided into four parts.
The first part is the introduction, and in this part the background and the significance
of the research are introduced as well as a brief introduction of Alibaba, Baidu and
Tencent.
The second part is about the theoretical review, and in this part the concept of equity
incentive system will be introduced as well as what early research thinks about the
relationship between the equity incentive system and the growth of the company, and
the evaluation method of the influence of the equity system.
In the third part, the research method will be introduced and the reason to use it will
be explained as well as data collection.
In the forth part, an analysis about the relationship between the company growth and
10the equity incentive system in BAT will be made and the differences between the
equity incentive systems in these three companies will be compared.
In the final part, a conclusion about the research findings will be made, and the
limitation and prospects for future research will be presented.
112. Theoretical review
With the literature review we aim at knowing what an equity incentive compensation
system is, and the relationship between the equity incentive system and the firm
performance. This chapter will focus on the definition of the equity incentive
compensation system.
2.1 Equity Incentive Compensation system
Equity incentives are a form of providing long-term incentives for employees. The
enterprise will give employees part of the shareholders' equity, so that it forms a
community of interests with the enterprise, so as to achieve its long-term goal. Equity
based compensation is a form of employee compensation regarding the employee’s
effort, with payment in company shares or employee stock options (ESOs) (Ittner et
al., 2003). Equity-based compensation (EBC) plans were traditionally used by
companies to reward their top management and key employees and to align the
interests of these employees with those of shareholders (Frye, 2004). Equity-based
compensation such as restricted stock grants and options are increasingly common,
not only for CEOs and other top executives, but also for business unit managers and
other non-C-suite employees (Oxley, 2015). It is a long-term incentive mechanism
that for enterprises to encourage and retain their core talents. The initial thrust of the
literature that analyzes the effect of managerial ownership on the company
performance was that: greater managerial ownership benefits shareholders because it
increases managers’ incentives to increase firm value (Jensen and Meckling, 1976;
Morck et al, 1988; Stulz, 1988).
Equity-based compensation plans include employee stock option plans, employee
stock purchase plans and restricted stock plans (Frye, 2004).
Employee stock options are tax deductible and hence are able to generate substantial
12non-debt tax shields (Chang et al, 2013). Non-executive employee stock options can
enhance cooperation among employees and induce mutual monitoring among
co-workers (Hochberg and Lindsey, 2010).
Employee Stock Purchase Plan (ESPP) is a company-run program in which
participating employees can purchase company shares at a discounted price.
Employees contribute to the plan through payroll deductions, which build up between
the offering date and the purchase date. At the purchase date, the company uses the
accumulated funds to purchase shares in the company on behalf of the participating
employees. The amount of the discount depends on the special plan but is typically set
at 15% of the market price (Babenko and Sen, 2010). ESSP and the employee stock
option plans are different, in employee stock purchase plans (ESPPs), is less of a
concern because employees could elect to sell those shares at any time (Bova, 2013).
Also, normally the ESSP are open to every employee in the company, but the
employee stock option plans are mostly given to senior level employees (Babenko
and Sen, 2010).
2.2 Motivation theories
The topic of employee motivation plays a central role in the field of
management—both practically and theoretically (Steers et al, 2004). The theory of
motivation is the guiding theory of how to design incentive programs. Here we will
explore the nature of the equity incentive system through two important motivation
theories, Maslow’s need theory and Frederick Herzberg’s two-factor theory.
1) Need theory
Psychologist Abraham Maslow first developed his famous theory of individual
development and motivation in the 1940’s. Five levels typically represent Maslow’s
motivation theory:
13Physiological needs – such as hunger, thirst and sleep.
Safety needs – such as security, protection from danger and freedom from pain.
Social needs – sometimes also referred to as love needs such as friendship, giving and
receiving love, engaging in social activities and group membership.
Esteem needs – these include both self-respect and the esteem of others. For example,
the desire for self-confidence and achievement, and recognition and appreciation.
Self-actualization – This is about the desire to develop and realize your one’s
potential and to become everything one can be.
In each level, there is always a demand for the higher position. Specifically Maslow
theorised that people have five types of needs and that these are activated in a
hierarchical manner. This means that these needs are aroused in a specific order from
lowest to highest, such that the lowest-order need must be fulfilled before the next
order need is triggered and the process continues (Kaur, 2013). For most people, the
work and return in a given social organization is the main way to meet their inner
needs. These inner needs are met again and again, and the satisfaction of the main
needs that people do not meet will determine their motivation and behavior.
However, the equity incentive policy can provide employees with a large amount of
financial reward, and also can provide them with a sense of successful, which can be a
non-financial reward. Through the equity incentive policy, employees can have some
benefits from the increase of the firm value, and the increase of the firm value can be
influenced by the daily jobs of employees. This can make employees feel that they are
making contributions to the company.
2) Two-factor theory
14In 1959, Frederick Herzberg, a behavioral scientist proposed the two-factor theory or
the motivation-hygiene theory. According to Herzberg, there are some job factors that
result in satisfaction while there are other job factors that prevent dissatisfaction.
Based on individual responses to questions as to what provides them with the most
memorable instances of happiness or unhappiness at work, people tend to indicate two
different sets of factors, one contributing to happiness, the other to unhappiness
(Mailer, 1981).
In his theory, Herzberg (1959) thinks that the employees will be influenced by two
main factors, that is, hygiene factors and motivators. The hygiene factors are related
with the basic needs of life, like safe, fair treatment while the motivators mean those
factors that can improve employees’ satisfaction and passion.
Obviously, employees cannot live and feel safe if they do not have a basic salary, so
we can consider the basic salary as a hygiene factor. About the incentives, employees
have already regarded the normal financial reward as a natural thing, without that
employees will not be happy, so the normal financial reward can also be part of the
hygiene factors, and a higher reward can bring a higher passion for employees in their
daily work, so it also has some features of the motivation factors. However, the
normal financial reward is a short-term motivation, while the company should have a
long-term motivation plan to make employees have more passion. In this regard the
equity incentive system is the best way for the long-term motivation since employees
will become owners of their company. So the two-factor theory seems to support the
need for companies to have an equity incentive system.
2.3 Employee equity and firm performance
About the relationship between employee equity and firm performance, many
researchers have already studied this problem. Some of them think that employee
equity ownership will influence firm performance or company growth, but others do
not agree with this opinion.
152.3.1 Employee equity ownership will influence the firm performance of the
company
Berle and Means (1932) found that when the company's equity concentration is low,
top managers will focus on pursuing their personal interests if they just have a small
amount of stake or even when they do not have. So they will not firstly consider the
benefit of the shareholders. However, if the amount of managers’ stake is high, the
interests of the top managers and the shareholders will become more and more similar,
and top managers will also work for the benefit of the whole company. Firms with
unexpectedly high levels of option incentives exhibit significantly higher levels of
firm performance. The results hold for both executives and employees (Hillegeist,
2003).
Morck, Shlesfer and Vinshny (1988) made a research about 371 firms, “we examine
the reduced-form relationship between management ownership of the firm's equity
and the market valuation of its tangible assets in a cross-section of 371 1980 Fortune
500 firms. Tobin's Q (The Tobin's Q ratio is a ratio devised by James Tobin of Yale
University, Nobel laureate in economics, who hypothesized that the combined market
value of all the companies on the stock market should be about equal to their
replacement costs. The Q ratio is calculated as the market value of a company divided
by the replacement value of the firm's assets) rises as board ownership increases from
0% to 5%, falls as ownership rises further to 25%, and then continues to rise, although
much more slowly, as board ownership rises beyond 25%.” From this result, we can
see that Tobin’s Q can be regarded as the enterprise value, so if the employee
shareholding ratio is in 0-5%, this amount will have a positive influence on the
performance of employees, and then it will bring an increase on the enterprise value.
However, if the employee shareholding ratio is between 5%-25%, the influence will
be negative. And if the ratio is higher then 25%, it will also have a positive influence,
but the influence will be lower then before.
16Meconnell (1990) also got a similar result from his research. In his research, he
explored the relation between corporate value and the structure of equity ownership.
He found a strong curvilinear relation between Tobin’s Q and the fraction of shares
owned by corporate insiders. At low levels of insider ownership, the relation is
strongly positive. Depending on the period considered, the relation between Q and
insider ownership ranges from one-to-one to as high as three-to-one. At high levels of
insider ownership, the relation between Q and insider ownership is negative, but the
downward pull is relatively muted. Additionally, he found a strong positive relation
between Q and the fraction of shares held by institutional investors. Finally, when
block ownership is entered separately as an independent variable, he found no
significant relation between Q and several alternative specifications of block-holder
ownership.
In China, some researchers also pursued this issue. Huang and Dai (2005) made a
research about the equity incentive compensation systems in 53 High-Tech companies,
and got the conclusion that the employee shareholding ratio can significantly affect
company performance, and that a higher employee shareholding ratio can lead to a
higher company performance. Shen and Niu (2003) have a more specific research.
They found that the employee shareholding does not have a significant relationship
with the net income and earning per share of the company, but the employee
shareholding ratio can have a significant positive relationship with the earning per
share of the company. They got the conclusion that increasing employee shareholding
ratio can effectively reduce moral hazard. Zhe, Yang and Xu (2013) also got the result
that equity incentive benefits contribute to the growth of the firm value through a
research about 75 listed companies in Shanghai and Shenzhen stock exchange (Anhui
province).
172.3.2 Employee equity ownership will not influence the firm performance of the
company
Jensen and Murphy (1990) made a regression analysis about 1,049 companies, and
they got the result that if the enterprise value increases by $1,000, temployees can just
get $3.25 from the equity incentive compensation, so the equity incentive
compensation system cannot provide an enough incentive for employees. Demsetz
and Villalonga (2001) also hold the opinion that ownership structure cannot influence
the firms’ performance and reduce the agency costs. We find that managerial
ownership does not create or destroy value. In contrast to previous UK or US findings,
we show that the relationship between firm value and managerial ownership is weak
or nonexistent (Faccio and Lasfer, 1999).
In China, some researchers share this opinion too. Huawei Zhao (2016) made a
research based on the statistics about Chinese listed companied in 2006-2014, and he
found that the equity incentive compensation system in these companies does not
have a significant influence on firms’ performance, but he thinks that one of the
reasons is that China's capital market is not that perfect, and that such a macro
environment will also affect the implementation of equity incentive system to a
certain extent. Chen and Yang (2016) also made a research about 32 listed companies
that had implemented equity incentives in the year of 2008-2009 to test the
relationship between the equity incentive and corporate performance, and they got the
conclusion that China’s capital market is not mature enough and a variety of systems
is not standardized, so market value does not reflect the true operating results of
companies. In this case incentives are likely to result in the manager’ pursuit of stock
prices, and the formation of manager’s short-term behavior. How to evaluate if the
equity incentive compensation system works
182.3.3 The effectiveness of the system
The effectiveness of the incentive compensation system depends on whether
employees can do the actions according to the interests of shareholders, reduce the
cost of the enterprise effectively, increase the performance of the enterprise,and
ultimately enhance the value of the company.
However, the final goal of the incentive compensation system is to align the goals of
the employees and shareholders and get a maximum stock value of the enterprise. So
the shareholder value is an important point to evaluate the effectiveness of the
incentive compensation system. In addition the shareholder value has a positive
correlation with the enterprise value, so we can regard the enterprise value as a
measure of effectiveness. Xiao (2003) also thought that the standard of the
effectiveness should be the size of shareholder utility, and because the shareholder
utility has a positive linear relationship with firm value, we can consider firm value as
the standard to value the effectiveness of the equity incentive compensation system.
From the perspective of the company operator, the enterprise value can be shown on
the company's total assets deducted from current liabilities while from the perspective
of the shareholders of the company, the enterprise value can be shown on the equity
value or the assets of the company.
2.3.4 The factors that will influence the system
Not only the strength of equity incentives, but also the nature of enterprises and
capital structure can influence the effectiveness of the equity incentive system.
Without considering other factors, the implementation of equity incentives in
state-owned enterprises is better than in non-state enterprises. This may be because
the low asset-liability ratio of the implementation of the enterprise equity incentive
may help reduce agency costs (Wang et al, 2013).
19Fama (1964) made a development of the efficient-market hypothesis. He thought that
if the market can reflect the information about the stock price exactly, the market is
effective. Although Fama’s research is not for the equity incentive system, it can tell
us that the more effective the market is, the more exact the stock price can reflect the
firm value, and the equity incentive system will also be more effective. Tian and
Jihnson (2000) also thought that different types of equity incentive methods will have
different effectiveness, so it is very important to choose a right type of method for a
specific company.
203. Methodology
The aim of this chapter is to introduce the reason why the quantitative analysis
method was chosen for this study. Additionally, the process of data collection will be
explained, and how analyzed. In order to gain a more detailed understanding of the
incentive compensation system of Alibaba, this research compares the incentive
compensation systems of Alibaba with some other enterprise in the similar area.
3.1 Research method
Quantitative methods use complex statistical and mathematical data to measure social
phenomenon or understand behavior. These methods are deductive and generalizing,
from general to detail. They can be used in interpreting causal and statistical
relationships through hypotheses (Babbie, 2010). These methods are usually
employed in research with some samples and when it is easy to find generalizable
data. However, the quantitative methods are not suitable in such cases that are not
simply measurable by numbers (Silverman 2005).
Quantitative analysis is a method to analyze the quantitative changes in social
phenomena. In enterprise management, quantitative analysis is based on corporate
financial statements as the main source of data, according to a mathematical approach
to processing and finishing, and finally gets the enterprise credit results. Quantitative
analysis is the use of mathematical models of investment analysts to quantify the
company's data analysis, through the analysis of the company to give evaluation and
make investment judgments. The main objects of the quantitative analysis are the
financial statements, such as the balance sheet, income statement, retained earnings
and so on. Its function is to reveal and describe the interaction and development trend
of social phenomena.
213.2 Research design
In this research, the main purpose is to compare the equity incentive compensation
system of Alibaba with some other enterprise in the similar area. In this case, we will
choose Baidu and Tencent as the other two companies. And also, we will have 4 steps
to make this study.
Firstly, we will make a brief introduction of the stock incentive compensation system
in these three companies. Secondly, the effectiveness of the incentive compensation
system can be judged mainly from the stock value, the return on equity and earn per
share (EPS), so in this step, we will measure the effectiveness of the system with
these concepts. Then thirdly, depending on the results on step 2, we will make an
analysis about the advantages and disadvantages of the incentive compensations in the
three companies. Finally, we will make a conclusion with the findings in the research.
3.3 Data collection
In this research, we will mainly use the statistics of the earning per share, total assets,
revenue and some data about the equity incentive compensation of few years about
Alibaba, Baidu and Tencent. Because Alibaba and Baidu ware listed in New York, so
the statistics about these two companies will be mainly drawn from US Securities and
Exchange Commission. However, Tencent is listed in Hong Kong, so the statistics
about Tencent will mainly from the Hong Kong Exchanges and Clearing Limited
(HKEx).
3.4 Data Analysis
In the data analysis, we will choose Spearman’s correlation coefficient for ranking
data as my main method. Spearman’s rank correlation coefficient is a nonparametric
(distribution-free) rank statistic proposed by Charles Spearman as a measure of the
strength of an association between two variables (Hauke and Kossowski, 2011). The
22Spearman rank correlation coefficient can be a useful tool for exploratory data
analysis. Potential applications are numerous (Gauthier, 2001). Spearman’s
correlation coefficient is mainly used to solve the problem of named data and
sequential data. It is usually applicable in two columns of variables, and with the
nature of the level of variables with a linear relationship between the data.
In this research, the reason why we choose this research method is that we will have
to measure if the stock incentive compensation system works with many company's
market value indicators.
234. Analysis
4.1 The Equity Incentive Compensation system in BAT
4.1.1 Alibaba group
Many entrepreneurs think about how to establish their own long-term incentive
system, however, Alibaba Group has developed its own equity incentive system at a
early time. After Ma and other high-level managers’ development and research,
Alibaba Group published a "Restricted shares unit plan" in 2014, employees get
restricted shares each year, which aimed at being conducive to maintaining the
stability of the team, and the enthusiasm of the staff. Whether in the listed Alibaba
network or in the unlisted Alibaba Group, restricted shares unit plan is thought to be
an important means of retaining their talent.
The restricted shares unit is essentially a stock or option. After the employee receives
the restricted shareholding unit, he will get the benefit from that after one year. Each
of the restricted shares issued by the unit is divided into four years in place, granted
25% per year. The number of restricted shares held by employees increase as a result
of the annual bonus issue of new restricted shares. Because of this way of rolling
increases, Alibaba Group employees will always have a part of the options that have
not yet exercised, and thus help the company to retain employees.
According to the file that Alibaba submitted to the U.S. Securities and Exchange
Commission (SEC), since its inception in 1999, Ali has provided the current and
former staff with a total of 26.7% stake as stock incentive compensation. According
to Alibaba’s stock value at that time, which is 68 dollars per share, and Alibaba’s
market value of 167.3 billion US dollars, Alibaba's IPO in September, 2014 could
bring about $ 45.7 billion in wealth for their employees.
Alibaba still has its own stock incentive compensation system after its IPO in 2014.
24The detailed Share-based compensation expense is shown in table 1.
Table 1 Share-based compensation expenses in Alibaba (in thousand, USD)
Share-based compensation expense Revenue % Of Revenue
2013 659 18,754 3.5%
2014 4,313 26,179 16.4%
2015 4,370 34,543 12.6%
2016 3,744 53,248 7.0%
Source: https://www.sec.gov/, 2017/5/2
From the table we can see that in 2013, before its IPO, Alibaba’s share-based
compensation expense is just 659 million RMB, which takes 3.5% of revenue, but
after its IPO, from 2014, its share-based compensation expense increases to a large
amount, 4,313 in 2014, 4,370 in 2015 and 3,744 in 2016. However, because of the
increase in revenue, the percentages of revenue are not the same in these three years;
they decreased from 16.4% to 12.6% in 2015, and decreased again to 7.0% in 2016.
So Alibaba has a high proportion of employee holdings, reflecting the essence of
sharing in the Internet business. So, when join this kind of companies, timing is very
important, and for example the staff from last year may have much more options than
employees at the same level from this year.
4.1.2 Tencent
Tencent chooses the type of stock option incentive as its main stock incentive
compensation method. The company has adopted four shareholding schemes, namely,
the shareholding scheme before IPO, the shareholding scheme after IPO I, the
shareholding scheme after IPO II and the shareholding scheme after IPO III. The
shareholding scheme before IPO and the shareholding scheme after IPO I expired on
2531 December 2011 and 23 March 2014 respectively.
When listed in HKEx in June 2004, Tencent's issue price was only 3.7 Hong Kong
dollars. In accordance with this price, Tencent’s executives gave birth to five
billionaires, seven millionaires. Tencent’s CEO Ma Huateng holds 14.43% stake and
has a net worth of 898 million Hong Kong dollars
(https://zhuanlan.zhihu.com/p/25248376, 2017/4/15).
In December 2007, Tencent announced the intention to retain and attract talent
through an equity incentive plan. Within 10 years of validity, the total number of
shares granted by the Group did not exceed 2% of the issued share capital, and the
maximum number of shares granted to the awarding individuals is no more than 1%
of the issued share capital.
By 2013, the above-mentioned equity incentive plan has been expanded to a
maximum of 3% from 2% of the issued share capital. It is reported that, including the
project manager, director, including more than a thousand grassroots cadres were
included in the new reward range.
During this period, Tencent also had several equity incentives, including the 2008
Board of Directors resolution awarding 101.605 million new shares to 184 employees
and the 818.118 million shares awarded in 2009 to 1250 employees,. Tencent
employees were then about 5000 people, so equity incentive employees accounted for
nearly a quarter. Until 31 December 2006, the directors of the Company still had a
total of 11,250,000 outstanding options (http://www.hkexnews.hk/index_c.htm,
2017/5/2).
Table 2 Share-based compensation expenses in Tencent (in thousand, HKD)
Date of grant Mar.24, 2010 Mar.25, 2014 Mar.21, 2016 In total
Jan.1, 2016 5,000,000 5,000,000 ----------------- 10,000,000
26Granted in the year ----------------- ----------------- 3,750,000 3,750,000
Exercised in the year 2,500,000 ----------------- ----------------- 2,500,000
Dec.31, 2016 2,500,000 5,000,000 3,750,000 11,250,000
Exercise price 31.70 114.52 158.10
Exercise date 2015-2020 2015-2021 2017-2023
Source: http://www.hkexnews.hk/index_c.htm, 2017/5/2
Compared to the option, Tencent is more willing to pay cash to employees. In this
type of Internet Company, the entrepreneurial atmosphere will be lighter and staff is
more similar to professional managers in their company’s daily work.
4.1.3 Baidu
The stock incentive compensation strategy in Baidu is just similar to that in Tencent.
Baidu also chooses stock option incentive as its main method. However, there are still
many differences if compared with Tencent in the amount of the incentive.
Table 3 Share-based compensation expenses in Baidu (in thousand, USD)
Share-based compensation Total revenues % Of Revenue
expenses
2004 16,510 117,451 14.1%
2005 33,571 319,215 10.1%
2006 48,280 837,838 5.8%
2007 39,848 1,744,425 2.3%
2008 83,977 3,198,252 2.6%
2009 86,318 4,447,776 1.9%
2010 93,736 7,915,074 1.2%
2011 152,028 14,500,786 1.0%
2012 212,309 22,306,026 1.0%
272013 514,727 31,943,924 1.6%
2014 962,740 49,052,318 2.0%
2015 1,759,988 70,549,364 2.5%
2016 1,387,118 66,381,729 2.1%
Source: https://www.sec.gov/, 2017/5/2
Baidu was listed in Nasdaq, in the USA in August 2005, and from the Table we can
see that before that time, in 2004, the share-based compensation expenses of the
company is 16,510 thousands RMB, representing 14.1% of revenue. Then after that,
the share-based compensation expenses are always rising, but the percentages of
revenue are decreasing until 2012, which is only 1.0%. From 2012 to 2015, the
percentages are rising again, from 1.0% in 2012 to 2.5% in 2016.
The largest decrease is in 2006, from 10.1% to 5.8%. In the same year, in July 10,
2006, Baidu made many layoffs in the enterprise, which shocked the Chinese Internet
community. Baidu dissolved the Enterprise Soft Division (ES) and lay-offed 30
employees within 4 hours in the same day. The layoff ratio was about 1.3%. However,
it is noteworthy that the Enterprise Soft Division was abolished in an early time, and
most of the employees have a high annual salary. More importantly, a large part of
people have options which are more than 4000 shares, and these employees only
cashed a small part of the options at that time.
4.2 Relationship between equity incentive system and firm performance
4.2.1 Alibaba
Alibaba has already applied the equity incentive system since it was listed in America,
and here is the data about the total share-based compensation expense, diluted
earnings per share, total assets and the revenue increase:
28Table 4 Equity incentives and firm performance in Alibaba
EPS Incentive Total assets Revenue
(USD) (In thousand, (In thousand, (In thousand,
USD) USD) USD)
2017.03 4.12 385790 506812 38579
2016.12 6.94 169288 490866 24184
2016.09 2.97 188447 456402 15704
2016.06 2.94 111447 409970 10132
2016.03 2.11 101953 364245 6372
2015.12 4.9 59595 364671 4584
2015.09 8.87 48620 327758 3473
2015.06 11.92 54264 282060 2713
2015.03 1.12 54669 255434 2025
2014.12 2.29 22342 269993 1396
2014.09 1.24 17954 232342 997
2014.06 5.2 3491 161193 499
2014.03 2.37 2955 111549 369
Source: https://www.sec.gov/, 2017/5/2
From this Table we can see that the EPS has a highest point in 2015.06, which is
11.92, and in this period the percentage of revenue about total share-based
compensation expense was also the highest, which is 20%. However, the highest
revenue point was in 2017.03, and the percentage of revenue about total share-based
compensation expense in this period was just 10%.
29Figure 1 Scatter plot of Alibaba
450000
400000
350000
300000
Revenue
250000
200000
150000
100000
50000
0
0 5000 10000 15000 20000 25000 30000 35000 40000 45000
Incentive
After we made the scatter plot analysis between the EPS and revenue in Excel, we got
figure 1, and we can see the relationship between the equity incentive and revenue in
each year. Generally, there is a weak relationship between these two factors, so we try
to make the Spearman's correlation coefficient analysis between these statistics, to see
if we can find some relationships.
Table 5 Linear relationship ratio in Alibaba
Correlations (N=13)
Total
EPS Incentive assets Revenue
Spearman's EPS Correlation 1.000
rho Coefficient
Sig. (2-tailed) .
Incentive Correlation -.386 1.000
Coefficient
Sig. (2-tailed) .193 .
30Total assets Correlation .319 -.251 1.000
Coefficient
Sig. (2-tailed) .289 .409 .
**
Revenue Correlation -.033 -.212 .720 1.000
Coefficient
Sig. (2-tailed) .915 .487 .006 .
**. Correlation is significant at the 0.01 level (2-tailed).
From the analysis in SPSS, we got the data in table 5. In the significant part of the
statistics in % of revenue and other three groups, the Sig. (2-tailed) is 0.714 between
EPS and % of revenue, and 0.537 between total assets and % of revenue, and 0.834
between revenue increase and % of revenue, and 0.193, 0.409 and 0.487 are all larger
than 0.05, so there is no linear relationship between % of revenue and other three
variables.
After calculating the Spearman's correlation coefficient of the percentage of revenue
about total share-based compensation expense and other data in SPSS, we also find
that the ratio between the EPS and the percentage of revenue about total share-based
compensation expense is -0.382, and for the total assets and the percentage of revenue
about total share-based compensation expense is -0.252. For the revenue increase and
the percentage of revenue about total share-based compensation expense is -0.282.
And the average of these is -0.282.
From these statistics, we can find that the linear relationship between the percentage
of revenue about total share-based compensation expense and diluted earnings per
share, total assets and the revenue increase is not related. What is more, the diluted
earnings per share, total assets and the revenue increase can reflect the firm
performance, so the linear relationship ratio between firm performance and equity
incentive policy is very small, that is, from these statistics we can get the conclusion
that the equity incentive system in Alibaba is not related with firm performance.
31However, because Alibaba group was listed in the US just in 2014, we can only find
the exact statistics about its equity incentive plan since its IPO, so this can be a
limitation for this research. In addition other company strategies can also influence
the result of the firm performance.
4.2.2 Tencent
Tencent applied its equity incentive plan since 2008, and here are the statistics about
its EPS, shares held by the plan, total assets and revenue in 2007-2016.
Table 6 Equity incentives and firm performance in Tencent (in thousand, HKD)
EPS Shares held by the plan Total assets Revenue
(HKD)
2016.12.31 4.329 3136 395899 151938
2015.12.31 3.055 1817 306818 102863
2014.12.31 2.545 1309 95845 78932
2013.12.31 1.66 871 53549 60347
2012.12.31 6.833 667 75256 43893
2011.12.31 5.49 607 56804 28496
2010.12.31 4.328 258 35830 19646
2009.12.31 2.791 124 17506 12440
2008.12.31 1.514 22 3360 7155
2007.12.31 0.853 0 2090 3821
Source: http://www.hkexnews.hk/index_c.htm, 2017/5/2
From the table we can see that in Tencent, the shares held by the plan, total assets and
the revenue were always rising with a similar speed. However, there is an important
point for the EPS in 2013: it suddenly decreased from 6.833 to 1.66.
32Figure 2 Scatter plot of Tencent
160000
140000
120000
100000
Revenue
80000
60000
40000
20000
0
0 1 2 3 4 5 6 7 8
Incentive
After making the scatter plot analysis between the EPS and revenue in Excel, figure 2
was obtained and we can see the relationship between the equity incentive and
revenue in each year. Generally, the relationship between these two factors is very
similar to a linear relationship, so the Spearman's correlation coefficient analysis
between these statistics will be used to see if some relationships can be found.
Table 7 Linear relationship ratio in Tencent
Correlations (N=10)
Total
EPS Shares assets Revenue
Spearman's rho EPS Correlation 1.000
Coefficient
Sig. (2-tailed) .
Shares Correlation .455 1.000
Coefficient
Sig. (2-tailed) .187 .
**
Total Correlation .612 .964 1.000
assets Coefficient
Sig. (2-tailed) .060 .000 .
33Revenue Correlation .455 1.000** .964** 1.000
Coefficient
Sig. (2-tailed) .187 . .000 .
**. Correlation is significant at the 0.01 level (2-tailed).
From the analysis in SPSS, we got the statistics in table 7. In the significant part of the
statistics in Shares held by the plan and other three groups, the Sig. (2-tailed) is 0.522
between EPS and Shares held by the plan, and 0.000 between Total assets and Shares
held by the plan, and 0.000 between Revenue and Shares held by the plan, and 0.000
and 0.000 are all less than 0.01, so there is a strong linear relationship between Shares
held by the plan and these two variables.
After calculating the Spearman’s correlation coefficient of the shares held by the plan
and other data in SPSS, we found that the ratio between the shares held by the plan
and the EPS is 0.455, and the ratio between the shares held by the plan and the total
assets is 0.964, while the ratio between the shares held by the plan and the revenue is
1.000. These ratios tell us that there is a strong linear relationship between the shares
held by the plan and total assets, as well as with revenues, but the ratio between
shares held by the plan and the EPS is not that large.
However, according to the sharp decrease of EPS in 2013, we tried to calculate the
linear relationship ratio separately, that is, calculate the ratio from 2007 to 2012, and
the ratio from 2012 to 2016. Finally, we get the ratio from 2007 to 2012, which is
0.97, and the ratio from 2012 to 2016 is 0.99, so we can also find that there is a strong
relationship between the EPS and the shares held by the plan considering that the
average of the ratio is 0.98. Since EPS, total assets and revenue can reflect firm
performance, the linear relationship ratio between firm performance and the equity
incentive policy in Tencent is also quite large, that is, the equity incentive plan has a
great influence on firm performance, and their relationship is positive.
Concerning the sharp decrease of EPS in 2013, the main reason for that is that
Tencent applied a stock split plan in May 15, 2013. Tencent split 1 stock in 5 stocks at
34that time, so the stock price as well as the EPS also decreased to one-fifth in that year,
which caused the weak linear relationship between the EPS and the shares held by the
plan.
4.2.3 Baidu
Baidu also applied its equity incentive plan since it’s IPO in 2005, just the same as
Alibaba. However, the result in Baidu is not the same as that in Alibaba. Here are the
statistics about its EPS, share-based compensation expenses, total assets and revenue
from 2005-2016.
Table 8 Equity incentives and firm performance in Baidu (in thousand, USD)
EPS Share-based compensation Total assets Revenue
expenses
(USD)
2005 1 33,571 1136 319
2006 8 48,280 1668 838
2007 18 39,848 2656 1744
2008 30 83,977 3938 3198
2009 43 86,318 6157 4447
2010 101 93,736 11048 7915
2011 190 152,028 23341 14501
2012 298 212,309 45669 22306
2013 299 514,727 70986 31944
2014 373 962,740 99661 49052
2015 951 1,759,988 147853 66382
2016 318 1,387,118 181997 70549
Source: https://www.sec.gov/, 2017/5/2
35From the statistics we can see that the dates of EPS, the total assets and the revenue
ware keep rising from 2005 to 2016, but for the share-based compensation expenses,
it has a decrease in 2007, from 48,280 to 39,848, and a decrease in 2016, from
1,759,988 to 1,387,188. However, except these two years, the share-based
compensation expenses ware also increasing these few years, and the largest increase
was in 2013, from 212,309 to 514,727, increased by 142%.
Figure 3 Scatter plot of Baidu
80000
70000
60000
50000
Revenue
40000
30000
20000
10000
0
0 200 400 600 800 1000
Incentive
After we made the scatter plot analysis between the EPS and revenue in Excel, we got
figure 3, and we can see the relationship between the equity incentive and revenue in
each year. Generally, the relationship between these two factors is very similar to a
linear relationship, so we try to make the Spearman's correlation coefficient analysis
between these statistics, to see if we can find some relationships.
Table 9 Linear relationship ratio in Baidu
Correlations (N=12)
Total
EPS Shares assets Revenue
Spearman's rho EPS Correlation 1.000
Coefficient
36Sig. (2-tailed) .
**
Shares Correlation .986 1.000
Coefficient
Sig. (2-tailed) .000 .
Total Correlation .979** .986 **
1.000
assets Coefficient
Sig. (2-tailed) .000 .000 .
Revenue Correlation .979** .986** 1.000**
1.000
Coefficient
Sig. (2-tailed) .000 .000 . .
**. Correlation is significant at the 0.01 level (2-tailed).
From the analysis in SPSS, we got the statistics in table 9. In the significant part of the
statistics in Share-based compensation expenses and other three groups, the Sig.
(2-tailed) is 0.000 between EPS and Share-based compensation expenses, and 0.000
between Total assets and Share-based compensation expenses, and 0.000 between
Revenue and Share-based compensation expenses, and 0.000, 0.000 and 0.000 are all
less than 0.01, so there is a strong linear relationship between Share-based
compensation expenses and the other three variables.
After calculating the Spearman’s correlation coefficient of the share-based
compensation expenses and other statistics in SPSS, we found that the linear
relationship ratio between the share-based compensation expenses and the EPS is
0.986, and the linear relationship ratio between the share-based compensation
expenses and the total assets is 0.986, and the linear relationship ratio between the
share-based compensation expenses and the revenue is 0.986. And the average of the
ratio is 0.986.
These ratios tell us that there is a strong linear relationship between the share-based
compensation expenses and EPS, the total assets and the revenue. As the EPS, the
total assets and the revenue can reflect the firm performance well, in Baidu, the
relationship between the share-based compensation expenses and the firm
performance is strong. In other word, the equity incentive compensation plan in Baidu
can be related with the firm performance.
37You can also read