Multimodal Logistics Greater St. Louis - regional industry overview
←
→
Page content transcription
If your browser does not render page correctly, please read the page content below
regional industry overview

Greater St. Louis
Multimodal Logistics
1

Table of Contents

  3 introduction
  4 cluster overview
  5 industry profile
  8 manufacturing cluster & multimodal logistics cluster
  9 concentration of employment
 10 geographic distribution of employment
 13 hiring & earnings by industry
 14 business profile
 15 exports
 16 infrastructure assets
 20 national forecasts – employment/output
 20 talent profile
 23 occupation forecast
 24 higher education & training
 24 next steps
 26 sources
2

executive summary

The Multimodal Logistics Industry cluster is an integral part of the region’s economy, supporting the manufacturing base
as well as the retail and commodities distribution sectors with inbound and outbound shipments around the country and
around the globe. This cluster is made up of three primary components: transportation, wholesale trade, and warehousing
and storage, with support from specialized logistics consulting services.

• The Multimodal Logistics cluster is unique in the Regional Chamber’s economic development strategy because
  it is driven by the region’s specific location and infrastructure assets more than by the cluster’s ability to generate
  employment. Transportation is a cost of doing business. Improvements in the transportation system may not
  generate large numbers of new jobs, but they are important to enhance the competitive position of the region.

• The development of strong capacity in the transport of goods can serve to attract new manufacturing firms as well as
  retain and expand existing firms looking to cluster around an “inland port” that provides competitive time-to-market
  and cost advantages.

• The Multimodal Logistics Industry cluster is comprised of nearly 6,500 establishments which employ over 84,300.
  Merchant wholesalers account for a large share of the cluster, with about 48% of the cluster’s establishments
  and over 52% of the cluster’s jobs. The trucking industry is also a large employer, accounting for 16% of the
  cluster’s establishments and 17% of the jobs.

• Manufacturers and the construction industry spend a great deal on wholesale trade distribution services. Light truck
  and utility vehicle manufacturers and steel mills spend the largest part of their budget for wholesale trade and
  distribution services locally, with each sector spending $158 million in the St. Louis region.

• Wages in wholesale trade and manufacturing exceed average overall wages in Missouri and Illinois. Wages in the
  wholesale electronic markets and agents and brokers industries are the highest of the cluster, exceeding overall
  wages by $2,700 in Illinois and $3,400 in Missouri.

• St. Louis already possesses extensive multi-modal transportation capabilities and it is a center for both domestic
  and international freight.

• Those employed as logisticians analyze and coordinate an organization’s supply chain — the system that moves
  a product from supplier to consumer. They often manage the entire life cycle of a product, which includes how
  a product is acquired, distributed, allocated, and delivered. Due largely to the presence of Scott Air Force Base
  and the aerospace industry, the region has a high concentration of logisticians.

• Developing the region’s Multimodal Logistics cluster may also facilitate and impact national and global supply chains
  as transport through the region is improved.
3

The Regional Chamber’s Multimodal Logistics Forum members                         will describe
roadblocks to cluster growth, identify niches with the greatest                   potential for
growth, and develop strategies   to accelerate growth. The Forum
                       Raw Materials                                              will articulate                            Raw Materials
the regional value proposition for the cluster, develop messaging                 themes, and

                                                                                                                 Materials
                                     Materials

                                                                                                    (delivery)
                        (delivery)
identify companies to target for business recruitment.

                                                                                                                                             Information
                                                 Information

                                                                                                                                                           (order)
                                                               (order)
introduction

This brief provides a cluster overview for the Multimodal Logistics Forum’s work
in aligning, linking, and leveraging regional assets to promote business-driven
regional growth.

                        Manufacturing                                                                                        Manufacturing
The St. Louis Regional Chamber engaged Market Street Services to refine and
focus the approach to industry clusters to guide our economic development
efforts through 2015. One of the target clusters identified is the Multimodal

                                                                                                                 Materials
                                     Materials

                                                                                                    (delivery)
                        (delivery)

                                                                                                                                             Information
                                                 Information

Logistics Cluster. Market Street’s analysis of the region found that “today’s

                                                                                                                                                           (order)
                                                               (order)

opportunities in wholesale trade, warehousing, transportation and distribution
employment lie in effectively aligning assets such as land, buildings, multimodal
shipment and distribution systems as well as focusing on the management
of product supply chains through the design of advanced software products.
The development of strong capacity in the transport of goods can serve to
attract new as well as retain and expand existing manufacturing firms looking to
cluster around an ‘inland port’ that provides competitive time-to-market and cost
advantages”i Market Street points to the region’s key geographic advantages as
                      Distribution
well as major infrastructure          Hubas expansion at America’s Central Port
                             effort such                                                                         Distribution Hub
and plans to attract and expand international freight at Lambert and MidAmerica
                                                                                                                 Materials
                                     Materials

                                                                                                    (delivery)

airports, as opportunities for this cluster to support long-term growth.
                        (delivery)

                                                                                                                                             Information
                                                 Information

These provide Greater St. Louis with competitive advantages in an increasingly

                                                                                                                                                           (order)
                                                               (order)

global economy.

In addition to Market Street, the St. Louis Regional Chamber engaged the
Institute St. Onge and Biggins Lacy Shapiro & Company in 2011 to conduct
a logistics infrastructure assessment for the region with recommendations for
commodity flow development. According to this report, transportation and
logistics operators can consolidate
                            Retailers and regionalize freight flows to reduce costs,                                           Retailers
increase productivity, and leverage both economies of scale and capabilities.
                                                                                                                 Materials

The report presents a “game plan” for St. Louis to become “a Midwest logistics
                                                                                                    (delivery)
                                     Materials
                        (delivery)

                                                                                                                                             Information
                                                 Information

hub that catalyzes the many locational and transportation advantages of the
                                                                                                                                                           (order)
                                                               (order)

region and leverages the high volume of wholesale trade occurring in St. Louis.”ii

                                                                         Figure 1 Supply Chain

                               Consumers                                                                                      Consumers
4
cluster overview
The Multimodal Logistics Cluster is an integral part of the region’s economy, supporting the manufacturing base as well as
the retail and commodities distribution sectors with inbound and outbound shipments around the country and the globe.
This cluster is made up of three primary components: transportation, wholesale trade, and warehousing and storage with
support from specialized logistics consulting services. The supply chain extends from raw materials used in production
to the consumer of finished goods. This report focuses on the distribution portion of the supply chain, but provides some
information on the region’s manufacturing activities. More integrated supply chains allow for more integrated production,
warehousing and transportation functions. Manufacturers, wholesalers and retailers share these responsibilities along the
supply chain. Manufacturing and mobility requirements are both embedded in today’s consumer products.
Figure 1 illustrates the components of the multimodal logistics cluster as a product moves along the supply chain from basic
ingredient to a final product in the hands of consumers. The Multimodal Logistics Forum will focus on the commodity
flows into, out of and through the distribution hub.
Clusters are groups of industries closely linked by common product markets, labor pools, similar technology, value chains,
and/or other economic ties. A cluster description includes industry composition, occupational profile, and supporting
infrastructure. Figure 2 illustrates these components of the Multimodal Logistics Cluster.
Figure 2 Cluster definition
INDUSTRIES
WHOLESALE TRADE • NAICS 42
MERCHANT WHOLESALERS, MERCHANT WHOLESALERS, ELECTRONIC MARKETS & AGENTS
DURABLE GOODS NONDURABLE GOODS & BROKERS
NAICS 423 NAICS 424 NAICS 425
Motor vehicles & parts, Paper & paper products, groceries,
furniture & furnishings, chemicals, plastics materials, apparel,
lumber & construction supplies alcoholic beverages
TRANSPORTATION & WAREHOUSING • NAICS 48 – 49
AIR RAIL WATER TRUCK SUPPORT WAREHOUSING PROCESS &
NAICS 481 NAICS 482 NAICS 483 NAICS 484 ACTIVITES & STORAGE LOGISTICS
NAICS 488 NAICS 493 CONSULTING
Passenger, Line haul, General SERVICES
freight short line trucking, Air, rail, water, General, NAICS 54161
specialized & road refrigerated
trucking transportation
support5
Figure 2 Cluster definition (cont’d)
OCCUPATIONS
HIGHER WAGES MID LEVEL WAGES ENTRY LEVEL WAGES
$75,000 & Up $50,000 to $74,999 $18,000 to $49,999
Air traffic controllers, transportation, Buyers & Purchasing Agents, First-line Supervisors of helpers,
storage & distribution managers, Farm Products, commercial pilots, laborers, & material movers, sailors,
management analysts logisticians, operations research wholesale & retail buyers, transportation
analysts, aircraft cargo handling inspectors, airfield operations specialist,
supervisors, sales representative bus & truck mechanics. Heavy & tractor
wholesale & manufacturing, captains trailer truck drivers, crane & tow
of water vessels, first-line supervisors operators, railroad conductors
of transportation & material moving & yardmasters. Conveyor operators
machine & vehicle operators & tenders, industrial truck & tractor
operators, material moving workers,
shipping, receiving, & traffic clerks,
hand packers & packagers
INFRASTRUCTURE
WHOLESALE TRADE • NAICS 42
MAJOR RESEARCH EDUCATION & TRAINING UTILITIES & PROFESSIONAL
UNIVERSITIES INFRASTRUCTURE ASSOCIATIONS
38 Four Year Universities
Washington University, 20 Two Year Universities Rail, highways, river, air, real Council of Supply Chain
Saint Louis University, 200,000+ Total Enrollment estate, telecommunications Management Professionals
University of Missouri St. Louis Roundtable,
St. Louis Institute for Supply
Management - St. Louis, The
Association for Operations
Management, St. Louis
industry profile
The Multimodal Logistics cluster is unique in the Regional Chamber’s economic development strategy because it is driven
by the region’s specific location and infrastructure assets more than by the cluster’s ability to generate employment.
Transportation is a cost of doing business. Improvements in the transportation system may not generate large numbers
of new jobs, but they are important to enhance the competitive position of the region.iii
The industry sectors that make up the Multimodal Logistics Cluster were hit hard by the great recession, and recent
employment trends reflect the nation’s slow economic recovery. Figure 3 shows that St. Louis’ manufacturing employ-
ment has been declining for more than a decade. This is, in part, attributable to increased productivity and advanced
production methods that require less labor. A shift in the composition of the manufacturing base has also had an impact
on manufacturing employment in the region. In 1990, the transportation equipment manufacturing industry employed6
55,500. Over the past two decades, automobile manufacturing contracted with the closure of a Ford plant in Hazelwood
and Chrysler facilities in Fenton. By 2012, the transportation equipment manufacturing sector employed 17,200, a 69%
decline from peak employment in 1990.
Employment in the wholesale trade sector tracked closely with the overall economy prior to the great recession, but
has not recovered as quickly as overall employment due to a shift in household spending that has reduced consumer
demand. Transportation and utilities employment also reflect a downturn in consumer spending.
Figure 3 Trends in Manufacturing Wholesale Trade and Transportation Employment
St. Louis MSA 2000 – 2012 2000 = 1.00
1.1
1
0.9
0.8
0.7
0.6
0.5
2000 2001 2002 2003 2004 2005 2006 2007 2008 2009 2010 2011 2012
Nonfarm Employment Manufacturing
Wholesale Trade Transportation & Utilities
Source: BLS
The Multimodal Logistics Cluster is comprised of nearly 6,500 establishments which employ over 84,300. Merchant
wholesalers account for a large share of the cluster, with about 48% of the cluster’s establishments and over 52% of
the cluster’s jobs. The trucking industry is also a large employer, accounting for 16% of the cluster’s establishments and
17% of the jobs. Cluster industry annual wages range from $40,300 for the warehouse and storage industry to a high of
$95,000 for the pipeline transportation industry. The annual wage levels include both supervisory and nonsupervisory/
production positions.7
Figure 4 Industry Composition, Multimodal Logistics Cluster, 2011
Average
NAICS Industry Establishments Jobs Annual
Wages
423 Wholesalers, durable goods 2,053 27,252 $ 61,794
424 Wholesalers, nondurable goods 1,029 16,638 $ 55,905
425 Electronic markets and agents and brokers 1,582 8,266 $ 72,810
481 Air transportation 34 2,782 $ 69,071
482 Rail transportation* N/D 2,493 N/D
483 Water transportation 17 297 $ 72,958
484 Truck transportation 1,056 14,247 $ 42,585
486 Pipeline transportation 13 103 $ 95,088
488 Support activities for transportation 428 5,613 $ 48,996
493 Warehousing and storage 167 5,934 $ 40,323
541614 Process and logistics consulting services 87 696 $ 58,533
Total 6,466 84,321 N/A
Sources: BLS & Railroad Retirement Board
The manufacturing industry is large, with nearly 3,000 establishments and about 108,000 employees. Six industries: food;
chemical; primary metal; fabricated metal product; machinery; and transportation equipment manufacturing account for
62% of the region’s manufacturing jobs. These industries are leaders in the region’s exports and they are important users
of transportation and warehousing assets.
Figure 5 Industry Composition, Manufacturing, 2011
Average
NAICS Industry Establishments Jobs Annual
Wages
311 Food manufacturing 228 8,214 $ 54,830
325 Chemical manufacturing 212 10,647 $ 69,936
331 Primary metal manufacturing 50 7,963 $ 62,537
332 Fabricated metal product manufacturing 482 10,622 $ 49,888
333 Machinery manufacturing 253 11,914 $ 54,384
336 Transportation equipment manufacturing 114 17,831 $ 91,769
All Other Manufacturing 1,632 40,638 $ 53,300
Total 2,971 107,829 $ 61,889
Sources: BLS8
manufacturing cluster & multimodal logistics cluster
Manufacturers and the construction industry spend a great deal on wholesale trade distribution services. Figure 6 shows
local distribution expenditures of over $30 million for manufacturing sectors. Truck manufacturers and steel mills spend
the largest part of their budget for wholesale trade and distribution services locally, with each sector spending $158 million
in the St. Louis region. Other large users include the manufacturers in the food and chemical sectors.
Figure 6 Wholesale Trade Distribution Services Spending in Millions By Manufacturing Sector, 2011
Light truck & utility vehicle
Iron & steel mills
Soap & cleaning compound
Pharmaceutical preparation
Copper rolling, drawing, extruding & alloying
Flour milling & malt
Dog & cat food
Breweries
Semiconductor & related device
Air conditioning, refrigeration, & warm air heating equipment
Other basic organic chemical
Paperboard container
Construction of other new nonresidential structures
Motor vehicle parts
0 50 100 150 200
Source: IMPLAN, MIG
The type of transportation systems used and the amount spent on transportation varies among the region’s manufacturers
and wholesalers. Figure 7 shows the distribution of local spending by type of transportation for sectors with transportation
expenses over $10 million. Trucking transportation accounts for more than half of the transportation spending for most of
the sectors shown in Figure 7. The iron and steel, soap and cleaning compounds and flour industries are the exception,
with about half of expenditures for the steel and flour industries allocated to rail transportation. Other industries that spend
more than 40% of their local transportation budgets on rail include pet food and basic organic chemicals. Wholesale trade
businesses spend about 20% local transportation budgets on air transportation and printing companies spend about 17% of
their budget on air transport.9
Figure 7 Transportation Services Spending by Mode of Transportation in Millions For Selected Manufacturers, 2011
Iron & steel mills
Breweries
Flour milling & malt
Dog & cat food
Light truck & utility vehicle
Wholesale trade businesses
Ready-mix concrete
Copper rolling, drawing, extruding & alloying
Soap & cleaning compound
Other basic organic chemical
Construction of other new nonresidential structures
Paperboard container
Soft drink & ice
Construction of other new residential structures
Other aircraft parts & auxiliary equipment
Construction of new residential permanent site single- & multi-family
Printing
Motor vehicle parts
Pharmaceutical preparation
Air conditioning, refrigeration, & warm air heating equipment
$- $50 $100 $150 $200
Air Rail Water Road
Source: IMPLAN, MIG
concentration of employment
Location quotient, a measure of concentration, represents the ratio of an industry’s share of employment in a given area to
that industry’s share of employment in the overall U.S. economy. When an industry’s employment concentration is greater
than the nation’s, local firms typically produce more goods and services than the local market demands and therefore are
exporting goods and services. This concentration and specialization can drive wealth creation within the region.
The composition of the region’s overall employment base is very similar to the U.S. as a whole. The region’s wholesale
trade sector is 0.95 and transportation and warehousing is 0.97, indicating the composition is very similar to the nation
as a whole.
A number of wholesale and transportation sectors have location quotients of 1.5 or higher, indicating that these sectors
have above average concentrations. Figure 8 shows the three industries that have above average location quotients
and more than one thousand employees. Electrical equipment and wiring wholesalers added jobs and experienced an
increase in location quotient from 2002 to 2011. Regional employers for this sector include Graybar Electric Company,
French Gerleman Electric Company, and Southern Electric Supply Company, all headquartered in St. Louis. While the
number of jobs declined for paper product wholesalers, the concentration of this industry increased from 2002 to 2011.10
Larger employers in this industry include Packaging Concepts, United Stationers Supply Company, and RockTenn.
Companies that support air transportation added jobs from 2002 to 2011, while the concentration of this sector fell
slightly. Companies in this sector include Airport Terminal Services and Triumph Fabricators.
Figure 8 Location Quotients for Selected Industries, St. Louis MSA 2002, 2006, & 2011
2011 2006 2002
NAICS Industry Employment Location Employment Location Employment Location
Quotient Quotient Quotient
42361 Elec. equip. & wiring merchant wholesalers 2,412 1.74 2,050 1.67 1,927 1.24
4241 Paper & paper product merchant wholesalers 1,953 1.62 1,978 1.31 2,191 1.31
48819 Other support activites for air transport 1,610 1.68 1,708 1.92 1,373 1.77
Source: BLS
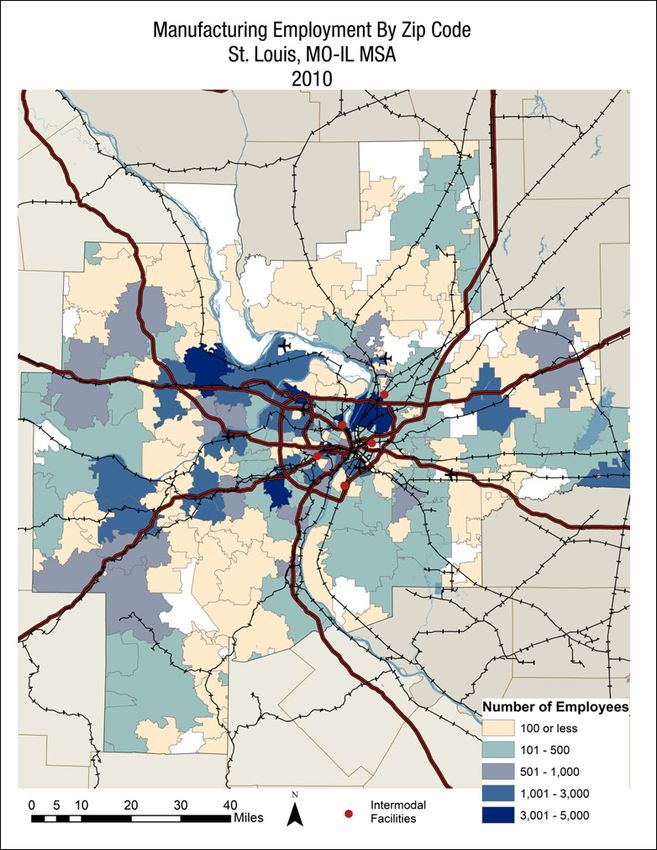
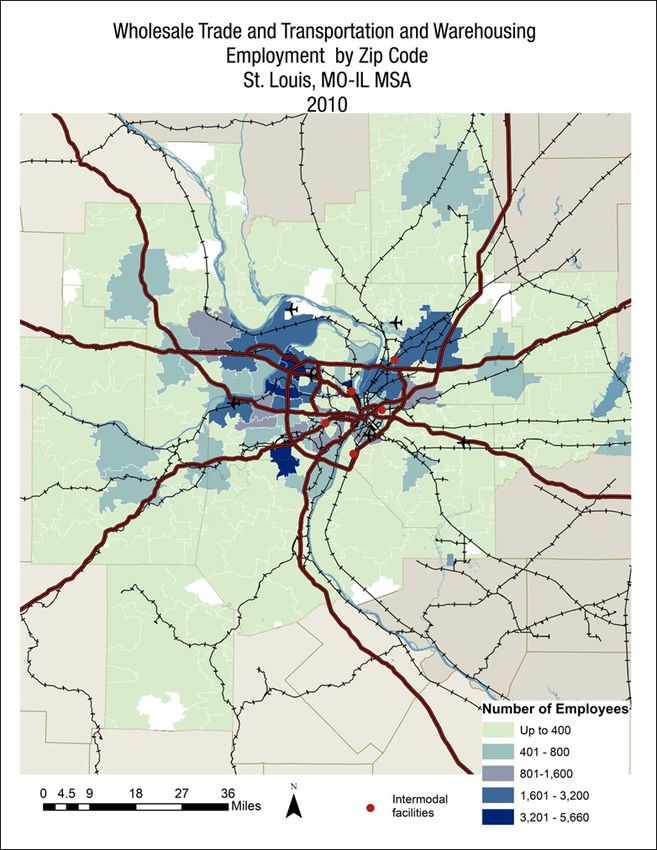
geographic distribution of employment
Geography is a major factor for the success of businesses in the cluster. Access to transportation drives the efficiency
of wholesale trade and manufacturing companies. Figures 9 and 10 illustrate how wholesale trade and manufacturing
employment group together along the region’s transportation corridors. Figure 9 shows that wholesale trade activity clusters
in the center of the region along major highway and rail corridors. Figure 10 shows that manufacturing employment is
dispersed more widely through the region, but is also located in the zip codes that have superior rail and highway access.11 Figure 9 Wholesale Trade & Transportation & Warehousing Employment by Zip Code, St. Louis, MO-IL MSA 2010 Source: County Business Patterns, U.S. Census
12

Figure 10 Manufacturing Employment by Zip Code, St. Louis, MO-IL MSA 2010

Source: County Business Patterns, U.S. Census
13

hiring & earnings by industry

One critical goal for economic development is increasing community wealth by growing industries that provide living
wages for St. Louis residents. The wages for many of the industries in the Multimodal Logistics Industry cluster exceed
average overall wages on both sides of the MSA. Wages in wholesale trade and manufacturing exceed overall wages in
Missouri and Illinois. Figure 11 presents earnings and hiring for cluster industries. Transportation and warehousing wages
exceed overall wages in Illinois and are just below total wages in Missouri. Wages in the wholesale electronic markets
and agents and brokers industries are the highest of the cluster, exceeding overall wages by $2,700 in Illinois and $3,400
in Missouri.

Wages over all industries grew by 6.9% in the Missouri portion of the region from second quarter 2011 to first quarter
2012. Wage growth in individual industries tended to be below this pace in Missouri, with the exception of durable goods
wholesalers and truck transportation, where wages grew by 7.5% and 7.5%, respectively. On the Illinois side of the
region, overall wages increased by 6.1% over the same period. Wages in Illinois wholesale trade and transportation and
warehousing industries increased by 10.2% and 8.9%. Wages in the Illinois manufacturing sectors ranged from 0.5% to
1.5% declines in chemical and machine manufacturing while wages in food and transportation equipment manufacturing
grew by more than 9%.

Wages for new hires in cluster industries also generally exceeded overall wages for new hires, with wholesale electronics
brokers and chemical manufacturing exceeding overall wages by $2,200 to $2,300 in Missouri and $1,560 to $1,970
in Illinois.iv
14

Figure 11 Average Earnings for Selected Industries, Logistics and Advanced Manufacturing Cluster,
St. Louis MSA 2Q2011 – 1Q2012
                                                                        ALL EMPLOYEES        NEW HIRES
                                                            Quarterly Monthly   Earning  Quarterly Monthly
                                                           Employment Earnings Growth % Employment Earnings

          Missouri Side of the Region
          All Industries                                     920,360    $   4,024   6.9%        65,056      $   2,406
     42   Wholesale Trade                                     56,103    $   5,760   4.5%         2,799      $   3,749
    423   Merchant Wholesalers, Durable Goods                 25,707    $   5,142   7.5%         1,156      $   3,294
    424   Merchant Wholesalers, Nondurable Goods              14,369    $   5,064   4.6%           630      $   2,999
    425   Wholesale Electronic Markets and Agents and Brokers 16,026    $   7,390   0.1%         1,013      $   4,722

 31-33    Manufacturing                                        76,022   $   4,671   -0.2%           3,126   $   3,335
   311    Food Manufacturing                                    6,325   $   3,713    2.0%             285   $   2,064
   325    Chemical Manufacturing                               10,070   $   6,005    5.2%             357   $   4,634
   333    Machinery Manufacturing                              11,657   $   4,662    0.5%             495   $   4,082
   336    Transportation Equipment Manufacturing                5,048   $   5,337   -1.6%             162   $   3,186

 48-49    Transportation and Warehousing                       30,284   $   3,713    6.3%           1,912   $   2,377
   481    Air Transportation                                    2,550   $   4,959    1.2%             158   $   2,801
   484    Truck Transportation                                 11,119   $   3,830    7.7%             801   $   2,633
   488    Support Activities for Transportation                 3,675   $   3,869    4.1%             309   $   2,627
   493    Warehousing and storage                               3,346   $   3,648    4.7%             198   $   2,373

          Illinois Side of the Region
          All Industries                                      192,997   $   3,270    6.1%       13,129      $   2,127
     42   Wholesale Trade
    423   Merchant Wholesalers, Durable Goods                   4,026   $   4,490   10.4%            200    $   3,112
    424   Merchant Wholesalers, Nondurable Goods                3,250   $   4,119   12.4%            146    $   2,877
    425   Wholesale Electronic Markets and Agents and Brokers   1,308   $   5,974    3.6%             96    $   4,098

 31-33    Manufacturing
   311    Food Manufacturing                                    1,614   $   4,022    9.7%             62    $   2,586
   325    Chemical Manufacturing                                  891   $   4,730   -0.5%             38    $   3,695
   333    Machinery Manufacturing                               1,029   $   4,492   -1.5%             57    $   2,450
   336    Transportation Equipment Manufacturing

 48-49    Transportation and Warehousing
   481    Air Transportation
   484    Truck Transportation                                  4,557   $   3,452    8.9%            340    $   2,936
   488    Support Activities for Transportation                 2,620   $   5,096    5.5%            122    $   3,932
   493    Warehousing and storage                               2,408   $   3,068   11.0%            290    $   2,858

Source: U.S Census Bureau
15
exports
In 2011, the St. Louis metropolitan area was the 23rd largest export market in the country with total merchandise
shipments of over $12.3 billion. This represents a 9.5% increase from 2010, when $11.2 billion in merchandise was
exported. China and Canada are the top export destinations, accounting for more than 30% of the exports by value.
Figure 12 presents the five top export destination countries from the St. Louis MSA. In 2011, the region benefited from
existing trade agreements, exporting $3.1 billion to the NAFTA region and $59 million to the CAFTA-DR region.v
Figure 12 Top Countries by Value of Exports from St. Louis MSA, 2011
Top Countries Value Share
China $1.9 billion 15.8%
Canada $1.8 billion 14.4%
Mexico $1.3 billion 10.9%
South Korea $558 million 4.5%
Belgium $531 million 4.3%
Source: U.S Department of Commerce
Chemicals and mining products are the largest export industries in the region, accounting for $3.6 billion in exports and
30% of total regional export in 2011. The composition of the region’s manufacturing employment distribution is consistent
with export patterns.
Figure 13 Top Industry Sectors by Value of Exports from St. Louis MSA, 2011
Top Industry Sectors Value Share
Chemicals $2.3 billion 19.1%
Mining (except oil & gas) $1.3 billion 10.9%
Transportation equipment $1.1 billion 8.8%
Food and Beverages and Tobacco products $896 million 7.3%
Machinery (except electrical) $795 million 6.5%
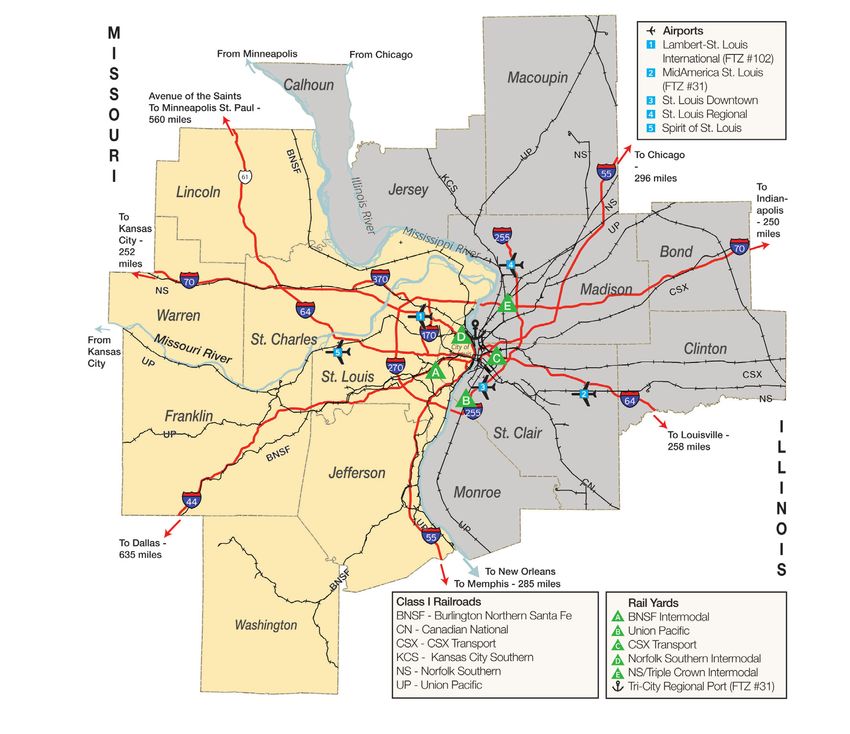
Source: U.S Department of Commerce16 infrastructure assets The 2011 report prepared by Institute St. Onge and Biggens Lacy Shapiro presented an infrastructure asset inventory of the region. The report found that St. Louis already possesses extensive multi-modal transportation capabilities and it is a center for both domestic and international freight. Capabilities for air, highway, rail, and waterborne transportation are extensive, as depicted in Figure 14. Figure 14 St. Louis Transportation Systems Air Lambert-St. Louis International Airport is owned and operated by the City of St. Louis. The airport controls approximately 3,970 acres. 1,845 acres are inside a secured operating area and 2,125 acres are owned outside that perimeter. The airport consists of two main terminals, 88 gates and four primary runways. Runways are rated to handle 747 freighter aircraft. There are 13 passenger carriers and four air cargo carriers. There are currently four major cargo areas at Lambert. Cargo areas 1 and 2 are occupied by FedEx and UPS in facilities totaling 160,000 - 180,000 square feet. Cargo area 4 is a 130 acre site owned by the airport. Figure 15 shows freight trends at Lambert-St. Louis International Airport. The number of air cargo departures increased from 2011 to 2012 and a sharp decline in landed weight seen in 2008 through 2010 has abated.
17

Figure 15 Lambert-St. Louis International Airport Cargo Departures & Landed Weights in 1,000 Lbs., 2008 – 2012

                                                             Number of        Landed
                                           As of December      Cargo          Weight
                                                             Departures     (1,000 lbs)

                                                   CY 2012          1,376   8,240,880
                                                   CY 2011          1,331   8,256,020
                                                   CY 2010          1,427   7,924,518
                                                   CY 2009          1,534   8,588,638
                                                   CY 2008          1,593   9,673,250

Source: Lambert St. Louis Airport

Air cargo carriers are FedEx, UPS and DHL via Capital Cargo International and Air Transport International, LLC. Air cargo
facility operators include Air General, Integrated Airline Services, Inc. and Airport Terminal Services.

Air cargo facilities at Lambert are “conveniently located on both sides of the primary parallel runways. Configured in typical
flow-through fashion, the air cargo facilities are equipped to handle both current and next-generation cargo aircraft.”
Services offered include:

    • Aircraft parking adjacent to facilities
    • Bonded storage
    • Secured warehouse
    • Direct ramp access

Other key areas of the air cargo facilities include “high-bay storage areas, workstations for makeup and breakdown of unit
load devices (ULDs), and storage areas for cargo that requires special handling.”vi

MidAmerica Airport serves as the St. Louis Region’s second full service commercial airport and as a reliever to Lambert-
St. Louis International Airport. Located in St. Clair County, IL, it provides state-of-the-art facilities for passengers, traffic,
and cargo, including an adjacent 800-acre industrial park. It has a 10,000 foot and an 8,000 foot runway and serves
cargo, commercial, and military flights. The airport will undergo a $2.24 million upgrade to expand the runway, allowing
MidAmerica to handle four 747 cargo planes at once. vii

Much of the area surrounding the airport is an Illinois Tax Increment Financing (TIF) District designed to help new
businesses locate nearby. The MidAmerica Airport is also part of a Foreign Trade Zone and is only 24 miles from
downtown St. Louis. viii

Boeing opened a manufacturing facility at MidAmerica in late 2010, Boeing’s first assembly operation in Illinois. North-
Bay Produce opened a new distribution center on the airport property and is adding a 19,000 square foot refrigerated
warehouse expansion due for completion in the fall 2013. ix
18
Other Airports
• Spirit of St. Louis Airport, the area’s largest regional airport, is in St. Louis County. It has recently renovated its
main runway and parallel taxiways. The airport is home to over 500 aircraft and two full runways.
• Another large regional airport, St. Louis Downtown Airport, is just across the river from the City of St. Louis
in Sauget, IL and provides quick access to the downtown area. It is located on a 1,013 acre site with an
industrial-business park. The airport is owned by Metro which runs Greater St. Louis’ bus and light rail
commuter system.
• St. Louis Regional Airport is only 25 minutes from downtown St. Louis in East Alton, IL and serves
a diverse clientele — from corporate aircraft and general aviators to the U.S. military and regional aircraft
makers. At 2,300 acres, the airport is Illinois’ fourth largest, handling an average of 80,000 operations per year.
Highways
St. Louis has extensive highway connectivity with State roadways (MO and IL), the National Highway System and the
Interstate highway system. The metro area is connected to major population centers directly north, south, east and west.x
Major highways include US interstates I-44, I-55, I-64, and I-70. In addition the “Avenue of the Saints” connecting
St. Louis to St. Paul MN is complete. This is a 560 mile “high priority corridor.” This corridor merges with the I-35 corridor,
part of the “NAFTA super highway.”
Large trucking employers in the region include UniGroup and Transportation Services Group.
Rail Yard/Facility
Greater St. Louis is the third largest rail center in the United States and home to six Class I railroads and five local and
short line railroads. The Class I railroads include Burlington Northern and Santa Fe Railway (BNSF), Union Pacific Railroad
(UP), Norfolk Southern Railway (NS), CSX Transportation, Kansas City Southern Railway (KCS) and Canadian National
Railway (CN).xi The convergence of railroads in St. Louis provides users with single carrier service throughout North
America and opportunities to negotiate lower costs.
There are five major intermodal facilities operated by the Class I railroads. Traffic flowing to and from any port of entry can
be executed with a single line move. Additionally, users benefit from the competition amongst railroads. These features
provide potential cost savings for users.
Waterborne Transportation
St. Louis is the second largest inland water port by tonnage in the United States due to the confluence of Mississippi
and Missouri rivers. There is a large truck, train and barge intermodal site at America’s Central Port. Marine highways
M-55 and M-70 connect St. Louis with Chicago, Kansas City, Cincinnati, Louisville, Memphis and New Orleans.xii Barge
transportation facilitates low cost shipping of fuels, raw materials and agricultural products. Because waterborne freight
tends to minimize environmental impacts, it will become increasingly important to U.S. national interests, as will the
emergence of “container on barge” traffic.
The Blue Highway system consists of the ports, the Intercoastal Waterway and the Inland Water System. The Inland
System is used to transport fertilizer, coal, petroleum, cement, sand, agricultural products and most recently ethanol.xiii19
Distribution Companies
More than 75 companies operate large distribution facilities (500,000 square feet and above) in Greater St. Louis. They
occupy a combined space of more than 30 million square feet.
Figure 16 Distribution Tenants with 500,000 Square Feet and above, St. Louis MSA
500,000 - 999,999 SF 1,000,000 + SF
255 Logistics Center Conopco Inc. (UniLever)
Buske GENCO
Castle & Cooke Cold Storage Hershey Foods
Centric Group Hussmann Corporation
Chep USA Mid Coast Aviation
Customized Distribution Services, Inc. Ozburn-Hessey Logistics
Dial Corporation Procter & Gamble
Emerson Power Transmission The Strive Group
Fiesta's Car & Boat Storage True Manufacturing
Laidlaw U.S. Steel Corporation
Macy's Retail Holdings, Inc. Unilever
Spectrum Brands/United Industries Vi Jon Laboratories
Supervalu World Wide Technology
Trane Company
Walgreens
Warehousing Specialists, Inc
Whirlpool
Source: Cassidy Turley, CoStar, JLL, and other data.
Based here are:
• Graybar, a Fortune 500 company, the leading North American distributor of high-quality components,
equipment, and materials for the electrical and telecommunications industries and a specialist in supply-chain
management services.
• UniGroup Inc., which operates Mayflower Transit and United Van Lines among other transportation services.
• Logistics Management Solutions (LMS), which specializes in operating load control centers for companies
such as BASF and Monsanto.
• XTRA Corp., a Berkshire Hathaway Co., and a leading global transportation equipment lessor with operations
in North American over-the-road and domestic intermodal markets. The company manages a diverse fleet
consisting of over-the-road (“OTR”) trailers and intermodal equipment, including chassis, intermodal
(or “piggyback”) trailers.
Institute St. Onge’s report indicates that the St. Louis MO-IL MSA is an optimum location for companies with 1 or 3 or
more U.S. distribution centers. Using cost-optimization software called Logic Net Plus, Institute St. Onge determined that
there is no cost premium for locating a distribution facility in the Greater St. Louis Area over any other central U.S. market.
This makes Greater St. Louis highly compatible with a broad range of distribution network models across the nation.20 Industrial Real Estate The St. Louis industrial real estate market totals over 260 million square feet in more than 6,300 buildings. Flex space accounts for about 6% of the industrial inventory and warehouse space accounted for 94% of the space. About 31% of the industrial market is comprised of owner-occupied properties. Vacancies have been improving since 2011, posting 8.1% in early 2013. The flex space market has somewhat higher vacancies than the warehouse market. The average quoted asking rent for the flex sector is $7.30 per square foot and warehouse rates average $3.77 per square foot About 960,000 square feet of industrial space is under construction as of the beginning of 2013. The two largest projects are 100% preleased. These projects are a 480,000 square foot expansion in Illinois and a 227,500 square foot facility in Aviator Business Park in North St. Louis County.xiv national forecasts — employment & output Nationally, employment in the wholesale trade industry is forecast to grow at 1.3% per year, the same pace as overall employment. Much of the employment growth for this sector will be recovery from the jobs lost during the great recession. The economy and domestic demand for goods influences employment in this industry. Real output is expected to increase by 3.4% per year, which is the second largest increase in real output for all industries from 2010 to 2020. Employment in the U.S transportation and warehousing industry is forecast to grow by 1.9%, faster than overall employ- ment, and annual growth of output for this industry sector is expected be 3.3%, outpacing the 2.9% annual increase in output for the overall economy. The truck transportation industry is among the industries forecast to generate the largest number of jobs between 2010 and 2020, with the additions of three million jobs and a growth rate of 2.2%. Manufacturing employment is forecast to decline through 2020, though the loss of jobs will slow, compared with the previous decade’s manufacturing losses. The increase in imported manufactured goods and the increase in productivity gains due to automation will drive the losses in this industry. Real output will increase by an annual rate of 2.8%, just below the 2.9% projected for the overall economy. Most of the 77 manufacturing industries are projected to increase output during the 2010-2020 periods. The computer and electronic product manufacturing subsector is projected to grow the fastest in output, even while employment in the subsector is projected to fall. Increased productivity is driving these changes.xv talent profile The number of people employed in occupations that support transportation, storage and distribution of goods as well as the management of logistics processes totals 187,700. These occupations, shown in Figure 17, are found across a range of industries. The occupations that are typically found in the manufacturing sectors are not included in this list.
21

Figure 17 St. Louis MO-IL MSA & U.S. — Occupational Employment & Wages, May 2012
Logistics & Advanced Manufacturing — Selected Occupations

                                                                                         St. Louis, MO-IL MSA               United States
                                                                                                                                        St. Louis
                                                                                                                            U.S.        Median
                                                                                                              St. Louis
                                                                                     St. Louis     Location                Annual      Wage as %
                                                                                                               Annual
                                                                                    Employment     Quotient                Median        of US
                                                                                                              Median
                                                                                                                           Wage         Median
                                                                                                               Wage
SOC Code   Occupation                                                                                                                    Wage

 00-0000   All Occupations                                                             1,274,970       1.00      $34,870     $34,750       100%
 11-3071   Transportation, Storage, and Distribution Managers                               920        0.96      $86,280     $81,830       105%
 13-1021   Buyers and Purchasing Agents, Farm Products                                      240        2.41      $70,650     $55,720       127%
 13-1022   Wholesale and Retail Buyers, Except Farm Products                              1,530        1.44      $44,700     $51,470         87%
 13-1081   Logisticians                                                                   2,150        1.84      $67,020     $72,780         92%
 13-1111   Management Analysts                                                            3,450        0.65      $75,670     $78,600         96%
 15-2031   Operations Research Analysts                                                     460        0.68      $65,070     $72,100         90%
           Sales Representatives, Wholesale and Manufacturing, Technical and
 41-4011                                                                                  3,560        1.00      $61,150     $74,970         82%
           Scientific Products
           Sales Representatives, Wholesale and Manufacturing, Except Technical
 41-4012                                                                                 15,480        1.12      $52,800     $54,230         97%
           and Scientific Products
 43-5071   Shipping, Receiving, and Traffic Clerks                                        5,950        0.88      $28,930     $29,010       100%
 43-5081   Stock Clerks and Order Fillers                                                15,430        0.87      $21,930     $22,050         99%
 49-3031   Bus and Truck Mechanics and Diesel Engine Specialists                          2,010        0.89      $42,200     $42,320       100%
 53-0000   Transportation and Material Moving Occupations                                76,100        0.89      $30,410     $28,960       105%
 53-1011   Aircraft Cargo Handling Supervisors                                               70        1.06      $61,760     $47,930       129%
 53-1021   First-Line Supervisors of Helpers, Laborers, and Material Movers, Hand         1,600        0.97      $46,970     $45,180       104%
           First-Line Supervisors of Transportation and Material-Moving Machine
 53-1031                                                                                  1,490        0.77      $52,150     $53,240         98%
           and Vehicle Operators
 53-2012   Commercial Pilots                                                                530        1.55      $67,240     $73,280         92%
 53-2021   Air Traffic Controllers                                                          140         0.6     $120,730    $161,640        99%
 53-2022   Airfield Operations Specialists                                                   60        0.84      $42,310     $48,080         88%
 53-3031   Driver/Sales Workers                                                           4,190        1.09      $21,570     $22,670         95%
 53-3032   Heavy and Tractor-Trailer Truck Drivers                                       16,110        1.06      $41,120     $38,200       108%
 53-3033   Light Truck or Delivery Services Drivers                                       6,370        0.85      $28,330     $29,390         96%
 53-3099   Motor Vehicle Operators, All Other                                               780        1.33      $18,790     $26,930         70%
 53-4031   Railroad Conductors and Yardmasters                                               50        0.11      $36,030     $54,700         66%
 53-5011   Sailors and Marine Oilers                                                        350        1.13      $46,190     $38,190       121%
 53-5021   Captains, Mates, and Pilots of Water Vessels                                     330        1.09      $60,660     $66,150         92%
 53-6051   Transportation Inspectors                                                        170        0.70      $43,950     $63,680         69%
 53-6099   Transportation Workers, All Other                                                310        0.86      $32,470     $30,870       105%
 53-7011   Conveyor Operators and Tenders                                                   330        0.87      $31,190     $29,610       105%
 53-7021   Crane and Tower Operators                                                        170        0.40      $39,760     $47,290         84%
 53-7051   Industrial Truck and Tractor Operators                                         4,900        1.01      $31,140     $30,220       103%
 53-7062   Laborers and Freight, Stock, and Material Movers, Hand                        16,800        0.80      $25,340     $23,890       106%
 53-7063   Machine Feeders and Offbearers                                                 1,010        0.97      $30,660     $27,120       113%
 53-7064   Packers and Packagers, Hand                                                    4,220        0.65      $20,500     $19,910       103%
 53-7199   Material Moving Workers, All Other                                               360        1.36      $31,100     $37,320         83%
           Cluster Total                                                                187,620

Source: BLS

St. Louis wages are competitive. Wages range from a low of $18,790 for other motor vehicle operators, to a high of
$120,730 for air traffic controllers. Twenty two of the occupations listed in Figure 16 are at or below the U.S. median
wage. The remaining 13 wages are somewhat above the nation’s median wages.
22
Location quotient is a measure used for occupations as well as industry employment. Six occupations have location
quotients of 1.33 or higher, indicating an above average concentration. The occupations are: buyers and purchasing
agents for farm products; wholesale and retail buyers, except farm products; logisticians; commercial pilots; other motor
vehicle operators; and other material moving workers.
The largest of these occupations is logisticians with more than 2,150 in the region. Logisticians analyze and coordinate
an organization’s supply chain - the system that moves a product from supplier to consumer. They often manage the
entire life cycle of a product, which includes how a product is acquired, distributed, allocated, and delivered. Nationally,
three industries account for the highest levels of employment and for the highest concentration for logisticians: the federal
government, aerospace product and parts manufacturing; and management, scientific, and technical consulting services.
The computer systems design services industry is also a large employer of logisticians and the freight transportation
arrangement industry has a high concentration of logisticians. St. Louis’ concentration of logisticians can be attributed
to the presence of Scott AFB, Boeing and other aerospace parts manufacturers as well as manufacturers with complex
supply chains and critical logistics functions.
Employment of logisticians is expected to grow 26 percent from 2010 to 2020, faster than the average for all occupations.
Employment growth will be driven by the important role of logistics in an increasingly global economy. Job prospects
should be best for those with a college degree and work experience related to logistics.
Figure 18 compares the 2012 location quotient for logisticians and the change in location quotient from 2007 to 2012 for
the 20 largest metropolitan areas in the U.S. Seattle is clearly a leader with the highest location quotient (4.46), the largest
pool of logisticians (over 6,000 in 2012) and the largest increase in concentration from 2007 to 2012. The St. Louis market
is second in terms of concentration with a 2012 location quotient of 1.84 and the second largest increase in concentration
from 2007 to 2012.
Figure 18 Logisticians, 2012 Occupational Location Quotient and Change in Location Quotient 2007 – 2012
St. Louis MSA and 20 Largest Metros
6.0
5.0
Seattle
4.0
Location Quotient
3.0
DC
St. Louis
2.0 Detroit San Diego
Dallas Baltimore
Houston Phili
Minneapolis
1.0 Boston LA San Francisco
Atlanta Phoenix
Tampa
NY Riverside
Miami Chicago
-
(1.50) (1.00) (0.50) - 0.50 1.00 1.50 2.00 2.50 3.00
(1.0)
Change in Location Quotient 2007-2012
Source: BLS23
St. Louis’s relative strength on this measure is even more pronounced when compared to Midwestern metros that are
more likely to be direct competitors for freight activity. St. Louis has the highest location quotient and is second only to
Chicago in terms of the number of logisticians working in the region.
Figure 19 Logisticians, 2012 Occupational Location Quotient and Change in Location Quotient 2007 – 2010
St. Louis MSA and Competitive Midwest Metros
2.5
2
St. Louis
Location Quotient
1.5
Minneapolis
Cincinnati
Columbus
Cleveland
Kansas City
1
Memphis Louisville
Pittsburgh Chicago
0.5
0
-0.6 -0.4 -0.2 0 0.2 0.4 0.6 0.8 1
Change in Location Quotient 2007-2012
Source: BLS
occupation forecast
Nationally, manufacturing occupations are expected to grow more slowly than average and jobs generated by manufac-
turers are forecast to be in the employment services industry as manufacturers increasingly use workers from temporary
employment services rather than full time permanent workers. From 2010 to 2020 transportation and material moving
occupations are projected to regain all the jobs lost during the great recession. Truck drivers and packers and hand
packagers will add the most jobs and occupations in the transportation and warehousing industry will grow at above
average rates.
Several occupations are expected to grow at faster than average pace. Employment of logisticians is expected to grow
26 percent from 2010 to 2020 and employment for heavy and tractor-trailer truck drivers is projected to grow 21 percent
over the same period. While jobs for train engineers and operators are projected to experience little or no change, there
will be demand for these occupations because many current workers are approaching retirement age.24
Employment of wholesale and manufacturing sales representatives is expected to grow by 16 percent from 2010 to 2020,
about as fast as the average for all occupations. Employment growth for sales representatives is expected to follow the
economy as a whole. Employment opportunities should be best in independent agencies, which operate on a fee basis
and represent several manufacturers rather than buying and holding the product they are selling.xvii
higher education & training
The region is well positioned to prepare to build a pipeline of new workers for the Multimodal Logistics Cluster. There are
55 two and four year colleges and universities in the region offering a wide range of business and computer degrees and
certificates. Several universities offer specialized training in the logistics and supply chain management at the undergrad-
uate and graduate level. Although an associate’s degree is sufficient for many logistician jobs, candidates increasingly
need a bachelor’s degree to advance beyond entry-level positions. Figure 20 presents a list of these offerings.
Figure 20 Supply Chain Management Degrees and Certificates offered by St. Louis Universities and Colleges, 2013
University School/Center Degree/Certificate offered
Washington University Olin Business School Masters of science in supply chain management
Washington University Olin Business School Supply chain certificate for managers
Saint Louis University John Cook School of Business, Masters of supply chain management
Center for Supply Chain Management
University of Missouri - St. Louis College of Business Administration, Undergraduate minor in transportation studies
Center for Transportation Studies
University of Missouri - St. Louis College of Business Administration, Graduate supply chain certificate
Center for Transportation Studies
University of Missouri - St. Louis College of Business Administration, MBA/MIS logistics & supply chain emphasis
Center for Transportation Studies
University of Missouri - St. Louis College of Business Administration, MBA/MIS operation management emphasis
Center for Transportation Studies
Lindenwood University School of Business & Entrepreneurship MBA with supply chain emphasis
Fontbonne University Eckelkamp College of Global Business Graduate supply chain certificate
& Professional Studies
Source: University websites
next steps
This summary of quantitative information about the Multimodal Logistics cluster serves as the starting point for a
business-led effort to link, leverage, and align regional factors to promote regional growth. Forum members will work with
St. Louis Regional Chamber staff to describe roadblocks to cluster growth, identify niches with the greatest potential for
growth, and develop strategies to accelerate growth. The Forum will identify infrastructure investments needed to support
and expand the cluster and better coordination of the logistics process in Greater St. Louis to maximize capacity of the
regional infrastructure. Developing the region’s Multimodal Logistics cluster may also facilitate and impact national and
global supply chains as transport through the region is improved.25 The Multimodal Logistics Forum will articulate a regional value proposition for the cluster, develop messaging themes, and identify companies to target for business recruitment. The Forum will address skills needed in our workforce to support and expand the cluster and will also work with Chamber staff to identify measures unique to the Multimodal Logistics Cluster to monitor progress. The Forum will maintain conversations across clusters to insure that shared concerns are addressed comprehensively. Chamber staff will provide updated information when available such as East-West Gateway Council of Governments’ commissioned Regional Freight Study to inform Forum discussion. All the Forum’s work points to a set of common goals: robust employment opportunities for residents and newcomers alike, a vibrant and growing business base, ever increasing community wealth, and continued improvement in a range of social factors closely aligned with employment and income.
26

sources

i
       “Regional Cluster Analysis – Cluster Action Plan Greater Saint Louis, MO-IL,” Market Street Services Inc., July 27,2009, p. 26.

ii
       “The Potential of Lambert-St. Louis International Airport to be a Midwest Cargo Center,” Institute St. Onge with
       Biggins Lacy Shapiro & Company, July 26, 201, p. 1.

iii
       AECOM presentation to EW Gateway

iv
       Industry Focus Reports, Local Employment Dynamics, U.S. Census Bureau, http://lehd.ces.census.gov/applications/industry_focus.html

v
       Costa Rica, El Salvador, Guatemala, Honduras, and Nicaragua and the Dominican Republic

vi
       Lambert-St. Louis International Airport website

vii
       “MidAmerica to get $2M upgrade for cargo”, St. Louis Business Journal March 16, 2011

viii
       MidAmerica Airport website

ix
       Study: MidAmerica, St. Louis Downtown Airports a boot so economy”, St. Louis Post Dispatch, September 2012 and “Impact is building
       a MidAmerica warehouse expansion”, St. Louis Post Dispatch, April 19, 2013.

x
       St. Onge Research 2011

xi
       The Canadian Pacific Rail Road connects through Kansas City

xii
       MO Department of Transportation

xiii
        Army Corp of Engineers

xiv
        St. Louis Industrial Market First Quarter 2013, CoStar

xv
        “Employment Outlook: 2010-2020 Industry Employment and Output Projections to 2020” in Month Labor Review,
         U.S. Bureau of Statistics, January 2012

xvi
        “Employment Outlook: 2010-2020 Occupational Employment Projections to 2020” in Monthly Labor Review Industry,
        U.S. Bureau of Labor Statistics, January 2012.

xvii
        Occupational Outlook Handbook 2010 - 2020, U.S. Bureau of Labor Statistics.
Logistics St. Louis Regional Chamber Strategy Statement We are a broad community of leaders united for economic prosperity throughout the entire St. Louis bi-state region. In fact, our aspiration is for St. Louis to be one of the Top 10 U.S. regions in prosperity. Our one purpose is to inspire a greater St. Louis. Together, we will make St. Louis a more attractive place for people to live, work and invest. We will win on today’s regional strengths in focused economic clusters. We will champion a better tomorrow through greater educational attainment, economic inclusion, innovation and entrepreneurship. One Metropolitan Square www.stregionalchamber.com 211 North Broadway, Suite 1300 fax 314.206.3244 St. Louis, MO 63102 phone 314.231.5555
You can also read