WALLAN SOUTH PSP AND WALLAN EAST (PART 1) PSP - ECONOMIC AND RETAIL ASSESSMENT OCTOBER 2020 - AWS
←
→
Page content transcription
If your browser does not render page correctly, please read the page content below

WALLAN SOUTH PSP
AND WALLAN EAST (PART
1) PSP
ECONOMIC AND RETAIL
ASSESSMENT

OCTOBER 2020

PREPARED     FOR     VICTORIAN
PLANNING     AUTHORITY    AND
MITCHELL SHIRE COUNCIL
Contents
Executive Summary ................................................................................................. 4
1.0       Introduction ................................................................................................ 6
          1.1      Project Purpose ............................................................................................................... 6
          1.2      Project Scope .................................................................................................................. 6
          1.3      Study Area ....................................................................................................................... 6
          1.4      Report Structure ............................................................................................................. 7

2.0       Policy and Strategy Review .......................................................................... 8
          2.1      Overview ......................................................................................................................... 8
          2.2      Plan Melbourne 2017-2050 (DELWP, 2017) ................................................................... 8
          2.3      North Growth Corridor Plan (Growth Areas Authority, 2012) ........................................ 9
          2.4      Melbourne Industrial and Commercial Land Use Plan (DELWP, 2020) ......................... 10
          2.5      Planning Scheme Context ............................................................................................. 11
          2.6      Wallan Structure Plan (Mitchell Shire Council, 2016) ................................................... 12
          2.7      Wallan Structure Plan and Infrastructure Coordination Plan: Activity Centre and
                   Employment Study (Charter Keck Cramer, 2014) ......................................................... 14
          2.8      Broadford Industrial and Employment Study (Urban Enterprise, 2020) ....................... 15
          2.9      Summary ....................................................................................................................... 15

3.0       Dwellings and Population .......................................................................... 17
          3.1      Dwellings and Population to 2041 ................................................................................ 17
          3.2      Full Development of Wallan and PSP Areas .................................................................. 19
          3.3      Summary ....................................................................................................................... 21

4.0       Economic and Social Context Review ......................................................... 22
          4.1      Overview ....................................................................................................................... 22
          4.2      Age Profile ..................................................................................................................... 22
          4.3      Household Composition ................................................................................................ 23
          4.4      Workforce ..................................................................................................................... 23
          4.5      Income .......................................................................................................................... 24
          4.6      Employment .................................................................................................................. 24
          4.7      Job Catchment .............................................................................................................. 26
          4.8      Jobs Challenge ............................................................................................................... 26
          4.9      Summary ....................................................................................................................... 26

5.0       Retail and Activity Centre Analysis ............................................................. 28
          5.1      Overview ....................................................................................................................... 28
          5.2      Existing and Planned Centres ........................................................................................ 28
          5.3      Retail Floorspace Demand ............................................................................................ 31
          5.4      Wallan ........................................................................................................................... 32
          5.5      Wallan South PSP Area.................................................................................................. 34

M20052    Wallan South PSP and Wallan East (Part 1) PSP - Economic and Retail Assessment                                                         2 of 67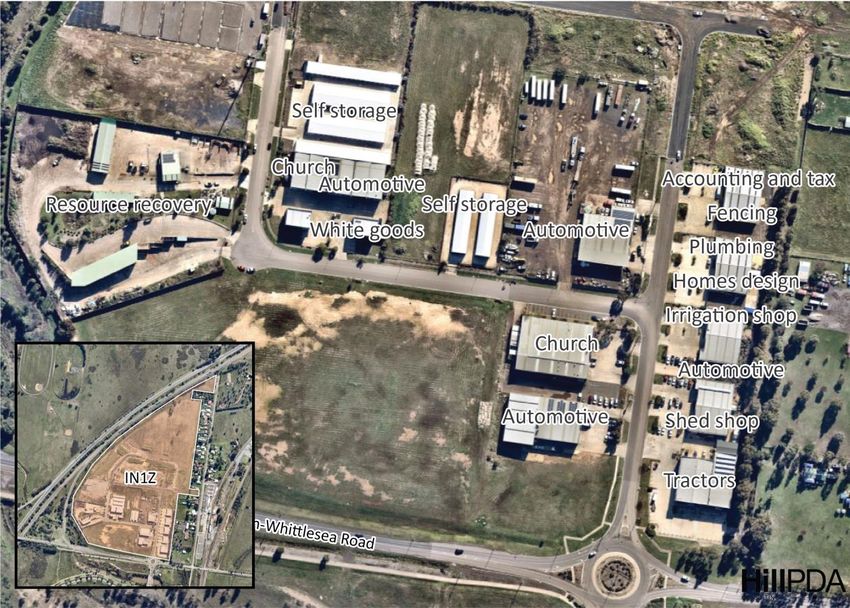
5.6     Wallan East (Part 1) PSP Area ....................................................................................... 36
         5.7     Summary ....................................................................................................................... 38

6.0      Commercial Office Possibilities .................................................................. 39
         6.1     Overview ....................................................................................................................... 39
         6.2     Office Activity Metrics ................................................................................................... 39
         6.3     Possible Office Typologies ............................................................................................. 39
         6.4     Summary ....................................................................................................................... 41

7.0      Community Services .................................................................................. 43
         7.1     Overview ....................................................................................................................... 43
         7.2     Selected Higher Order Facilities .................................................................................... 43
         7.3     Health ............................................................................................................................ 43
         7.4     Higher Education ........................................................................................................... 44
         7.5     Summary ....................................................................................................................... 44

8.0      Industrial Market Analysis and Projections ................................................ 45
         8.1     Overview ....................................................................................................................... 45
         8.2     Industrial Land Supply ................................................................................................... 45
         8.3     Property Sales and Leasing Activity .............................................................................. 50
         8.4     Investment Trends ........................................................................................................ 51
         8.5     Industrial Land Projections - Investment Trends .......................................................... 55
         8.6     Industrial Land Projections - Local Demand Thresholds ............................................... 55
         8.7     Beveridge Intermodal Freight Terminal (BIFT) .............................................................. 56
         8.8     Summary ....................................................................................................................... 59

9.0      PSP Economic Recommendations .............................................................. 60
         9.1     Context .......................................................................................................................... 60
         9.2     Recommendations ........................................................................................................ 60
         9.3     Contribution to Meeting Jobs Targets .......................................................................... 66

M20052   Wallan South PSP and Wallan East (Part 1) PSP - Economic and Retail Assessment                                                         3 of 67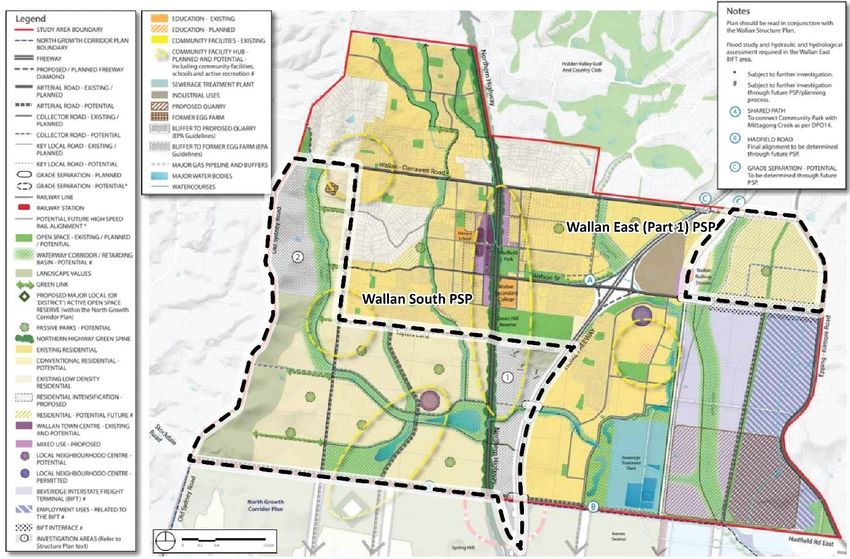
EXECUTIVE SUMMARY
This report provides an economic and retail assessment of the Wallan South PSP area and
Wallan East (Part 1) PSP area. These areas are sub-areas of Wallan and the broader Mitchell
urban growth corridor.
The economic assessment has been prepared to inform the development of a planning
framework for the PSP areas, which is to be incorporated into the Mitchell Planning Scheme.
Wallan as a whole is expected to achieve 20,800 dwellings and 64,400 residents at full
development1. This population is expected to support approximately 121,500 sqm of retail
floorspace in the town (across all centres), 36,500 sqm of office floorspace, 53 ha of industrial
land development and a range of community facilities including higher order health and
education facilities.
Wallan Town Centre, Wallara Waters and the Wallan South Employment Precinct are
expected to accommodate higher order economic uses in the future.
Within this context, Wallan South comprises 806 gross hectares and is expected to have a
residential focus with 8,000 dwellings and 24,800 residents at full development.
Wallan East (Part 1) comprises 140 gross hectares and is expected to support 2,250 dwellings
and 7,000 residents at full development.
The two PSP areas are expected to perform local and neighbourhood activity centre roles
within the broader activity centre hierarchy.
Wallan South also has an opportunity to establish a mixed use employment precinct that can
support the higher-order role of Wallan Town Centre and serve the wider region.
The recommended economic plan for the PSP areas is summarised as follows:

     ▪ Wallan South:
          – 1 x Neighbourhood activity centre
          – 1 x Local convenience centre (and potentially other local shop nodes)
          – 1 x Mixed use employment precinct (with commercial, health, education,
            showroom, bulky goods and service industry uses)
     ▪ Wallan East (Part 1):
          – 1 x Local convenience centre.
The potential spatial composition of these economic elements is shown in the figure below
(and described in more detail in the recommendations section of this report).
_________________________
1   Note that land known as Wallan East (Part 2), which is 120 gross hectares of land south of Wallan-Whittlesea Road, is being investigated
    for potential future residential use. The findings of this report may require updating following confirmation of the future direction for
    that area.

    M20052     Wallan South PSP and Wallan East (Part 1) PSP - Economic and Retail Assessment                                    4 of 67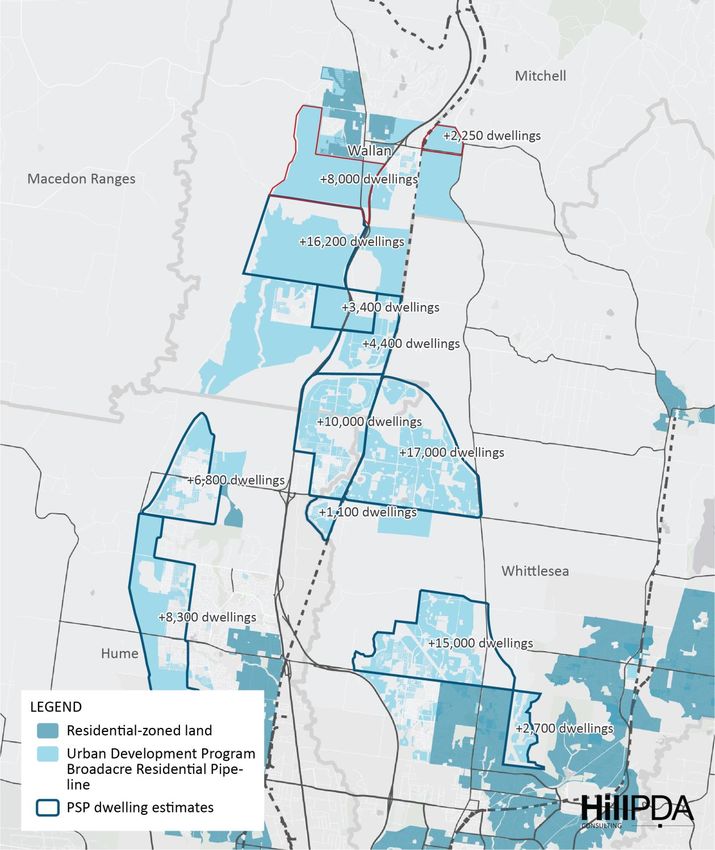
The PSP areas could support in the order of 3,900 jobs at full development. This would be a
significant contribution to meeting the job and service needs of the local population.
Summary of Recommended Economic Elements for Wallan South and Wallan East (Part 1)
PSP Areas

                                                                    Floorspace     Retail
                                                          Land Area
Economic Element                                                    (All Types) Floorspace       Jobs
                                                             (ha)
                                                                       (sqm)       (sqm)
Neighbourhood Activity Centre, Wallan South                   3.3         13,000        9,000    380
Western Local Convenience Centre, Wallan South                1.4          5,600        3,000    140
Wallan South Employment Precinct                             53.0        204,200        21,000   3,230
Local Convenience Centre, Wallan East (Part 1)                1.4          5,600        3,000    140
Total for PSP Areas                                          59.1        228,400        36,000   3,890

Wallan South PSP and Wallan East (Part 1) PSP Economic Directions

  M20052   Wallan South PSP and Wallan East (Part 1) PSP - Economic and Retail Assessment        5 of 67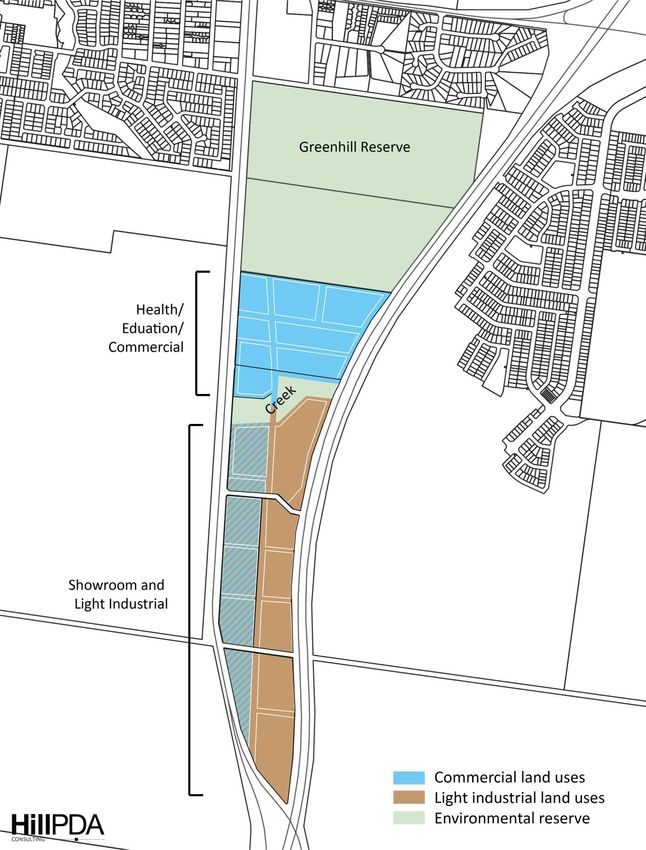
1.0 INTRODUCTION
1.1      Project Purpose
This report provides an economic and retail assessment of the Wallan South PSP and Wallan
East (Part 1) PSP. The economic assessment has been prepared to inform the development
of a planning framework for the study area, which is to be incorporated into the Mitchell
Planning Scheme.
The economic structure in the region has been established at a high level by the Growth
Corridor Plans - Managing Melbourne’s Growth (Growth Areas Authority, June 2012). The
Northern Growth Corridor Plan nominates two major activity centres at Wallan and Beveridge
to service a projected population of 70,000 residents north of the Outer Metropolitan Ring
Road by 2026 and 145,000 residents by 2046. An activity centre structure and future industrial
(employment) areas are also nominated for the region.
As such, a comprehensive and diverse economic and employment plan is required to be
established for the area.

1.2      Project Scope
This report addresses the following matters summarised from the project brief:

▪ Review activity centre requirements within the context of the Northern Growth Corridor
      and Wallan South and Wallan East (Part 1) PSPs.
▪ Provide advice on the potential for employment land within the PSP, with particular
      attention to the need and likely employment land composition for the land between the
      Hume Freeway and Northern Highway and in particular opportunities to realise a range
      of employment land uses in this area, including.
         – Office / branch office functions (i.e. Business Park)
         – Health Care (possibly with a sports / health link in view of the adjacent and to be
           expanded Greenhill Rec Reserve)
         – Creative Economy jobs
         – Light industrial / maker-space type employment
         – Possibly Education and training

1.3      Study Area
The study area is shown in Figure 1 below. Wallan South comprises 806 hectares and is
expected to have a residential focus and be supported by associated services and facilities.
Wallan East (Part 1) comprises 140 hectares and is expected to support and complement the
existing Wallan township.

  M20052    Wallan South PSP and Wallan East (Part 1) PSP - Economic and Retail Assessment   6 of 67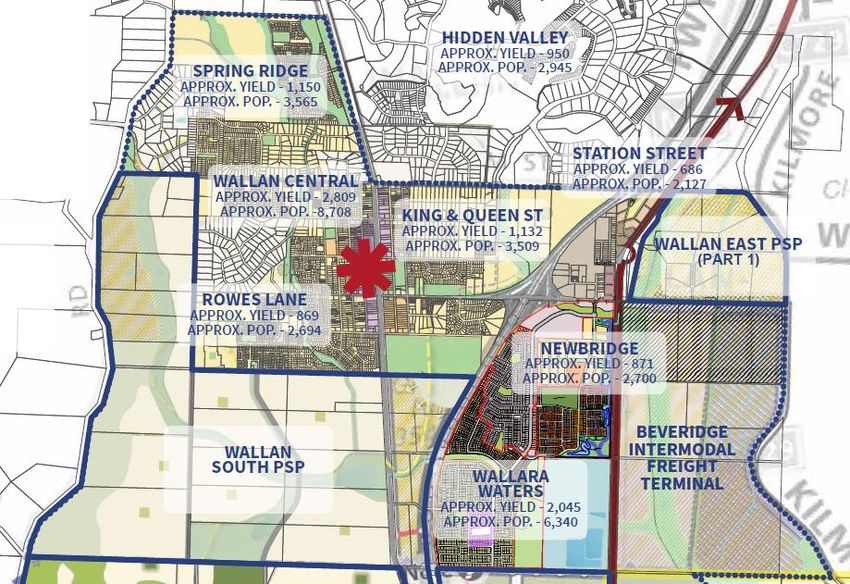
Note that land known as Wallan East (Part 2) is being investigated for potential future
residential use. The findings of this report may require updating following confirmation of the
future direction for that area.
Figure 1: Study Area

Source: Victorian Planning Authority

1.4       Report Structure
This report is structured as follows.

   ▪    Section 1 Introduction
   ▪    Section 2 Policy and Strategy Review
   ▪    Section 3 Dwellings and Population
   ▪    Section 4 Economic and Social Context Review
   ▪    Section 5 Retail and Activity Centre Analysis
   ▪    Section 6 Commercial Office Possibilities
   ▪    Section 7 Community Services
   ▪    Section 8 Industrial Market Analysis and Projections
   ▪    Section 9 PSP Economic Recommendations.

   M20052     Wallan South PSP and Wallan East (Part 1) PSP - Economic and Retail Assessment   7 of 67
2.0 POLICY AND STRATEGY REVIEW
2.1      Overview
This section provides a summary of documents related to economic development, activity
centres and employment land in the region. The documents are:

  ▪     Plan Melbourne
  ▪     North Growth Corridor Plan
  ▪     Melbourne Industrial and Commercial Land Use Plan 2020
  ▪     Mitchell Planning Scheme
  ▪     Wallan Structure Plan
  ▪     Wallan Structure Plan and Infrastructure Coordination Plan: Activity Centre and
        Employment Study

2.2      Plan Melbourne 2017-2050 (DELWP, 2017)
Plan Melbourne is Melbourne’s metropolitan planning strategy. It establishes high level
directions for housing, employment and infrastructure development to 2050.
A key feature of Plan Melbourne is to ensure communities have access to services and jobs in
their local area, which is summarised under the theme ‘20-minute neighbourhoods’, whereby
most community needs can be accessed within a 20 minute trip.
Land use and infrastructure directions of relevance to Wallan are as follows.

      ▪ Activity Centre Hierarchy - Wallan is identified as a future Major Activity Centre.
        Beveridge is designated as a future Major Activity Centre and Lockerbie is designated
        as a future Metropolitan Activity Centre. The activity centres will be subject to precinct-
        based structure planning and the timeframe of development will coincide with housing
        and infrastructure development.
      ▪ Interstate freight terminal - An intermodal transport hub will be developed in the
        Northern Growth Area, now known as the Beveridge Intermodal Freight Terminal
        (BIFT). It is proposed to span from Beveridge up to the southern boundary of Wallan
        East (Part 1) and adjacent to Wallan South. This development would act as a significant
        hub for a range of industrial and logistics businesses close to Wallan.
      ▪ Outer Metropolitan Ring and Rail Corridor - A potential outer ring road is proposed
        connecting Werribee to the Beveridge Intermodal Freight Terminal, and southeast to
        Epping and Box Hill. The proposed rail corridor connects with the BIFT and opens the
        opportunity to carry passenger rail as an extension of the Melbourne Airport Rail Link.
      ▪ State-significant industrial precincts - This is strategically located land available for
        major industrial development linked to the Principal Freight Network and transport

  M20052    Wallan South PSP and Wallan East (Part 1) PSP - Economic and Retail Assessment   8 of 67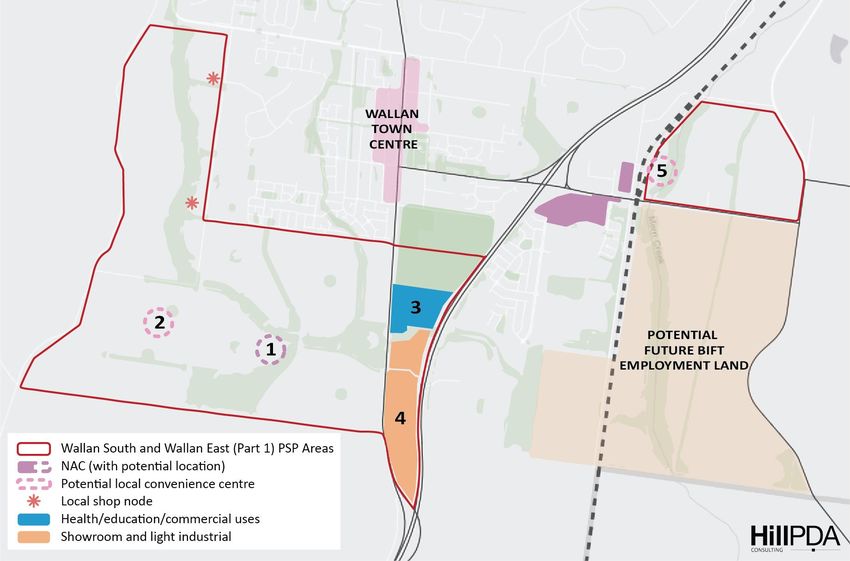
gateways. The Northern Industrial Precinct spans from Thomastown, Broadmeadows
        to Somerton and Epping, reaching 20km south of Wallan.
The centres hierarchy established in Plan Melbourne is as follows:

      ▪ Neighbourhood Activity Centres - Local centres that provide access to local goods,
        services and employment opportunities and serve the needs of the surrounding
        community.
      ▪ Major Activity Centres - Suburban centres that provide access to a wide range of goods
        and services. They have different attributes and provide different functions, with some
        serving larger subregional catchments. Plan Melbourne identifies 121 major activity
        centres.
      ▪ Metropolitan Activity Centres – Higher-order centres with diverse employment
        options, services and housing stock, supported by good transport connections. Existing
        centres include Box Hill, Broadmeadows, Dandenong, Epping, Footscray, Fountain
        Gate/Narre Warren, Frankston, Ringwood and Sunshine. Future centres will include
        Lockerbie and Toolern.
The Wallan PSPs could support neighbourhood activity centres as proposed in the Wallan
Structure Plan (Mitchell Shire Council). The scale of proposed neighbourhood centres in
Wallan South and Wallan East (Part 1) is assessed in this report.

2.3      North Growth Corridor Plan (Growth Areas Authority, 2012)
This plan has been updated by Plan Melbourne and will be updated by the Wallan South and
Wallan East (Part 1) Structure Plan. Wallan was excluded from the Growth Corridor Plan given
that it was located outside the Urban Growth Boundary (UGB) at the time of its publication.
In 2012 the State Government approved an additional approximately 6,000 hectares of land
to extend the UGB to include areas considered ‘logical inclusions’ to the UGB by an
independent Advisory Committee. Therefore, soon after this plan was released Wallan was
re-designated as a ‘logical inclusion’ area. Mitchell Shire Council’s Wallan Structure Plan
provides a strategic response to this plan by providing more defined land use priorities and
infrastructure planning.
The revised north growth corridor plan is shown in Figure 2 below.

  M20052    Wallan South PSP and Wallan East (Part 1) PSP - Economic and Retail Assessment   9 of 67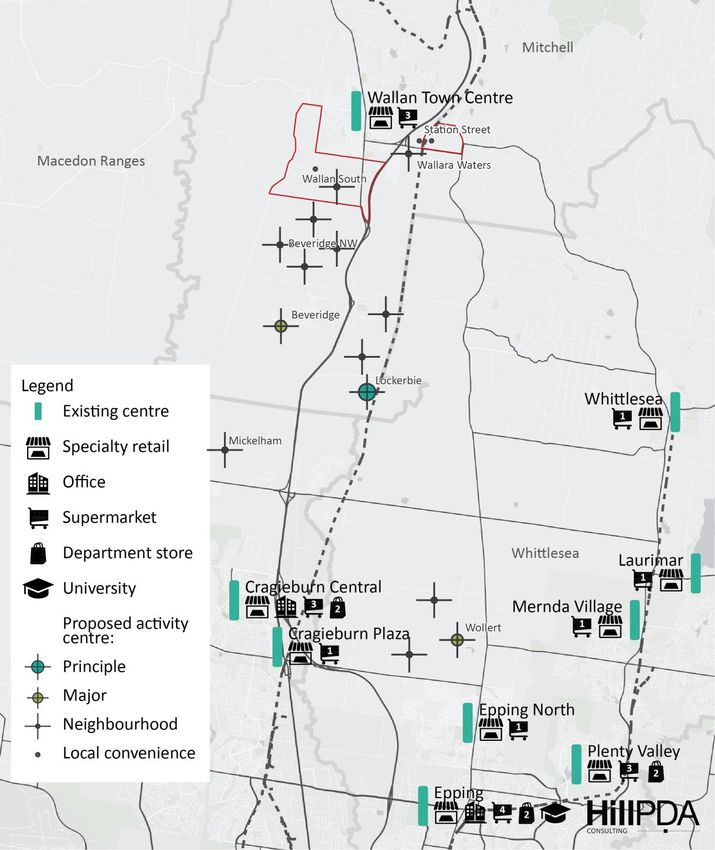
Figure 2: Study Area Context
Source: Victorian Planning Authority
2.4 Melbourne Industrial and Commercial Land Use Plan (DELWP, 2020)
Wallan is located in the Northern Region of metropolitan Melbourne, although it is not
currently classified within the Northern State-Significant Industrial Precinct (SSIP).
Table 1: Industrial Land in Melbourne’s North
Total vacant zoned
Occupied zoned land Vacant zoned land Future unzoned land
Region and unzoned land
(ha) (ha) (ha)
supply (ha)
Northern Region 3,718.6 1,241.2 2,866.9 4,108.1
Northern SSIP 2,400.7 978.2 2,393.7 3,371.9
Total Melbourne 19,843.2 6,562.5 6,931.7 13,494.2
Source: Urban Development Program
This data suggests that the Northern Region currently supports 19% of occupied industrial
land in Greater Melbourne, however it will supply 30% of Melbourne’s industrial land in the
future. Most of the planned industrial land (82%) in the Northern Region will be located within
the Northern SSIP.
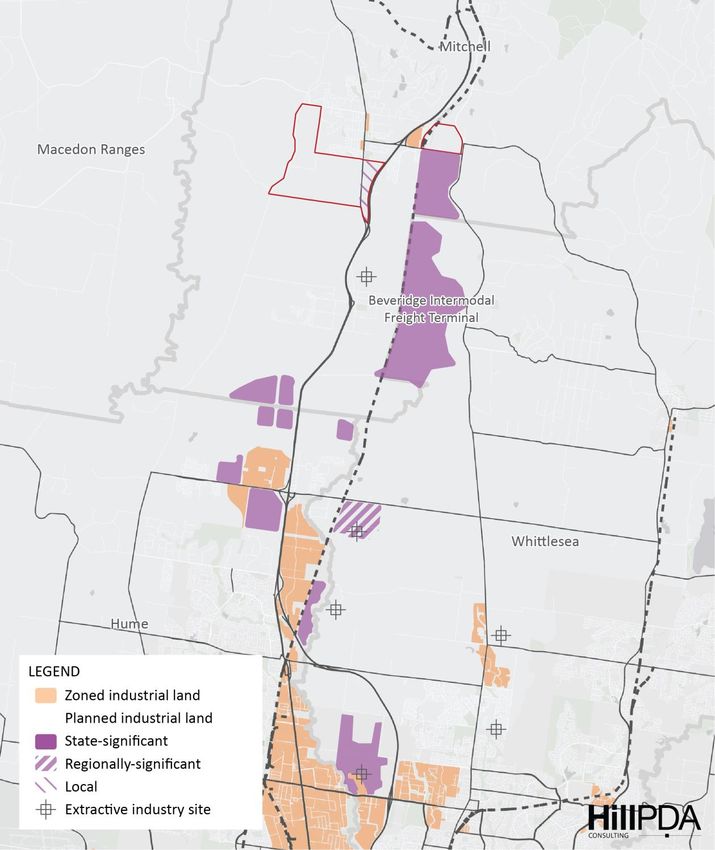
The hierarchy of industrial precincts are classified as follows.
▪ State-significant industrial precincts - These are identified in Plan Melbourne as
providing strategically located land for major industrial development linked to the
Principal Freight Network and transport gateways. It is state policy that these areas are
to be protected from incompatible land uses to allow continual growth in freight,
logistics and manufacturing investment.
M20052 Wallan South PSP and Wallan East (Part 1) PSP - Economic and Retail Assessment 10 of 67▪ Regionally-significant industrial precincts - These are key industrial areas that
contribute significantly to local and regional economies. Some of these areas are well
established and support a range of industrial uses while others are transitioning and
supporting new uses. They include future employment areas identified through Growth
Corridor Plans. These areas need to be planned for and retained either as key industrial
areas or locations that can transition to a broader range of employment opportunities.
▪ Local industrial precincts - If an area is not identified as being of state or regional
significance, then it is of local significance. Councils are best placed to determine how
these industrial areas are to be planned and developed. This could include identifying
when industrial land should be retained, when it could transition to other employment
generating uses, or if it is no longer required.
Wallan currently performs a local industrial function that provides population-servicing
businesses such as service industry, regional storage, small-scale manufacturing, bulky goods
and other such uses. However, proximity to the Beveridge Intermodal Freight Terminal could
facilitate more intensive and higher-order industrial businesses and uses and elevate the area
as being regionally significant.
2.5 Planning Scheme Context
The figure below shows Wallan in a municipal context. Wallan is located south of the Great
Dividing Range and is noted as a fast-growing commuter township.
The Shire is made up of a network of townships that converge into Wallan via both the Hume
Freeway and Northern Highway. The Melbourne-Sydney train line is another strategic
infrastructure asset that connects Wallan to Melbourne and regional centres to the north.
This framework presents Wallan with an opportunity to be the first intervening opportunity
for consumers from townships north of the Great Dividing Range that travel south for higher
order retail and other services.
M20052 Wallan South PSP and Wallan East (Part 1) PSP - Economic and Retail Assessment 11 of 67Figure 3: Strategic Framework Plan
Source: Mitchell Planning Scheme
2.6 Wallan Structure Plan (Mitchell Shire Council, 2016)
The Wallan Structure Plan was prepared by Mitchell Shire Council, Capire and Tract Consulting.
It was released in March 2015 and modified for planning scheme amendment C108 in
December 2015. The plan identified six priority projects that will lead the implementation of
the structure plan. The six priority projects are:
▪ Endorsement and Immediate Priorities (passing planning scheme amendment)
▪ Town Centre Master Plan and Urban Design Framework
▪ Wallan South Precinct Structure Plan
▪ Greenhill Reserve Master Plan
▪ Master Plan for Hadfield Park
▪ Train Station Precinct Master Plan.
A direction for the Wallan South PSP is that there is a need to plan for a range of retail offerings
beyond the core Wallan retail area along with other possible community uses, and there is a
need for this PSP to be completed as a priority to complement the Town Centre Master Plan.
M20052 Wallan South PSP and Wallan East (Part 1) PSP - Economic and Retail Assessment 12 of 67Wallan South
As shown in Figure 1 (shown previously), most of Wallan South is identified as conventional
residential – potential. This provides direction for dwellings as the basis for development along
with associated local activity centres and community facilities. There may be a potential local
neighbourhood centre in the conventional residential area of Wallan South.
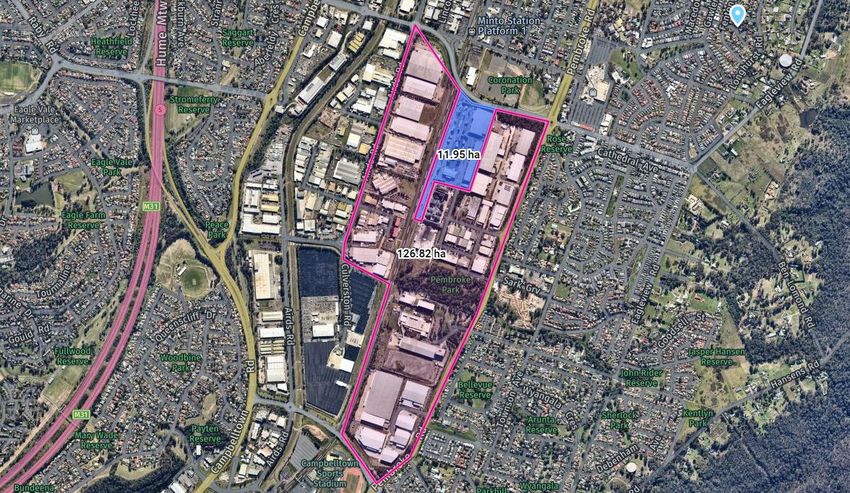
The land along Old Sydney Road and in between Northern Highway and the Hume Freeway is
identified as Investigation areas. For the investigation area along Old Sydney Road (labelled
as area 2 in Figure 1) there is no clear direction for land use; it is understood there are access
and servicing constraints associated with developing this area and as such this area will be
assessed in the Wallan South PSP process.
For the investigation area between Northern Highway and the Hume Freeway (labelled area
1 in Figure 1) the following should be considered through the PSP process:
▪ The mix, layout and location of land uses
▪ The provision of bulky goods retail
▪ Interface with Hume Freeway
▪ Potential for crossing locations over the Hume Freeway
▪ The extent of bulky goods retail land that is proposed and its interface to Northern
Highway
▪ The Northern Highway interface and treatment of the southern gateway into Wallan
▪ Access arrangements onto Northern Highway.
Wallan East (Part 1)
Most of Wallan East (Part 1) is identified as Residential – potential future (subject to further
investigation through future PSP/planning process).
For the proposed growth areas identified as Wallan East the following should be considered
through the PSP process:
▪ The layout of the BIFT and associated buffers
▪ The timing of the BIFT and interim uses to be provided prior to the BIFT
▪ The provision, location and layout of employment uses
▪ Land uses to the north of Wallan-Whittlesea Road
▪ Detailed planning around the Wallan Railway Station
▪ The impacts of the proposed Quarry on the BIFT
▪ The alignment of the potential High Speed Rail network which runs east of the existing
railway line
▪ The impacts of future grade separation of the rail line and Wallan-Whittlesea Road
▪ The implications of the high pressure gas pipeline on future development
▪ Flooding management across the area including the need for detailed hydraulic and
hydro-logic assessment
M20052 Wallan South PSP and Wallan East (Part 1) PSP - Economic and Retail Assessment 13 of 67▪ Pedestrian access to the railway station and to the future town centre at Wallara Waters
▪ Width, treatment and interface with the Merri Creek corridor.
Wallan Town Centre
The Wallan Town Centre is designated as a major activity centre in the Wallan area. The
approach is to pursue higher order commercial floorspace and facilities within the Wallan
Town Centre while potential centres in Wallan South and Wallan East (Part 1) could support
smaller, local-servicing uses.
There is expected to be 9,000sqm demand for office space in the Wallan Town Centre to 2046.
Industrial Land
The Wallan Structure Plan’s position on industrial land supply in the Wallan area is as follows:
▪ Wallan is currently serviced by an industrial precinct located immediately north of
Watson Street and east of the Hume Freeway. The precinct currently has 32 ha of
industrial land. Approximately 10% (3 ha) of this land is developed with light industrial
uses that serve local residents and some rural suppliers.
▪ Wallan’s future industrial role (outside of the proposed Beveridge Intermodal Freight
Terminal) is likely to primarily service residents within the study area and surrounding
regional districts.
▪ Opportunities exist to ensure the existing industrial area is developed in a way that
creates an attractive destination for businesses and a highly accessible, high amenity
location for workers.
2.7 Wallan Structure Plan and Infrastructure Coordination Plan: Activity Centre and
Employment Study (Charter Keck Cramer, 2014)
Charter Keck Cramer produced this report for Mitchell Shire Council to accompany Council’s
strategic work in Wallan. Overall, the study suggests maintaining the state government’s
activity centre hierarchy and growing service industries in Wallan. Specific recommendations
are summarised below.
Activity centres in Wallan are likely to support neighbourhood retail. The Report states that
land should be set aside for larger format retailers given the potential for bulky goods sector
to evolve.
The growing population would be sufficient to support additional supermarkets. Priority
should be given to the Wallan Town Centre however there will be opportunity for several local
activity centres anchored by supermarkets.
Industrial employment within sectors such as transport and logistics will continue to be
focused upon the designated industrial nodes such as the BIFT.
M20052 Wallan South PSP and Wallan East (Part 1) PSP - Economic and Retail Assessment 14 of 67Locally focused activities such as construction and building services, repairs and maintenance, small-scale transport services and industrial services offer opportunities for local employment within Wallan. The services sector will play an increasing role in providing local employment opportunities, which is consistent with the increase in the proportion of residents working in the sector across the northern region. Consideration may be given to providing a nominal amount of industrial land east of the Hume Freeway where businesses may better service local residents. Approximately 2 ha of such land would be considered appropriate. Total projected demand for office space across both private and public sectors is estimated to be approximately 13,000sqm to 26,900sqm by 2046 based on low and high estimates. Opportunity also exists for services such as health and education to encourage local employment. 2.8 Broadford Industrial and Employment Study (Urban Enterprise, 2020) Mitchell Shire Council engaged Urban Enterprise to prepare an economic assessment of the need for employment land to assist with the preparation of the Broadford Structure Plan. Broadford is located 40km north of Wallan. There is a total of approximately 109 ha of land in the Industrial 1 Zone in the town spread across six precincts. The report identified that there is no capacity for additional industrial land in Broadford under current planning controls and recommendation expansion of industrial land supply in the town to meet future need. With respect to Wallan, the report found that existing industrial land is limited, with little zoned and vacant land available. The land in Wallan East Part 2 PSP is a long term proposition and has some environmental challenges and encumbrances. Larger, strategically located land parcels are in demand in the north of Melbourne, and proposed future industrial land near the BIFT could support these uses in the future. 2.9 Summary The key takeaways from this section are: ▪ Wallan is a peri-urban town that is well connected to rural townships to the north by two major road links (Hume Freeway and Northern Highway) and the Melbourne-Sydney train line. The town also forms part of the northern urban growth corridor of Melbourne. ▪ High levels of growth in activity centres, commercial and industrial activities is expected in Wallan and surrounds over the next 20 years. M20052 Wallan South PSP and Wallan East (Part 1) PSP - Economic and Retail Assessment 15 of 67
▪ Wallan is planned to perform a Major Activity Centre role and be supported by a network
  of Neighbourhood Activity Centres, including at least one neighbourhood centre in
  Wallan South.
▪ Industrial and related commercial uses in Wallan are relatively limited at the current time
  but these sectors are expected to grow in line with town and broader regional growth.
  Opportunities include service industry and commercial uses on land near the Hume
  Freeway in Wallan South and investment associated with the proposed Beveridge
  Intermodal Freight Hub.

M20052   Wallan South PSP and Wallan East (Part 1) PSP - Economic and Retail Assessment   16 of 67
3.0 DWELLINGS AND POPULATION
3.1       Dwellings and Population to 2041
The following two tables provide population and dwelling projections for Wallan and Mitchell
Shire. These forecasts suggest Wallan will achieve 43,800 residents by 2041 and the Shire will
reach 128,800 residents at that time.
Table 2: Population and Dwellings, Wallan, 2016-2041

Wallan                      2016           2021              2026    2031      2036      2041     Change 2021-2041
 Population                11,428         14,562         21,068      29,019   36,420    43,712    29,150        5.6%
 Dwellings                  4,026          5,110             7,347   10,097   12,692    15,211    10,101        5.6%
Source: Forecast ID 2018 on Mitchell Shire Council website
Table 3: Population and Dwellings, Mitchell Shire, 2016-2041

Mitchell Shire              2016           2021              2026    2031      2036      2041     Change 2021-2041
 Population                41,633         49,895         62,865      80,402   103,094   128,727   78,832        4.9%
 Dwellings                 16,385         19,424         23,970      30,077   37,790    46,390    26,966        4.4%
Source: Forecast ID 2018 on Mitchell Shire Council website

The figure below shows population projections for Wallan along with selected other areas
within the Shire.
Over the next 30 years, Wallan is expected to experience a high level of population growth,
reaching 43,712 persons by 2041 and at rate of 5.6% per annum from 2021.
Relative to neighbouring areas in Mitchell, Wallan is expected to maintain the largest
population until late in the forecast period, where it will be slightly overtaken by Beveridge.
Areas within Mitchell to the north west and north east of Wallan are not expected to see
significant growth over the coming decades, with growth in Wallan and Beveridge expected
to make up 87.7% of population growth in Mitchell.

   M20052     Wallan South PSP and Wallan East (Part 1) PSP - Economic and Retail Assessment               17 of 67
Figure 4: Population Growth, Selected Areas, 2016-2041
               50,000
               45,000
               40,000                                                                              36,420
                                                                                                                   43,712
               35,000
                                                                                  29,019
               30,000
  Population

               25,000                                            21,068
               20,000                         14,562
               15,000        11,428
               10,000
                5,000
                   0
                                 2016         2021                2026                2031          2036            2041

                        Wallan          Beveridge            Kilmore - Kilmore East          Wandong - Heathcote Junction

Source: Forecast ID 2018 on Mitchell Shire Council website

The following map shows PSPs in progress in the broader growth corridor context based on
Urban Development Program data.

   M20052          Wallan South PSP and Wallan East (Part 1) PSP - Economic and Retail Assessment                      18 of 67
Figure 5: Residential Development Areas in Norther Growth Corridor Source: VicPlan Zoning 2020; DELWP Urban Development Program 2018; Victorian Planning Authority PSPs 3.2 Full Development of Wallan and PSP Areas The table below provides an estimate of land area and potential dwelling yield and population yield in the PSP areas and in Wallan as a whole. This is based on data supplied by the VPA and Mitchell Shire Council. M20052 Wallan South PSP and Wallan East (Part 1) PSP - Economic and Retail Assessment 19 of 67
Note that depending on the final location of the BIFT, additional development areas in Wallan
East (Part 2) may increase the population projected at full development.
Nevertheless, the current available data suggests:

  ▪ Wallan as a whole is expected to achieve 20,800 dwellings and 64,400 residents at full
    development
  ▪ Wallan South is expected to achieve 8,000 dwellings and 24,800 residents at full
    development
  ▪ Wallan East (Part 1) is expected to achieve 2,250 dwellings and 7,000 residents at full
    development.
Table 4: Dwellings and Population at Full Development (estimate as at August 2020)
                                                            Net                                          Projected
                                                                               Dwellings /   Dwelling
 Area                                                   Developable                                     Population
                                                                                  Ha          Yield
                                                         Area (Ha)                                       (3.1 PPD)
 Wallan South PSP                                             400                  20         8,000      24,800
 Wallan East (Part 1) PSP                                      90                  25         2,250       6,975
 Established + Developing Wallan                              n/a                 n/a        10,462      32,588
 Total                                                        n/a                 n/a        20,712      64,363
Source: Victorian Planning Authority and Mitchell Shire Council, August 2020

The development areas are shown below.
Figure 6: Development Areas in Wallan

Source: Mitchell Shire Council, 2020

   M20052      Wallan South PSP and Wallan East (Part 1) PSP - Economic and Retail Assessment                 20 of 67
3.3 Summary The key takeaways from this section are: ▪ Wallan as a whole is expected to achieve 20,800 dwellings and 64,400 residents at full development ▪ Depending on the final location of the BIFT, additional development areas in Wallan East (Part 2) may increase the population projected at full development ▪ Wallan South is expected to achieve 8,000 dwellings and 24,800 residents at full development ▪ Wallan East (Part 1) is expected to achieve 2,250 dwellings and 7,000 residents at full development. M20052 Wallan South PSP and Wallan East (Part 1) PSP - Economic and Retail Assessment 21 of 67
4.0 ECONOMIC AND SOCIAL CONTEXT
     REVIEW
4.1       Overview
This section provides an economic and demographic context review to set the scene for
development projections. The section includes an assessment of current economic,
population, household and labour force conditions in the area benchmarked to comparison
areas.

4.2       Age Profile
The following demographic data is based on the Wallan suburb statistical area.
Wallan has a higher concentration of its population among age groups under 50, relative to
the Mitchell Shire and Regional Victoria. This greater concentration is most significant among
0-10- and 30-39-year age groups, due to the greater prevalence of young families. Wallan
has a lower median age than Mitchell Shire and the rest of Regional Victoria.
Figure 7: Age Breakdown
 18.0
 16.0
 14.0
 12.0
 10.0
   8.0
   6.0
   4.0
   2.0
   0.0
           0-9 years      10-19 years 20-29 years 30-39 years 40-49 years 50-59 years 60-69 years         70+ years

                                  Wallan   Mitchell (S)     Greater Melbourne     Rest of Vic.

Source: ABS Census 2016

Table 5: Median Age
                           Wallan          Mitchell Shire         Regional Victoria         Metropolitan Melbourne

 Median Age                  33                 37                       43                          36
Source: ABS Census 2016

  M20052     Wallan South PSP and Wallan East (Part 1) PSP - Economic and Retail Assessment                   22 of 67
4.3 Household Composition
Wallan’s household composition profile shows a greater presence of couples with children
relative to the Mitchell Shire, Regional Victoria, and Greater Melbourne. Owner-occupiers
make up 66.1% of dwellings.
Table 6: Household Composition
Greater
Household Type Wallan Mitchell Shire Regional Victoria
Melbourne
Couple family with no children 21% 22% 22% 20%
Couple family with children 37% 29% 21% 29%
One parent family 11% 10% 8% 9%
Lone person household 13% 18% 23% 20%
Group household 2% 2% 2% 4%
Other 16% 18% 24% 17%
Source: ABS Census 2016
4.4 Workforce
The figure below captures the skills of the Wallan workforce by industry of employment. A
large portion of the workforce are found in vocational and trade-based industries, with the
largest share found in Construction, Health and Retail industry sectors. These are largely
population-driven sectors.
As the population increases and the growth areas reach maturity the workforce industry
shares are expected to become more diverse, broadening the skillset of the population.
M20052 Wallan South PSP and Wallan East (Part 1) PSP - Economic and Retail Assessment 23 of 67Figure 8: Industry of Employment - Wallan Residents
0.0% 2.0% 4.0% 6.0% 8.0% 10.0% 12.0% 14.0%
Construction
Retail Trade
Health Care and Social Assistance
Manufacturing
Transport, Postal and Warehousing
Education and Training
Public Administration and Safety
Accommodation and Food Services
Other Services
Professional, Scientific and Technical Services
Wholesale Trade
Administrative and Support Services
Financial and Insurance Services
Electricity, Gas, Water and Waste Services
Rental, Hiring and Real Estate Services
Arts and Recreation Services
Information Media and Telecommunications
Agriculture, Forestry and Fishing
Mining
Source: ABS Census 2016
4.5 Income
Wallan’s personal and household income levels are above that of the Mitchell Shire, Regional
Victoria, and Greater Melbourne. This may reflect that households establishing in the area
have a job and select the area as a place to purchase a home.
Table 7: Median Weekly Income Levels
Wallan Mitchell Shire Regional Victoria Greater Melbourne
Personal $710 $648 $576 $673
Household $1,592 $1,391 $1,124 $1,542
Source: ABS Census 2016
4.6 Employment
The following sub-sections are based on Place-of-Work data for Wallan SA2 statistical area.
This data counts jobs located in the area and is therefore representative of the size and
structure of the local economy.
Over the five-year period between 2011 and 2016, the number jobs within Wallan grew by
585 jobs (6.2% per annum), from 1,679 to 2,264.
M20052 Wallan South PSP and Wallan East (Part 1) PSP - Economic and Retail Assessment 24 of 67The figure below illustrates the industry profile of the Wallan data area as indicated by 2016
Census data.
Figure 9: Wallan Industry Composition
Other (4.7 Job Catchment
Of those working within the Wallan region, 56.0% of workers are also residents. Of the
workers from outside the data area, the largest contributing regions are Kilmore-Broadford
(14.0%), Whittlesea (2.4%) and Romsey (2.3%).
Table 9: Job Catchment
Variable Wallan SA2
Number of employed persons living in Wallan 7,256
Number of persons employed in Wallan 2,264
Number of persons living and working in Wallan 1,268
Percentage of Wallan jobs occupied by residents 56.0%
Source: Census 2016, ABS.
4.8 Jobs Challenge
The following table shows various ratios relating to the provision of jobs in the area and a
nominal target for jobs assuming one job per dwelling. This uses the latest available Census
data (2016), which is now dated.
Nevertheless, the data provides a picture that is common to outer metropolitan growth areas:
that jobs lag population growth and a core challenge for planning strategies is to ensure the
number and range of jobs is maximised to the extent possible in the planning process.
Table 10: Job Ratios, Wallan, 2016
Wallan SA2 2016
Population 16,219
Dwellings 5,840
Employed Persons 7,256
Jobs 2,264
Jobs Per Person 0.14
Jobs Per Dwelling 0.39
Deficit of Jobs in 2016 Using Target Jobs at 1 Per Dwelling -3,576
Source: Census 2016, ABS.
4.9 Summary
The key takeaways from this section are:
▪ The median age of Wallan is lower than that of Mitchell, Greater Melbourne and Regional
Victoria due to the greater presence of young families.
▪ The skills of the local workforce predominantly lie in vocational and trade-based
industries such as Construction, Retail Trade, Healthcare and Social Assistance,
Manufacturing, and Logistics. These skillsets are likely to become more diverse as the
population grows.
M20052 Wallan South PSP and Wallan East (Part 1) PSP - Economic and Retail Assessment 26 of 67▪ Healthcare and Social Services, Accommodation and Food Services and Administrative and Support Services, are becoming more prevalent among local industries, while Construction, Retail Trade, and Rental, Hiring and Real Estate Services are experiencing growth at a slower rate. This may change as the population grows and diversifies. ▪ As an outer metropolitan growth area, jobs lag population growth and a core challenge for planning strategies is to ensure the number and range of jobs is maximised to the extent possible in the planning process. M20052 Wallan South PSP and Wallan East (Part 1) PSP - Economic and Retail Assessment 27 of 67
5.0 RETAIL AND ACTIVITY CENTRE ANALYSIS
5.1        Overview

This section provides a supply and demand assessment of retail sectors and associated office
and community facility uses that could be supported in the study area, having regard to the
regional context and planning framework.

The section includes analysis of supportable floorspace by type over time and likely job
generation for town centres and related commercial and community land uses.

5.2        Existing and Planned Centres
The table below provides an overview of the activity centre hierarchy in Wallan and
surrounding areas. This includes an estimate of retail supply for existing centres and an
estimate of future supply for proposed centres.
Table 11: Existing and Proposed Activity Centre (Retail) Hierarchy as at 2020
                                                                  Estimated Size
Centre                          Hierarchy          Status                        Major Tenants
                                                                       (sqm)
Wallan                            MAC       Existing and proposed     21,700+
 Wellington Square SC                       Existing and proposed     9,700      Woolworths (discount department store and other retail to come)
 Wallan Coles Centre                              Existing            2,800      Coles
 Other                                            Existing           10,200      High Street, ALDI , other commercial
Wallara Waters                    MAC             Proposed           23,700      Discount department store, supermarkets, other
Station Street Wallan East        LCC             Proposed            1,800      Small supermarket (1,000 sqm)
Wallan South LTC                  NAC             Proposed            9,000      Full line supermarket/s, other
Wallan South LCC                  NAC             Proposed            3,000      Local convenience retail
Wallan East (Part 1) LCC          NAC             Proposed            3,000      Local convenience retail
Beveridge North West PSP        4 x NACs          Proposed          22,000 (4)   Supermarkets (various), other
Major Centre to South:
Beveridge (Mitchell)              MAC            Proposed            20,000+     Supermarkets, discount department store TBC
Donnybrook / Lockerbie (Hume)     PAC            Proposed            50,000+     Department stores, supermarkets, bulky goods, etc.
Craigieburn Central (Hume)        MAC             Existing           40,000      Big W, Target, Coles, Woolworths, Aldi, Bulky Goods
Source: HillPDA 2020, Essential Economics 2018, Charter Keck Cramer 2014

Wallan is designated as a MAC and has approximately 21,000 sqm of retail space. The
surrounding growth areas of Wallara Waters, Wallan South and Beveridge North West
propose to accommodate a network of Neighbourhood Activity Centres (also called Local
Town Centres) and Local Convenience Centres.
Higher order services are currently available in Craigieburn in the City of Hume and in other
centres further away. Craigieburn is approximately 22km from Wallan.
Over time, Lockerbie, which is 10km from Wallan, is expected to reach Principal Activity Centre
status and provide higher order services closer to Wallan.

   M20052        Wallan South PSP and Wallan East (Part 1) PSP - Economic and Retail Assessment                                        28 of 67
Figure 10: Location of Centres M20052 Wallan South PSP and Wallan East (Part 1) PSP - Economic and Retail Assessment 29 of 67
Wallan Town Centre
Wallan Town Centre, centred on High Street, is nominated as a major activity centre and is
subject to a master plan adopted by Council in 2016. Major retail and office activities are likely
to be focused in the Wallan Town Centre in the future.
Recent investment activity in Wallan includes:

  ▪ Construction of an Aldi supermarket in High Street, Wallan
  ▪ Construction of a commercial building in High Street, Wallan.
Proposed works include a commercial development in High Street and Council-led Town
Centre upgrade works. Wellington Square also has a significant expansion proposal in place
for the land to the west across Wellington Street. This includes construction of a discount
department store and further retail uses including a hardware store and speciality retail.
Figure 11: Wallan Town Centre Masterplan

Source: Mitchell Shire Council

   M20052      Wallan South PSP and Wallan East (Part 1) PSP - Economic and Retail Assessment   30 of 67
Wallara Waters
This is a proposed major activity centre located at the northern tip of the Newbridge
development. The centre recently gained planning approval for the following uses which
would service Wallan as a whole and the wider region:

 ▪ 23,700 sqm of retail space including:
    – 6,500 sqm discount department store
    – 8,400 sqm of supermarkets
    – 8,800 sqm of other retail including minimajor and speciality retail
 ▪ 18,000 sqm to 52,000 sqm of other commercial and community services uses.
The centre would serve all of Wallan including the nearby Wallan East (Part 1) PSP area,
however the walking catchment is currently constrained by the train line, roads and the Merri
Creek.

Station Street Local Town Centre
Land to the west of Wallan Station along Station Street is zoned as Township Zone. The land
of approximately 12 ha currently accommodates detached houses and is expected to grow to
support more intensive uses adjacent to the train station.
The proposed development of a local town centre on Station Street includes a recently
approved 1,000 sqm supermarket, shops, apartments and a brew pub.
More intensive activity is expected as residential activity in Wallan increases and the station
becomes part of the PPTN network.
The centre could draw trade from future residents in the Wallan East (Part 1) PSP, however
there are currently access issues given the land is on the west side of the train tracks. More
detailed planning is required to establish a precinct around the station that supports a mix of
uses.

Beveridge North West
There are four neighbourhood activity centres and two local convenience centres proposed
within the Beveridge North West PSP area. The NAC’s range from 3,300 sqm to 6,300 sqm of
retail with 1,400 sqm to 2,700 sqm of commercial floorspace. Local convenience centres are
proposed to host 1,000 sqm of retail floorspace each.

5.3    Retail Floorspace Demand
Based on the existing and planned activity centre structure in the region, Wallan performs all
roles up to Major Activity Centre, which is also called sub-regional in retail economics.
Within this context, Wallan South and Wallan East (Part 1) will perform neighbourhood roles.

  M20052   Wallan South PSP and Wallan East (Part 1) PSP - Economic and Retail Assessment   31 of 67
The retail modelling shown below is structured to take this framework into account. The modelling provides an estimate of total retail demand from the two PSP areas and Wallan as a whole and assumes: ▪ Sub-regional demand from the Wallan and surrounding areas area is captured by Wallan ▪ Some sub-regional demand from areas north of Wallan, such as Kilmore, is included ▪ Higher order regional shopping centre spending (demand) is partly captured by the large centres to the south ▪ Bulk goods demand from Wallan is partly captured locally in Wallan ▪ Neighbourhood centres capture demand up to supermarket level from their local areas. The modelling results are shown the in three tables below. Each table has three parts: ▪ Part 1: Total retail expenditure supported by the population of the area across the retail economy ▪ Part 2: Total retail floorspace (sqm) supported by the population of the area across the retail economy ▪ Part 3: Estimated retail floorspace (sqm) capture in the area of analysis. Table 12 provides data for Wallan (suburb). Table 13 provides data for Wallan South PSP area and Table 14 provides data for Wallan East (Part 1) PSP area. Highlights of the analysis are noted below. 5.4 Wallan Wallan (suburb) comprises the existing township and surrounding areas including the two PSP areas subject to this study and Wallara Waters. Overall retail expenditure is expected to increase from around $179m in 2021 to $475m in 2036 to $840m at full development. Floorspace supported by this expenditure across the retail economy is estimated at 32,100 sqm in 2021 increasing to 85,200 sqm by 2036 and 150,600 sqm at full development. Of this floorspace, it is estimated that a possible share (or capture rate) for Wallan could be in the order of at 25,900 sqm in 2021 increasing to 68,800 sqm by 2036 and 121,500 sqm at full development. This relates to all retail centres and uses across the suburb as a whole, not just the town centre. A guide by commodity group and store type is shown in the tables. M20052 Wallan South PSP and Wallan East (Part 1) PSP - Economic and Retail Assessment 32 of 67
Table 12: Wallan (Suburb) Retail Demand Data
Total Expenditure Supported Across Retail Economy ($m2020)
YEAR                                                     2021        2026         2031         2036       FD
No. of Residents                                        14,562      21,068       29,019        36,420   64,363
Food & Groceries                                         66.5         98.2       138.0         176.7     312.2
Liquor Take-Away                                          9.8         14.4        20.3          26.0     45.9
Take-Away Food                                           10.3         15.2        21.3          27.3     48.3
Apparel                                                  16.8         24.8        34.8          44.6     78.7
Homewares & Manchester                                    3.9         5.8          8.1          10.4     18.4
Bulky Goods                                              29.8         43.9        61.8          79.1     139.7
Other Goods                                              24.1         35.5        49.9          64.0     113.0
Selected Personal Services                                4.8         7.1         10.0          12.9     22.7
Liquor Consumed On Premises                               3.7         5.4          7.6          9.7      17.2
Meals in Pubs, Clubs, Restaurants                         9.3         13.8        19.4          24.8     43.9
TOTAL                                                    179.0       264.2       371.3         475.3     840.0

Total Floorspace (sqm) Supported Across Retail Economy
YEAR                                                     2021        2026         2031         2036       FD
Supermarkets & Grocery Stores                            5,686       8,392       11,792        15,098   26,682
Specialty Food Stores                                    1,381       2,038       2,863         3,666     6,478
Fast-Food Stores                                         1,291       1,905       2,677         3,428     6,058
Restaurants, Hotels and Clubs                            2,601       3,839       5,394         6,907    12,206
Department Stores                                        3,479       5,135       7,216         9,239    16,327
Clothing Stores                                          2,440       3,602       5,061         6,480    11,451
Bulky Goods Stores                                       8,914      13,157       18,488        23,671   41,833
Other Personal & Household Goods Retailing               4,908       7,244       10,179        13,032   23,031
Selected Personal Services                               1,383       2,041       2,868         3,672     6,489
Total Retailing                                         32,083      47,353       66,539        85,193   150,556

Estimated Retail Floorspace (sqm) Capture in Local Area
YEAR                                                     2021        2026         2031         2036       FD
Supermarkets & Grocery Stores                            5,686       8,392       11,792        15,098   26,682
Specialty Food Stores                                    1,381       2,038       2,863         3,666     6,478
Fast-Food Stores                                         1,291       1,905       2,677         3,428     6,058
Restaurants, Hotels and Clubs                            2,601       3,839       5,394         6,907    12,206
Department Stores                                        1,740       2,568       3,608         4,619     8,164
Clothing Stores                                          2,440       3,602       5,061         6,480    11,451
Bulky Goods Stores                                       4,457       6,579       9,244         11,836   20,916
Other Personal & Household Goods Retailing               4,908       7,244       10,179        13,032   23,031
Selected Personal Services                               1,383       2,041       2,868         3,672     6,489
Total Retailing                                         25,886      38,207       53,687        68,738   121,476
*FD = Full development
Source: HillPDA

   M20052     Wallan South PSP and Wallan East (Part 1) PSP - Economic and Retail Assessment            33 of 67
5.5    Wallan South PSP Area
The Wallan South PSP area is expected to generate $324m of retail expenditure at full
development.
Floorspace supported by this expenditure (across the retail economy) is estimated at 58,000
sqm at full development.
Of this floorspace, it is estimated that a possible share (or capture rate) for the Wallan South
PSP area could be in the order of 12,700 sqm at full development for local convenience and
neighbourhood level retail services. This includes supermarket space at approximately 5,200
sqm and a range of speciality store types which can be allocated to one neighbourhood centre
(anchored by a full line supermarket) and a separate local convenience centre with a small
supermarket.
Given the spatial structure of the PSP area, there is potential for a full line supermarket-based
centre to be located in the central part of the area and small convenience centre in the
western part of the area.
A guide by commodity group and store type is shown in the tables.
Details regarding location and floorspace mix are shown in the recommendations section of
this report.

  M20052   Wallan South PSP and Wallan East (Part 1) PSP - Economic and Retail Assessment   34 of 67
Table 13: Wallan South Retail Demand Data
Total Expenditure Supported Across Retail Economy ($m2020)
YEAR                                                     2021        2026         2031         2036      FD*
No. of Residents                                           0         2,480       9,920         17,360   24,800
Food & Groceries                                          0.0         11.6        47.2          84.2    120.3
Liquor Take-Away                                          0.0         1.7          6.9          12.4     17.7
Take-Away Food                                            0.0         1.8          7.3          13.0     18.6
Apparel                                                   0.0         2.9         11.9          21.2     30.3
Homewares & Manchester                                    0.0         0.7          2.8          5.0       7.1
Bulky Goods                                               0.0         5.2         21.1          37.7     53.8
Other Goods                                               0.0         4.2         17.1          30.5     43.5
Selected Personal Services                                0.0         0.8          3.4          6.1       8.8
Liquor Consumed On Premises                               0.0         0.6          2.6          4.6       6.6
Meals in Pubs, Clubs, Restaurants                         0.0         1.6          6.6          11.8     16.9
TOTAL                                                     0.0         31.1       126.9         226.6    323.7

Total Floorspace (sqm) Supported Across Retail Economy
YEAR                                                     2021        2026         2031         2036      FD*
Supermarkets & Grocery Stores                              0          988        4,031         7,197    10,281
Specialty Food Stores                                      0          240         979          1,747    2,496
Fast-Food Stores                                           0          224         915          1,634    2,334
Restaurants, Hotels and Clubs                              0          452        1,844         3,292    4,703
Department Stores                                          0          605        2,467         4,404    6,291
Clothing Stores                                            0          424        1,730         3,089    4,412
Bulky Goods Stores                                         0         1,549       6,320         11,283   16,119
Other Personal & Household Goods Retailing                 0          853        3,480         6,212    8,874
Selected Personal Services                                 0          240         980          1,750    2,500
Total Retailing                                            0         5,574       22,746        40,608   58,011

Estimated Retail Floorspace (sqm) Capture in Local Area
YEAR                                                     2021        2026         2031         2036      FD*
Supermarkets & Grocery Stores                              0          494        2,016         3,598    5,141
Specialty Food Stores                                      0          120         489           874     1,248
Fast-Food Stores                                           0          112         458           817     1,167
Restaurants, Hotels and Clubs                              0          113         461           823     1,176
Department Stores                                          0           0            0            0         0
Clothing Stores                                            0          106         433           772     1,103
Bulky Goods Stores                                         0           0            0            0         0
Other Personal & Household Goods Retailing                 0          213         870          1,553    2,219
Selected Personal Services                                 0           60         245           438      625
Total Retailing                                            0         1,218       4,971         8,875    12,678
*FD = Full development
Source: HillPDA

   M20052     Wallan South PSP and Wallan East (Part 1) PSP - Economic and Retail Assessment            35 of 67
5.6    Wallan East (Part 1) PSP Area
The Wallan East (Part 1) PSP area is expected to generate $91m of retail expenditure at full
development.
Floorspace supported by this expenditure (across the retail economy) is estimated at 16,400
sqm at full development.
Of this floorspace, it is estimated that a possible share (or capture rate) for the Wallan East
(Part 1) PSP area could be in the order of 3,300 sqm at full development. This could include a
small supermarket (grocery store) plus speciality stores.
Details regarding location and floorspace mix are shown in the recommendations section of
this report.

  M20052   Wallan South PSP and Wallan East (Part 1) PSP - Economic and Retail Assessment   36 of 67
You can also read


