N4 / N7 Corridor Study - Feb 2017 - Transport Infrastructure Ireland
←
→
Page content transcription
If your browser does not render page correctly, please read the page content below
Roughan & O’Donovan AECOM Alliance      N4-N7 Corridor Study
                                                Final Report

-

      N4 / N7 Corridor Study
                                     Feb 2017
Roughan & O’Donovan AECOM Alliance                                            N4-N7 Corridor Study
                                                                                      Final Report

                                       N4 – N7 Corridor Study

                                             Final Report

Made: ......................... Liam O’Brien / Jonathan Hennessy

Reviewed: ................. Philip Shiels

Approved: ................. Shane Dunny

Document No.       Revision      Status      Made      Reviewed    Approved        Date
       1               B          Final     LOB / JH       PS        SD         14/02/2017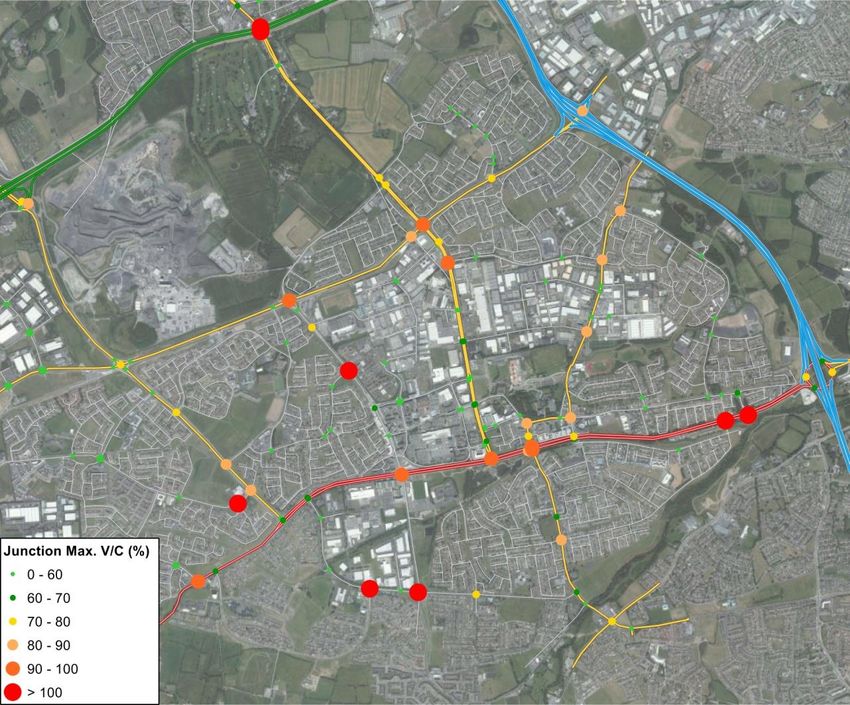
N4-N7 Corridor Study

                                                                Final Report

                                                          Table of Contents

                                                                                                                                                Page
Chapter 1    Introduction .................................................................................................................... 1
1.1   Context ........................................................................................................................................ 1
1.2   Study Area ................................................................................................................................... 1
1.3   National Roads and Travel Demand ........................................................................................... 2
1.4   Development of N4 – N7 Corridors ............................................................................................. 3
1.5   Trans- European Transport Networks ......................................................................................... 3

Chapter 2    Background Policy and Study Objectives ................................................................... 6
2.1   Policy Review .............................................................................................................................. 6
2.2   Overall Aim of Study / Study Objectives ..................................................................................... 9
2.3   Study Working Group ................................................................................................................ 10

Chapter 3     Existing Situation ......................................................................................................... 11
3.1   Overview.................................................................................................................................... 11
3.2   Traffic Demand on National Road Network ............................................................................... 12
3.3   Strategic Travel Patterns ........................................................................................................... 17
3.4   Local Traffic Patterns ................................................................................................................ 18
3.5   Traffic Demand on Local Road Network ................................................................................... 19
3.6   Local Congestion Issues ........................................................................................................... 22
3.7   Summary of Existing Situation .................................................................................................. 25

Chapter 4    Future Year Models ...................................................................................................... 27
4.1   Comparison of TII and SDCC Forecast Growth Scenarios ....................................................... 27
4.2   Future Modal Splits ................................................................................................................... 28
4.3   Future Committed Schemes within the Study Area .................................................................. 29

Chapter 5    The Future ‘Do Minimum’ Scenario ............................................................................ 31
5.1   Future Model Outputs ................................................................................................................ 31
5.2   Summary of Future ‘Do Minimum’ Network Issues ................................................................... 34

Chapter 6     Scheme Testing............................................................................................................ 36
6.1   Identification of Local Schemes for Assessment ...................................................................... 36
6.2   Identification of Broader Schemes for Assessment .................................................................. 40
6.3   Assessment of Scheme Options ............................................................................................... 41
6.4   Individual Impacts of Scheme Options ...................................................................................... 42
6.5   Do Something Combined Impacts ............................................................................................ 44
6.6   Do Something Sensitivity A (Ongar Link) .................................................................................. 49
6.7   Do Something Sensitivity B (Ongar Link & M50 Demand Management) ................................. 52

Chapter 7    Preferred Strategy ........................................................................................................ 56
7.1   Overview of Preferred Strategy ................................................................................................. 56
7.2   Sensitivity Tests ........................................................................................................................ 57

Chapter 8 Summary / Conclusion ................................................................................................ 58
8.1   Summary / Conclusion .............................................................................................................. 58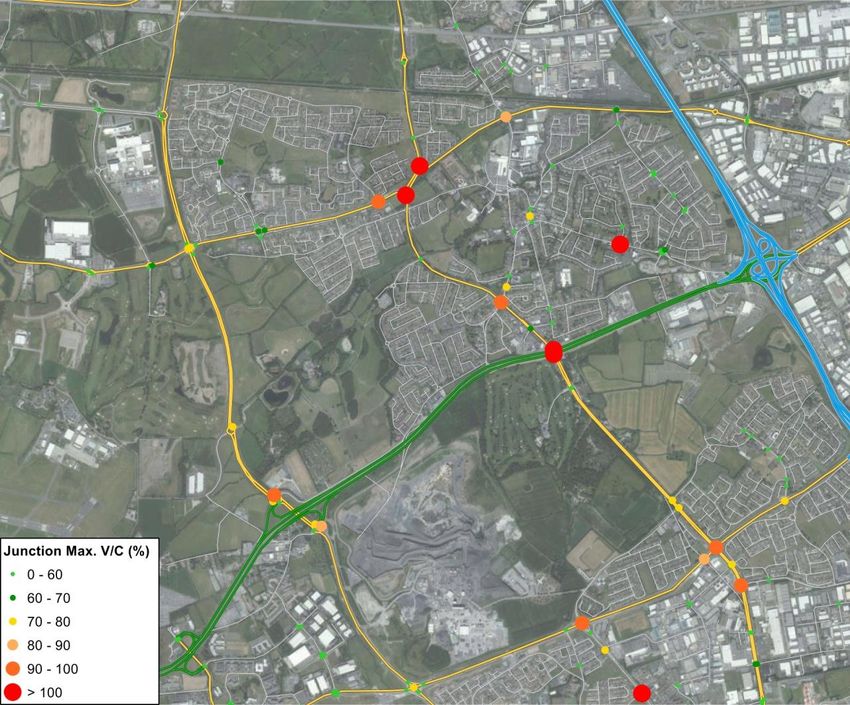
AECOM - Roughan & O’Donovan Alliance                                                  N4-N7 Corridor Study
                                                                                              Final Report

Chapter 1                    Introduction

1.1         Context

Transport Infrastructure Ireland (TII) is responsible for securing the provision of a safe and efficient
network of National Roads in accordance with Section 17 of the Roads Act, 1993. In discharging this
responsibility, TII recognise that National Roads represent only a proportion of the total length of road
infrastructure, and that the safe and efficient operation of National Roads is intrinsically linked to the
efficiency and provision of nearby Local and Regional Roads.

In the vicinity of major cities, National Roads operate within a dense network of road infrastructure.
Whilst National Roads in these areas support high volumes of traffic engaging in local activities such
as commuting, retail and other activities, they are nevertheless required to continue to support more
strategic roles in parallel, such as access to ports, inter-urban trade and logistics. In order to support
such functionality, TII works with Local Authorities to develop coordinated plans for investment in road
infrastructure which seek to protect the strategic function of the National Roads, whilst supporting
population and employment growth in the areas served by them.
This study into the N4 and N7 road corridors in Dublin is being directed by a steering group comprising
of TII and South Dublin County Council (SDCC).

1.2         Study Area

The Study Area for the N4/N7 Corridor Study is characterised by a high residential population in the
areas of Lucan/Clondalkin and Tallaght to the east, with smaller villages surrounded by agricultural
uses to the west. The Study Area was identified and agreed between TII and SDCC. The Study Area
generally follows the boundary of South Dublin County Council where appropriate while also following
the strategic corridors of the M50, N4, N7 and N81. The 2011 Small Area Population Statistics1
showed a population in the region of 200,000 persons in the Study Area which is shown graphically in
Figure 1.1.

1
    http://www.cso.ie/en/census/census2011smallareapopulationstatisticssaps/

                                                            Page 1
AECOM - Roughan & O’Donovan Alliance                                                               N4-N7 Corridor Study
                                                                                                           Final Report

                                             Figure 1.1: Plan of Study Area

1.3               National Roads and Travel Demand

In order to ascertain the pattern of traffic growth on the National Road network an analysis of TII’s
Traffic Indices up to 2016 was undertaken. This analysis revealed that in 2015 the average traffic
growth for National Road traffic for all vehicles classes grew by 4.2% as against 3.4% in 2014. By
comparison in 2015 M50 traffic for all vehicles grew by 4.5% as against 4.2% in 2014. The growth on
Dublin National Radial Roads grew in the year to December 2015 by 4.3% as against 3.8% in 2014.
Figure 1.2 outlines these trends.
                                                        Traffic Growth
                120

                115

                110

                105
  Index Value

                100

                95

                90

                85

                80
                      Q3'13    Q4'13   Q1'14    Q2'14       Q3'14      Q4'14       Q1'15   Q2'15    Q3'15     Q4'15

                         M50              Dublin National Road Radials                     All National Roads
                      Figure 1.2 – All National Roads, Dublin Radials and M50 Indices: All Vehicles
                                               Source: TII Traffic Indices, 2016

                                                           Page 2
AECOM - Roughan & O’Donovan Alliance                                              N4-N7 Corridor Study
                                                                                          Final Report

From the analysis it can be seen that, in general, traffic growth on the National Road network has
followed a steady upwards trajectory since late 2013. The growth on the Dublin National Road radials
and the M50 has followed a similar trajectory but with more extensive growth in traffic noted,
particularly on the M50.

1.4      Development of N4 – N7 Corridors
Over the past five decades, significant investment has been made in improving the capacity and
efficiency of the N4 and N7. In tandem, there has been significant residential, employment and
commercial development throughout the Study Area which has resulted in increased travel demand
and associated congestion.

1.4.1   N4 Route Development
During the 1980's the N4 route was upgraded to a dual 2-lane carriageway outward from Dublin in
phases as far as the Dublin County boundary between Lucan and Leixlip. The scheme included
bypasses of the villages of Chapelizod, Palmerstown and Lucan. In the 1990's the high-quality N4
National Primary route was extended westward as the M4 Motorway through north County Kildare,
and eventually as the M4/M6 all the way to Galway by 2010. Liffey Valley Shopping Centre was
developed in the 1990's at Quarryvale which is located between the M50 and the R113 Fonthill Road
at the southern edge of the N4 dual carriageway. The development of this regional scale retail centre
attracted a significant volume of traffic to the N4 and M50 routes. The N4 has benefitted from the
recent widening of the mainline to three lanes between Liffey Valley and the Spa Hotel and an
upgrade to the Newcastle Road Junction has completed the grade separation of the N4 west of the
M50.

1.4.2 N7 Route Development
The N7 Naas Road between Dublin and Naas was developed as the first dual carriageway in Ireland
in the 1960's. As traffic volumes grew in the Greater Dublin Area and demand for interurban traffic
increased between Dublin and the provincial cities to the south and southwest, the N7 was widened
and upgraded over the past 15 years to a 3 lane carriageway with grade-separated junctions. This
upgrade was carried out as far as Newland's Cross which remained an at-grade signalised junction up
until late 2014 when the construction of a new grade separated junction was completed.

An 80 km/h speed limit applies to the short section of the N7 between M50 Junction 9 and Newlands
Cross. West of Newlands Cross the route has a 100 km/h speed limit and the road is rural in nature
without footpaths, cycle tracks and other urban facilities.

1.5     Trans- European Transport Networks

The Trans-European Transport Networks (TEN-T) are a set of road, rail, air and water transport
networks in Europe. There are two designations in the TEN-T network which have implications for the
future management and improvement of the road network.

The ‘core’ TEN-T network will act as the backbone for transportation within the EU and will be
supported by a ‘comprehensive’ network of routes, feeding into the core network at regional and
national level. The aim is to ensure that progressively, throughout the entire EU, the TEN-T will
contribute to enhancing internal markets, strengthening territorial, economic and social cohesion and
reducing greenhouse gas emissions.

Regulation (EU) No 1315/2013 sets out the requirements for high quality roads that shall form part of
the TEN-T road network, both Core and Comprehensive, and states under Article 17(3), the following:

“High-quality roads shall be specially designed and built for motor traffic, and shall be motorways,
express roads or conventional strategic roads.

                                               Page 3
AECOM - Roughan & O’Donovan Alliance                                                 N4-N7 Corridor Study
                                                                                             Final Report

(a) A motorway is a road specially designed and built for motor traffic, which does not serve properties
bordering on it and which:
            (i) is provided, except at special points or temporarily, with separate carriageways for the
            two directions of traffic, separated from each other by a dividing strip not intended for
            traffic or, exceptionally, by other means;
            (ii) does not cross at grade with any road, railway or tramway track, bicycle path or
            footpath; and
            (iii) is specially sign-posted as a motorway.

(b) An express road is a road designed for motor traffic, which is accessible primarily from
interchanges or controlled junctions and which:
            (i) prohibits stopping and parking on the running carriageway; and
            (ii) does not cross at grade with any railway or tramway track.

The N7 is part of the core TEN-T network in Ireland and the N4 is part of the comprehensive network
as shown in Figure 1.3.

                                                Page 4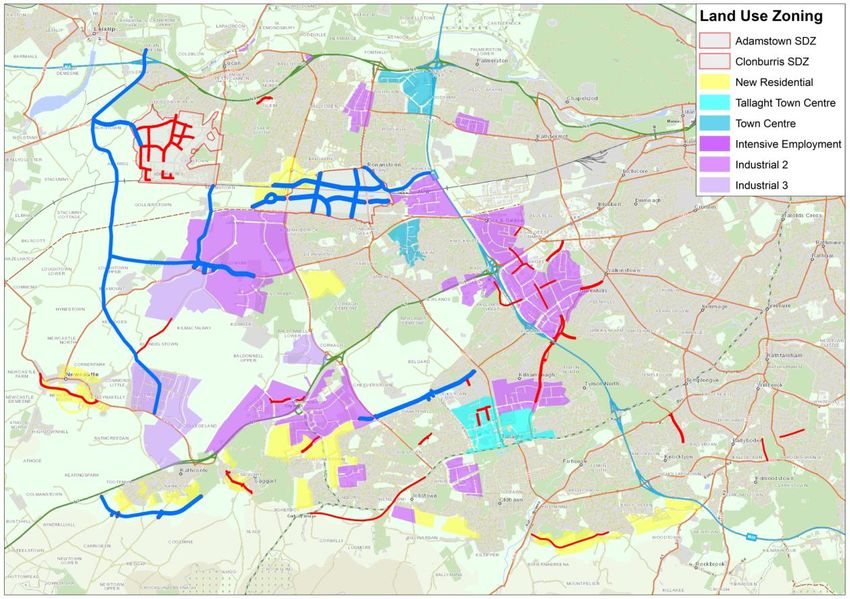
AECOM - Roughan & O’Donovan Alliance                                            N4-N7 Corridor Study
                                                                                        Final Report

                                                                   N4

                                                              N7

                  Figure 1.3: TEN-T core and comprehensive road network in Ireland

                                              Page 5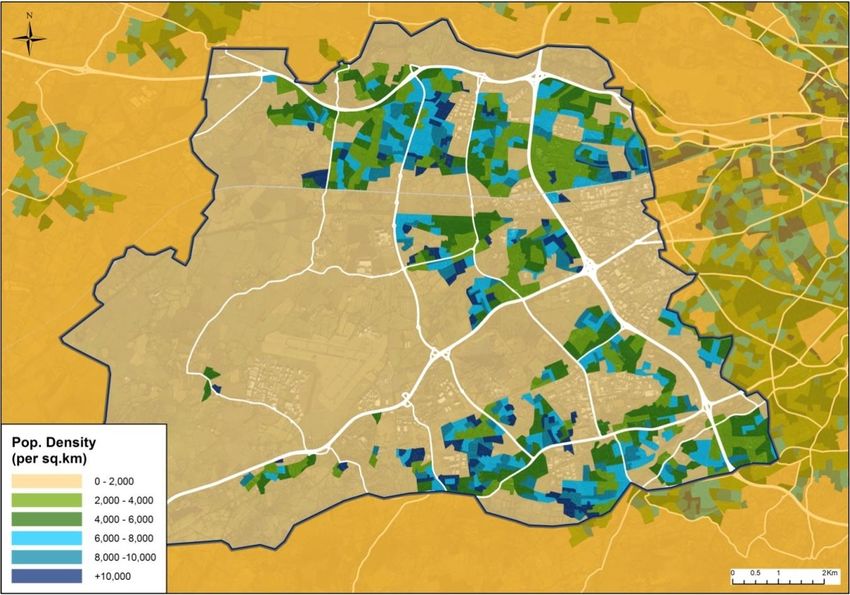
AECOM - Roughan & O’Donovan Alliance                                                  N4-N7 Corridor Study
                                                                                              Final Report

Chapter 2              Background Policy and Study Objectives

2.1     Policy Review

Government policy relating to the safety, efficiency and capacity of the National Roads network is set
out in the Department of Environment document entitled “Spatial Planning and National Roads”
published in January 2012. In essence this seeks to ensure that local authorities adopt policies that
avoid the undermining of the strategic transport function of National Roads by promoting local
transport infrastructure measures intended to cater for the roads needs of local traffic and local
development related traffic.

Strategic traffic, in the context of National Roads, primarily comprises major inter-urban and inter-
regional traffic. This inter-urban and inter-regional traffic, whether HGV, car, public transport bus
services or other public service vehicles, contributes to socio-economic development and the
transportation of goods and products, especially traffic to/from the main ports and airports, both freight
and passenger related.

TII’s Project Appraisal Guidelines (PAG) set out a structured approach to the appraisal of National
Road projects that assist decision making and ensure that the best choices are made and the best
value for money is obtained on all projects. The PAG’s take cognisance of the requirements of the
Department of Public Expenditure and Reform’s “Public Spending Code” as well as the Department of
Transport Tourism and Sport’s “Guidelines on a Common Appraisal Framework for Transport Projects
and Programmes” and the “Strategic Framework for Investment in Land Transport”.

2.1.1   NTA Transport Strategy for the Greater Dublin Area 2016–2035
In April 2016 the NTA published the “Greater Dublin Area Transport Strategy 2016 to 2035”. This
strategy seeks to build upon the previous 2011 to 2030 strategy and sets out the transport
requirements for the Greater Dublin Area (GDA), based on the principles of effective, efficient and
sustainable travel. The strategy outlines a suite of transportation objectives for the GDA including the
provision of additional public transport facilities (heavy rail, light rail, bus and bus rapid transit
facilities), cycling and walking infrastructure and road network measures up to 2035. The following
transport infrastructure proposals have been identified within the strategy:

Table 2.1 – Infrastructure Proposals contained with the NTA Transport Strategy
 Category                 Infrastructure proposal

                          Reconfiguration of the N7 from its junction with the M50 as far as Naas
                          including the rationalisation of junctions and accesses in order to provide a
                          higher level of service for strategic traffic travelling on the mainline.

                          Reconfiguration of the N4 from its junction with the M50 as far as Leixlip
 National Roads           including the rationalisation of accesses and to provide additional capacity
                          at the Quarryvale junction.

                          Provision of upgrades to the National Secondary road network, including
                          bypasses, in line with the “Principles of Road Development” set out in
                          Section 5.8.3 of the strategy document.

 Regional and Local       Enhancement of orbital movements, outside of the M50 C-Ring, between
                          the N3, N4 and N7 National Roads, through the widening of existing roads
 Roads
                          and the development of new road links.

                                                 Page 6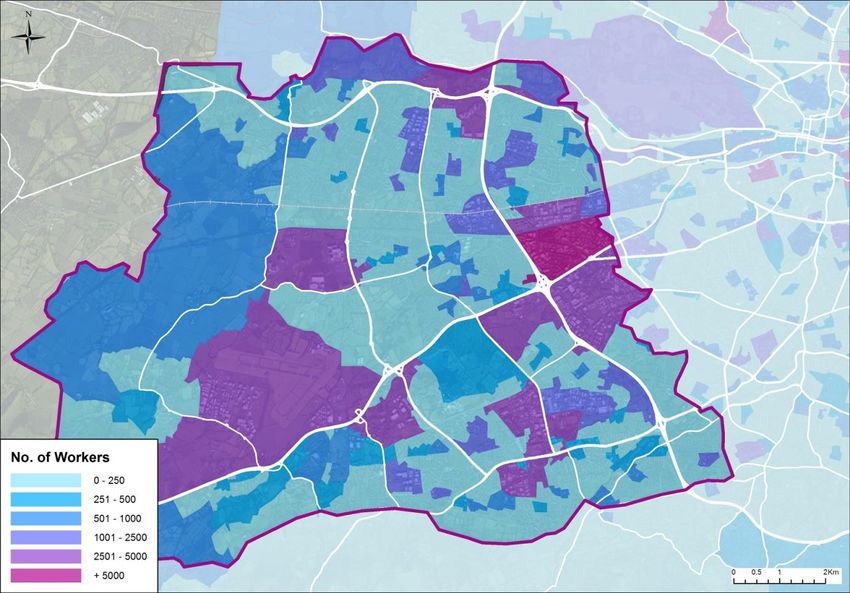
AECOM - Roughan & O’Donovan Alliance N4-N7 Corridor Study
Final Report
Category Infrastructure proposal
Implementation of necessary upgrades to the regional and local road
network in line with the “Principles of Road Development” set out in Section
5.8.3 of the strategy document.
Enhancement of pedestrian and cycle safety through the provision of safer
road junctions, improved pedestrian crossing facilities and the incorporation
of appropriate cycle measures including signalised crossings where
necessary.
Addressing localised traffic delay locations, including delays on radial routes
inside the M50 C-Ring, in cases where the primary reason for intervention is
to address safety or public transport issues at such locations.
Implementing various junction improvements and local reconfigurations on
the regional and local road network.
Re-opening of the Phoenix Park Tunnel Link for passenger services, linking
the Kildare / Cork line to the city centre.
Heavy Rail
Completion of the DART Expansion programme to provide DART services
to Hazelhatch on the Kildare Line (including a tunnel connection from
Kildare line to link with the Northern / South-Eastern line).
Completion of the Luas Cross City connecting St. Stephen’s Green to
Broombridge and intersecting with the Red Line at Abbey Street.
Delivering the Luas to Lucan, providing a high capacity link into the centre
Light Rail of Lucan’s large residential areas to the south of the N4 National Road, and
connecting to the city centre.
Delivering the Luas Red Line extension to Poolbeg, linking the north
Docklands to this new development area south of the Liffey.
Core Radial bus network including:
Lucan – Palmerstown – Kilmainham;
Liffey Valley – Ballyfermot;
N7/Clondalkin – Crumlin;
Tallaght – Walkinstown – Crumlin;
Tallaght – Rathfarnham – Terenure
Bus Infrastructure Core Orbital Bus network including:
Dundrum / UCD – Tallaght
Tallaght – Blanchardstown
Core regional bus network including:
M4/ N4, via Chapelizod Bypass
M7/ N7, via Long Mile Road
Bus Rapid transit including:
Page 7AECOM - Roughan & O’Donovan Alliance N4-N7 Corridor Study
Final Report
Category Infrastructure proposal
Clongriffin to Tallaght
Section 5.8.3 of the strategy document refers to the principles of road development. This section
states that in order to support National policy and to reduce growth in car travel and encourage
increased use of public transport, cycling and walking, it is intended that road development in the
Greater Dublin Area will be undertaken in accordance with the following principles:
That there will be no significant increase in road capacity for private vehicles on radial roads
inside the M50 motorway;
That each proposed road scheme is consistent with this Strategy and with Government
policies related to transport;
That the travel demand or the development needs giving rise to the road proposal are in
accordance with regional and national policies related to land use and development planning;
That the development of the road scheme does not diminish in any significant way the
expected beneficial outcomes of the Strategy;
That the road scheme, other than a motorway or an express road proposal, will be designed to
provide safe and appropriate arrangements to facilitate walking, cycling and public transport
provision; and
That road schemes should only be progressed where alternative solutions, such as public
transport provision, traffic management or demand management measures, cannot effectively
and satisfactorily address the particular circumstances prompting the road proposal or are not
applicable or appropriate.
The NTA Strategy was subject to significant modelling and analysis. The NTA estimate that
implementing the proposals outlined in the strategy will result in the following outcomes:
A substantial proportion of projected growth in travel demand in the GDA will be
accommodated by sustainable transport modes;
The strategy is forecast to provide an increased mode share for sustainable transport modes
and a reduction in the demand to travel by private car;
The public transport network is forecast to operate efficiently with a significant increase in total
passenger boarding’s;
Travel times on the road network are forecast to reduce as a result of the strategy;
The strategy is forecast to reduce transport related noise and emissions;
The strategy is forecast to improve accessibility by reducing severance and increasing the
accessibility to public transport;
A more integrated public transport network provided by the strategy will result in an increased
level of public transport interchange; and
The strategy represents a worthwhile investment with transport user benefits forecast to
exceed the outline estimate cost of delivering the Strategy.
In assessing the impacts of the proposed Strategy the NTA compared a future year 2035 Do Minimum
scenario with a 2035 Do Strategy scenario. Figure 2.1 below details the 2035 AM peak hour mode
share statistics for the Do Minimum and Do Strategy scenarios for the M50 to Metropolitan Boundary
Corridor in which the N4/N7 Study Area is contained. As can be seen from Figure 6.19 the
implementation of the strategy measures are forecast to result in reduced car usage and increased
public transport uptake within the M50 to Metropolitan Boundary Corridor.
Page 8AECOM - Roughan & O’Donovan Alliance N4-N7 Corridor Study
Final Report
Figure 2.1: M50 to Metropolitan Boundary Mode Share Statistics 2035
The implementation of the range of measures outlined in this Study (the N4/N7 Corridor Study) will
complement the public transport measures outlined in the NTA’s Strategy by protecting the strategic
function of the National Road network and facilitating the use of local roads for local trip purposes.
This will also promote the use of public transport alternatives for longer distance commuting and in
parallel promote a reduction in the car commuting mode share for the area.
2.1.2 South Dublin County Council Development Plan
The South Dublin County Development Plan 2016-2022 came into effect from the 12th June 2016. The plan
was prepared in accordance with the requirements of the Planning and Development Act 2000 (as
amended). The Plan covers the administrative area of South Dublin County, which is 223 sq. kilometres in
extent. The Plan sets out South Dublin County Councils overall strategy for the planning and development
of the County and references the Regional Planning Guidelines (RPG) population and housing targets for
South Dublin County. Table 2.2 below outlines the targets referred to and includes Census 2006 and
Census 2011 housing and population figures for comparison.
Table 2.2: NSS/RPG Population and Housing Targets for South Dublin
SDCC Census 2006 Census 2011 Target 2016 Target 2022
Population 246,935 265,205 287,341 308,467
Housing 87,484 97,298 115,373 137,948
2.2 Overall Aim of Study / Study Objectives
In general, planning for future transport provision in the Study Area is against the backdrop of a mature
National Primary road network, but with potential for future development in the medium and long term.
It is therefore evident that provision for future capacity improvements will require a holistic
understanding of the future demand on National, Regional and Local roads.
The publication of the NTA Transport Strategy for the Greater Dublin Area 2016–2035 provides a
context within which this N4-N7 corridor study should be framed. The NTA Strategy was published in
April 2016 and therefore this study could not consider all aspects of the measures proposed, or their
impacts. However, it is acknowledged that the medium and long term strategies for responding to
future travel demand in these areas will have a strong public transport focus. The delivery of major
public transport projects are generally medium to long term initiatives, therefore the focus of this study
is to consider measures which seek to address on-going capacity issues, provide for short term growth
and facilitate the future provision for public transport and other modes.
This study seeks to achieve the following:
Page 9AECOM - Roughan & O’Donovan Alliance N4-N7 Corridor Study
Final Report
1. Describe and quantify the existing transport network in the Study Area, and the factors that
influence existing behaviour;
2. Understand the future growth in population, employment, retail, leisure uses and underlying
economic activity that will drive future increases in travel demand;
3. Develop and assess alternative approaches for responding to future demand using a
combination of control measures and infrastructure investment on National and
Regional/Local Roads to facilitate growth in population and employment, and corresponding
increases in economic activity; and
4. To achieve this in a way that seeks to address on-going capacity issues, provide for short term
growth and facilitate the future provision for public transport and other modes.
2.3 Study Working Group
A steering group compromising of TII and various departments from SDCC have been involved in the
development of this study. Consultation with other key stakeholders such as the National Transport
Authority (NTA) has also been undertaken at various stages throughout the lifetime of the study.
Presentations to the NTA and to the Strategic Planning Committee of SDCC were undertaken in April
2015.
Page 10AECOM - Roughan & O’Donovan Alliance N4-N7 Corridor Study
Final Report
Chapter 3 Existing Situation
3.1 Overview
This section of the report presents some key data regarding travel patterns in the Study Area which
have been extracted from TII permanent Traffic Monitoring Units (TMU’s) in the Study Area and from
the traffic surveys undertaken as part of the development of the 2013 base year N4/N7 traffic model.
Details of the traffic model development can be found in Appendix A (Traffic Modelling Report).
3.1.1 Study Area Characteristics
In order to understand the patterns of traffic demand on the local road network, a review of the
population densities and employment levels in the Study Area was undertaken. Figure 3.1 shows a
plot of population densities taken from the CSO Census 2011 at small area level.
7 M50
Lucan
N4
City Centre
9
Clondalkin 10
N4 Tallaght
11
12
Figure 3.1: Population densities in the Study Area from 2011 Census
The above map highlights the three distinct residential neighbourhoods in the Study Area - Lucan,
Clondalkin and Tallaght, all west of the M50. The plot emphasises the proximity of these major
residential areas to the National Road network. Therefore a large portion of traffic demand on these
sections of the N4 and N7 is associated with trips between these neighbourhoods and the City Centre.
A similar plot of the number of employees in each small area in the Study Area, taken from the 2011
CSO Place of Work, School or College Census of Anonymised Records (POWSCAR) database is
presented in Figure 3.2.
Page 11AECOM - Roughan & O’Donovan Alliance N4-N7 Corridor Study
Final Report
Liffey Valley
7
Fonthill M50
Park West City Centre
N4
Grange Castle
Ballymount
9
City West 10
N4
11
12
Tallaght
Figure 3.2: Employment numbers in the Study Area from 2011 Census
Liffey Valley and Tallaght Town Centre provide a strong retail presence and associated employment
close to the M50. The Ballymount area immediately east of the M50 at Junctions 9 and 10 is the
largest area of light industrial activity in the country and provides a large amount of employment for the
local populations. There are several other large areas of industrial employment in the northern parts of
Tallaght along the Belgard Road and westward along the N81. A newer zone of industrial
development is located at Grange Castle west of Clondalkin, where there is a large pharmaceutical
plant and other industries that are accessed via the R136 Grange Caste Road.
There is a large quantum of commercial office space between Junction 7 and 9 of the M50 (Park
West), and in Citywest Business Campus between the N7 and N81. In addition, there are defined
areas of industrial/logistics in Greenogue (adjacent to Baldonnell), in Clondalkin, and along the
Belgard Road. The range of uses is therefore relatively mixed, and results in a complex demand for
transport activity that extends throughout the day.
3.2 Traffic Demand on National Road Network
Annual average daily traffic (AADT) demand on each of the National Roads in the Study Area is
presented in Figure 3.3.
Page 12AECOM - Roughan & O’Donovan Alliance N4-N7 Corridor Study
Final Report
Figure 3.3: Annual Average Traffic Volumes (AADT) on National Road network 2015
Source: TII, TMU Data 2015
In order to obtain a clearer picture of the nature of traffic congestion on the busiest national routes, it is
necessary to examine weekday peak traffic demand, in addition to average demand across the day.
An average weekday daily profile of traffic volumes on the key routes is presented in Figure 3.4.
14,000
12,000
Hourly Traffic Volume
10,000
8,000
6,000
4,000
2,000
0
M50 (N4-N7) N4 (Liffey Valley) N7 Newlands
Figure 3.4: Weekday profile of traffic volumes on N4, N7 and M50
Source: TII, TMU Data 2015
Page 13AECOM - Roughan & O’Donovan Alliance N4-N7 Corridor Study
Final Report
The M50, N4 and N7 have a very similar demand profile with two distinct peak periods in the morning
and evening. The inter peak demand seen on these routes is lower than the morning and evening
peaks, although reasonably high traffic volumes are still noted during the inter peak periods. The M50
peaks are higher (reflecting the higher traffic volumes) and the morning and evening peaks start earlier
and endure for longer (reflecting the peak spreading effect on the M50).
The AM peak (08:00-09:00) and Inter-peak (12:00-13:00) typical two way traffic flows on National
Roads in the Study Area are presented in Figures 3.5 and 3.6 respectively.
Figure 3.5: AM peak (08:00-09:00) traffic flows on National Road network 2015
Source: TII, TMU Data 2015
Page 14AECOM - Roughan & O’Donovan Alliance N4-N7 Corridor Study
Final Report
Figure 3.6: Inter peak (12:00-13:00) traffic flows on National Road network 2015
Source: TII, TMU Data 2015
‘A Study of Lane Capacity in the Greater Dublin Area’ 2 published by TII found that the practical
capacity of an unmanaged lane in a traffic stream can be defined at approximately 1,700
vehicles/lane/hour for the M50 which has a 100kph speed limit. The research showed that once traffic
flow on a motorway lane exceeds 1,700 vehicles/lane/hour, congestion and more frequent incidents
and collisions begin to occur. Higher values of vehicles/lane/hour can occur in areas where the level of
turbulence in a traffic stream is minimised, and where vehicle headways are low. Although lane flows
that are higher than these values have been measured, these occurrences are limited within a
turbulent environment and cannot be maintained for any significant period before perturbations in the
traffic stream initiate flow breakdown.
An analysis of lane utilisation from the traffic counter data shows that the outside lanes carry the
highest volume of traffic during peak periods. This is consistent with recent work on the ‘M50 Demand
Management Report’3. A plot of the outside lane flows for each of the National Roads in the Study
Area for weekday peak hours is presented in Figure 3.7.
2
A Study of Lane Capacity in the Greater Dublin Area, TII, (February, 2012)
http://www.tii.ie/tii-library/strategic-planning/transport-research-and-information-notes(trins)/A-Study-of-Lane-Capacity-in-the-
Greater-Dublin-Area.pdf
3
M50 Demand Management Report, TII (April 2014)
http://TII.ie/policy-publications/strategic-reports/m50-demand-management-rep/
Page 15AECOM - Roughan & O’Donovan Alliance N4-N7 Corridor Study
Final Report
2,200
2,000 Practical Lane capacity 1,700
vph
1,800
1,600
Traffic flow / lane / hour
1,400
1,200
1,000
800
600
400
200
0
N4 EB N4 WB N7 EB N7 WB M50 NB M50 SB
08:00 17:00
Figure 3.7: Average weekday peak traffic flows on outside lane of National Roads in Study Area4
The above graph shows that peak hour lane flows on the M50 are already close to or above the 1,700
vehicles/lane/hour threshold in both the AM and PM peak periods. Lane flows on the N7 also exceed
this threshold while lane flows on the N4 are approaching this threshold.
A comparison of AM peak and Inter peak observed journey times, presented in Table 3.1, shows the
impact that congestion and flow breakdown has on journey times during the AM peak period. A map
showing the locations of the journey time data collection points used in collating this data is shown in
Figure 3.13.
Table 3.1: Comparison of AM peak and Inter peak observed journey times 5
From To Journey Times
Location Location
Ref Ref AM (mins) IP (mins)
13 R148 Palmerstown Bypass east of M50 13.0 5.5
14 R110 Naas Road east of M50 19.8 11.0
1 N4 west of J5
28 M50 south of J11 22.7 11.0
12 M50 north of J7 13.4 5.8
13 R148 Palmerstown Bypass east of M50 19.9 9.8
N7 west of 14 R110 Naas Road east of M50 15.5 5.8
22
J3a 28 M50 south of J11 20.1 8.7
12 M50 north of J7 18.1 9.2
Journey times in the morning peak period are on average 2.2 times longer than those experienced
during the inter peak period which highlights the impact of peak period congestion on the National
Road network in the Study Area.
4
Source: TII TMU Data 2015 for the following locations: M50 TMU M50 020.0N between J7 N4/M50 and J9 N7/M50; N4 TMU
N04 000.0W between J1 N4/M50 and J2 Liffey Valley; N7 TMU N07 000.0W between J01a Newlands Cross and J02
Kingswood.
5
Source: These journey times represent an average of journey time surveys, carried out at OD collection points using a
Bluetooth vehicle tracking system, over the period Tuesday 22nd to Thursday 24th October 2013 inclusive.
Page 16AECOM - Roughan & O’Donovan Alliance N4-N7 Corridor Study
Final Report
3.3 Strategic Travel Patterns
Strategic travel patterns were assessed using the 2013 base year N4/N7 traffic model. The N4/N7
traffic model is a local area model (LAM) which was developed in the software VISUM. The model was
developed using TII’s National Transport Model (NTpM) as its starting point and incorporating refined
details to reflect up to date network conditions including refined road capacity, turn bans, junction
types etc. In order to obtain suitable detail within the LAM, a more detailed zoning system than that
used in the NTpM was developed, with demand updated based on the traffic data collected for the
purposes of this study. Details of the traffic model development can be found in Appendix A (Traffic
Modelling Report).
Using the base year models, a review of strategic patterns of traffic in the study was undertaken using
trip desire line analysis as presented in Figure 3.8.
Figure 3.8: AM Peak strategic desire lines in the Study Area (units: vehicles)
Source: 2013 N4/N7 Model
The desire line graphic above is a schematic plot of traffic demand between key areas of the network
including the N4, N7 and M50 corridors, the city and the main suburban conurbations in the Study
Area of Lucan, Clondalkin and Tallaght.
The desire lines emanating from each of the key locations represent the cumulative demand flows to
and from each of the other key locations in the Study Area. For example the desire lines emanating
from the M50 North location show that the cumulative demand between the M50 North location and
other key locations. It can be seen that there is significant demand between the M50 North and the
M50 South, the N7 West, N4 West, Clondalkin, the City Northwest the City Centre and the City
Southwest.
Page 17AECOM - Roughan & O’Donovan Alliance N4-N7 Corridor Study
Final Report
Inbound trips on the N4 from the west are distributed reasonably evenly between the M50 (northbound
and southbound), the City Centre and the Lucan / Clondalkin area. Similarly trips on the N7 from the
west are split between the M50, the City Centre and the Tallaght / Grange Castle areas. The analysis
shows that there is a high volume of traffic demand from Lucan, Clondalkin and Tallaght to the City
Centre.
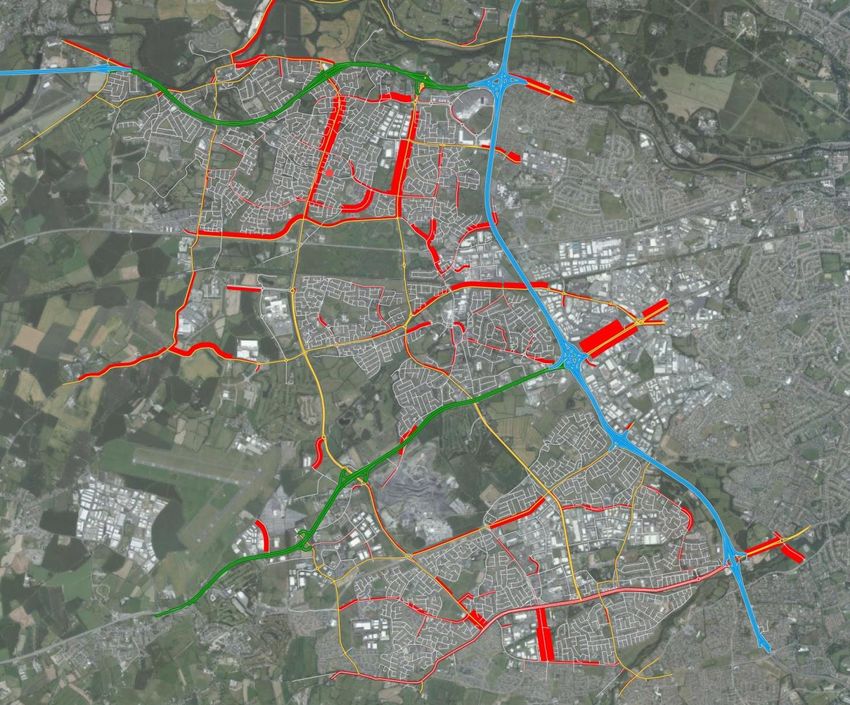
3.4 Local Traffic Patterns
In order to analyse traffic patterns and routing at a more local level, a number of sectors were defined
within the AM base model which represent local urban areas in the Study Area. The desire lines
representing AM peak traffic movements between the local sectors are presented in Figure 3.9.
Figure 3.9: AM peak traffic desire lines between local sectors (units: vehicles)
Source: 2013 N4/N7 Model
In the AM peak, the largest generators of traffic are the Clondalkin, Killinarden, and Citywest /
Jobstown sectors and the largest attractors of traffic are Tallaght West, Grange Castle / Baldonnell
and Killinarden.
The analysis shows a significant number of local trips in the Tallaght area reflecting the higher density
of population and employment in this area. It also shows the links within the wider Lucan area with
strong demand between the Clondalkin, Grange Castle and Neilstown areas. Given the distance
involved there is relatively low demand between the wider areas of Lucan and Tallaght, however
Clondalkin has strong links between both areas, due to its location between them. Whilst not shown in
the above figure, significant localised demand would be expected from areas to the west of the Study
Area to employment centres such as Citywest and Grange Castle. These trips would likely be largely
unaffected by any proposed infrastructure measures within the Study Area.
Page 18AECOM - Roughan & O’Donovan Alliance N4-N7 Corridor Study
Final Report
3.5 Traffic Demand on Local Road Network
Based on the analysis of traffic movements in the Study Area, there is a relatively large demand for
travel between local sectors. AM peak traffic volumes on the regional and local (non-national) road
network as shown in Figure 3.10 with inter peak volumes shown in Figure 3.11.
Figure 3.10: AM peak (08:00 to 09:00) two-way traffic flows on local road network
Source: 2013 N4/N7 model
Page 19AECOM - Roughan & O’Donovan Alliance N4-N7 Corridor Study
Final Report
Figure 3.11: Inter peak (12:00 to 13:00) two-way traffic flows on local road network
Source: 2013 N4/N7 model
Peak traffic volumes on some routes such as Grange Castle Road, Fonthill Road North and Nangor
Road are comparable with those on the N81 National Secondary Road. This demonstrates the
important role these routes play in facilitating local traffic within the Study Area. As a result of these
significant traffic volumes, traffic delay is incurred on the local network in the peak period and a plot of
the modelled delay is shown in Figure 3.12.
Page 20AECOM - Roughan & O’Donovan Alliance N4-N7 Corridor Study
Final Report
N4
R136 Grange R113 Fonthill
Castle Road Road
M50
R134 Nangor
Dublin – Cork Road
Railway Line
N7
N81
R136 Cheeverstown
Road
R113 Old
Bawn Road
Figure 3.12: AM peak (08:00 to 09:00) modelled traffic delay (red bandwidths) on local road network
Source: 2013 N4/N7 Model
The plot shows areas of morning peak delay on Grange Castle Road and Fonthill Road, between the
N4 and the Dublin-Cork railway line. Delays also occur on the Nangor Road in Clondalkin village and
the Naas Road to the east of the M50. Delays on the local network are also evident on the approaches
to the N81 signalised junctions from Cheeverstown Road and Old Bawn Road in Tallaght.
This is also reflected in a comparison of AM peak and Inter peak observed journey times, presented in
Table 3.2. This data was sourced from Bluetooth OD surveys data collected as part of the
development of the 2013 N4/N7 Model. A map showing the locations of the Bluetooth Data collection
points is shown in Figure 3.13.
Page 21AECOM - Roughan & O’Donovan Alliance N4-N7 Corridor Study
Final Report
Table 3.2: Comparison of AM peak and Inter peak observed journey times (2013)
From To Journey Times
Location Location
Ref Ref AM (mins) IP (mins)
9 Grange Castle Road N 19 Grange Castle Road S 14.8 8.1
19 Grange Castle Road S 9 Grange Castle Road N 12.1 7.7
10 Fonthill Road N 23 Katherine Tynan E 13.1 6.8
23 Katherine Tynan E 10 Fonthill Road N 10.1 6.7
Journey times in the morning peak period are on average 1.7 times longer than those in the inter peak
period which confirms the extent of peak period congestion on parts of the local road network within
the Study Area.
Figure 3.13: Bluetooth O-D survey locations for the N4/N7 Study Area
3.6 Local Congestion Issues
The peak hour delays experienced by vehicles described above can be attributed to local congestion
hotspots around the network in the AM peak hour. An analysis of modelled junction capacities
provides a further insight into these problem areas.
The volume-capacity ratio (V/C %) is a common performance indicator that compares junction demand
(vehicle volumes) with junction supply (carrying capacity). It reflects the mobility and quality of travel of
a facility or a section of a facility. A V/C ratio of 90% or greater indicates the junction is operating at a
point near its capacity and has limited ability to cater for any additional traffic volumes. A summary of
the V/C % issues at key junctions in the areas of Lucan, Clondalkin and Tallaght is provided below.
3.6.1 Lucan
A plot of junction V/C% for the Lucan area from the AM peak traffic model is presented in Figure 3.14.
Page 22AECOM - Roughan & O’Donovan Alliance N4-N7 Corridor Study
Final Report
Chapel Hill
R835 Lucan
Road
Lucan
Village
Ballyowen
Road
Liffey
N4
Valley
R113 Fonthill
Road
Grangecastle
Road
R835 Coldcut
Road
R120 M50
Adamstown
Road
R136 Grange
Castle Road
Figure 3.14: Max. Volume/Capacity ratio at key junctions in the Lucan area
The model indicates that vehicle demand through Lucan Village towards the City Centre results in
congestion at the signalised junction of the R835 Lucan Road and R120 Adamstown Road.
Junctions on the R835 Lucan Road between Lucan Village and the N4 at Chapel Hill, the R136
Grange Castle Road and the N4 slip road are also under pressure in the AM peak model.
The northern section of the R136 Grange Castle Road accommodates between 1,600 and 2,000
vehicles (two-way) in the morning peak, predominantly made up of commuters to Dublin (via the N4).
The model indicates that this demand results in congestion at the junctions with Ballyowen Road and
Castle Road, at the northern end of the route.
The northern section of the R113 Fonthill Road also suffers from congestion in the AM peak model,
with junctions operating close to capacity, due to people commuting to Dublin via the N4 and as a
result of vehicles accessing employment areas around Fonthill and Liffey Valley.
Traffic accessing Liffey Valley from the south and traffic from the Neilstown area to the City result in
modelled delays on the R833 Coldcut Road at the traffic signal junctions at Liffey Valley and the
Ballyfermot Road.
3.6.2 Clondalkin
A plot of junction V/C% for the Clondalkin area from the AM peak traffic model is presented in Figure
3.15.
Page 23AECOM - Roughan & O’Donovan Alliance N4-N7 Corridor Study
Final Report
R134
R113 Fonthill Nangor
Road M50
Road
Clondalkin
Village
R136 Grange
Castle Road
R113
Belgard
Road
N7
Figure 3.15: Max volume/capacity ratio at key junctions in the Clondalkin area
Vehicular demand on the R113 Fonthill Road South and the R134 Nangor Road results in congestion
at the two roundabouts to the west of Clondalkin Village.
Page 24AECOM - Roughan & O’Donovan Alliance N4-N7 Corridor Study
Final Report
3.6.3 Tallaght
A plot of junction V/C% for the Tallaght area from the AM peak traffic model is presented in Figure
3.16.
R113 M50
Belgard
Road
R838 Katherine
Tynan Road R819 Greenhills
Road
Glenview
Tallaght
R136
Cheeverstown
Road
R113 Old Bawn
Road
N81
Whitestown
Way
Firhouse Road
West
Figure 3.16: Max. Volume/capacity ratio at key junctions in the Tallaght area
Traffic signal controlled junctions on the N81 at the junctions of the R113 Belgard Road and R113 Old
Bawn Road are at capacity in the AM peak model resulting in congestion on the N81. In addition, high
vehicular demand at the roundabout on the N81 at Glenview, to the west of the M50, also results in
congestion on the N81 in the AM peak model. Delays are also evident on Whitestown Way with
congestion at the N81 and Firhouse Road West junctions due to demand for access to schools and
employment in the area. Given the tidal nature of commuting traffic it is likely that the majority of the
junctions that experience issues in the AM peak experience similar issues in the PM peak also.
3.7 Summary of Existing Situation
In summary, the analysis of the level of delay on the local road network and the ratio of traffic volume
to capacity at key junctions on the network has revealed the following:
The local road network currently experiences delay and capacity issues on the following links:
Grange Castle Road and Fonthill Road, between the N4 and the Dublin-Cork railway line;
Nangor Road in Clondalkin village;
Naas Road to the east of the M50; and
The approaches to the N81 signalised junctions from Cheeverstown Road and Old Bawn
Page 25AECOM - Roughan & O’Donovan Alliance N4-N7 Corridor Study
Final Report
Road in Tallaght.
In terms of junction performance, the network currently experiences issues at the following key
locations:
Junctions on the R835 Lucan Road between the Village and the N4 at Chapel Hill, junctions
along the R136 Grange Castle Road and the N4 slip road;
The northern section of the R113 Fonthill Road;
The R833 Coldcut Road at the traffic signal junctions at Liffey Valley and the Ballyfermot
Road; and
R113 Fonthill Road South and the R134 Nangor Road.
Page 26AECOM - Roughan & O’Donovan Alliance N4-N7 Corridor Study
Final Report
Chapter 4 Future Year Models
This section of the report summarises the development of the future year models, refer to Appendix A
(Traffic Modelling Report) for further detail on model development.
The future models were developed on the basis of a build out of the development areas included in
the South Dublin County Development Plan 2010 to 2016. For the purposes of forecasting background
traffic growth it was agreed between SDCC and TII that 2023 would be taken as the horizon year for
the study.
Initial forecasting was undertaken for two growth scenarios as follows:
TII Central Forecast Growth: TII’s Central Growth forecast is based on the ERSI Medium Term
Review (MTR) and uses an econometric model to distribute county level forecasts across
Electoral Divisions (ED’s) based on historical population, population density, the ED’s
geographic share of the county and an accessibility measure. Details on the process are
contained in the National Transport Model Demographic and Economic Forecasting Report –
September 2014.6
SDCC Forecast Growth Scenario: This forecast was developed by South Dublin County
Council and was based on an extrapolation of the CSO M2F2 forecasts 7 to county level and
the assumption that South Dublin will continue to maintain a 21% population share in the
Dublin region.
A straight line interpolation between known Census 2011 population and employment levels and the
forecast 2030 population and employment levels for both the TII and SDCC forecasts was then
undertaken in order to develop 2023 forecast population and employment forecasts for the Study Area
for both scenarios.
4.1 Comparison of TII and SDCC Forecast Growth Scenarios
Future year demand matrices for 2023 were developed based on the TII and SDCC growth forecasts
and utilising the South Dublin Development Plan zonings.
As described above and in Appendix A (Traffic Modelling Report), an interpolation between the
Census 2011 and the Study Area forecast year 2030 population and employment forecasts datasets
was undertaken in order to develop future year 2023 forecasts. The total population and employment
forecast for the Study Area for 2023 and 2030 in both scenarios are summarised in Tables 4.1 and 4.2
below.
6
www.nra.ie/policy-publications/national-transport-model
7
The CSO have developed six population variants for the period 2016-2046 namely M1F1, M1F2, M2F1, M2F2, M3F1 and
M3F2. A single mortality assumption underlines all these projections. Two variants of the total fertility rate are provided F1 (high)
and F2 (low) while three assumptions of migration are given M1, M2 and M3 (the M2 scenario is given by net migration returning
to positive by 2018 and rising thereafter to +10,000 by 2021). Therefore, the CSO M2F2 scenario describes the medium
migration with low total fertility rate scenario. Further detail is provided in ‘Population and Labour Force Projections 2016 – 2046’
(Central Statistics Office – April, 2013).
Page 27AECOM - Roughan & O’Donovan Alliance N4-N7 Corridor Study
Final Report
Table 4.1: TII Growth Scenario Population & Employment Forecasts
Forecast
Year Percentage Year Percentage
Scenario
Growth Growth
TII Growth 2011 2023 2030
Population 252,009 268,449 +7% 278,039 +10%
Employment 94,161 105,881 +12% 112,718 +20%
Table 4.2: SDCC Growth Scenario Population & Employment Forecasts
Forecast
Year Percentage Year Percentage
Scenario
Growth Growth
SDCC Growth 2011 2023 2030
Population 252,009 279,969 +11% 299,339 +19%
Employment No Data
*Employment 94,161 115,471 +23% 127,902 +36%
* Assumed Growth in Employment Based on Ratio of Population to Job Growth NTpM
Once the above forecast population and employment projections had been developed, the total trip
growth associated with the forecast growth in population and employment in Study Area was then
extracted from the 2030 National Transport Model (NTpM).
A trip rate associated with the anticipated growth in population and employment was then developed
and applied to the 2023 forecast population and employment forecasts to develop 2023 demand
matrices for the AM peak period. Growth between external links, representing ‘through traffic’, was
applied in line with TII forecasts in both the TII and SDCC Growth scenarios. The overall growth in trip
demand for both the TII and SDCC growth scenarios is summarised in Tables 4.3 and 4.4 below.
Table 4.3: TII Growth in AM Peak Hour Trip Demand
Forecast Scenario Year
Percentage Growth
TII Forecast 2013 2023
Cars 65,591 73,670 +12%
HGV 2,044 2,644 +29%
Table 4.4: SDCC Growth in AM Peak Hour Trip Demand
Forecast Scenario Year
Percentage Growth
SDCC 2013 2023
Cars 65,591 74,881 +14%
HGV 2,044 2,661 +30%
4.2 Future Modal Splits
In order to reflect the level of trip demand that would occur in the Study Area for the forecast year of
2023 it was necessary to ascertain the impacts that future changes in public transport provision would
have on the overall level of car based demand in the Study Area.
For this purpose, the NTA provided information on the modal splits for the N4-N7 Study Area based on
their Base Year 2012 and 2035 Do-Minimum Eastern Regional Models.
4.2.1 2035 Do-Minimum Eastern Regional Model
The Do Minimum scenario for the NTA strategy was provided by the NTA using outputs from the ‘Do
Minimum’ model outputs from their Eastern Regional Model, which includes the following schemes:
Page 28AECOM - Roughan & O’Donovan Alliance N4-N7 Corridor Study
Final Report
Major completed transport schemes delivered between 2012-2015;
Luas Cross City;
Phoenix Park Tunnel; and
DART frequency increases on the Northern and South Eastern lines.
Further detail on the schemes included in the NTA’s 2035 Do Minimum Eastern Regional Model
forecasts is provided in the “Transport Modelling Report for the Draft Transport Strategy for the
Greater Dublin Area 2016 to 2035”, National Transport Authority (October 2015).
4.2.2 Application of Mode Share Data to 2023 Forecast Demand
The analysis of the 2035 NTA’s Do Minimum Scenario revealed that all the public transport
improvements proposed in the scenario would be in place by 2023 (which corresponds to the analysis
year for the N4/N7 study).
Whilst the majority of the public transport interventions included in the scenario occur outside the
N4/N7 Study Area, any mode share impacts generated by the implementation of the schemes were
required to be reflected in the 2023 demand matrices for the N4/N7 Study. An exercise was therefore
undertaken to reflect the reduction in car trip demand associated with the implementation of the public
transport interventions on the level of demand in the 2023 demand matrices. Table 4.5 below
summarises the reduction in car trip demand in the 2023 AM peak across the Study Area as a result of
the increased public transport provision.
Table 4.5: Impact of committed public transport proposals on AM Peak Hour Car Trip Demand
Percentage Reduction
TII Forecast 2023 2023 with PT
in Demand
Cars 73,670 71,597 -3%
Percentage Reduction
SDCC Forecast 2023 2023 with PT
in Demand
Cars 74,881 72,751 -3%
4.2.3 Final Demand Matrices
The final demand matrices used as part of the study needed to provide a robust appraisal of all
scheme options. Given the SDCC forecasts were slightly higher than the TII forecasts, in order to
conduct a robust assessment it was decided that the levels of future population and employment
forecast by SDCC should be brought forward for scenario testing along with the NTA mode share
impacts. Table 4.6 below outlines the trip demand matrix totals for the Study Area for the AM peak
period.
Table 4.6: 2023 AM Peak Trip Demand Matrix Totals
SDCC Forecast 2013 2023 %
Cars 65,591 72,751 +11%
HGV 2,044 2,661 +30%
4.3 Future Committed Schemes within the Study Area
As outlined in 4.2.1 above, the NTA’s Do Minimum scenario includes three major public transport
schemes which affect the study, namely Luas Cross City, the Phoenix Park Tunnel re-opening and the
City Centre re-signalling project.
In addition to these public transport schemes, the 2023 Do-Minimum model contains a number of road
Page 29AECOM - Roughan & O’Donovan Alliance N4-N7 Corridor Study
Final Report
schemes that were either completed post development of the 2013 base year models or are
committed to begin construction in 2016 as outlined below:
Newlands Cross Upgrade;
Adamstown Road Improvement; and
Nangor Road Improvement.
The Newlands Cross Upgrade comprises a flyover at the junction between N7 Naas Road and the
R113 Fonthill/Belgard Roads at Newlands Cross. The flyover turns this junction into a free-flow
junction for N7 mainline traffic. This project was completed in 2015. The base year model was
developed in 2013 prior to the opening of the Newlands Cross Upgrade, the impacts of Newlands
Cross Upgrade have been included within the 2023 Do-Minimum model and validated against
recorded 2015 traffic behaviours.
The Nangor Road Improvement and the Adamstown Road Improvement scheme are local road
schemes that will improve access to the Grange Castle Business Park.
A map showing the location of the committed public transport schemes and road schemes whose
impacts are incorporated in the 2023 Do Minimum models is detailed in Figure 4.1 below.
Figure 4.1: Committed Schemes – 2023 Do Minimum Model
Page 30You can also read