NHSScotland Workforce - Latest statistics at 31 March 2018 Publication date 5 June 2018 - ISD Scotland
←
→
Page content transcription
If your browser does not render page correctly, please read the page content below

Information Services Division

             NHSScotland Workforce
             Latest statistics at 31 March 2018

                                                  Publication date
                                                  5 June 2018

                                A National Statistics publication for Scotland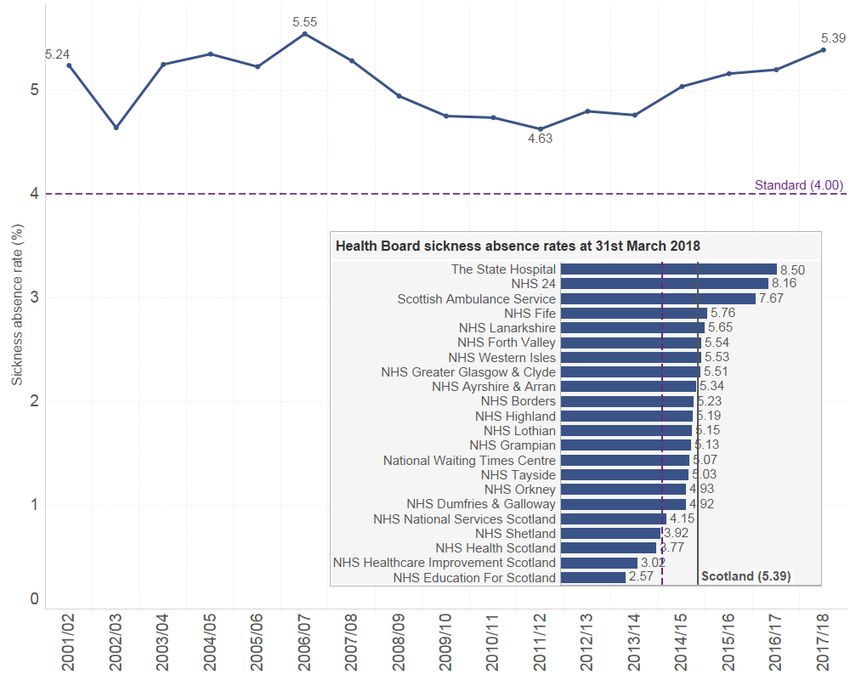
Information Services Division

This is a National Statistics Publication

National Statistics status means that the official statistics meet the highest standards of
trustworthiness, quality and public value. They are identified by the quality mark shown
above.

They comply with the Code of Practice for statistics and are awarded National Statistics
status following an assessment by the UK Statistics Authority’s regulatory arm. The
Authority considers whether the statistics meet the highest standards of Code compliance,
including the value they add to public decisions and debate.

Find out more about the Code of Practice at:
https://www.statisticsauthority.gov.uk/osr/code-of-practice/

Find out more about National Statistics at:
https://www.statisticsauthority.gov.uk/national-statistician/types-of-official-statistics/

                                                 1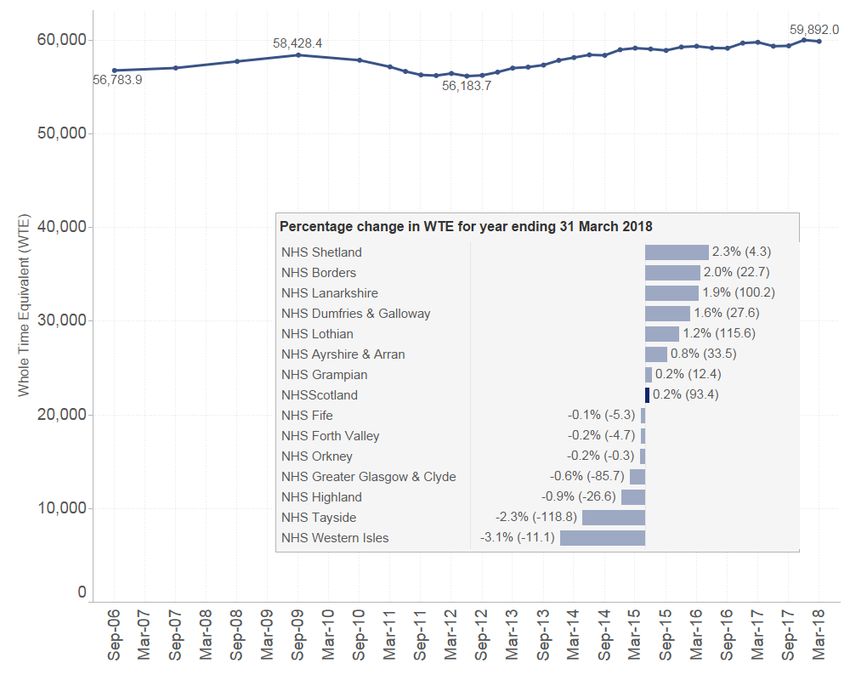
Information Services Division

Contents

Introduction ............................................................................................................................4
Main Points ............................................................................................................................8
1.      Overall Staff in Post ........................................................................................................9
     1.1     Summary ..................................................................................................................9
     1.2     Trend ........................................................................................................................9
     1.3     Net turnover ............................................................................................................ 11
     1.4     Sickness absence ................................................................................................... 13
     1.5     Staff groups ............................................................................................................ 15
2.      Medical and Dental staff ............................................................................................... 17
     2.1 Summary ................................................................................................................ 17
     2.2 Staff in post ............................................................................................................. 18
     2.3 Net turnover ............................................................................................................ 18
     2.4 Consultants ............................................................................................................. 20
       2.4.1 Staff in post ...................................................................................................... 21
        2.4.2      Consultant vacancies ....................................................................................... 23
     2.5     Doctors and dentists in training ............................................................................... 26
     2.6     Medical agency locum spend .................................................................................. 28
3.      Nursing & Midwifery staff .............................................................................................. 30
     3.1     Summary ................................................................................................................ 30
     3.2     Staff in post ............................................................................................................. 31
     3.3     Net turnover ............................................................................................................ 33
     3.4     Nursing and midwifery vacancies............................................................................ 34
     3.5     Health visitors ......................................................................................................... 38
     3.6     Nursing and midwifery bank and agency staff ........................................................ 39
4.      Allied Health Professions .............................................................................................. 41
     4.1     Summary ................................................................................................................ 41
     4.2     Staff in post ............................................................................................................. 41
     4.3     Net turnover ............................................................................................................ 44
     4.4     AHP vacancies........................................................................................................ 45
5.      In focus: Workforce characteristics ............................................................................... 49
     5.1     Age ......................................................................................................................... 49
     5.2     Contract type and gender ....................................................................................... 52
     5.3     Equality and diversity .............................................................................................. 55
Glossary ............................................................................................................................... 57

                                                                     2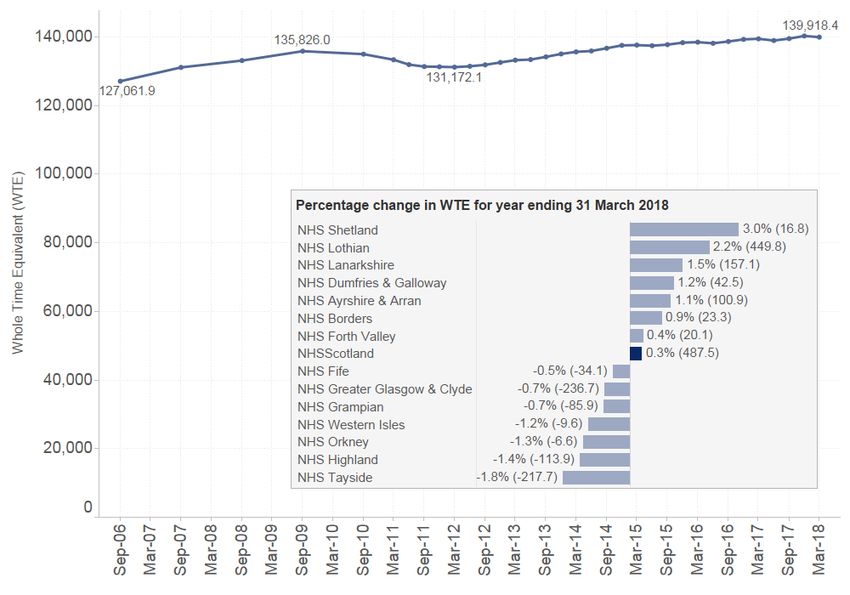
Information Services Division

List of Dashboards ............................................................................................................... 60
List of Tables........................................................................................................................ 60
Contact................................................................................................................................. 61
Further Information .............................................................................................................. 61
Rate this publication ............................................................................................................. 61
Appendices .......................................................................................................................... 62
   Appendix 1 – Background information .............................................................................. 62
   Appendix 2 – Publication Metadata .................................................................................. 66
   Appendix 3 – Early access details .................................................................................... 69
   Appendix 4 – ISD and Official Statistics ........................................................................... 70

                                                                    3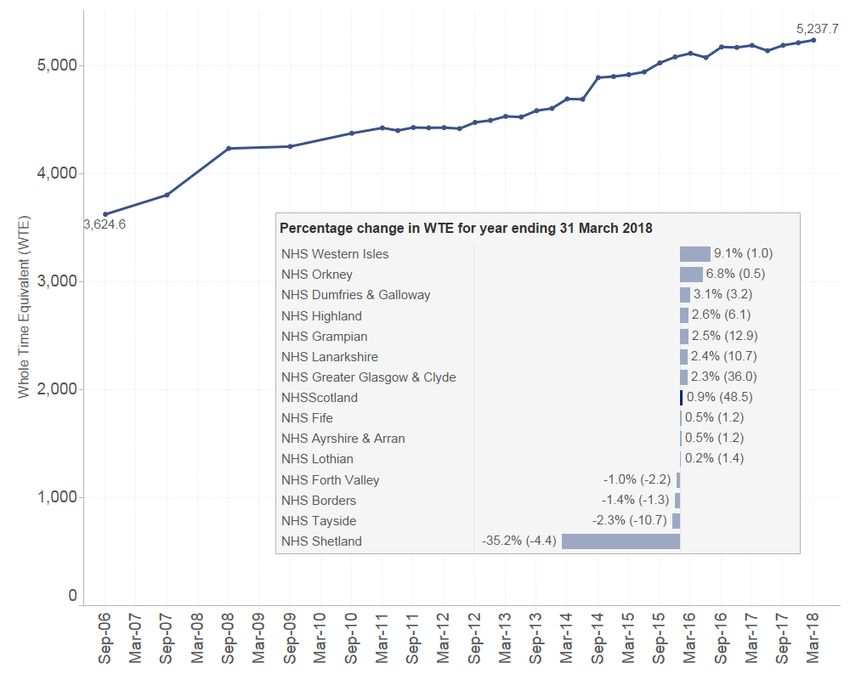
Information Services Division
Introduction
The NHSScotland workforce has a significant role to play in the delivery of quality services
that meet the needs of patients, their families and the general public in a modern health
service. Throughout the year, the Information Services Division (ISD) within National
Services Scotland publishes quarterly updates on an extensive set of indicators, including
staff in post and vacancies which supports NHS Boards and the Scottish Government with
local, regional and national workforce planning.
The primary source of information on staff employed by NHSScotland is the Scottish
Workforce Information Standard System (SWISS) which brings together HR and Payroll
information. In addition to this, ISD collects a range of information directly from NHS Boards.
This new annual report reflects on the latest statistics at 31 March 2018 for the overall
NHSScotland workforce and proceeds to focus on key clinical staff including consultants,
doctors and dentists in training, qualified nurses and midwives and allied health professions
(AHPs). Having discussed staff in post and vacancies across the aforementioned staff
groups, the report concludes with a look at the underlying characteristics of the workforce
including age, contract type and gender.
Please note, the data presented within the report, dashboards and tables incorporates all
staff employed directly by NHS Boards and excludes those working as independent
contractors, such as locums, general medical practitioners (GPs) and general dental
practitioners (GDPs).
Following a consultation on proposed changes to modernise the presentation, improve the
usability and enhance the accessibility of NHSScotland workforce statistics, this release
marks a gradual shift in how workforce statistics are presented. The purpose of this new
annual report is to highlight national trends that can be explored further via dynamic
dashboards.
In conjunction with this report, comprehensive workforce data at 31 March 2018 is shared
across the following outputs:
Dashboards
Four dashboards (Overall, Medical and Dental, Nursing and Midwifery and AHPs)
replace 10 historic Excel tables. The dashboards present quarterly data over a 5 year
trend for all staff in post.
The reformed output presents indicators such as age, contract type and gender, Agenda
for Change (AfC) band, grade and specialty where applicable. All of which are available
as chart visuals or tables. Via the ISD Workforce website, users can explore the
4
Information Services Division
dashboards to quickly gauge shifts in trends and draw comparisons across NHS Boards
and regions.
The three associated dashboards also include vacancy numbers and rates for
consultants, nursing and midwifery and AHPs.
Open data
Aggregated data underlying the dashboards for 31 March 2018 is available as five CSV
files to meet the 3* criteria for ‘open data’, meaning staff in post and vacancy data is
available in a structured, machine-readable, non-proprietary format to support individual
analytical needs. Files are stored in the NHSScotland Open Data platform.
Subsequent updates will be released quarterly for the latest census.
Data tables
Supplementary long term trend data for staff in post and vacancies continues to be
available via Excel.
Quarterly updates to a collection of other staff in post tables including Healthcare
Science. See the list of tables for the full breadth of information.
Biannual update on Number of NHS dentists split by age, gender and Scottish Index of
Multiple Deprivation.
Annual updates on:
Net turnover, joiners and leavers by job family.
Bank and agency usage for nursing and midwifery staff
Sickness absence rates.
Equality and diversity information including religion, ethnic group, sexual orientation,
transgender status and disability status.
The first release of Medical agency locum spend, presented as experimental statistics.
Due to varying sources and frequency of bespoke data collections, not all published
tables are updated at this time of year. Please see the timetable on the ISD Workforce
website for further detail on quarterly releases.
As the shape of the workforce continues to evolve and the need for timely and detailed
information increases, ISD is committed to continue improving national workforce
information along with our key stakeholders in order to support local, regional and national
5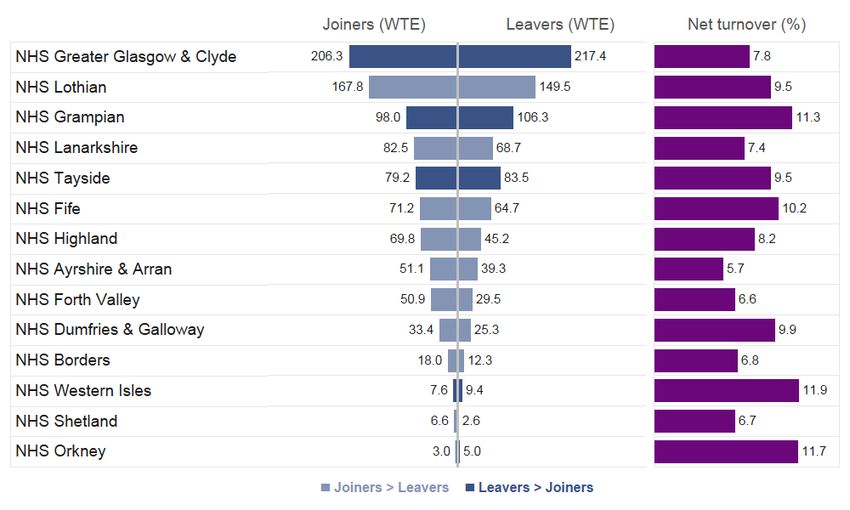
Information Services Division
workforce planning. Appendix 1 references the latest Scottish Government policy on
workforce planning and the importance of National Statistics.
Going forward:
Data will continue to be released quarterly, supplemented by a brief summary report.
Commencing with this release, an improved annual report will be published every June.
The final detailed quarterly report was published on 6 March 2018.
Subject to feasibility and further user engagement, the remaining Excel tables (e.g. net
turnover and sickness absence) will be gradually replaced by dashboards over the
course of 2018/19.
The design, functionality and content of the dashboards will continue to evolve in line
with user requirements and advancing software. Furthermore, improvements to the ISD
website are in the pipeline which will help provide the optimal platform for data
visualisation, prioritise user navigation and ensure compatibility with smart devices.
As a recognised producer of Official Statistics in Scotland, ISD works to the Code of
Practice for Official Statistics which is maintained by the UK Statistics Authority (UKSA). Our
Official Statistics publications are regularly assessed by the UK Statistics Authority and are
designated to have complied with the Code of Practice. UKSA assessment reports on ISD
publications are available on their website. We pride ourselves in meeting our obligations
under the code for objectivity, integrity and transparency. If you wish to discuss any of the
new content or proposed developments further, you are welcome to contact Stuart Kerr,
Principal Information Analyst, on 0131 275 6363 or email stuartkerr2@nhs.net.
R – This publication includes a revision of December 2017 consultant vacancy data. NHS
Dumfries & Galloway made a resubmission due to errors identified in Old age psychiatry
and Oral & maxillofacial surgery (both vacant six months or more). The figures for
establishment and total vacancies for NHS Dumfries & Galloway, West Region and
Scotland figures have been amended accordingly. All other regions and boards are
unaffected. Previously published figures can be found at
Consultant_Vacancies_D2017.xls
R This publication also includes a revision of the March, June, September and December
2017 nursing & midwifery vacancy data. NHS Grampian made a resubmission due to errors
identified in their Other, AfC bands 5 to 9. 1 WTE position vacant since February 2017 had
not been recorded. Changes to March, June, September and December 2017, for the
appropriate vacancy length, have now been made. NHS Lanarkshire made a resubmission
for December 2017 due to errors identified in their community, district nursing vacant less
6
Information Services Division

than 3 months. Changes to December 2017, for both AfC bands 1 to 4 and AfC bands 5 to
9, have now been made. The figures for establishment and total vacancies for NHS
Grampian and NHS Lanarkshire have been amended accordingly. North Region, West
Region and Scotland figures have also been updated. All other regions and boards are
unaffected. Previously published figures can be found at
Nursing_and_Midwifery_Vacancies_D2017.xls

R This publication also includes a revision of the nursing and midwifery vacancy data prior
to December 2014. Due to a processing error the totals for Nursing for all quarters prior to
December 2014 were reported inaccurately across all measures. This has now been
amended. Figures for overall Nursing and Midwifery totals, as well as Midwifery totals are
unaffected. Previously published figures can be found at Non-Medical_Trend_D2017.xls

                                              7
Information Services Division
Main Points
The 163,061 staff employed by NHSScotland represents an increase of 0.3% over the
last year. The WTE, which adjusts for part time working, has risen by the same rate to
139,918.4. Whilst there has been six consecutive years of annual growth, the rate of
growth is slowing.
Net turnover was 6.6% in 2017/18, an increase from 6.3% in the previous year. The total
number of staff joining NHSScotland in the past year has remained steady whereas the
total number of leavers has risen. This has contributed to the slowdown in growth.
7.5% (422.5 WTE) of medical and dental consultant posts were vacant. Whilst the
vacancy rate is the same as that a year ago, the number of posts vacant for six months
or more has seen a 23.6% (48.6 WTE) increase to 253.9 WTE.
2,812.7 WTE of nursing and midwifery posts were vacant. This represents an annual
decrease of 0.3% (7.2 WTE) but the vacancy rate is unchanged at 4.5%. Of these
vacancies, 852.5 WTE were vacant for more than three months, a 27.1% (181.9 WTE)
increase on last year.
NHSScotland spent £23.6 million on nursing and midwifery agency staff during the last
financial year. This represents a decrease of 3.6% in comparison to 2016/17. Total
spend on bank staff increased by 7.1% to £152.1 million.
Sickness absence rate for NHSScotland in 2017/18 was 5.39%, up from 5.20% in the
previous year and marking the fourth consecutive annual increase. The current national
target of 4% has fluctuated between a high of 5.55% in 2006/07 to a low of 4.63% in
2011/12 and therefore the standard has yet to be achieved at the national level.
The median age of the national workforce has increased from 43 to 46 between 30
September 2008 and 31 March 2018. The proportion of staff aged 50 and over has
increased from 29.0% to 39.0% over the same period.
8
Information Services Division

1. Overall Staff in Post
This section provides a summary of all staff directly employed by NHSScotland as at 31
March 2018 and illustrates how the workforce has changed over time. Workforce statistics
are routinely reported as headcount and whole time equivalent (WTE), which adjusts the
figure to take account of part time working. Please note that the majority of the figures
quoted in this report will be WTE.

1.1    Summary

Notes:
1. Figures are as at 31 March 2018 unless otherwise specified.

A breakdown of the workforce by staff group, age, contract type and gender for each NHS
Board is available within the Overall dashboard on the ISD Workforce website.

Further data, including sickness absence and turnover that is yet to be transformed into
dashboards, is available via the Data Tables section of the website.

1.2    Trend
At 31 March 2018, NHSScotland reported a total headcount of 163,061 representing 0.3%
in the last year. Adjusting for part time working, the WTE has also risen by 0.3% to
139,918.4 WTE.

                                                    9
Information Services Division
The trend in overall staff numbers (WTE) within NHSScotland is illustrated in Figure 1
below. It outlines growth in the overall workforce between 2007 and 2009, a reduction
between 2009 and 2011 during the economic downturn and then a return to growth from
then until the present year. The inset chart displays the percentage and WTE change in the
overall workforce by territorial Board in the year to 31 March 2018.
Figure 1: NHSScotland Total Workforce Trend 1,2
Notes:
1. Workforce data was published annually until September 2010 and then quarterly from March 2011
onwards.
2. Information for the Special Health Boards is available in the overall dashboard.
It should be noted that March is not necessarily the highest (or lowest) point for the year in
terms of the total number of staff. There are various factors which have an effect on the
workforce numbers at different times throughout the year such as the availability of newly
qualified graduates and retirement of staff. To date, the highest workforce figure was the
140,261.9 WTE (163,446 headcount) recorded at 31 December 2017.
There is some seasonal variation present in the quarterly census data with staff numbers
tending to drop in June before returning to the longer term upward trend in September. Note
that this seasonal variation described is particularly evident when viewing trends for the
10Information Services Division
number of staff employed by the larger Health Boards where there are larger numbers of
staff in training.
Although the overall trend shows that the workforce continues to increase gradually, the
annual rate of growth has slowed in recent years as outlined in Figure 2 below.
Figure 2: Trend in annual rate of change in the NHSScotland workforce 1
Notes:
1. Workforce data was published annually until September 2010 and then quarterly from March 2011
onwards.
Information on the overall staff in post covering the last five years is available within the
Overall dashboard on the ISD Workforce website.
Additional information on long term trends (> 5 years) within each NHS Board is available
within the Overall trend table in the Data Tables section of the website.
1.3 Net turnover
Net turnover is the rate at which employees leave the workforce and is calculated by
dividing the net number of leavers over a financial year by the number of staff in post at the
start of that year.
For NHSScotland turnover:
Leavers are defined as staff employed within NHSScotland at the beginning of the
financial year but no longer employed within NHSScotland at the end of the financial
11Information Services Division
year. Note that those who have left and then rejoined NHSScotland within the year are
not counted as leavers.
Joiners are defined as staff that were not employed within NHSScotland at the beginning
of the financial year but were employed within NHSScotland at the end of the financial
year.
As illustrated in Figure 3, NHSScotland turnover has been increasing in recent years with
only a slight drop in 2016/17. It also shows that the total number of joiners has remained
steady whereas the total number of leavers has risen. This has contributed to the slowdown
in growth that was identified in Figure 2 above.
Figure 3: NHSScotland Net Joiners, Leavers and Turnover Trend 1,2
Notes:
1. Excludes HCHS medical and dental training grades. This is to avoid the distortion caused by the frequent
rotation of staff in training placements.
2. NHSScotland joiners and leavers do not include staff changing roles or moving between NHS Boards.
Figure 4 shows the number of joiners, leavers and net turnover of staff by NHS Board
during financial year 2017/18. Please note a subtle difference in calculation when
comparing turnover for NHSScotland with turnover at Board level.
For Board level turnover:
Leavers are defined as those employed within a Board at the start of the financial year
but are either employed within another NHS Board or no longer employed within
NHSScotland at the end of the financial year
12Information Services Division
Consequently, with a higher proportion of leavers involved, turnover rates at Board level are
consistently higher than the rate for NHSScotland.
Figure 4: Net Joiners, Leavers and Turnover, overall staff, by territorial Board,
2017/18 1,2,3
Notes:
1. Excludes HCHS medical and dental training grades. This is to avoid the distortion caused by the frequent
rotation of staff in training placements.
2. Joiners and leavers do not include staff changing roles within an NHS Board.
3. Information for the Special Health Boards is available in the Turnover table.
Further information on net joiners, leavers and turnover for each NHS Board by staff group
is available within the Turnover table in the Data Tables section of the ISD Workforce
website.
Further information on the turnover methodology is available in Appendix 1.
1.4 Sickness absence
Sickness absence in NHSScotland can result in cancelled appointments and procedures. It
can also lead to increased pressure on staff and patients, increased costs of employing
bank and agency staff, and reduced efficiency. To help monitor and manage these risks, the
Scottish Government introduced a national standard which requires NHS Boards to achieve
a sickness absence rate of 4% or lower.
13Information Services Division
The sickness absence rate for NHSScotland in 2017/18 was 5.39%, a slight increase from
5.20% in the previous year. Figure 5 shows that the national rate has fluctuated between a
high of 5.55% in 2006/07 to a low of 4.63% in 2011/12 and therefore the standard has yet to
be achieved at the national level. The inset chart in Figure 5 displays the sickness absence
rates at Board level for 2017/18 and shows that only one territorial Board achieved the
standard in this financial year with the majority reporting sickness absence rates above 5%.
1
Figure 5: Trend of sickness absence rate for NHSScotland by financial year
Notes:
1. Sickness absence rate is hours lost divided by total contracted hours.
Information on sickness absence trends for each NHS Board is available within the
Sickness absence table in the Data Tables section of the ISD Workforce website.
14Information Services Division
1.5 Staff groups
Further information on the change in workforce by staff group is presented in Table 1 below.
Over the last year, the greatest proportionate growth has been reported in the personal and
social care and other therapeutic services staff groups. The greatest increase in WTE
occurred in Medical (HCHS) with an annual increase of 191.2 WTE.
Table 1: NHSScotland Workforce Trend (WTE) by Staff Group
% change % change
Mar-17 to Mar-13 to
Staff Group 1 Mar-13 Mar-17 Mar-18
Mar-18 Mar-18
All NHSScotland staff 133,205.3 139,430.9 139,918.4 0.3% 5.0%
Medical (HCHS) 2 11,224.0 12,325.9 12,517.1 1.6% 11.5%
Dental (HCHS) 2 701.8 625.2 590.6 -5.5% -15.8%
Medical and dental 1,869.8 1,951.2 1,958.2 0.4% 4.7%
support and midwifery
Nursing 57,036.6 59,798.6 59,892.0 0.2% 5.0%
Allied health professions 3 9,583.4 11,551.5 11,653.1 0.9% 21.6%
Other therapeutic services 3,651.2 4,267.9 4,458.0 4.5% 22.1%
Personal and social care 906.3 1,170.2 1,231.9 5.3% 35.9%
Healthcare science 5,273.5 5,492.4 5,423.7 -1.3% 2.8%
Ambulance services 3 3,670.1 2,562.7 2,586.7 0.9% -29.5%
Administrative services 24,381.9 25,211.4 25,258.1 0.2% 3.6%
Support services 13,755.9 13,717.3 13,749.4 0.2% 0.0%
Unallocated / not known 4 1,150.7 756.6 599.6 -20.8% -47.9%
Notes:
1. A list of the sub job families within each staff group can be found in the FAQ section of the ISD
Workforce website.
2. HCHS - hospital, community, and public health services (excluding independent contractors)
3. Paramedics were reclassified from ambulance services staff to AHPs from 1 April 2013.
4. NHS Highland and Highland Council are currently developing an integrated model for health and social
care. Staff involved in the delivery of core integrated services started to transfer from Highland Council to
NHS Highland in June 2012. Staff that have transferred into NHS Highland but have not yet been
assimilated to Agenda for Change bands are currently recorded as unallocated / not known.
In contrast to the overall growth in workforce, there is a noticeable drop in Dental (HCHS)
staff. While the total number of adults and children registered with a NHS dentist in Scotland
continues to increase, the small proportion attributed to Public Dental Service (PDS) -
dentists that are either directly employed by Boards or community dentists who provide
services in areas where a safety net is required for people unable to obtain care from ‘High
15Information Services Division
Street’ dentists – has decreased in recent times. This in part explains the decrease in
Dental (HCHS) staff.
Further information about the overall dental workforce, including those not directly employed
by NHSScotland, can be found in the Dentists table on the ISD Workforce website.
Figure 6 outlines the current shape of the NHSScotland workforce. The largest staff group is
nursing and midwifery which represents 42.8% of all NHSScotland staff.
Figure 6: NHSScotland Workforce proportions (% of WTE), by staff group, as at 31
March 2018 1,2
Notes:
1. A list of the sub job families within each staff group can be found in the FAQ section of the ISD
Workforce website.
2. HCHS - hospital, community, and public health services (excluding independent contractors)
16Information Services Division
2. Medical and Dental staff
As outlined in Figure 6, medical and dental (HCHS) staff (combined) accounted for 9.4% of
the NHSScotland workforce as at 31 March 2018. This staff group includes all salaried
doctors and dentists, including those in all stages of training but excludes GPs, GDPs and
staff working as locums.
2.1 Summary
Notes:
1. Figures are as at 31 March 2018 unless otherwise specified.
2. The net turnover rate excludes HCHS medical and dental training grades. This is to avoid the distortion
caused by the frequent rotation of staff in training placements.
A breakdown of the workforce by grade, age, contract type, gender and consultant
vacancies for each NHS Board is available within the Medical & Dental dashboard on the
ISD Workforce website.
Further information about longer term trends (>5 years) and medical and dental support
staff is available in the Medical Trend and Medical and Dental staff in post tables in the
Data Tables section of the website.
17Information Services Division
2.2 Staff in post
Table 2 presents the change in the medical and dental workforce over a one year and a five
year period. The latest figures show that there has been an increase of 1.2% over the last
year and an increase of 9.9% over the last 5 years. Further information by grade is
presented below.
Table 2: NHSScotland Medical and Dental Staff in Post (WTE)
% change % change
Mar-17 to Mar-13 to
Mar-13 Mar-17 Mar-18 Mar-18 Mar-18
HCHS medical and dental staff 1 11,925.9 12,951.1 13,107.7 1.2% 9.9%
Consultant 4,531.6 5,189.2 5,237.7 0.9% 15.6%
Director (Clinical, Medical & Dental) 2 82.1 126.5 143.2 13.2% 74.4%
Staff and associate specialist grades 1,360.2 1,208.7 1,202.0 -0.6% -11.6%
Doctors in training 5,552.5 5,677.3 5,760.1 1.5% 3.7%
Other grades 3 399.4 749.3 764.7 2.1% 91.4%
Notes:
1. Information on the grades included within each group can be found in the Variables guide which is
available via the FAQ section of the ISD Workforce website.
2. The increase in the number of directors (clinical, medical & dental) is due to previous under reporting from
NHS Lothian.
3. The increase in the number of other grades is mainly due to NHS Greater Glasgow & Clyde filling general
practice specialty training posts with clinical fellows rather than locum appointments for training as they
did previously. Also the National Waiting Times Centre previously recorded clinical fellows as doctors in
training but they are now recorded as other grades.
2.3 Net turnover
As illustrated in Figure 7 below, the net turnover rate for medical and dental staff in
NHSScotland has been increasing in recent years due to a rise in the number of leavers
from a previously stable level. Please note that this analysis does not include doctors and
dentists in training who are excluded due to the frequent rotation of staff in training
placements.
18Information Services Division
Figure 7: Net Joiners, Leavers and Turnover Trend for Medical and Dental staff;
NHSScotland 1,2
Notes:
1. Excludes HCHS medical and dental training grades. This is to avoid the distortion caused by the frequent
rotation of staff in training placements.
2. NHSScotland joiners and leavers do not include staff changing roles or moving between NHS Boards.
Figure 8 shows the number of joiners, leavers and net turnover of staff by NHS Board
during financial year 2017/18. As outlined in section 1.3 earlier there is a subtle difference
in the calculation used to calculate Board level turnover which leads to consistently higher
turnover rates than for NHSScotland. Further information on the turnover methodology is
available in Appendix 1.
19Information Services Division
Figure 8: Net Joiners, Leavers and Turnover, Medical and Dental staff, by territorial
Board, 2017/18 1,2,3
Notes:
1. Excludes HCHS medical and dental training grades. This is to avoid the distortion caused by the frequent
rotation of staff in training placements.
2. Joiners and leavers do not include staff changing roles within an NHS Board.
3. Information for the Special Health Boards is available in the Turnover table.
Information on net joiners, leavers and turnover for each NHS Board by staff group is
available within the Turnover table in the Data Tables section of the ISD Workforce
website.
2.4 Consultants
Consultants account for 40% of the medical and dental workforce, a proportion that has
increased by around 2% in the last five years. The consultant role is a senior, specialist
position which involves leading a multidisciplinary team of doctors, nurses and other health
professionals and taking on ultimate responsibility for the safe and effective care of all
patients that are referred to them.
20Information Services Division
2.4.1 Staff in post
Table 3 provides a breakdown by major specialty group and shows there has been a 0.9%
annual increase with growth in all groups apart from clinical laboratory specialties,
psychiatric specialties, other medical specialties and all dental specialties.
Table 3: NHSScotland Consultants1 in Post (WTE) by Specialty Groups2
% change % change
Mar-17 to Mar-13 to
Mar-13 Mar-17 Mar-18
Mar-18 Mar-18
All specialties 4,531.6 5,189.2 5,237.7 0.9% 15.6%
Emergency medicine 149.0 220.6 227.4 3.1% 52.6%
Anaesthetics 644.2 739.8 756.8 2.3% 17.5%
Obstetrics and gynaecology 215.8 244.2 248.6 1.8% 15.2%
Clinical laboratory specialties 563.1 633.3 621.9 -1.8% 10.4%
Medical specialties 1003.9 1266.7 1293.4 2.1% 28.8%
Psychiatric specialties 532.2 544.6 536.9 -1.4% 0.9%
Surgical specialties 836.1 965.3 974.9 1.0% 16.6%
Paediatrics specialties 227.0 293.8 331.0 12.7% 45.8%
Other medical specialties 255.5 185.1 156.1 -15.7% -38.9%
All dental specialties 105.0 95.8 90.5 -5.5% -13.7%
Notes:
1. Includes directors of public health
2. A list of specialties within each specialty group can be found in the FAQ section of the ISD Workforce
website.
Figure 9 shows the trend in the number of consultants employed by NHSScotland since
2006 and indicates a reported high at the latest census date. It is notable that, overall, the
trend shows steady and continuous growth, even through the economic downturn which led
to a reduction in the number of overall staff as outlined in Figure 1 earlier. The inset chart
displays the percentage and WTE change in the consultant workforce by territorial Board in
the year to 31 March 2018.
21Information Services Division
Figure 9: NHSScotland Medical and Dental Consultants Trend 1,2,3,4
Notes:
1. Includes Directors of Public Health.
2. Data capture and reporting of medical and dental staff by grade has improved over time. While this results
in more robust information, caution should be taken when considering long term trends. Specifically, the
number of consultants recorded increased noticeably in 2008 and 2014. This relates to migration of
source data in 2008 and improved quality assurance following on from the introduction of a new HR
system in 2014.
3. Workforce data was published annually until September 2010 and then quarterly from March 2011
onwards.
4. Information for the Special Health Boards is available in the medical and dental dashboard.
There is also a seasonal trend in the consultant numbers in that there is often a small
decrease between the April and June censuses. A major factor in this seasonality is an
increase in retirements in the months leading up to and around the end of a financial year
and then a delay in the vacated posts being filled whilst Boards wait to recruit those
obtaining their Certificate of Completion of Training (CCT) over the summer months.
22Information Services Division
Information on the trends (>5 years) within each NHS Board in respect of the number of
consultants within each specialty is available within the Medical trend table in the Data
Tables section of the ISD Workforce website.
2.4.2 Consultant vacancies
Table 4 provides a summary of the number and rate of consultant vacancies and shows
that, while the overall vacancy rate is the same as the previous year, a greater proportion of
the vacancies are longer term (vacant for 6 months or more).
Table 4: NHSScotland Consultant1 Vacancies (WTE)
% change % change
Mar-17 to Mar-13 to
Mar-13 Mar-17 Mar-18 Mar-18 Mar-18
Total vacancies2 202.5 418.7 422.5 0.9% 108.7%
Vacant 6 months or more 41.0 205.3 253.9 23.6% 519.1%
Total vacancy rate3 4.3% 7.5% 7.5%
Notes:
1. Includes directors of public health.
2. Vacancies are counted as posts that have been cleared for advert after being through the redeployment
process (internal or external advert) and remain as a vacancy until an individual starts in the post. A post
marked as a vacancy may still be occupied by the previous incumbent and so also included within the
staff in post figure. Therefore the denominator may include double counting.
3. The denominator used to calculate the vacancy rate is the sum of the total staff in post and total
vacancies.
It should be noted that there is variation in the number of vacancies throughout the year.
Figure 10 outlines the trend for the consultant vacancy rates recorded at each census since
30 September 2007, distinguishing between the proportion of posts that were vacant less
than six months and those vacant six months or more. Following a relatively low rate of
vacancies reported from 2008 to 2013, the overall vacancy rate has remained consistently
above 6% since March 2014, peaking at 8.5% at 30 June 2017. However the proportion of
posts that were vacant for six months or more has increased since then and now accounts
for over half of the total vacancies
23Information Services Division
Figure 10: Consultant Vacancy Rates by Length of Vacancy 1
Notes:
1. Workforce data was published annually until September 2010 and then quarterly from March 2011
onwards.
The consultant vacancy rates show the reverse seasonal trend when compared to the
consultant staff in post figures. In Figure 10 above it can be seen that, within each year, the
highest vacancy rates are normally reported in June whereas this same month generally
marks the point where the staff in post figures decrease as outlined in section 2.4.1 earlier.
Figure 11 details the consultant vacancy rates by NHS Board and by length of vacancy.
24Information Services Division
Figure 11: Consultant Vacancy Rates by NHS Board by length of vacancy as at 31
March 2018 1
Notes:
1. NHS Orkney, NHS24, NHS Education for Scotland, NHS Healthcare Improvement Scotland, Scottish
Ambulance Service and the State Hospital do not have any consultant vacancies and are therefore not
shown in the chart.
The highest vacancy rates are generally in Boards with more of a rural profile whereas
Boards that incorporate (or are in close proximity to) medical and dental training schools
generally have the lowest vacancy rates. Prospective medical and dental students from
rural locations move to Scotland’s major cities in order to undertake their training at
university. Once there they are more likely to stay for their professional training. There is an
ongoing challenge for Boards with a more rural profile to attract them back home once they
are qualified.
One such Board is NHS Dumfries & Galloway which has, as seen in Figure 11 above, one
of the highest consultant vacancy rates at 31 March 2018 with all vacancies having been
long term (six months or more). NHS Lanarkshire, despite being located in the central belt,
have a relatively high vacancy rate when compared to NHS Greater Glasgow & Clyde and
NHS Lothian suggesting that they may suffer from the attractions of living and working in
Scotland’s two largest cities either side of it.
Figure 12 shows the trend of vacancy rates for six specialties which had the highest number
of vacancies in NHSScotland as at 31 March 2018. Many also display a high proportion of
posts that are vacant for 6 months or more.
25Information Services Division
Figure 12: Trend in Consultant Vacancy Rates for selected specialties, Mar-13 to Mar-
18
Clinical radiology shows the highest vacancy rate for NHSScotland and it has consistently
been above 10% for several years. The proportion of posts that are vacant for six months or
more has also risen steadily in recent years and is now around 80% of all vacancies in this
specialty. Anaesthetics is one of the specialties with the highest number of vacancies
however the vacancy rate for this specialty is comparatively low.
Further information on vacancies covering the last five years can be found in the Medical
and Dental dashboard on the ISD Workforce website.
Additional trend information on consultant vacancies (>5 years) is available within the
Medical trend table in the Data Tables section of the website.
2.5 Doctors and dentists in training
Doctors and dentists in training are the consultants of the future and therefore it is vital that
there is a healthy ‘pipeline’ of trainees to help meet the future workforce requirements of
NHSScotland.
26Information Services Division
The recent trend in medical and dental training numbers within NHSScotland is illustrated in
Figure 13 below. It highlights a reduction in staff between 2007 and 2010 before a
significant increase in 2011. Since then, the number of trainees has fluctuated year on year,
peaking in 2014. Further information, including trainee figures at specialty level for each
NHS Board, is available within the Medical & Dental dashboard on the ISD Workforce
website.
Figure 13: NHSScotland Doctors and Dentists in Training Trend 1,2
Notes:
1. Doctors in training group includes the foundation house officer year 1, foundation house officer year 2 and
doctor in training medical grades.
2. Workforce data was published annually until September 2010 and then quarterly from March 2011
onwards.
The addition of the latest figures for March continues the seasonal trend which is clearly
demonstrated in Figure 13 above, although a different pattern than that shown for overall
staff earlier. Rather than just a drop in the quarter ending June, there is a continuous drop in
the numbers through December, March and June. The large increases demonstrated in the
September figures are a result of the new intake of graduate medical and dental students
who are beginning the next stage of their training.
The repetitive trend of a drop in trainee numbers over the course of the year stems from
newly qualified/fully certified staff moving into consultant posts. While all medical and dental
27Information Services Division
trainees join at the same time of year, there is a more staggered approach to them leaving
as once they receive their CCT, they may have to wait to attain a suitable consultant post.
2.6 Medical agency locum spend
For the first time ISD present information on agency medical locum spend. Note this does
not represent locums employed directly by NHS Boards. This new data is primarily sourced
from the national General Ledger – which receives information from national payroll – and
local invoices processed through the accounts payable section of the finance system. All
figures are verified by NHS Directors of Finance. Given the developmental nature of the
dataset, please note medical agency locum figures are presented as ‘experimental
statistics’ and not ‘national statistics’. NHS Boards use agency medical locums as and
when required to:
temporarily fill vacant posts
cover sickness absence and maternity/paternity or annual leave
provide additional temporary capacity
assist with waiting list initiatives
Following three years of consecutive growth, Figure 14 shows that national spend on
agency locums has decreased by 8.8% in the last year to £100.4 million.
Figure 14: Total spend on medical agency staff and annual rate of change;
NHSScotland; 2013/14 to 2017/18
Figure 15 outlines the breakdown of spend by Board on 2017/18
28Information Services Division
Figure 15: Total spend on medical agency staff by Board; 2017/18
Further information by NHS Board is available within the Medical agency table in the Data
Tables section of the ISD Workforce website.
29Information Services Division
3. Nursing & Midwifery staff
As outlined in Figure 6 earlier, nursing and midwifery is by far the largest staff group within
the NHSScotland workforce, accounting for 42.8% of the workforce directly employed by
NHS Scotland. Encompassing a wide variety of roles, nurses and midwives are at the heart
of the provision of safe and effective care to patients in both hospital and community
settings.
3.1 Summary
Notes:
1. Figures are as at 31 March 2018 unless otherwise specified.
NHS Board information on nursing and midwifery staff in post by sub job family, Agenda for
Change band, age, contract type, gender and vacancies is available within the Nursing and
Midwifery dashboard on the ISD Workforce website.
Further information about longer term trends (>5 years) is available in the Non-Medical
Trend table in the Data Tables section of the website.
Due to variation in the frequency of bespoke data collections, not all published tables are
updated at this time of year. Figures for advanced nurse practitioners, clinical nurse
specialists and nursing and midwifery student intakes, students in training and progression
rates were last updated in the quarterly update report which was published on the ISD
Workforce website in December 2017.
30Information Services Division
3.2 Staff in post
Table 5 presents the change in the nursing and midwifery workforce over a one year and a
five year period. The latest figures show that there has been an increase of 0.2% over the
last year and an increase of 5.0% over the last 5 years.
Table 5: NHSScotland Nursing and Midwifery Staff in Post (WTE)
% change % change
Mar-17 to Mar-13 to
Mar-13 Mar-17 Mar-18
Mar-18 Mar-18
Nursing and midwifery 57,036.6 59,798.6 59,892.0 0.2% 5.0%
Nursing 53,982.6 56,833.0 56,932.9 0.2% 5.5%
Qualified 1 39,655.8 41,358.5 41,440.8 0.2% 4.5%
Support 2 14,325.8 15,474.6 15,492.1 0.1% 8.1%
Midwifery 2,968.7 2,892.1 2,902.1 0.3% -2.2%
Qualified 1 2,410.7 2,399.5 2,408.9 0.4% -0.1%
Support 2 558.0 492.6 493.2 0.1% -11.6%
Not assimilated/not known 85.3 73.5 57.0 -22.4% -33.2%
Notes:
1. Qualified relates to staff on Agenda for Change (AfC) bands 5 and above, including interns.
2. Support relates to staff on AfC bands 1 to 4.
Figure 16 illustrates the trend in the number of nursing and midwifery staff employed by
NHSScotland and shows that there was growth in the overall workforce between 2007 and
2009, a reduction between 2009 and 2012 during the economic downturn and then a return
to growth from then until the present year. The inset chart displays the percentage and WTE
change in the nursing and midwifery workforce by territorial Board in the year to 31 March
2018.
31Information Services Division
Figure 16: NHSScotland Nursing and Midwifery Trend (WTE) 1,2
Notes:
1. Workforce data was published annually until September 2010 and then quarterly from March 2011
onwards.
2. Information for the Special Health Boards is available in the Nursing and midwifery dashboard.
The seasonal trend identified earlier is also present in the nursing and midwifery figures with
staff numbers tending to drop in June before rising again in September onwards. The
reasons for this trend are similar to those outlined earlier for consultants – an increase in
retirement rates amongst staff in the months leading up to and around the end of a financial
year and a focus on a block recruitment of new graduates to fill vacant posts in September
and October. Another factor can be the level of recruitment of seasonal workers to cater for
the increased demand on services over the winter months.
Information on the trends (>5 years) within each NHS Board in respect of the number of
nursing and midwifery staff within each nursing specialty is available in the Non-Medical
Trend table in the Data Tables section of the website.
32Information Services Division
3.3 Net turnover
As demonstrated in Figure 17 below, the net turnover rate for nursing and midwifery staff
has been increasing for several years due to the increasing number of leavers in each year.
The rate has stabilised in the most recent figures however the number of joiners has
decreased from the previous year.
Figure 17: Net Joiners, Leavers and Turnover Trend for Nursing and Midwifery staff;
NHSScotland 1
Notes:
1. NHSScotland joiners and leavers do not include staff changing roles or moving between NHS Boards.
Figure 18 shows the number of joiners, leavers and net turnover of staff by NHS Board
during financial year 2017/18. As outlined in section 1.3 earlier there is a subtle difference
in the calculation used to calculate Board level turnover which leads to consistently higher
turnover rates than for NHSScotland. Further information on the turnover methodology is
available in Appendix 1.
33Information Services Division
Figure 18: Net Joiners, Leavers and Turnover for Nursing and Midwifery staff by NHS
Board, 2017/18 1
Notes:
1. Joiners and leavers do not include staff changing roles within an NHS Board.
Information on net joiners, leavers and turnover for each NHS Board by staff group is
available within the Turnover table in the Data Tables section of the ISD Workforce
website.
Further information on the turnover methodology is available in Appendix 1.
3.4 Nursing and midwifery vacancies
Table 7 provides a summary of the number and rate of nursing and midwifery vacancies
and shows that, while the overall vacancy rate is the same as the previous year, a greater
proportion of the vacancies are longer term (vacant for 3 months or more).
34Information Services Division
Table 7: NHSScotland Nursing and Midwifery Vacancies (WTE)
% change % change
Mar-17 to Mar-13 to
Mar-13 Mar-17 Mar-18 Mar-18 Mar-18
Total vacancies 1 1,609.1 2,818.9 2,812.7 -0.3% 79.0%
Vacant three months or more 327.2 670.6 852.5 27.1% 160.5%
Total vacancy rate 2 2.7% 4.5% 4.5%
Notes:
1. Vacancies are counted as posts that have been cleared for advert after being through the redeployment
process (internal or external advert) and remain as a vacancy until an individual starts in the post. A post
marked as a vacancy may still be occupied by the previous incumbent and so also included within the staff
in post figure. Therefore the denominator may include double counting.
2. The denominator used to calculate the vacancy rate is the sum of the total staff in post and total
vacancies.
A further breakdown of information on nursing and midwifery vacancies including by Agenda
for Change pay band or by qualified/support staff is available on the Nursing and
Midwifery dashboard on the ISD Workforce website.
It should be noted that there is variation in the number and rate of vacancies throughout the
year. Figure 19 outlines the trend in vacancy rates for nursing and midwifery posts recorded
at each census since 30 September 2007, distinguishing between the proportion of posts
that were vacant for less than three months and vacant for three months or more. The low
vacancy rates reported in 2010 and 2011 reflect a reduction in active recruitment coinciding
with the economic downturn. Vacancy rates have steadily increased since then, peaking at
5.2% in June 2017.
35Information Services Division
Figure 19: Nursing and Midwifery Vacancy Rates by Length of Vacancy 1
Notes:
1. Workforce data was published annually until September 2010 and then quarterly from March 2011
onwards.
In recent years it had been possible to see another seasonal trend in the nursing and
midwifery vacancy rates with a steady increase throughout the first half of the year, a peak
in September and then a decrease in December. This trend reflected increased retirement
rates in the early part of the year and also the timescale for recruitment of the newly
qualified graduate nursing and midwifery staff which extends throughout the summer
months. Graduates generally enter the workforce in September or October once they have
obtained their registration number. However the recent figures show that the 2017 peak was
actually in June which may indicate a possible shift in the seasonal trend.
Figure 20 shows the nursing and midwifery vacancy rates by NHS Board as at 31 March
2018.
36Information Services Division
Figure 20: Nursing and Midwifery Vacancy Rates by length of vacancy; by Board; as
at 31 March 2018 1,2
Notes:
1. NHS Health Scotland and NHS Healthcare Improvement Scotland do not have any nurse and midwifery
staff within their workforce and are therefore not shown in the chart.
2. NHS Education for Scotland, NHS Health Scotland, NHS Healthcare Improvement Scotland and the
Scottish Ambulance Service do not have any nursing and midwifery vacancies and are therefore not
shown in the chart.
Focusing on the territorial Boards, it is clear from the above chart that the highest vacancy
rates are in several Boards in the north of the country. The majority of the other Boards
have a vacancy rate in the 3.5 – 5% range which, as outlined in Figure 17 earlier, has been
the normal range in recent years.
Figure 21 shows the trend of vacancy rates for the six nursing specialties which had the
highest number of vacancies in NHSScotland as at 31 March 2018.
37Information Services Division
Figure 21: Nursing and Midwifery Vacancy Rates as at 31 March 2018
As can be seen in Figure 21 above, the highest individual vacancy rate for nursing and
midwifery is for health visiting staff. This is a direct reflection of the Scottish Government
commitment, made in June 2014, to create 500 new health visitor posts within
NHSScotland. The health visiting vacancy numbers above include both training posts (Band
5) and qualified posts (Band 6 and above). Further detail on this as well as other areas of
nursing and midwifery is available within the Nursing and Midwifery dashboard on the
ISD Workforce website.
Trend information (>5 years) on nursing and midwifery vacancies back to 2007 is available
within the Non-medical trend table in the Data Tables section of the website.
3.5 Health visitors
The latest health visitor figures presented in the dashboard, which includes information on
AfC band, age and contract type, show that the number of qualified staff continues to grow,
increasing by 10.9% in last year to 1,737 (1,518.2 WTE, up 11.9%).
Please note that when looking to compare the increase in workforce since the commitment
was made, a review of the accuracy of data on community nursing staff categories,
38Information Services Division
including health visitors, was undertaken in 2014 to ensure more accurate and consistent
reporting for these staff groups. It is therefore not possible to compare data published prior
to March 2015 with latest figures. Further information on 2014 estimates is available on the
ISD Workforce website.
3.6 Nursing and midwifery bank and agency staff
NHS Boards use temporary staff such as bank (NHS employees working extra shifts) or
agency (employed by private companies) nurses and midwives as and when required to:
temporarily fill vacant posts
cover sickness absence and maternity/paternity or annual leave
provide additional temporary capacity
assist with waiting list initiatives
Information on the number of hours worked by bank and agency staff and the cost of using
these staff is collected from NHS Boards. In 2017/18, NHSScotland spent £152.1 million on
nursing and midwifery bank staff. This represents an increase of 7.1% in comparison to the
previous financial year.
Total spend on agency staff decreased by 3.6% to £23.6 million. As shown in Figure 22
below, this is the first annual decrease in agency spend since 2011/12.
39Information Services Division
Figure 22: Total spend on bank and agency nursing & midwifery staff and annual rate
of change; NHSScotland; 2009/10 to 2017/18
Figure 23 outlines the breakdown of bank and agency spend by Board in 2017/18.
Figure 23: Total spend on bank and agency nursing & midwifery staff by Board;
2017/18
A further breakdown of information on bank and agency nursing and midwifery staff –
including hours worked and average WTE – is available on the Bank & Agency tab within
the Nursing and Midwifery dashboard on the ISD Workforce website.
40Information Services Division
4. Allied Health Professions
AHPs are a distinct group of health professionals and support staff that provide a range of
diagnostic, technical, therapeutic, direct patient care, rehabilitation and support services.
Many AHPs are developing further within their roles to take on extended skills and different
functions. Paramedics are also included in this staff group as they were reclassified from
ambulance services to AHPs from 1 April 2013. As outlined in Figure 6 earlier, AHPs
account for 8.3% of the workforce directly employed by NHS Scotland.
4.1 Summary
Notes:
1. Figures are as at 31 March 2018 unless otherwise specified.
NHS Board information on AHP staff in post by profession, Agenda for Change band, age,
contract type, gender and vacancies is available within the AHP dashboard on the ISD
Workforce website.
Further information about longer term trends (>5 years) is available in the Non-Medical
Trend table in the Data Tables section of the website.
4.2 Staff in post
Table 8 shows that there has been a 0.9% increase in the AHP workforce over the last year
and 6.2% over the last 5 years. Please note, for the purpose of reporting percentage
41You can also read