Urban Vegetation Types are Not Perceived Equally in Providing Ecosystem Services and Disservices - MDPI
←
→
Page content transcription
If your browser does not render page correctly, please read the page content below
sustainability

Article
Urban Vegetation Types are Not Perceived Equally in
Providing Ecosystem Services and Disservices
Zuzana Drillet 1,† , Tze Kwan Fung 1, *,† , Rachel Ai Ting Leong 1 , Uma Sachidhanandam 2 ,
Peter Edwards 1 and Daniel Richards 1
 1    ETH Zurich, Future Cities Laboratory, Singapore-ETH Centre, 1 Create Way, #06-01 CREATE Tower,
      Singapore 138602, Singapore; drillet@arch.ethz.ch (Z.D.); reach.rachelleong@gmail.com (R.A.T.L.);
      peter.edwards@env.ethz.ch (P.E.); richards@arch.ethz.ch (D.R.)
 2    Republic Polytechnic, 9 Woodlands Ave 9, Singapore 738964, Singapore; uma_sachi2@rp.edu.sg
 *    Correspondence: fungtzekwan@gmail.com
 †    The first and second author contribute equally.

 Received: 10 February 2020; Accepted: 5 March 2020; Published: 8 March 2020

 Abstract: Urban vegetation is important in providing ecosystem services to people. Different urban
 vegetation types provide contrasting suites of ecosystem services and disservices. Understanding
 public perceptions of the ecosystem services and disservices can therefore play an important role in
 shaping the planning and management of urban areas. We conducted an online survey (n = 1000)
 to understand how residents in the tropical city of Singapore perceived urban vegetation and the
 associated ecosystem services and disservices. The questionnaire was designed to explore whether
 different urban vegetation types (grass, shrubs, trees, trees over shrubs, and secondary forest) were
 perceived as equal in providing benefits. Respondents considered ecosystem services provided by
 urban vegetation to be more important than disservices. Among ecosystem services, regulating
 services were most highly rated, with more than 80% of the respondents appreciating urban vegetation
 for providing shade and improving air quality. Respondents recognized that different vegetation
 types provided different ecosystem services. For example, secondary forest was most commonly
 associated with education and wildlife, while trees were strongly associated with cooling and air
 quality. We conclude that in developing plans and designs for urban vegetation and ecosystem
 services, it is important to understand the perceptions, priorities, and concerns of residents.

 Keywords: urban vegetation; ecosystem services; ecosystem disservices; public perception; tropical
 city; urban ecosystems; urban ecology; sustainable development

1. Introduction
     Natural and managed vegetation delivers a multitude of benefits, or “ecosystem services”,
to urban residents [1,2]. These ecosystem services contribute to improving urban quality of life [3–6].
In rapidly developing tropical cities, urban sprawl often removes green cover, thus impacting valuable
ecosystem services [7]. Urban ecosystem services can be broadly classified into regulating, cultural,
and provisioning services [8]. Examples of regulating services include ecological processes that
improve air quality, attenuate noise, or reduce flood risk by regulating stormwater flows [1,9]. Cultural
services include spiritual enrichment, recreation, and aesthetic experiences [10]. Provisioning services
include all products and materials obtained directly from ecosystems [2,6]. While most effects of urban
vegetation are generally positive, some may be less desirable [11–13]. Examples of such “ecosystem
disservices” include vegetation being a source of pests and disease vectors, or the roots of street trees
damaging property [11–13].

Sustainability 2020, 12, 2076; doi:10.3390/su12052076                       www.mdpi.com/journal/sustainability
Sustainability 2020, 12, 2076 2 of 14
Different types of urban vegetation provide contrasting suites of ecosystem services [14] and
disservices [13]. For example, urban woodlands can reduce air temperatures by up to 3.9 ◦ C more
than turf [15], and vegetation types with a higher understory volume have higher soil decomposition
rates [16]. The balance of services and disservices provided by urban vegetation has a strong influence
on how urban greenery is experienced, used, and valued by people [17]. It is important for urban
planners to understand how city residents perceive ecosystem services to assess which services are
most valued. Furthermore, understanding these perceptions will allow planners to gauge public
willingness to accept vegetation types that are less popular but provide valuable benefits.
A complex mix of factors shape people’s perception of ecosystem services and disservices.
These include environmental pressures such as heat stress [18], the proximity and accessibility of green
spaces [19–22], and individual interests, beliefs, and professional background [23–25]. Also important
are education, access to relevant information, and local traditions and values [19,26–32]. Green spaces
in cities are often relatively small and used by diverse stakeholders, which complicate the planning
and design of urban landscapes. Several studies have shown that urban greening policies are more
likely to be accepted if they take into account of public perceptions [33–35], including which types of
ecosystems are wanted and where [36,37]. Public consultations also provide planners with valuable
information about how preferences vary with time and location [13], which can help in designing
solutions that are effective over an extended period and in the face of environmental changes [21].
There is growing awareness about the benefits of urban ecosystems, though information on how
urban residents perceive and value these benefits is mostly not available to decision makers [38].
Furthermore, much of the existing knowledge is from temperate regions of Europe and North
America [10,39], which have different types of vegetation and different suites of ecosystem services
and disservices from those of tropical cities [40]. The aim of this study was to quantify how urban
vegetation services and disservices are perceived by residents of the tropical city of Singapore. For this
purpose, we designed an online questionnaire in which we asked participants questions about how
they perceived and valued the main types of urban vegetation in Singapore. Specifically, the objectives
of the study were to (1) examine the perceived importance of urban vegetation in providing ecosystem
services and disservices, (2) identify the specific types of urban vegetation that were perceived to be
mostly associated with providing ecosystem services and disservices, and (3) quantify preferences for
the vegetation types that participants would most like to see more of in their neighborhood.
2. Materials and Methods
2.1. Case Study Site Description
Singapore (1◦ 090 N, 103◦ 380 E) is a city-state with a tropical climate, characterized by relatively
high humidity (monthly mean 81.9–86.5%), uniform temperature (monthly mean 26.4–28.3 ◦ C),
and abundant rainfall (monthly mean 112.8–318.6 mm) [41]. Despite a small land area of 714.3 km2 ,
Singapore is highly urbanized, with a population of 5.6 million [42]. With little natural vegetation
remaining, forested areas are confined to 0.16% of primary lowland dipterocarp forests, 19.64% of
young secondary forests, 1.37% of old secondary forest, 0.91% of mangrove forest, and 0.39% of
freshwater swamp forests [43]. On the other hand, actively managed urban vegetation including
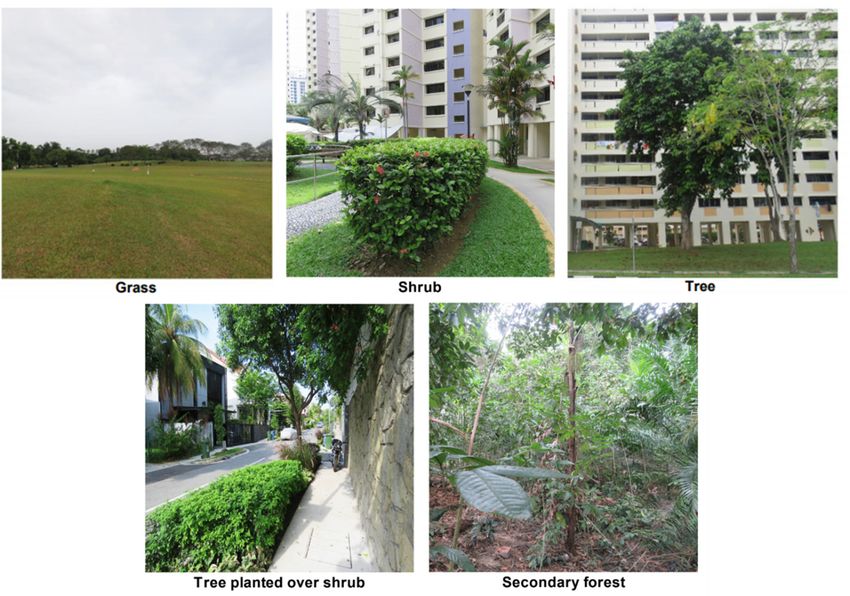
turf grass and planted trees cover 27.45% of the total land area [43]. For the purposes of the survey,
five vegetation types commonly seen in Singapore were classified based on their differing vertical
structures: grass, trees, shrubs, trees over shrubs, and secondary forest. Photographs representative of
each vegetation types were included in the survey (Figure 1).
2.2. Survey Design
The survey quantified the socio-demographic information of respondents, perceptions of urban
vegetation with regard to specific ecosystem services and disservices, and rankings of the five vegetation
types according to which vegetation type people would like to see more of in their neighborhood.included in this section for respondents who did not associate any particular vegetation type with
the positive or negative statement. The proportion of responses for the ecosystem service that each
statement corresponded to was calculated, and “not applicable” responses were excluded from the
analysis.
In the third part of the survey, vegetation types were ranked by respondents on a scale of 1 (least
preferred)
Sustainability 2020, 12,to2076
5 (most preferred) to select which vegetation type they would like to see planted more 3 of 14
in their neighborhood.
Figure 1. The five vegetation types (grass, shrub, tree, tree over shrub, and secondary forest) specified
Figure 1.inThe five vegetation types (grass, shrub, tree, tree over shrub, and secondary forest) specified
the survey.
in the survey.
The first part of survey included the statement “Please select the options to show how strongly you
agree or disagree with the following statements about vegetation in Singapore”, followed by a list of
15 positive and 10 negative statements. Each of the statements described either a cultural or regulating
ecosystem service or disservice (Table 1). Respondents were asked to indicate their level of agreement
with each statement on a 5-point Likert scale ranging from “strongly disagree” to “strongly agree”.
Table 1. Statements associated with (a) ecosystem services and (b) disservices in survey about urban
vegetation types, with links to the CICES ecosystem services framework [8].
Ecosystem
(a) Statements Associated with Ecosystem Services: Label in Figure 3
Service Type
It improves air quality Regulating Air quality
It provides me with shade Regulating Shade
It reduces surrounding noise levels Regulating Noise Attenuation
It stores carbon Regulating Carbon
It controls the effects of heavy rainfall and flooding Regulating Flood Regulation
It is pleasing for me to look at Cultural Aesthetic
It encourages me to spend time outdoors Cultural Outdoor Recreation
It provides opportunities for me to learn more about nature Cultural Education
It possesses spiritual or religious value Cultural Spiritual
It provides me with a good place for socializing Cultural Social Space
It provides me with inspiration for art, creativity, and photography Cultural Inspiration
It makes me feel better (e.g., improve my longevity, relieves my feelings
Cultural Well-being
of stress, allow me to relax, etc.)
It increases my interaction with wildlife Cultural Positive Wildlife Interactions
It supports wildlife that I enjoy Cultural Positive Wildlife
(b) Statements Associated with Ecosystem Disservices: Label in Figure 3
It encourages the presence of general pests (e.g., mosquitoes, rats, etc.) NA Pests
It is strong-smelling NA Smell
It poses a risk of spreading mosquito-borne diseases (e.g., dengue) NA Disease
It is damaging to sidewalks NA Damage
It looks messy NA Messy
It is a safety hazard to people and personal property NA Unsafe
It poses a crime risk NA Crime
It makes me feel uneasy NA Uneasy
It increases my interaction with wildlife that I do not enjoy NA Negative Wildlife InteractionsSustainability 2020, 12, 2076 4 of 14
The second part of the survey included a section in which respondents were asked to select the
urban vegetation type they most associated with the same positive and negative statements (Table 1).
The statement “Please select the vegetation type which you feel the following statements best apply to”
preceded a list of 15 positive and 10 negative statements. A “not applicable” option was included in
this section for respondents who did not associate any particular vegetation type with the positive
or negative statement. The proportion of responses for the ecosystem service that each statement
corresponded to was calculated, and “not applicable” responses were excluded from the analysis.
In the third part of the survey, vegetation types were ranked by respondents on a scale of 1 (least
preferred) to 5 (most preferred) to select which vegetation type they would like to see planted more in
their neighborhood.
2.3. Survey Implementation
The phrasing and clarity of the survey questions was pretested in mid-June 2018 with a group of
urban researchers who were living in Singapore at the time (n = 100). The final survey was conducted
online from 4 to 15 September 2018 through the engagement of a survey company (QuestionPro Inc.,
Austin, TX, USA). Respondents throughout Singapore were randomly selected to participate in the
survey. To ensure a balanced representation of the population, we obtained an even sex ratio and as
broad a spectrum of age groups as possible (Appendix A, Figure A1). The online survey respondents
were restricted to Singapore citizens, Singapore permanent residents, and long-term work visa holders.
The time required to complete the survey was approximately 20 min. A total of 1000 complete responses
were collected. The survey methodology was reviewed and approved by the Ethics Committee of ETH
Zürich (EK 2018-N-65), and all participants gave informed consent to participate in the study.
2.4. Statistical Analysis
The perceived importance of urban ecosystem services and disservices was quantified as the
proportion of respondents who “agreed” or “strongly agreed” with the statements relating to each
service or disservice. Uncertainty was visualized using binomial confidence intervals [44]. Differences
in perceived importance between the services and disservices were modelled as a binomial generalized
linear mixed model, with the different indicators classified into “services” and “disservices” according
to their positive or negative impact on people, and into “regulating functions” or “social and cultural
impacts” broadly following the Common International Classification of Ecosystem Services (CICES)
framework [8].
Overall variation in the proportion of respondents preferring to have more of each vegetation
type in their neighborhood was compared using a chi-squared test. To compare the significance of
differences between each of the pairs of vegetation types, separate pairwise chi-squared tests were
made, and the resulting significance values were adjusted using the Bonferroni method. Confidence
intervals for compositional proportions were added for visualization. All analyses were performed in
the R v3.6.1 statistical computing environment [45].
3. Results
3.1. Perceived Importance of Urban Vegetation in Providing Ecosystem Services and Disservices
Ecosystem services provided by urban vegetation were significantly more likely to be perceived
as important by respondents than ecosystem disservices (p < 0.001; Figure 2; Table 2). Services and
disservices that influenced environmental conditions (regulating) were significantly more likely to be
perceived to be important than those with a cultural or social impact (cultural) (p < 0.001; Figure 2,
Table 2). The regulating services most commonly considered important were those contributing to
shade, air quality, and flood regulation. More than 80% of respondents associated urban vegetation with
benefits of providing shade and improving air quality. Amongst cultural ecosystem services, aesthetic
and well-being benefits and positive wildlife interaction exposure were often highly valued (Figure 2).be perceived to be important than those with a cultural or social impact (cultural) (p < 0.001; Figure
2, Table 2). The regulating services most commonly considered important were those contributing to
shade, air quality, and flood regulation. More than 80% of respondents associated urban vegetation
with benefits of providing shade and improving air quality. Amongst cultural ecosystem services,
aesthetic2020,
Sustainability and12,well-being
2076 benefits and positive wildlife interaction exposure were often highly5 valued
of 14
(Figure 2). Spiritual ecosystem service benefits were the least commonly valued. Amongst the
disservices, less than 40% of respondents associated urban vegetation with pest or disease problems,
Spiritual ecosystem service benefits were the least commonly valued. Amongst the disservices, less
and less than 20% of the respondents associated urban vegetation with causing all other ecosystem
than 40% of respondents associated urban vegetation with pest or disease problems, and less than 20%
disservices (Figure 2).
of the respondents associated urban vegetation with causing all other ecosystem disservices (Figure 2).
Figure
Figure 2. 2. Perception
Perception of of
thethe importance
importance of of ecosystem
ecosystem services
services andand disservices
disservices of vegetation
of vegetation in in
Singapore
Singapore in general.Light
in general. Lightgrey
greybars
barsindicate
indicate regulating
regulating services
services and
and disservices,
disservices,and
anddark
darkgrey
greybars
barsindicate
indicatecultural
culturalservices
servicesand
anddisservices.
disservices.Error bars
Error indicate
bars 95%
indicate 95%binomial
binomialconfidence
confidenceintervals.
intervals
(see Supplementary Materials).
Table 2. Binomial generalized linear model comparing the perception of importance of ecosystem
services and disservices.
Variable Coefficient Standard Error z p
Intercept −1.73 0.03 −50.0infrastructure damage disservice (Figure 3). Grass was most commonly associated with providing
space for social interactions, outdoor recreation, and well-being (Figure 3, Appendix A, Table A1).
Grass was also associated with the disservices of pests and smell. Overall, grass was considered to
provide fewer services than other vegetation types (Figure 3).
Sustainability 2020, 12, 2076 6 of 14
Figure3.
Figure 3. Perception
Perceptionof the
of relative importance
the relative of five broad
importance vegetation
of five types in providing
broad vegetation ecosystem
types in providing
services and
ecosystem disservices.
services Proportion ofProportion
and disservices. 1000 respondents;
of 1000non-responses
respondents; are not shown. are not shown
non-responses
(see Supplementary Materials).
3.3.Sustainability
Preference2020, 12, x FOR PEER
for Vegetation TypesREVIEW
in Urban Landscapes 7 of 15
3.3. Preference for Vegetation Types in Urban Landscapes
The proportions of respondents preferring different structural vegetation types varied
The proportions
significantly (ANOVAof respondents preferring
X2 (4, 1000) = 125.6, pdifferent structural
< 0.001; Figure vegetation
4). The types varied
most preferred significantly
vegetation types
(ANOVA X 2 (4, 1000) = 125.6, p < 0.001; Figure 4). The most preferred vegetation types were trees,
were trees, grass and trees over shrubs, with no significant differences among these types (Appendix
grassA,and
Tabletrees over
A2). shrubs,
These werewith no significant
followed differences
by secondary among
forest, and these
finally types (Appendix
by shrub (AppendixA,A,Table
TableA2).
A2).
These were followed by secondary forest, and finally by shrub (Appendix A, Table A2).
Figure 4. Preference
Figure forfor
4. Preference the
thevegetation
vegetation type thatrespondents
type that respondentswould
would most
most likelike to have
to have moremore of in
of in their
neighborhood(n(n= =
theirneighborhood 1000). Error bars indicate 95% compositional proportion confidence intervals
1000). Error bars indicate 95% compositional proportion confidence intervals (see
(see Supplementary Materials).
Supplementary Materials).
4. Discussion
4. Discussion
4.1. Perceived Importance of Urban Vegetation in Providing Ecosystem Services and Disservices
4.1. Perceived Importance of Urban Vegetation in Providing Ecosystem Services and Disservices
Respondents rated regulating services such as providing shade, improving air quality, and reducing
Respondents rated regulating services such as providing shade, improving air quality, and
floods more highly
reducing floods than
moreother
highlytypes
thanof services.
other types Perceptions about ecosystem
of services. Perceptions about services
ecosystemareservices
shapedare
by
shaped by many factors [23], including local circumstances and media coverage [31]. The importance
attached to regulating ecosystem services in our survey can be linked to the growing environmental
pressures faced in Singapore. The period from 2008 to 2018 was the warmest decade on record [46],
and extreme high temperatures also reached record levels during this time. High temperatures are
widely recognized as a problem for Singapore because of potential negative effects upon outdoorSustainability 2020, 12, 2076 7 of 14
many factors [23], including local circumstances and media coverage [31]. The importance attached to
regulating ecosystem services in our survey can be linked to the growing environmental pressures faced
in Singapore. The period from 2008 to 2018 was the warmest decade on record [46], and extreme high
temperatures also reached record levels during this time. High temperatures are widely recognized as
a problem for Singapore because of potential negative effects upon outdoor thermal comfort [47,48],
outdoor physical activity, and health [49]. Similarly, air pollution events caused by forest fires in
neighboring Indonesia have periodically disrupted public life and the economy [50–52]. The pollutant
standards index (PSI) reached a historical high of 401 in Singapore on 21 June 2013, with haze events
of various intensity occurring in Singapore almost every year [50]. While severe flooding is rare in
Singapore, flash floods have become more common in recent years [53]. The magnitude of these floods
is small in comparison to those afflicting some other cities, but they receive significant coverage in the
local media and have led to changes in water management [53,54].
Although less important than regulating services, many respondents valued the cultural services
provided by urban ecosystems, including beneficial aesthetics, enhanced well-being, and positive
interactions with wildlife. Through initiatives such as the “Garden City” and “City in a Garden”
initiated since the 1960s, Singapore has long pursued the goal of being a green city. This narrative is
reinforced in every park through information signs and branding [55]. The aesthetic value of vegetation
is thus well-appreciated [56]. As wildlife interactions are frequent (also in very urbanized areas),
Singapore residents are becoming more aware of the wildlife they share the city with [57]. Similarly,
government campaigns to promote the well-being effects of greenery and outdoor recreation are likely
to have been significant in increasing recognition of this. Through nationwide initiatives such as
“Community in Bloom”, the National Parks Board has encouraged outdoor activities such as gardening.
Singapore now has over 1500 community gardens where residents’ direct interaction with nature is
being reinforced. More recently, so called “Therapeutic Gardens” have been designed for horticultural
therapy, with a focus to support the well-being of the older generation [58].
Respondents rated ecosystem services more highly than disservices, though they had some
concerns about the negative effects of urban vegetation. One of these was the role of vegetation in
harboring pest and disease vectors, which is often mentioned in the media and in public debate [59].
Disease vectors, notably mosquitoes that carry dengue [60], are a significant concern in Singapore,
while certain bird and invertebrate species have caused major disturbances, damage, and have been
the focus of culling campaigns [61].
Overall, our survey suggests that Singaporean residents take a pragmatic and utilitarian approach
towards managing their landscape, attaching more importance to the benefits related to health and
comfort than to less tangible spiritual or cultural benefits. A similar attitude was also found among
residents in Hong Kong, whose willingness to pay for urban green space was motivated more by
the need to improve air quality than by spiritual considerations [62]. These results contrast with
those obtained in some European cities, where less importance was attached to regulating ecosystem
services [63]. In a study in Bilbao, Spain, for example, the most commonly perceived benefits of urban
ecosystems were cultural services [36]. However, these European cities differed from both Singapore
and Hong Kong in two important respects: first, they were much smaller cities, and, second, they were
surrounded by extensive rural areas to which urban residents had easy access.
4.2. Different Vegetation Types are Perceived to be Associated with Different Ecosystem Services and Disservices
While many studies have been conducted to give a better understanding of the public perception
of urban vegetation in general [64–66], few have compared differing perceptions across vegetation
types. In this study, we found that among the five vegetation types analyzed, secondary forest
was perceived to best provide cultural services such as education and positive wildlife interactions,
and regulating services such as carbon storage and flood risk regulation. However, secondary forest
was also most associated with disservices such as pest and disease risk, crime, and unattractiveSustainability 2020, 12, 2076 8 of 14
aesthetics. These findings are consistent with other studies showing that people associate unkempt
greenery with discomfort [67], risk of crime [68], and, more generally, with danger [17,69].
Trees planted over turf grass were most associated with regulating services such as improving
air quality, cooling the environment, and sequestering carbon, but also with cultural services such
as improving well-being. These findings corroborate previous work, in which shade and the cooling
potential were ranked as the most important benefits by trees, followed by the ability of trees to make
people feel calmer [70]. Fraser & Kenney (2000) [71] also found that the greatest willingness to pay was
for planting shade trees. The ecosystem disservice associated with trees includes the risk of property or
infrastructure damage. Damage to infrastructures, such as pavements due to tree root growth and risk
of tree fall, have been found to be common concerns across studies in other countries such as in Poland,
Mexico, the United States of America, and Sweden [25,65,70,72]. The overall positive perception of
trees may be partially related to Singapore’s vision to become a city in a garden, with education on the
benefits of urban trees and annual tree planting days being a regular event since 1963 [73]. News and
media may also influence people’s perceptions, for instance with regard to the mitigating effect of trees
on carbon emissions [74].
Trees planted over shrubs, and shrubs, were most associated with aesthetic benefits across the
five vegetation types. Trees planted over shrubs were also highly associated with better well-being,
probably due to the highest perceived aesthetic value of this vegetation type, where flowering shrubs
are commonly planted along the roads in Singapore [75]. Studies have shown that flowering plants are
favored by respondents [69], are considered to improve aesthetic quality [76], have a positive influence
on psychological well-being, and provide a sense of safety or act as a positive emotion inducer [77].
Grass was most strongly associated with the provision of social space and outdoor recreation.
Appreciation of lawns has been highlighted in previous work, showing that more people will tend to
visit open spaces with accessible lawns [78], and that lawns were particularly valued as important
places for different outdoor activities (playing, resting, picnicking, walking, socializing) [79].
4.3. Preference for Vegetation Types in Urban Landscapes
The most preferred vegetation type in Singapore neighborhoods was trees (Figure 4). This is
unsurprising given that trees were perceived to be highly associated with regulating services such as
air quality and cooling, while relatively less associated with disservices among the five vegetation
types. Studies from United States of America have also found that the general public feels strongly
positive about managed trees [70,80]. Shrubs were the least preferred vegetation type among the
respondents, probably due to the relatively fewer benefits associated with this vegetation.
Respondents preferred managed landscapes (trees, grass, trees over shrubs) over more natural
forest (secondary forest; Figure 4). This can be related to the perception that secondary forest is associated
with most disservices, despite the perceived range of services that secondary forest can provide
compared to other urban vegetation types. Similarly, a previous study in Singapore found that people
in Singapore preferred low-diversity, manicured landscapes over high-diversity, naturalistic landscapes,
even though they showed a general tendency towards nature conservation [81]. However, this study
showed that people in Singapore do value the regulating services and socio-ecological significance
of unmanaged greenery, notably for education opportunities and positive wildlife interactions [69].
There is evidence that peoples’ familiarity with a location can moderate their preferences, with residents
preferring to retain an area of unmanaged greenery to which they have become accustomed, rather
than replacing it with managed vegetation [69]. It may, therefore, be important to raise awareness of
the importance of ecosystem services through environmental education [63], as ecological knowledge
can also influence a person’s perception of nature [82]. Clear communication of the benefits provided
by secondary forest, for example, may help in allaying concerns about disservices [64,83].
With a high preference for trees, there was also relatively high preference for trees planted over
shrubs (Figure 4). Preference for denser and more complex urban vegetation has been noted previously
in Australia [84]. In Singapore, complex vegetation planting that includes multiple overlappingSustainability 2020, 12, 2076 9 of 14
canopies, has been increasingly implemented since 2012, with currently 100 km of this vegetation type
along the roads [85]. Acceptance or even preference for this more structurally complex vegetation type
is important, as it is likely to better support biodiversity and some ecosystem services than tree or
shrub vegetation alone. We recommend that this type of multi-tiered planting could be incorporated in
highly urbanized residential areas, parks, gardens, and along roads in cities.
5. Conclusions
Our study compared public perceptions of the services and disservices of five different vegetation
types in the tropical city of Singapore, demonstrating that urban vegetation types are not perceived
equally in providing ecosystem services and disservices. To accommodate the wide range of conflicting
demands on space and resources, and the preferences of various stakeholders, urban planners need to
identify the trade-offs and synergies between the different types of ecosystem services and disservices
provided by different vegetation types [14]. With a better understanding of people’s preferences
for different types of vegetation, planners and designers can make better informed decisions in the
co-creation of multifunctional landscapes that optimize ecosystem service provision.
Sustainability 2020, 12, x FOR PEER REVIEW 10 of 15
Supplementary Materials: The following are available online at http://www.mdpi.com/2071-1050/12/5/2076/
s1. Aggregated
Author data usedZ.D.
Contributions: to generate Figures
and T.K.F. 2–4 are available
contributed equally on to Figshare
this work,using
andtheare
following permanent
joint first authors.
doi:10.6084/m9.figshare.11952567. Individual-level data are available on reasonable request, subject to personal
Conceptualization,
data protection. T.K.F. and D.R.; methodology, T.K.F. and D.R.; formal analysis, D.R.; investigation, T.K.F.,
R.A.T.L., U.S., Z.D., and D.R.; data curation, D.R. and T.K.F.; writing—original draft preparation, Z.D. and
Author Contributions: and
T.K.F.; writing—review Z.D.editing,
and T.K.F. contributed
Z.D., T.K.F., equally
R.A.T.L., to this
U.S., P.E., and work, and are joint
D.R.; visualization, first
D.R.; authors.
supervision,
Conceptualization, T.K.F. and D.R.; methodology, T.K.F. and D.R.; formal analysis, D.R.; investigation, T.K.F.,
P.E. andU.S.,
R.A.T.L., D.R..; project
Z.D., and administration, T.K.F.;
D.R.; data curation, funding
D.R. acquisition,
and T.K.F.; P.E. All authors
writing—original have read and
draft preparation, Z.D.agreed to the
and T.K.F.;
published version of the manuscript.
writing—review and editing, Z.D., T.K.F., R.A.T.L., U.S., P.E., and D.R.; visualization, D.R.; supervision, P.E. and
D.R.; project administration, T.K.F.; funding acquisition, P.E. All authors have read and agreed to the published
Funding:
version Themanuscript.
of the research was conducted at the Future Cities Laboratory at the Singapore - ETH Centre, which was
established collaboratively between ETH Zurich and Singapore’s National Research Foundation (FI 370074016)
under itsThe
Funding: research
Campus was conducted
for Research at theand
Excellence Future Cities Laboratory
Technological at the
Enterprise Singapore - ETH Centre, which was
programme.
established collaboratively between ETH Zurich and Singapore’s National Research Foundation (FI 370074016)
under its Campus for Research
Acknowledgments: We thankExcellence
Xiao PingandSongTechnological Enterprise
and the anonymous programme.
reviewers for their valuable comments on
the manuscript, the researchers who helped to improve the clarity of the
Acknowledgments: We thank Xiao Ping Song and the anonymous reviewers for their valuablequestionnaire, and the participants
comments on theof
the study for
manuscript, thetheir time.
researchers who helped to improve the clarity of the questionnaire, and the participants of the
study for their time.
Conflicts of Interest: The authors declare no conflicts of interest. The funders had no role in the design of the
Conflicts
study; inoftheInterest: Theanalyses,
collection, authors or
declare no conflicts
interpretation of interest.
of data; The funders
in the writing of thehad no role inorthe
manuscript, design
in the of theto
decision
study; in the collection, analyses, or interpretation of data; in the writing of the manuscript, or in the decision to
publishthe
publish theresults.
results.
AppendixAA
Appendix
Figure A1. Age group distribution among 1000 respondents.
Figure A1. Age group distribution among 1000 respondents.
Table A1. Chi-squared tests of significance for variation in the number of respondents associating
each structural vegetation type with different ecosystem services and disservices. Threshold for
significance following Bonferroni correction = 0.002.Sustainability 2020, 12, 2076 10 of 14
Table A1. Chi-squared tests of significance for variation in the number of respondents associating each
structural vegetation type with different ecosystem services and disservices. Threshold for significance
following Bonferroni correction = 0.002.
Ecosystem Number of Degrees of Most Associated
χ2 p
(Dis)Service Samples Freedom Vegetation Type
Air quality 1000 4 593.3Sustainability 2020, 12, 2076 11 of 14
4. Gómez-Baggethun, E.; Barton, D.N. Classifying and valuing ecosystem services for urban planning. Ecol. Econ.
2013, 86, 235–245. [CrossRef]
5. Costanza, R.; Groot, R.; Braat, L.; Kubiszewski, I.; Fioramonti, L.; Sutton, P.; Farber, S.; Grasso, M. Twenty
years of ecosystem services: How far have we come and how far do we still need to go? Ecosyst. Serv.
2017, 28, 1–16. [CrossRef]
6. Zinia, N.J.; McShane, P. Significance of urban green and blue spaces: Identifying and valuing provisioning
ecosystem services in Dhaka City. Eur. J. Sustain. Dev. 2018, 7, 435–448. [CrossRef]
7. Nagendra, H.; Nagendran, S.; Paul, S.; Pareeth, S. Graying, greening and fragmentation in the rapidly
expanding Indian city of Bangalore. Landsc. Urban Plan. 2012, 105, 400–406. [CrossRef]
8. CICES. Common International Classification of Ecosystem Services (CICES) V5.1 Guidance on the Application
of the Revised Structure. 2018. Available online: https://cices.eu/content/uploads/sites/8/2018/01/Guidance-
V51-01012018.pdf (accessed on 10 December 2019).
9. Cortinovis, C.; Geneletti, D. A framework to explore the effects of urban planning decisions on regulating
ecosystem services in cities. Ecosyst. Serv. 2019, 38, 100946. [CrossRef]
10. Milcu, A.I.; Hanspach, J.; Abson, D.; Fischer, J. Cultural ecosystem services—A literature review and prospects
for future research. Ecol. Soc. 2013, 18, 44. [CrossRef]
11. Lyytimäki, J.; Sipilä, M. Hopping on one leg—The challenge of ecosystem disservices for urban green
management. Urban For. Urban Green. 2009, 8, 309–315. [CrossRef]
12. Döhren, P.; Haase, D. Ecosystem disservices research: A review of the state of the art with a focus on cities.
Ecol. Indic. 2015, 52, 490–497. [CrossRef]
13. Delshammar, T.; Östberg, J.; Öxell, C. Urban trees and ecosystem disservices—A pilot study using complaints
records from three Swedish cities. Arboric. Urban For. 2015, 41, 187–193.
14. Mexia, T.; Vieira, J.; Príncipe, A.; Anjos, A.; Silva, P.; Lopes, N.; Freitas, C.; Santos-Reis, M.; Correia, O.;
Branquinho, C.; et al. Ecosystem services: Urban parks under a magnifying glass. Environ. Res. 2018, 160,
469–478. [CrossRef] [PubMed]
15. Fung, C.K.W.; Jim, C.Y. Microclimatic resilience of subtropical woodlands and urban-forest benefits. Urban For.
Urban Green. 2019, 42, 100–112. [CrossRef]
16. Ossola, A.; Hahs, A.K.; Nash, M.A.; Livesley, S.J. Habitat complexity enhances comminution and
decomposition processes in urban ecosystems. Ecosystems 2016, 19, 927–941. [CrossRef]
17. Lyytimäki, J.; Petersen, L.K.; Normander, B.; Bezák, P. Nature as a nuisance? Ecosystem services and
disservices to urban lifestyle. Environ. Sci. 2008, 5, 161–172. [CrossRef]
18. Lafortezza, R.; Carrus, G.; Sanesi, G.; Davies, C. Benefits and well-being perceived by people visiting green
spaces in periods of heat stress. Urban For. Urban Green. 2009, 8, 97–108. [CrossRef]
19. Lamarque, P.; Tappeiner, U.; Turner, C.; Steinbacher, M.; Bardgett, R.D.; Szukics, U.; Schermer, M.; Lavorel, S.
Stakeholder perceptions of grassland ecosystem services in relation to knowledge on soil fertility and
biodiversity. Reg. Environ. Chang. 2011, 11, 791–804. [CrossRef]
20. Meijaard, E.; Abram, N.K.; Wells, J.A.; Pellier, A.S.; Ancrenaz, M.; Gaveau, D.L.; Runting, R.K.; Mengersen, K.
People’s perceptions about the importance of forests on Borneo. PLoS ONE 2013, 8, e73008. [CrossRef]
21. Abram, N.K.; Meijaard, E.; Ancrenaz, M.; Runting, R.K.; Wells, J.A.; Gaveau, D.L.A.; Pellier, A.S.; Mengersen, K.
Spatially explicit perceptions of ecosystem services and land cover change in forested regions of Borneo.
Ecosyst. Serv. 2014, 7, 116–127. [CrossRef]
22. Muhamad, D.; Okubo, S.; Harashina, K.; Parikesit, P.; Gunawan, B.; Takeuchi, K. Living close to forests
enhances people’s perception of ecosystem services in a forest-agricultural landscape of West Java, Indonesia.
Ecosyst. Serv. 2014, 8, 197–206. [CrossRef]
23. Knez, I.; Thorsson, S. Thermal, emotional and perceptual evaluations of a park: Cross-Cultural and
environmental attitude comparisons. Build. Environ. 2008, 43, 1483–1490. [CrossRef]
24. Manzoor, S.A.; Malik, A.; Zubair, M.; Griffiths, G. and Lukac, M. Linking social perception and provision of
ecosystem services in a sprawling urban landscape: A case study of Multan, Pakistan. Sustainability 2019, 11, 654.
[CrossRef]
25. Suchocka, M.; Jankowski, P.; Błaszczyk, M. Perception of urban trees by Polish tree professionals vs.
nonprofessionals. Sustainability 2019, 11, 211. [CrossRef]
26. Martín-López, B.; Iniesta-Arandia, I.; García-Llorente, M.; Palomo, I.; Casado-Arzuaga, I.; Amo, D.G.D.
Uncovering ecosystem service bundles through social preferences. PLoS ONE 2012, 7, e38970.Sustainability 2020, 12, 2076 12 of 14
27. Orenstein, D.E.; Groner, E. In the eye of the stakeholder: Changes in perceptions of ecosystem services across
an international border. Ecosyst. Serv. 2014, 8, 185–196. [CrossRef]
28. Richards, D.R.; Warren, P.H.; Maltby, L.; Moggridge, H.L. Awareness of greater numbers of ecosystem
services affects preferences for floodplain management. Ecosyst. Serv. 2017, 24, 138–146. [CrossRef]
29. Cáceres, D.M.; Tapella, E.; Quetier, F.; Diaz, S. The social value of biodiversity and ecosystem services from
the perspectives of different social actors. Ecol. Soc. 2015, 20, 62. [CrossRef]
30. Morales-Reyes, Z.; Martín-López, B.; Moleón, M.; Mateo-Tomás, P.; Botella, F.; Margalida, A.; Donázar, J.A.;
Blanco, G.; Pérez, I.; Sánchez-Zapata, J.A. Farmer perceptions of the ecosystem services provided by
scavengers: What, who, and to whom. Conserv. Lett. 2018, 11, 1–11. [CrossRef]
31. Mclellan, V.; Shackleton, C. The relative representation of ecosystem services and disservices in South African
newspaper media over fifteen years. Ecosyst. People 2019, 15, 247–256. [CrossRef]
32. Suchocka, M.; Jankowski, P.; Błaszczyk, M. Tree protection on construction sites—Knowledge and perception
of Polish professionals. Urban For. Urban Green. 2019, 46, 126436. [CrossRef]
33. Raymond, C.M.; Bryan, B.A.; MacDonald, D.H.; Cast, A.; Strathearn, S.; Grandgirard, A.; Kalivas, T. Mapping
community values for natural capital and ecosystem services. Ecol. Econ. 2009, 68, 1301–1315. [CrossRef]
34. Sherrouse, B.C.; Clement, J.M.; Semmens, D.J. A GIS application for assessing, mapping, and quantifying the
social values of ecosystem services. Appl. Geogr. 2011, 31, 748–760. [CrossRef]
35. Leong, H.K. Citizen participation and policy making in Singapore: Conditions and predicaments. Asian Surv.
2000, 40, 436–455. [CrossRef]
36. Casado-Arzuaga, I.; Madariaga, I.; Onaindia, M. Perception, demand and user contribution to ecosystem
services in the Bilbao Metropolitan Greenbelt. J. Environ. Manag. 2013, 129, 33–43. [CrossRef] [PubMed]
37. Escobedo, F.; Northrop, R.; Orfanedes, M.; Iaconna, A. Comparison of community leader perceptions on
urban forests in Florida. EDIS 2010, 2.
38. Turner, R.K.; Daily, G.D. The ecosystem services framework and natural capital conservation.
Environ. Resour. Econ. 2008, 39, 25–35. [CrossRef]
39. Atif, S.B.; Saqib, Z.; Zaman-ul-Haq, M.; Akhtar, N.; Fatimah, H.; Atif, M.; Farooqi, S. Identification of
key-trends and evaluation of contemporary research regarding urban ecosystem services: A path towards
socio-ecological sustainability of urban areas. Appl. Ecol. Environ. Res. 2018, 16, 3545–3581. [CrossRef]
40. Song, X.P.; Richards, D.R.; Edwards, P.J.; Tan, P.Y. Benefits of trees in tropical cities. Science 2017, 356, 1241.
[CrossRef]
41. National Environment Agency. Climate of Singapore. National Environment Agency Website. Available
online: http://www.weather.gov.sg/climate-climate-of-singapore/ (accessed on 8 October 2019).
42. SingStat. Population and Population Structure. Available online: https://www.singstat.gov.sg/find-data/search-
by-theme/population/population-and-population-structure/latest-data (accessed on 10 December 2019).
43. Yee, A.T.K.; Corlett, R.T.; Liew, S.C.; Tan, H.T.W. The vegetation of Singapore—An updated map.
Gard. Bull. Singap. 2011, 63, 205–212.
44. Zar, J.H. Biostatistical Analysis; Prentice Hall/Pearson: Upper Saddle River, NJ, USA, 2010; p. 944.
45. R Core Team. R: A Language and Environment for Statistical Computing; R Foundation for Statistical Computing:
Vienna, Austria, 2019.
46. The Straits Times. Singapore Experienced Eighth Warmest Year in 2018, December was Second Hottest
Year End in History. Available online: https://www.straitstimes.com/singapore/environment/singapore-
experienced-eighth-warmest-year-in-2018-december-was-second-hottest (accessed on 10 December 2019).
47. Chow, W.T.L.; Akbar, S.N.A.B.A.; Heng, S.L.; Roth, M. Assessment of measured and perceived microclimates
within a tropical urban forest. Urban For. Urban Green. 2016, 16, 62–75. [CrossRef]
48. Heng, S.; Chow, W. How ‘hot’ is too hot? Evaluating acceptable ranges of outdoor thermal comfort in an
equatorial urban park. Int. J. Biometeo. 2019, 63, 801–816. [CrossRef] [PubMed]
49. Mora, C.; Dousset, B.; Caldwell, I.R.; Powell, F.E.; Geronimo, R.C.; Bielecki, C.R.; Counsell, C.W.W.;
Dietrich, B.S.; Johnston, E.T.; Louis, L.V.; et al. Global risk of deadly heat. Nat. Clim. Chang. 2017, 7, 501–506.
[CrossRef]
50. Carrasco, L.R. Silver lining of Singapore’s haze. Science 2013, 341, 342–343. [CrossRef] [PubMed]
51. The Straits Times. Haze Brings Risk of Cardiac Arrests: Study. Available online: https://www.straitstimes.
com/singapore/health/haze-brings-risk-of-cardiac-arrests-study (accessed on 10 December 2019).Sustainability 2020, 12, 2076 13 of 14
52. AsiaOne. Haze Causes Tourism Gloom in Singapore. AsiaOne Website. Available online: https://www.
asiaone.com/singapore/haze-causes-tourism-gloom-singapore (accessed on 10 December 2019).
53. Chow, W.T.L.; Cheong, B.D.; Ho, B.H.A. Multimethod approach towards assessing urban flood patterns and
its associated vulnerabilities in Singapore. Adv. Meteorol. 2016, 7159132. [CrossRef]
54. Chow, W.T.L. The impact of weather extremes on urban resilience to hydro-climate hazards: A Singapore
case study. Int. J. Water Resour. Dev. 2017, 34, 510–524. [CrossRef]
55. National Parks Board. Biophilic City in a Garden. National Parks Board of Singapore Website. Available
online: https://www.nparks.gov.sg/about-us/city-in-a-garden (accessed on 10 January 2020).
56. Hui, T.K.; Wan, T.W.D. Singapore’s image as a tourist destination. Int. J. Tour. Res. 2003, 5, 305–313.
[CrossRef]
57. Eco-Business. Can Singapore, the City in a Garden, Grow into a City in Nature? Eco-Business Website.
Available online: https://www.eco-business.com/news/can-singapore-the-city-in-a-garden-grow-into-a-city-
in-nature (accessed on 10 December 2019).
58. National Parks Board. Therapeutic Horticulture Programmes. National Parks Board of Singapore Website.
Available online: https://www.nparks.gov.sg/gardens-parks-and-nature/therapeutic-gardens/therapeutic-
horticulture-programmes (accessed on 10 January 2020).
59. Rajarethinam, J.; Ang, L.W.; Ong, J.; Ycasas, J.; Hapuarachchi, H.C.; Yap, G.; Chong, C.S.; Lai, Y.L.; Cutter, J.;
Ho, D.; et al. Dengue in Singapore from 2004 to 2016: Cyclical epidemic patterns dominated by serotypes 1
and 2. Am. J. Trop. Med. Hyg. 2018, 99, 204–210. [CrossRef]
60. Burattini, M.N.; Chen, M.; Chow, A.; Coutinho, F.A.B.; Goh, K.T.; Lopez, L.F.; Massad, E. Modelling the
control strategies against dengue in Singapore. Epidemiol. Infect. 2008, 136, 309–319. [CrossRef]
61. Lim, H.C.; Brook, B.W.; Soh, M.C.K. Undesirable aliens: Factors determining the distribution of three invasive
bird species in Singapore. J. Trop. Ecol. 2003, 19, 685–695. [CrossRef]
62. Lo, A.; Jim, C.Y. Willingness of residents to pay and motives for conservation of urban green spaces in the
compact city of Hong Kong. Urban For. Urban Green. 2010, 9, 113–120. [CrossRef]
63. Kothencz, G.; Kolcsár, R.; Cabrera-Barona, P.; Szilassi, P. Urban green space perception and its contribution
to well-being. Int. J. Environ. Res. Public Health 2017, 14, 766. [CrossRef] [PubMed]
64. Hwang, Y.H.; Yue, Z.E.J.; Ling, S.K.; Tan, H.H.V. It’s ok to be wilder: Preference for natural growth in urban
green spaces in a tropical city. Urban For. Urban Green. 2019, 38, 165–176. [CrossRef]
65. Camacho-Cervantes, M.; Schondube, J.E.; Castillo, A.; MacGregor-Fors, I. How do people perceive urban
trees? Assessing likes and dislikes in relation to the trees of a city. Urban Ecosyst. 2014, 17, 761–773. [CrossRef]
66. Weber, F.; Kowarik, I.; Säumel, I. A walk on the wild side: Perceptions of roadside vegetation beyond trees.
Urban For. Urban Green. 2014, 13, 205–212. [CrossRef]
67. Bixler, R.D.; Floyd, M.F. Nature is scary, disgusting, and uncomfortable. Environ. Behav. 1997, 29, 443–467.
[CrossRef]
68. Skår, M. Forest dear and forest fear: Dwellers’ relationships to their neighborhood forest. Landsc. Urban Plan.
2010, 98, 110–116. [CrossRef]
69. Hwang, Y.H.; Roscoe, C.J. Preference for site conservation in relation to on-site biodiversity and perceived
site attributes: An on-site survey of unmanaged urban greenery in a tropical city. Urban For. Urban Green.
2017, 28, 12–20. [CrossRef]
70. Lohr, I.V.; Pearson-Mims, C.H.; Tarnai, J.; Dillman, D.A. How urban residents rate and rank the benefits and
problems associated with trees in cities. J. Arboric. 2004, 30, 28–36.
71. Fraser, D.G.E.; Kenney, W.A. Cultural background and landscape history as factors affecting perceptions of
the urban forest. J. Arboric. 2000, 26, 106–112.
72. Östberg, J.; Martinsson, M.; Stal, Ö.; Fransson, A. Risk of root intrusion by tree and shrub species into
sewerpipes in Swedish urban areas. Urban For. Urban Green. 2011, 11, 65–71. [CrossRef]
73. The Straits Times. 2011. Available online: http://leekuanyew.straitstimes.com/ST/chapter2.html (accessed on
10 December 2019).
74. Today Online. Type of Trees Planted a Factor in Reducing Emissions. Available online: https://www.
todayonline.com/singapore/type-trees-planted-factor-reducing-emissions (accessed on 10 December 2019).
75. The Straits Times. In Pictures: Flowering Trees and Shrubs in Singapore. Available online: https://www.
straitstimes.com/singapore/environment/in-pictures-flowering-trees-and-shrubs-in-singapore (accessed on
10 December 2019).Sustainability 2020, 12, 2076 14 of 14
76. Todorova, A.; Asakawa, S.; Aikoh, T. Preferences for and attitudes towards street flowers and trees in
Sapporo, Japan. Landsc. Urban Plan. 2004, 69, 403–416. [CrossRef]
77. Haviland-Jones, J.; Rosario, H.H.; Wilson, P.; McGuire, T.R. An environmental approach to positive emotion:
Flowers. Evol. Psychol. 2005, 3, 104–132. [CrossRef]
78. Chen, Y.; Liu, T.; Xie, X.; Marušić, B.G. What attracts people to visit community open spaces? A case study of
the overseas Chinese town community in Shenzhen, China. Int. J. Environ. Res. Public Health 2016, 13, 644.
[CrossRef]
79. Ignatieva, M.; Eriksson, F.; Eriksson, T.; Berg, P.; Hedblom, M. The lawn as a social and cultural phenomenon
in Sweden. Urban For. Urban Green. 2017, 21, 213–223. [CrossRef]
80. Zhang, Y.; Hussain, A.; Deng, J.; Letson, N. Public attitudes toward urban trees and supporting urban tree
programs. Environ. Behav. 2007, 39, 797–814. [CrossRef]
81. Khew, J.Y.T.; Yokohari, M.; Tanaka, T. Public perceptions of nature and landscape preference in Singapore.
Hum. Ecol. 2014, 42, 979–988. [CrossRef]
82. Li, X.P.; Fan, S.X.; Kühn, N.; Dong, L.; Hao, P.Y. Residents’ ecological and aesthetical perceptions toward
spontaneous vegetation in urban parks in China. Urban For. Urban Green. 2019, 44, 126397. [CrossRef]
83. Brun, M.; Di Pietro, F.; Bonthoux, S. Residents’ perceptions and valuations of urban wastelands are influenced
by vegetation structure. Urban For. Urban Green. 2018, 29, 393–403. [CrossRef]
84. Harris, V.; Kendal, D.; Hahs, A.K.; Threlfall, C.G. Green space context and vegetation complexity shape
people’s preferences for urban public parks and residential gardens. Landsc. Res. 2018, 43, 150–162.
[CrossRef]
85. National Parks Board. Nature Ways. National Parks Board of Singapore Website. Available online:
https://www.nparks.gov.sg/gardens-parks-and-nature/nature-ways (accessed on 10 January 2020).
© 2020 by the authors. Licensee MDPI, Basel, Switzerland. This article is an open access
article distributed under the terms and conditions of the Creative Commons Attribution
(CC BY) license (http://creativecommons.org/licenses/by/4.0/).You can also read