Boon or Bane: Effect of Adjacent YIMBY or NIMBY Facilities on the Benefit Evaluation of Open Spaces or Cropland
←
→
Page content transcription
If your browser does not render page correctly, please read the page content below
Preprints (www.preprints.org) | NOT PEER-REVIEWED | Posted: 8 March 2021                            doi:10.20944/preprints202103.0235.v1

     Article

     Boon or Bane: Effect of Adjacent YIMBY or NIMBY Facilities on
     the Benefit Evaluation of Open Spaces or Cropland
     Wun-Jheng Wu 1, Pei-Ing Wu 2,* and Je-Liang Liou 3

                                       1 Department of Agricultural Economics, National Taiwan University; vimalawu@gmail.com
                                       2 Department of Agricultural Economics, National Taiwan University; piwu@ntu.edu.tw
                                       3 The Center for Green Economy, Chung-Hua Institution for Economic Research; jlliou@cier.edu.tw

                                       * Correspondence: piwu@ntu.edu.tw; Tel.:+886-2-3366-2663

                                       Abstract: This is the first study to comprehensively evaluate the benefit of urban open spaces and
                                       cropland with different adjacent public facilities seen as locally undesirable (“not in my backyard,”
                                       NIMBY) or desirable (“yes in my backyard,” YIMBY). The total benefit increases or decreases for
                                       urban open space and cropland with adjacent NIMBY or YIMBY facilities in a municipality in
                                       Taiwan. The results show that for the city as a whole, the current arrangement of NIMBY and
                                       YIMBY in different zones decreases the total benefit of urban open spaces in highly urbanized
                                       zones and increases the total damage to cropland in extremely rural zones. This indicates a need to
                                       avoid further installing NIMBY or YIMBY facilities in already occupied urban open spaces. The
                                       results also demonstrate that locating NIMBY or YIMBY facilities near cropland fails to highlight
                                       the benefit of YIMBY facilities and magnifies opposition to NIMBY facilities. For individual hous-
                                       ing units, the total damage is 1.87% of the average housing price for cropland-type open space with
                                       adjacent NIMBY or YIMBY facilities, and the total benefit is 7.43% of the average housing price for
                                       urban-type open space in a highly urbanized area. In contrast, the total benefit for open space with
                                       adjacent NIMBY or YIMBY facilities is a 2.95%-13.80% increase in the average housing price for
                                       areas with mixed urban open space and cropland.

                                       Keywords: Spatial Durbin model; local polynomial regression; YIMBY facilities; NIMBY facilities;
                                       willingness to pay; total benefit

                                       1. Introduction
                                             The openness and public nature of urban open space and cropland offer the func-
                                       tions of agricultural production, ecological conservation, landscape aesthetics, and out-
                                       door recreation and have gained considerable importance due to their ability to act as a
                                       carbon sink and their educational value [1]. This has made urban open space and
                                       cropland consistent with one of the Sustainable Development Goals (SDGs) of the United
                                       Nations, to “provide universal access to safe, inclusive and accessible, green and public
                                       spaces” [2]. Most functions of urban open space and cropland have positive benefits, but
                                       there is no monetary market to reveal these benefits. Their importance is inevitably un-
                                       derestimated in region planning of urban open space and/or cropland [3].
                                             In general, if housing is surrounded by open space with diverse vegetation, good
                                       facility maintenance, and a large area, there is a positive impact on its price [4]. In con-
                                       trast, lower quality, or quantity of open space with poor public security or mosqui-
                                       to-breeding areas due to poor maintenance will negatively affect housing prices [5, 6].
                                       Previous studies evaluating the benefits of open space have either ignored cropland or
                                       have not treated these types of spaces separately, resulting in insufficient planning in-
                                       formation. A study found that peripheral urban open space has greater benefits than
                                       developed private cropland [7]. This finding suggests that the benefits of urban open
                                       space and cropland need to be evaluated differently [8]. Under global liberalization and
                                       rapid industrial development, the impacts of these types of spaces on the agricultural

               © 2021 by the author(s). Distributed under a Creative Commons CC BY license.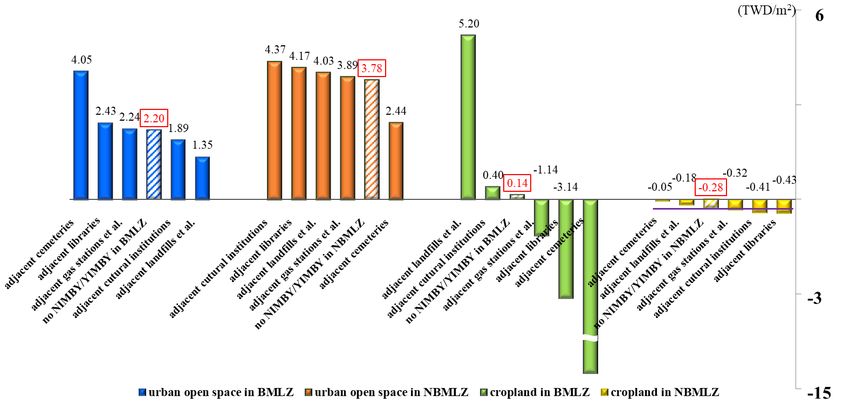
Preprints (www.preprints.org) | NOT PEER-REVIEWED | Posted: 8 March 2021               doi:10.20944/preprints202103.0235.v1

                                 sector are critical. Society attaches great importance to the multifunctionality of cropland
                                 because it serves production functions as well as providing openness [9].
                                       Moreover, previous studies have used the distance between housing and urban
                                 open space to evaluate the benefits of the latter [10, 11]. Few studies consider public fa-
                                 cilities embedded in or adjacent to urban open space or cropland [10]. It is clear that some
                                 facilities positively affect surrounding housing, with a “yes-in-my-backyard” (YIMBY)
                                 effect, while others have negative impacts, with a “not-in-my-backyard” (NIMBY) effect;
                                 other facilities might have both YIMBY and NIMBY effects on housing prices [12, 13]. For
                                 instance, it was found that libraries were the most popular YIMBY facility [14]. In con-
                                 trast, proximity to facilities such as waste landfills have higher risk and depresses hous-
                                 ing prices. It was specifically found that if the distance between a housing unit and a
                                 waste landfill site increases from 0.5 miles to 3.25 miles, the housing price will increase
                                 17%-20% [15]. This finding provides guidelines for the amount of compensation that
                                 should be provided to those living near landfill sites.
                                       Nevertheless, it was found that housing closer to a nuclear power plant is pricier in
                                 California because many plant employees live nearby, indicating that a NIMBY facility
                                 might have a positive effect on surrounding housing prices [16]. Without accounting for
                                 the NIMBY and/or YIMBY effects, housing prices may be over- or underestimated. The
                                 impact on housing prices from urban open space or cropland depends on the interaction
                                 of YIMBY or NIMBY facilities and urban open space or cropland [13, 17–19]. Such adja-
                                 cent effects complicate the benefit evaluation of urban open space and cropland. This
                                 information is not only essential for the landscape planning, land use, or allocation of
                                 NIMBY or YIMBY facilities in certain regions but is also important in assessing their ef-
                                 fect on housing prices [13].
                                       Although previous study indicated that appropriate evaluation is necessary when
                                 open space is adjacent to different facilities, no empirical evidence indicates the possible
                                 harm or benefit [13]. A study takes one step further to examine housing prices under the
                                 interaction of open spaces and facilities [19]. However, that study neither takes into ac-
                                 count the impacts of open space with adjacent NIMBY or YIMBY facilities located at dif-
                                 ferent distances from housing nor considers the total area of such open space within a
                                 specific radius of a housing unit. It is imperative that all such dimensions be considered
                                 when evaluating the benefits or harms of open space and cropland.
                                       Taiwan’s comprehensive National Spatial Land Planning Act (NSLPA) of 2016 dis-
                                 tinguishes national land into urban and nonurban land [20]. One major type of nonurban
                                 land is cropland. Enforcement of this act ensures food security, balances the development
                                 of rural and urban areas, and resists climate change. Furthermore, the development of
                                 cropland is irreversible [21]. This act suggests that urban open space and cropland should
                                 be viewed as equally important in evaluating benefits or harms for national land plan-
                                 ning. Under the NSLPA in Kaohsiung City, the municipality with the greatest land area
                                 in Taiwan, the city proposed six development zones. Among these, approximately 90% of
                                 the population is centralized in the business metropolitan living development zone,
                                 causing enormous population pressure for the zone. This situation highlights the im-
                                 portance of urban open space in this specific zone and in the city. Cropland covers 16% of
                                 the city, but it has not received equivalent attention. The promotion or arrangement of
                                 multiuse public facilities on urban open space or cropland can help determine the in-
                                 crease or decrease in benefits for these spaces with adjacent facilities.
                                       This study is the first to comprehensively evaluate the benefit of urban open space
                                 and cropland with different adjacent public NIMBY or YIMBY facilities. A comparison is
                                 made to identify the total increase or decrease in benefits for urban open space or
                                 cropland with different combinations of NIMBY or YIMBY facilities. The benefit in terms
                                 of the increase or decrease in average housing price is concurrently assessed. For these
                                 purposes, this study employs a spatial Durban hedonic price model (SDM) to evaluate
                                 the related benefits for urban open space and cropland with adjacent NIMBY or YIMBY
                                 facilities. This model accounts for the spatial dependence arising from both housing
                                 prices and attributes affecting housing prices [22-23]. Local polynomial regression is
Preprints (www.preprints.org) | NOT PEER-REVIEWED | Posted: 8 March 2021 doi:10.20944/preprints202103.0235.v1
employed to determine the scope of impact of a facility and any spatially related attribute
[24, 25]. In summary, the important aspects of this study are threefold. First, it uses a very
advanced spatial methodology. Second, it comprehensively analyzes the outcomes of
benefits evaluation for urban open space and cropland with adjacent YIMBY and NIMBY
facilities when these facilities are normally ignored. Third, the analyzed results are suit-
able for use in allocating the abovementioned facilities within a city. This research sheds
light on the planning and design of a specific city and brings together the multiple disci-
plines of sociology, economics, and management.
The remaining sections of this paper are arranged as follows. Section 2 explains the
necessity of evaluating the benefit for urban open space and cropland with adjacent
NIMBY or YIMBY facilities. Section 3 presents the study area and evaluation model. Sec-
tion 4 explains the data sources and variable selection. Section 5 presents the results and
discusses the evaluation results and implications. The final section concludes this study.
2. The Necessity of Evaluating the Benefit for Open Space or Cropland with Adjacent
NIMBY or YIMBY Facilities
There is no consensus on the definition of open space. It seems reasonable to define
it as a space that is open and accessible; however, the specific types vary by the defini-
tions of particular countries. The most popular types are parks, green lands, rivers, for-
ests, greenbelts, wetlands, public squares, beaches, protected zones, and cropland [26].
The urban growth boundary (UGB) forms under urbanization when urban sprawl in-
vades rural areas. To a certain degree, cropland functions to cut off urban expansion.
Although both urban open space and cropland have living functions, cropland typically
has other functions, such as ecology and production. Among these, food security is en-
sured by the production function of cropland [27]. Its multifunctional value has further
made cropland a crucial cushion space for land planning arrangement [28–30].
This study calls both urban open space and cropland “open space.” Urban open
space and cropland are used separately when necessary. Previous studies of the benefit
evaluation of open space have treated open space alone without taking into account all
types of adjacent NIMBY or YIMBY facilities of open space. Open space and its adjacent
facilities are a new type of open space [13]. Thus, open space with adjacent facilities
might have higher or lower benefits than that without depending on the types of facilities
and/or people’s preference for the facilities. The existence of NIMBY or YIMBY facilities
normally arises from the needs of society. These facilities can be used to segregate all
types of pollutants, as a buffer to reduce risks of different types of damage, or as a space
for greening [17]. Examples include buffer zones along highways, protection areas beside
nuclear waste landfills, cemetery greening, large outdoor squares, and parks. This type of
use makes a facility a substitute for or complement to an open space. In many circum-
stances, it is difficult to know the order of arrival of an open space and a facility. As such,
open space with adjacent NIMBY or YIMBY facilities is treated as a new object [13, 31-32].
Various benefit evaluations regarding open space, including parks, greenbelts,
wetlands, forest conservation areas, and cropland, through housing transactions have
been reviewed by [26]. They evaluated the targeted open space shown as (A) in Figure 1.
The benefit of open space is evaluated as if it has no adjacent NIMBY or YIMBY facilities
or these facilities are neglected either intentionally or unconsciously. The benefit of open
space should be evaluated together with the compounded NIMBY or YIMBY facilities to
reflect the interaction of open space and facilities when housing is located near NIMBY or
YIMBY facilities or within the NIMBY or YIMBY impact radius, such as that shown in (B)
of Figure 1 [13].Preprints (www.preprints.org) | NOT PEER-REVIEWED | Posted: 8 March 2021 doi:10.20944/preprints202103.0235.v1
(B)
(A)
Figure 1. Impact of urban open space or cropland with or without adjacent YIMBY or NIMBY
facilities on housing unit
How does the benefit of open space change when such space has NIMBY or YIMBY
facilities? The answer depends on the implementation of related policies or actions. If
there is a compensation scheme or tax cut for those living close to the NIMBY facility,
such as a cemetery or any type of waste landfill site, this not only increases the acceptance
of residents living nearby but also has high potential to increase the benefit of the original
open space [15, 18]. Similarly, the benefit of urban open space may not be reinforced as
expected with adjacent YIMBY facilities, or damage may result from urban open space
with adjacent YIMBY facilities due to noise, air pollution, and other disturbances during
the construction of a YIMBY facility. To balance the development of rural and urban ar-
eas, locating YIMBY facilities such as public libraries or local culture galleries close to
cropland may be possible. Specific evaluation is required to determine the extent of the
change in benefit for a united open space and NIMBY or YIMBY facility.
3. Results Study Area and Evaluation Model
3.1. Study Area
Kaohsiung City is in southern Taiwan and has been the second-largest municipality
since 1979. There are 38 districts under its administration. The total land acreage of the
city is 2,948 square kilometers, making it the largest municipality in Taiwan in terms of
size. Of this area, urban open space accounts for 36.51 square kilometers, mainly in the
business metropolitan development zone and the industrial new county innovation de-
velopment zone under the NSLPA. The total area of these zones accounts for only 1.24%
of the city’s land area but contains 90% of the population of the city [33].
There are 473.7 square kilometers of cropland spread throughout the other four
development zones. This mainly includes the coastal recreation corridor zone, the port
and harbor value-added planning and management zone, the technology innovation
corridor zone, and the slow, easy lifestyle zone. It is obvious that there is great popula-
tion pressure on the urban district and unbalanced development between the rural and
urban districts. Thus, the city is confronted with a transition issue for further develop-
ment. The size of cropland obviously exceeds that of urban open space. However, no at-
tention has been paid to the existence of cropland, resulting in much cropland being
shifted to other purposes. Illegally switching to manufacturing facilities is the most
common phenomenon, resulting in high-quality cropland mixed with factories. This
causes unexpected pollution damage to the vegetation and makes land planning difficult.Preprints (www.preprints.org) | NOT PEER-REVIEWED | Posted: 8 March 2021 doi:10.20944/preprints202103.0235.v1
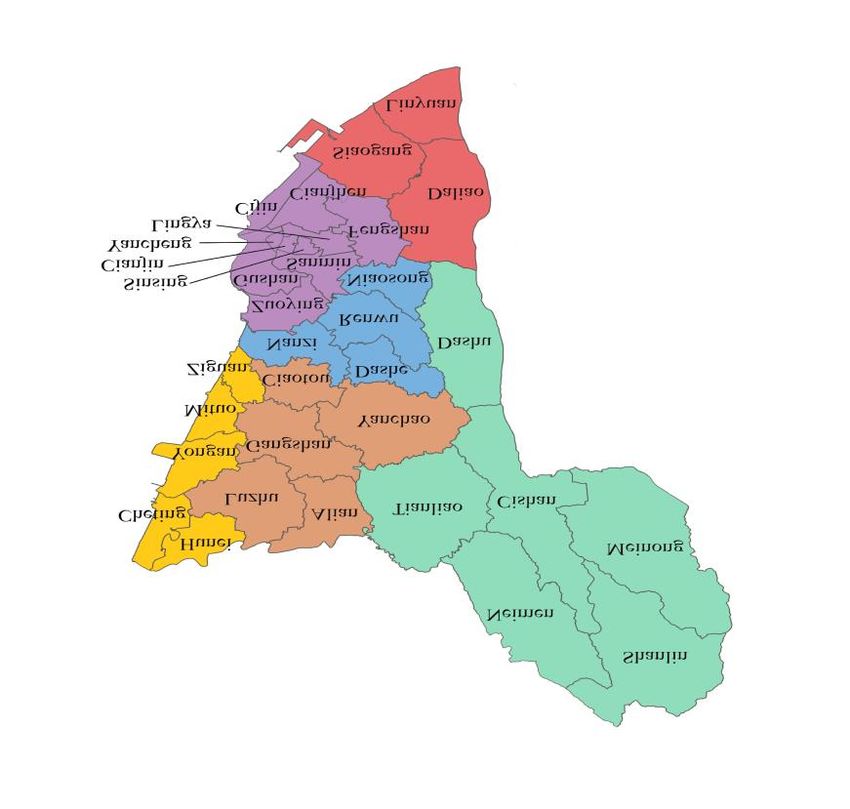
Under the NSLPA guidelines, land planning for Kaohsiung mainly focuses on the
concept of “one core, two centers, and three axes.” “One core” refers to the development
of the economic and business core for the old district of the city. The “two centers” are the
development of the northern part of the city, mainly for living, production and tourism.
The “three axes” refer to forest and agricultural production, industrial innovation, and
coastal value added. The new arrangement of the six new development zones presented
above is shown in Figure 2 [34].
Along with the development of each zone, different types of public facilities have
been promoted and installed by various acts since 1978. These acts encourage
Kaohsiung’s establishment of facilities such as public libraries, cultural institutions, gas
stations, circuit towers and substations, cemeteries, landfills, and sewage treatment fa-
cilities adjacent to urban open space or cropland. YIMBY facilities are normally located in
the core area of an urban division, and NIMBY facilities are on the fringes or outside of an
urban division. Public facilities such as Weiwuying National Kaohsiung Center for the
Arts and various public libraries that have been constructed within the past 10 years are
typical examples.
Slow, easy lifestyle zone
Technology innovation
corridor zone
Coastal recreation
corridor zone
Industrial new county
innovation zone
Port and harbor value-added
planning and management zone
Business metropolitan
living zone
Sources: [35].
Figure 2. Development zones for Kaohsiung under National Spatial Land Planning Act
3.2. Spatial Durbin Hedonic Price Model
Open space has multifunctional value. However, there is no market to reflect the
usage value gained by people. Thus, the value of open space should be evaluated by
nonmarket evaluation methods, such as the commonly used hedonic price method
(HPM). Rosen [36] provided a theoretical background for the HPM, and McConnell and
Walls [26] reviewed many studies of various types of nonmarket goods using the HPM.
The differentiation of housing prices is a composition of the dissimilar characteristics of
housing and its surrounding characteristics. Housing characteristics can be specifically
divided into the structures, surrounding characteristics, and natural or environmental
specialties of housing. Thus, the concept of hedonic price seeks to maximize the utility
function as (1) and thus derive the marginal implicit price of a specific attribute of hous-Preprints (www.preprints.org) | NOT PEER-REVIEWED | Posted: 8 March 2021 doi:10.20944/preprints202103.0235.v1
ing. The utility for a specific consumer k gained from the purchase of a housing unit is
expressed as (1) below:
, (1)
where is the utility k that the consumer gains from purchasing a specific housing
unit. is a vector consumed other than housing, is a vector of housing structures,
is a vector of housing surrounding characteristics, and is a vector of special character-
istics such as NIMBY or YIMBY facilities for a specific housing unit. Under utility maxi-
mization, the equilibrium price of housing i is written as (2):
, (2)
All transacted housing normally has a problem of spatial dependence, either the
existence of autocorrelation or spatial heterogeneity of the independent variable of
housing prices or the dependent variables of all types of housing attributes. The value of
Moran’s I is used to determine the degree of spatial dependence among housing prices
and any housing characteristics , , or , designated as [22, 37]. If there is spatial
dependence for any independent variables, then is the lag for those variables,
denoted as . The spatial Durbin model (SDM) was developed to correct the de-
pendence occurring in both transacted housing prices and any housing characteristics
[22]. is used to explain the spillover effect of independent variables with spatial
dependence. SDM is as in (3) below [22, 38, 39]:
, ., (3)
The definitions of all the variables are the same as those stated above. Additionally,
is a spatial housing price weighted matrix; is its corresponding coefficient; is the
intercept term; , , and are the vectors of coefficients to be estimated for char-
acteristics , , and stated above; and is the error term.
The functional form (3) for SDM can further be rearranged as in equation (4) below:
,
(4)
,
where n is the number of housing units and is a matrix of . The marginal implicit
price for a specific characteristic can be computed from (5). This is equivalent to the
total impact from the change of a specific independent variable k with spatial dependence
on the housing price:
, (5)
If the independent variable is not spatially dependent, then the total impact will be sim-
plified to . The marginal implicit price is treated as an indication of residents’
willingness to pay (WTP) for a specific housing attribute [4, 39, 40].
3.3. Determination of the Impact Radius for Open Space with and without Adjacent NIMBY or
YIMBY Facilities and Other Surrounding Characteristics
The impact radius is used to determine the potential impact of NIMBY or YIMBY
facilities on housing prices. A survey for this distance determination from a study was
done by [12]. Some studies, such as Tsai et al. [10], Lai et al. [41], Wu et al. [39], Xue et al.
[48], and Bai et al. [50] use the acceptable walking distance. However, determination of
the impact radius from the above methods lacks an empirical basis. The local polynomial
regression proposed by a numerical evidence to determine the impact radius for a typical
type of open space with or without NIMBY or YIMBY facilities on a transacted housingPreprints (www.preprints.org) | NOT PEER-REVIEWED | Posted: 8 March 2021 doi:10.20944/preprints202103.0235.v1
unit [25]. Local polynomial regression is a nonparametric analysis method using the
means-square error to have the curve best fit the actual data [42, 43].
Once the impact radius for NIMBY or YIMBY facility f on housing unit A, or
any surrounding housing attribute is determined, the impact of any NIMBY or YIMBY
facility on the housing unit is reflected by a proxy variable . Figure 3. (A) shows
that the impact is the difference between the impact radius of , and the shortest dis-
tance between the housing unit and facility f is . That is, using a NIMBY or YIMBY fa-
cility as an example, a proxy variable representing the impact of a facility is represented
as when the shortest distance is smaller than that of the impact ra-
dius. A facility might reinforce or weaken the impact of open space on housing prices by
its total surrounding open space area. Under such circumstances, failure to take into ac-
count the impact of NIMBY or YIMBY facilities on housing might distort the influence of
open space area on housing prices. On the other hand, when the shortest distance be-
tween the transacted housing unit and the facility is larger than the impact radius, then
the proxy variable of NIMBY or YIMBY, is zero, as shown in Figure 3. (B)
housing A
distance= D f
radius=R
NIMBY or
YIMBY
facility f
radius= R Af
Figure 3. (A) Open space with nonzero proxy variable of NIMBY or YIMBY facilities
for housing unit
distance= D f
housing A
NIMBY or
YIMBY
facility f
radius= R Af
radius=R
Figure 3. (B) Open space with zero proxy variable of NIMBY or YIMBY facilities for housing unit
The longer the shortest distance between a transacted housing unit and an open
space with or without facilities is, the smaller the impact of the facility on the housing
price is. There is no impact once the shortest distance is beyond the impact radius of the
open space with NIMBY or YIMBY facilities. The impact radius is found to be 1,350
meters for the distance between a specific housing unit and urban open space or cropland
and any NIMBY or YIMBY facility. The proxy variable is represented as (6) below:Preprints (www.preprints.org) | NOT PEER-REVIEWED | Posted: 8 March 2021 doi:10.20944/preprints202103.0235.v1
, (6)
where f is the transacted housing unit and A indicates different types of open space with
any NIMBY or YIMBY facility. Different impact boundaries for all other housing charac-
teristics are determined in the same manner as in equation (6). The results are listed in
Table 1.
Table 1. Impact radius between housing unit and different adjacent YIMBY or NIMBY facilities for urban open space and cropland
and surrounding spatial characteristics.
Type of Type of facility Kind of facility Type of open space Impact radius
open space and its adjacent facilities (m)
Adjacent YIMBY or NIMBY facilities
Open Space YIMBY 1. public library urban open space with adjacent 1,000
public libraries
(urban 2. cultural institutions urban open space with adjacent 2,400
open spaces cultural institutions
or NIMBY 3. gas stations, circuit 250
urban open space with adjacent gas
cropland) towers, and substa-
stations, circuit towers, and substations
tions
4. cemetery urban open space with 600
adjacent cemeteries
5. landfill and sewage urban open space with adjacent landfill 2,000
treatment plant and sewage treatment plants
---------- none of above five kinds urban open space without any adjacent 1,350
YIMBY or NIMBY facilities
Housing surrounding characteristics
convenience store number of convenience stores 1,350
public transportation mass rapid transit (MRT) stations 1,500
bus stops and passenger transport stops 950
School primary, junior and senior high schools 1,050
commercial institution commercial banks, post offices 1,900
4. Data Sources, Variable Selection, and Treatments
4.1. Sources of Rransacted Housing Data
To evaluate the benefit of urban open space and cropland with and without NIMBY
or YIMBY facilities, a set of data for housing transactions in Kaohsiung is required. The
data are obtained from the “Web Service of Actual Real Transactions of Real Estate”
prepared by the Ministry of the Interior from August 1, 2012, to June 30, 2018 [44]. The
original data comprise 98,192 transacted housing units with complete attributes required
in the analyses. Among these, 13,460 transactions are deleted because they are not for
residential housing purposes and are the top 1% and bottom 1% housing-price outliers
[24]. The final number of transactions is 84,732. Since all transacted housing prices are the
nominal price of each year, the potential for price inflation must be taken into account.
Thus, all the transacted housing data recorded from August 1, 2012, to June 30, 2018, are
deflected by the housing price index of Kaohsiung in 2016. The advantage of using the
housing price index for Kaohsiung compared to the consumer price index is that the
housing price index reflects the housing differentials among cities.
4.2. Variable Selection and Treatment
Three categories of characteristics have a potential impact on housing prices. One
category is housing structures. This includes the total number of floors of the building,Preprints (www.preprints.org) | NOT PEER-REVIEWED | Posted: 8 March 2021 doi:10.20944/preprints202103.0235.v1
the floor that a specific transacted housing unit is on ( ), the size of the transacted
housing ( ), the age of the transacted housing ( ), the number of living rooms
( ), the number of bathrooms ( ), and whether the housing includes a parking
space ( ) [10, 45]. Previous studies indicate that housing prices vary by the type
of housing [38]. Thus, five types of housing are included: “large building of 10 or more
floors with elevator(s) ( ),” “building of 9 or fewer floors with elevator(s)
( ),” “apartment of 5 or fewer floors without elevator ( ),” “townhouse
( ),” and “studio apartment with one room, one bathroom, and one living room
( ).” The housing age is the difference between the completion date of construction
and the housing transaction date, measured in years.
There are six development zones under Kaohsiung’s NSLPA. Among these six
zones, the business metropolitan living zone is a high-urbanization area. All the other
areas are urban and rural mixed areas and have multiple development nuclei. Thus, the
following analyses are conducted for the business zone as one type with a dummy vari-
able used to represent the housing units located in this zone. In contrast, a
dummy variable for the other five development zones is used as the other
group. The urban open space in these six zones includes urban parks, squares, green
spaces, playgrounds, and gymnasium land use in the urban planning district; recrea-
tional areas in the nonurban planning district and cropland are mainly in the nonurban
planning district [33].
With regard to the category of YIMBY or NIMBY facilities, YIMBY facilities include
public libraries and cultural institutes, while NIMBY facilities include gas stations, circuit
towers and substations, cemeteries, and landfill and sewage treatment plants. All facili-
ties use June 2018 data with TWD97 coordinates for specific locations [46]. With the spa-
tial join tool in geographic information systems (GIS) by ArcMap, the impact radius of
five types of adjacent NIMBY or YIMBY facilities is found for urban open space and
cropland, respectively. The impact radius for a transacted housing unit of 1,350 meters
for either type of open space with any adjacent YIMBY or NIMBY facility is listed in Ta-
ble 1.
Impact boundaries are also determined for all types of housing surrounding spatial
characteristics, i.e., MRT stations ( ); primary, junior, or senior high schools
( ); financial institutions ( ); and bus stops ( ). The impacts of
characteristics surrounding housing are reflected by their proxy variable SP. The ubiq-
uitous convenience stores play various functions in Taiwan. They enable shopping for
goods and serve as a one-stop center for all types of fee payments, cash withdrawals and
deposits, and mail and parcel delivery. Thus, the number of convenience stores belong-
ing to the four largest chains within an impact radius for a specific transacted housing
unit, variable ( ), is measured. The number of convenience stores within 1,350 me-
ters of each transacted housing unit is 28.92. All notations, definitions, and the mean
value of each attribute in the estimation are listed in Table 2.
Table 2. Notations, definitions, and mean values of all the variables used in the estimation.
Variable Definition Mean Standard error
Independent variable
Price transacted housing price (TWD) 8,192,354 7,548,467
Housing structures
Age age of the transacted housing (year) 14.37 12.22
Floor floor of the transacted unit 6.92 4.89
Housearea total transacted area (m2) 149.44 81.16
Hall number of living rooms 1.74 0.61
Bath number of bathrooms 2.11 1.21
Dparking dummy variable, 1 if the transacted housing has
0.386 0.487
a parking space, 0 if not
Dtype1 dummy variable, 1 if housing is a large building 0.561 0.496Preprints (www.preprints.org) | NOT PEER-REVIEWED | Posted: 8 March 2021 doi:10.20944/preprints202103.0235.v1
of 10 or more floors; 0 otherwise
Dtype2 dummy variable, 1 if housing is a large building 0.075 0.263
of 9 or fewer floors; 0 otherwise
Dtype3 dummy variable, 1 if housing is an apartment;
0.052 0.222
0 otherwise
Dtype4 dummy variable, 1 if housing is a townhouse;
0.278 0.448
0 otherwise
Dtype5 dummy variable, 1 if housing is a studio apartment;
0.034 0.181
0 otherwise
Housing surrounding characteristics
SP(MRT) distance, if distance between the transacted housing 421.48 475.35
unit and the nearest MRT station is over 1,100 me-
ters, then SP(MRT)=0; otherwise,
SP(MRT)=(1,500 - the distance between the two) (m)
SP(Bus) distance, if distance between the transacted housing 795.43 148.93
unit and the nearest bus stop is over 950 meters,
then SP(Bus)=0; otherwise, SP(Bus)=(950-the
distance between the two) (m)
SP(Sch) distance, if distance between the transacted housing 623.29 225.70
unit and the nearest primary, junior, or senior high
school is over 1,050 meters, then SP(Sch)=0;
otherwise, SP(Sch)=(1,050-the distance between
the two) (m)
SP(Bank) distance, if distance between the transacted housing 1,456.41 419.58
unit and the nearest commercial institution is over
1,900 meters, then SP(Bank)=0; otherwise,
SP(Bank)=(1,900-the distance between the two) (m)
4cmkt number of convenience stores within a 1,350-meter 28.92 18.52
radius of a transacted housing unit
Dd1 dummy variable, 1 if the zone is a business metro- 0.627 0.484
politan living zone, 0 if not
Dd1’ dummy variable, 1 if the zone is not a business 0.373 0.484
metropolitan living zone, 0 if not
NIMBY and YIMBY facilities
D1 dummy variable, 0 if the distance between the 0.519 0.500
transacted housing unit and the nearest public
library is over 1,000 meters; 1 otherwise
D2 dummy variable, 0 if the distance between the 0.736 0.441
transacted housing unit and the nearest cultural
institution is over 2,400 meters; 1 otherwise
D3 dummy variable, 0 if the distance between the 0.190 0.392
transacted housing unit and the nearest gas station,
circuit tower, or substation is over 250 meters,
1 otherwise
D4 dummy variable, 0 if the distance between the 0.054 0.227
transacted housing unit and the nearest cemetery is
over 600 meters, 1 otherwise
D5 dummy variable, 0 if the distance between the 0.207 0.405
transacted housing unit and the nearest landfill and
sewage treatment plant is over 2,000 meters,
1 otherwise
SP(OS1) proxy variable, if the distance between the 167.15 264.99
transacted housing unit and the nearest urbanPreprints (www.preprints.org) | NOT PEER-REVIEWED | Posted: 8 March 2021 doi:10.20944/preprints202103.0235.v1
open space with adjacent public libraries is over
1,000 meters, then SP(OS1)=0; otherwise,
SP(OS1)=(1,000-distance between the two)(m)
SP(OS2) proxy variable, if the distance between the 1,044.88 823.22
transacted housing unit and the nearest urban
open space with adjacent cultural institutions is
over 2,400 meters, then SP(OS2)=0; otherwise,
P(OS2)=(2,400-distance between the two)(m)
SP(OS3) proxy variable, if the distance between the 17.98 49.92
transacted housing unit and the nearest urban
open space with adjacent gas stations, circuit
towers, and substations is over 250 meters, then
SP(OS3)=0; otherwise
SP(OS3)=(250-distance between the two)(m)
SP(OS4) proxy variable, if the distance between the 10.10 58.75
transacted housing unit and the nearest urban
open space with adjacent cemeteries is over 600
meters, then SP(OS4)=0; otherwise
SP(OS4)=(600-distance between the two) (m)
SP(OS5) proxy variable, if the distance between the 53.67 237.38
transacted housing unit and the nearest urban
open space with adjacent landfills and sewage
treatment plants is over 2,000 meters, then
SP(OS5)=0; otherwise
SP(OS5)=(2,000-distance between the two)(m)
SP(OS6) proxy variable, if the distance between the 1,173.05 176.19
transacted housing unit and the nearest urban
open space without any adjacent NIMBY or
YIMBY facilities is over 1,350 meters, then
SP(OS6)=0; otherwise
SP(OS6)=(1,350-distance the two)(m)
SP(AG1) proxy variable, if the distance between the 7.10 62.06
transacted housing unit and the nearest cropland
with adjacent public libraries is over 1,000 me-
ters, then SP(AG1)=0; otherwise
SP(AG1)=(1,000-distance between the two)(m)
SP(AG2) proxy variable, if the distance between the 16.40 129.12
transacted housing unit and the nearest cropland
with adjacent cultural institutions is over 2,400
meters, then SP(AG2)=0; otherwise
SP(AG2)=(2,400-distance between the two)(m)
SP(AG3) proxy variable, if the distance between the 4.94 26.02
transacted housing unit and the nearest cropland
with adjacent gas stations, circuit towers, and
substations is over 250 meters, then SP(AG3)=0;
otherwise
SP(AG3)=(250-distance between the two)(m)
SP(AG4) proxy variable, if the distance between the 19.22 83.18
transacted housing unit and the nearest cropland
with adjacent cemeteries is over 600 meters, then
SP(AG4)=0; otherwise
SP(AG4)=(600-distance between the two)(m)
SP(AG5) proxy variable, if the distance between the 48.80 219.05Preprints (www.preprints.org) | NOT PEER-REVIEWED | Posted: 8 March 2021 doi:10.20944/preprints202103.0235.v1
transacted housing unit and the nearest cropland
with adjacent landfills and sewage treatment
plants is over 2,000 meters, then SP(AG5)=0;
otherwise
SP(AG5)=(2,000-distance between the two)(m)
SP(AG6) proxy variable, if the distance between the 777.84 434.18
transacted housing unit and the nearest cropland
without adjacent NIMBY or YIMBY facilities is
over 1,350 meters, then SP(AG6)=0; otherwise
SP(AG6)=(1,350- distance between the two)(m)
OSArea Area of urban open space within 1,350-meter 269,524 128,394
radius of a transacted housing unit (m2)
AGArea Area of cropland within 1,350-meter radius of 258,863 457,912
a transacted housing unit (m2)
Note*: The reference housing type is type1, a large building of 10 or more floors.
5. Evaluation Results and Discussion
5.1. Model Specification
The log transformation of dependent housing prices can not only reduce the impact
of extreme values but also reduce possible heteroscedasticity. Moreover, the change in
the transformed variable can be explained as a percentage change to avoid the impact of
different unit measurements [4]. A similar transformation is applied to the independent
variable, the transacted housing price. This is a mixed log-linear function appropriate for
the characteristics of the data [47]. The value of Moran’s I among housing prices is 0.657.
The age of the transacted housing unit ( age ) and townhouse type 4 housing ( )
have a Moran’s I of 0.6. This means that an SDM model in (7) is appropriate for estima-
tion:
(7)
In (7), i indicates the transacted housing unit, is the constant, to are the coeffi-
cients to be estimated, and is the error term. is log housing prices, and
is the corresponding coefficient to be estimated. Similarly, and are
the lag housing age and lag housing type 4 with spatial dependence, and and are
the corresponding coefficients to be estimated for these two lag independent variables.
5.2. Estimation Results and Discussion
5.2.1. Estimated Coefficients
The estimated results of equation (7) are listed in Table 3. Various values for the
fitness of models AIC, SC, LIK, and LR test are significant, which indicates that SDM is a
good fit for the data at hand. The signs for the estimated coefficients of characteristics
surrounding housing, i.e., distance between the transacted housing and the nearest MRT
station ( ), the nearest bus stop ( ), the nearest compulsory school
( ), and the nearest commercial institution ( ), as well as the number ofPreprints (www.preprints.org) | NOT PEER-REVIEWED | Posted: 8 March 2021 doi:10.20944/preprints202103.0235.v1
convenience stores within a buffer of 1,350 meters (4cmkt) all have positive and signifi-
cant estimated coefficients.
As with the significance level of estimated coefficients for NIMBY or YIMBY facili-
ties, the relevant attributes of this study located in different development zones are sig-
nificantly different from zero at different significance levels, with the exception of six
impact boundaries of housing with an adjacent NIMBY or YIMBY facility or the size of
cropland-type open space in a business metropolitan living zone. This result reveals that
it is essential to take into account NIMBY or YIMBY facilities by evaluating either urban
open space or cropland.
Table 3. Results of coefficient estimations.
Variable Estimated coefficient Standard error Wald
W_lnprice 0.380802 *** 0.00295878 16564.46221
Constant 5.42347 *** 0.0413948 17165.71632
Age -0.0145034 *** 0.00017247 7071.53174
W_age 0.00673155 *** 0.000224525 898.87835
Floor 0.000817 *** 0.00022822 12.81554
Lnhousearea 0.697074 *** 0.00328231 45102.29113
Hall 0.00818594 *** 0.00168727 23.53802
Bath 0.021167 *** 0.00111042 363.36366
Dparking 0.126596 *** 0.00253552 2492.91503
Dtype2 -0.0716361 *** 0.00382786 350.22877
Dtype3 -0.0729824 *** 0.00497689 215.04170
Dtype4 0.688532 *** 0.00523398 17305.40251
W_Dtype4 -0.436791 *** 0.00610564 5117.82852
Dtype5 -0.12578 *** 0.00573284 481.37676
[lnSP(MRT)]2 0.000852354 *** 0.0000639 178.03565
[lnSP(Bus)]2 0.0005404 *** 0.000192939 7.84498
[lnSP(Sch)]2 0.0017423 *** 0.000130488 178.27857
[lnSP(Bank)]2 0.00226029 *** 0.000136898 272.60652
4cmkt 0.00249478 *** 0.0001 622.43763
lnSP(OS1)xDd1 0.000162892 ** 0.0000765 4.52975
lnSP(OS2)xDd1 0.00154519 *** 0.000084 338.61888
lnSP(OS3)xDd1 -0.000510479 *** 0.000132088 14.93583
lnSP(OS4)xDd1 0.0000571 0.000176872 0.10436
lnSP(OS5)xDd1 -0.00258501 *** 0.000489612 27.87534
lnSP(OS6)xDd1 0.00566217 *** 0.000483972 136.87596
lnOSAreaxDd1 0.00184148 *** 0.000157554 136.60701
D1xlnOSAreaxDd1 0.000191414 *** 0.0000322 35.37406
D2xlnOSAreaxDd1 -0.000258577 ** 0.00010281 6.32563
D3xlnOSAreaxDd1 0.0000332 0.0000336 0.97462
D4xlnOSAreaxDd1 0.00155578 *** 0.000413608 14.14881
D5xlnOSAreaxDd1 -0.000711574 *** 0.0000577 151.96972
lnSP(OS1)xDd1’ -0.000217308 ** 0.000098 4.91261
lnSP(OS2)xDd1’ -0.00146097 *** 0.000187439 60.75205
lnSP(OS3)xDd1’ -0.00039787 *** 0.000089 19.96436
lnSP(OS4)xDd1’ -0.000349813 *** 0.000122927 8.09795
lnSP(OS5)xDd1’ -0.00461275 *** 0.000273059 285.37007
lnSP(OS6)xDd1’ -0.0031219833 *** 0.000317801 96.504689
[lnOSArea]2xDd1’ 0.00285553 *** 0.000106547 718.27752
D1x[lnOSArea]2xDd1’ 0.000296407 *** 0.0000847 12.26022
D2x[lnOSArea]2xDd1’ 0.000446687 *** 0.0000777 33.08827Preprints (www.preprints.org) | NOT PEER-REVIEWED | Posted: 8 March 2021 doi:10.20944/preprints202103.0235.v1
D3x[lnOSArea]2xDd1’ 0.000082 0.0000848 0.934138
D4x[lnOSArea]2xDd1’ -0.00101559 *** 0.000123326 67.81499
D5x[lnOSArea]2xDd1’ 0.0001843 ** 0.0000921 4.00656
lnSP(AG3)2xDd1 0.000904528 *** 0.000189711 22.73316
lnSP(AG4)2xDd1 -0.00410063 *** 0.000555846 54.42426
lnSP(AG5)2xDd1 0.00223932 *** 0.000523593 18.29127
lnSP(AG6)2xDd1 0.000100029 0.000156611 0.40795
[lnAGArea]xDd1 0.0000216 0.000130005 0.02768
D1x[lnAGArea]2xDd1 -0.000498222 *** 0.0000565 77.69100
D2x[lnAGArea]2xDd1 0.0000398 0.000127886 0.09706
D3x[lnAGArea]2xDd1 -0.000195437 *** 0.00006 10.597890
D4x[lnAGArea]2xDd1 -0.00208824 *** 0.000526233 15.74725
D5x[lnAGArea]2xDd1 0.000768678 *** 0.0000855 80.83592
[lnSP(AG1)]2xDd1’ -0.000329351 *** 0.000178985 3.38597
[lnSP(AG2)]2xDd1’ 0.00147316 *** 0.000431797 11.63967
[lnSP(AG3)]2xDd1’ 0.000209611 ** 0.000102502 4.18178
[lnSP(AG4)]2xDd1’ 0.00034216 *** 0.000107654 10.10185
[lnSP(AG5)]2xDd1’ 0.000627666 ** 0.000298592 4.41878
[lnSP(AG6)]2xDd1’ 0.00429081 *** 0.000355042 146.05448
[lnAGArea]2xDd1’ -0.000603765 *** 0.0000931 42.04718
D1x[lnAGArea]2xDd1’ -0.000332436 *** 0.0000755 19.40138
D2x[lnAGArea]2xDd1’ -0.000277935 *** 0.000067 17.18268
D3x[lnAGArea]2xDd1’ -0.0000922 0.00008 1.32646
D4x[lnAGArea]2xDd1’ 0.000485701 *** 0.0000813 35.71807
D5x[lnAGArea]2xDd1’ 0.000218882 *** 0.0000765 8.19019
R2 0.89
AIC 12,083.60
SC 12,691.2
LIK -5,976.8
Note: Numbers with *, **, and *** indicate that the estimated coefficients are significantly different from zero at 10%, 5%, and 1%
significance levels, respectively.
5.2.2. Marginal Benefit of Surrounding Total Area for Housing Units in Each Zone
Since the boundary impacts of NIMBY or YIMBY facilities on housing prices have
been determined by local polynomial regression, it is meaningful to estimate the mar-
ginal and total benefit for the area surrounding a housing unit for urban open space or
cropland in any development zone. For instance, the marginal benefit for urban open
space in a business metropolitan living zone (BMLZ) without accounting for NIMBY or
YIMBY facilities is computed as in (8):
, (8)
where is the average housing price measured in TWD and is the
average area of urban open space within a 1,350-meter radius of a transacted housing
unit in a BLMZ. Marginal benefit for urban open space with and without all other
NIMBY and YIMBY facilities in a BMLZ can be computed consequently. A similar ap-
proach is used for cropland with and without the same facilities in the other five devel-
opment zones, i.e., the nonbusiness metropolitan living zone (NBMLZ).
The results show that within a 1,350-meter radius of a specific housing unit, the
housing prices will increase TWD 2.20 and TWD 3.78 for a one-square-meter increase of
urban open space in a BMLZ and NBMLZ without an adjacent YIMBY or NIMBY facility.
They are shown as shaded orange and blue bars with numerical circles in squares inPreprints (www.preprints.org) | NOT PEER-REVIEWED | Posted: 8 March 2021 doi:10.20944/preprints202103.0235.v1
Figure 4. The same procedure is conducted to compute the marginal benefit within a
1,350-meter radius of a specific housing unit for cropland-type open space. The marginal
benefit is TWD 0.14 and the marginal damage TWD 0.28 for a one-square-meter increase
in cropland in the BMLZ and NBMLZ, respectively; these are shown as green and yellow
bars with numerical circles in squares in Figure 4.
Figure 4. Marginal benefit/marginal harm for urban open space and cropland with/without
NIMBY or YIMBY facility in BMLZ or NBMLZ
The above four magnitudes are used as references to compare the marginal benefit
or marginal harm for either urban or cropland-type open space, accounting for adjacent
YIMBY or NIMBY facilities in the BMLZ or NBMLZ. The urban open space and adjacent
YIMBY libraries and cultural institutions generate 5 marginal benefits or marginal harms
in the BMLZ and NBMLZ, respectively. Similarly, NIMBY facilities such as cemeteries,
gas stations, circuit towers and substations, and landfills and sewage treatment plants
generate the other 5 different marginal benefits or marginal harms in the BMLZ and
NBMLZ, respectively. The marginal benefit and marginal harm for urban open space and
cropland with and without accounting for the NIMBY or YIMBY facilities in the BMLZ
and NBMLZ form four groups, as shown in Figure 4.
In addition to the reference bar for each group, each group of other bars represents
the marginal benefit or marginal harm for urban-type or cropland-type open space in the
BMLZ and NBMLZ, accounting for the adjacent YIMBY or NIMBY facility. The bar lo-
cated on the right-hand side of each reference bar indicates that the marginal benefit is
overestimated, or the marginal harm is underestimated without accounting for the adja-
cent NIMBY or YIMBY facilities. Taking the group of blue-colored bars as an example,
the marginal benefit is overestimated by 0.31 (0.22-1.89) when it fails to account for this
type of adjacent YIMBY facility for urban open space in the BMLZ. All the other groups
have similar explanations as above. A purple horizontal line is drawn on the top of the
reference bar for each group. This makes it easy to observe the amount of underestima-
tion or overestimation when the adjacent YIMBY or NIMBY facility is ignored in the
evaluation.
It is abnormal to have a higher marginal benefit for urban open space with adjacent
cemeteries. This is because Kaohsiung’s government has restructured the appearance of
the city to promote travel and tourism and has better utilization of land resources since
the 2010 merger of old Kaohsiung City and Kaohsiung County into a municipal city.Preprints (www.preprints.org) | NOT PEER-REVIEWED | Posted: 8 March 2021 doi:10.20944/preprints202103.0235.v1
Thus, the reallocation of public cemeteries proceeded until June 2018. Among 165 public
cemetery sites, 132 are prohibited from being used as burial places and are arranged as
parks [49]. This makes housing purchasers expect that these lands will become large
parks or even forest parks. Urban open space with adjacent cultural institutions has
lower marginal benefit than space without such entities. This may arise from a higher
preference for cultural institutions per se rather than adjacent facilities within an urban
open space.
The results also indicate that although residents view housing surrounded by
cropland as negative, the type of open space with adjacent NIMBY facilities, such as
cemeteries or landfills and sewage treatment plants, will reduce the harm. That is, com-
pared to cemeteries or landfills and sewage treatment plants adjacent to cropland, the
harm caused by pure cropland is lesser. On the other hand, when cropland has YIMBY
adjacent libraries or cultural institutions, this makes the harm greater than that caused by
cropland only. This indicates that it is difficult to increase the benefit of libraries or cul-
tural institutions on cropland.
5.3. Total Benefit of Urban Open Space or Cropland with Different Adjacent NIMBY or YIMBY
Facilities in Each Zone
According to the marginal benefit or harm listed in Figure 4, the total benefit for
urban open space and cropland with and without accounting for an adjacent NIMBY or
YIMBY facility for the BMLZ and NBMLZ can be computed. It can be observed from
Table 4 that the total benefit for the business metropolitan living zone in the BMLZ is
overestimated and the total harm for the slow, easy lifestyle zone in the NMBLZ are
underestimated when we do not account for adjacent NIMBY or YIMBY facilities. This
indicates that the allocation of NIMBY or YIMBY facilities in these two zones is inap-
propriate as the benefit of urban open space with either adjacent type of facility will be
reduced and the harm of cropland with either adjacent type of facility will be increased.
For the other four zones, i.e., the NMBLZ, the total benefit is underestimated if an adja-
cent NIMBY or YIMBY facility is ignored within the impact radius of the transacted
housing unit. The NIMBY or YIMBY facilities allocated in the NMBLZ will then increase
the total benefit of the open space within 1,350 meters surrounding the transacted hous-
ing unit.Preprints (www.preprints.org) | NOT PEER-REVIEWED | Posted: 8 March 2021 doi:10.20944/preprints202103.0235.v1
Table 4. Total benefit of urban open space and cropland with and without different kinds of adjacent NIMBY or YIMBY facilities in different development zones
Total benefit of development zone (TWD)*
Open space with adjacent NIMBY
or YIMBY facilities industrial new coastal recrea- port and harbor val- slow, easy
business metropol- technology innova-
county innovation tion corridor ue-added planning and lifestyle
itan living zone tion corridor zone
zone zone management zone zone
Total benefit to urban open space 31,462,289,750 3,675,981,027 15,419,698,934 870,540,368 6,010,662,344 244,199,550
with different adjacent NIMBY or
YIMBY facilities (A)
Total benefit to urban open space 36,639,888,325 3,093,113,393 13,558,856,766 823,638,604 5,601,991,546 228,726,589
without accounting for adjacent
NIMBY or YIMBY facilities (B)
Total benefit to cropland with dif- 4,717,086,912 -1,757,428,220 -1,485,208,316 -455,309,289 -2,014,279,094 -356,700,483
ferent adjacent NIMBY or YIMBY
facilities (C)
Total benefit to cropland without 366,889,179 -1,448,016,809 -1,266,972,606 -600,895,200 -1,758,955,565 -315,929,200
accounting for adjacent NIMBY or
YIMBY facilities (D)
Total benefit to urban open space 36,179,376,662 1,918,552,807 13,934,490,618 415,231,079 3,996,383,259 -112,500,933
and cropland with different adja-
cent NIMBY or YIMBY facilities
(E)=(A)+(C)
Total benefit to urban open space 37,006,777,504 1,645,096,584 12,291,884,160 222,743,404 3,843,035,981 -87,202,611
and cropland without different ad-
jacent NIMBY or YIMBY facilities
(F)=(B)+(D)
Note*: The exchange rates for US$ to TWD on December 31 in 2012, 2013, 2014, 2015, 2016, 2017 and June 30 in 2018 were, respectively, 29.05, 29.89, 31.61, 32.87, 32.43, 29.71, and
30.51. The average exchange range for these seven years was approximately 30.87.Preprints (www.preprints.org) | NOT PEER-REVIEWED | Posted: 8 March 2021 doi:10.20944/preprints202103.0235.v1
5.4. Share of total benefit or harm for open space to the average housing price
Computing the benefit for urban open space and cropland to the average housing
price in each zone indicates how much open space is worth for each transacted housing
unit. The average benefit of open space for each housing unit in a BMLZ is approximately
TWD 681,000. This represents 7.43% of the average housing price in a highly urbanized
and active business zone. The average benefit is also computed for the NBMLZ, and the
results are shown in Table 5.
The slow, easy lifestyle zone has a negative total benefit of open space and cropland,
i.e., total harm of TWD 70,000, or 1.87% of the average housing price in this zone. The
average benefit of urban open space and cropland to the average housing price for the
other four zones is positive except for the slow, easy lifestyle zone. These results indicate
that the average benefit of the total area of surrounding urban open space and cropland
within the impact radius with adjacent NIMBY or YIMBY facilities accounts for 2.95% to
13.80% of the average housing price. Surrounding NIMBY or YIMBY facilities indeed
increase or decrease the benefit of open space.
Table 5. Share of benefit or harm with adjacent NIMBY or YIMBY facilities for the average housing price in each different zone
Development zone Number of trans- Average hous- Total benefit for Average benefit or
acted housing ing price open space with harm for each
units (TWD per adjacent NIMBY or housing unit with
housing unit) YIMBY facilities for adjacent NIMBY or
each zone (TWD) YIMBY facilities
(TWD per housing
unit)*
(A) (B) (C) (D)=(C)/(A)
Business metropolitan 53,129 9,160,854 36,179,376,662 680,972
living zone (7.43%)
Technology innovation 5,658 7,708,265 1,918,552,807 339,087
corridor zone (4.40%)
Industrial new county 13,950 7,240,300 13,934,490,618 998,888
innovation zone (13.80%)
Coastal recreation 2,602 5,409,910 415,231,079 159,582
corridor zone (2.95%)
Port and harbor val- 7,795 5,482,790 3,996,383,250 512,685
ue-added planning and (9.35%)
management zone
Slow, easy lifestyle zone 1,598 3,765,386 -112,500,934 -70,401
(1.87%)
Note *: Number in parentheses is the share of benefit or harm per housing unit in each zone.
6. Conclusions
This is the first study to comprehensively evaluate the benefit or harm to urban-type
and cropland-type open space associated with different types of adjacent NIMBY or
YIMBY facilities. The urbanized zone in Kaohsiung shows that without accounting for
these adjacent facilities, the total benefit is overestimated for urban-type open space and
underestimated for cropland-type open space. Moreover, the total benefit for areas with
mixed urban-type and cropland-type open space will be higher if their adjacent NIMBY
or YIMBY facilities are accounted for. The situation is reversed because the total
cropland-type open space accounts for more than 80% in the zone. The results suggestPreprints (www.preprints.org) | NOT PEER-REVIEWED | Posted: 8 March 2021 doi:10.20944/preprints202103.0235.v1
that NIMBY or YIMBY facilities located in an area with a larger share of urban-type open
space will significantly increase the positive impact of YIMBY facilities and mitigate the
negative impact of NIMBY facilities. These results serve as a guideline for further ar-
rangement of different NIMBY or YIMBY facilities in each zone with different propor-
tions of urban-type and cropland-type open space in the city.
From the viewpoint of the individual housing unit, the total harm for cropland-type
open space with an adjacent NIMBY or YIMBY facility is equivalent to 1.87% of the av-
erage housing price for areas with a high percentage of cropland. The total benefit for
urban-type open space with adjacent NIMBY or YIMBY facilities is equivalent to 7.43% of
the average housing price for highly urbanized areas. In comparison, the total benefit
accounts for 2.95%-13.80% of the average housing price for areas with mixed urban-type
and cropland-type open space. This clearly indicates that failure to account for either
type of open space with adjacent NIMBY or YIMBY facilities will result in the overesti-
mation or underestimation of housing prices by a substantial amount, especially given
high average housing prices in Taiwan.
Author Contributions: Conceptualization, Wun-Jheng Wu and Pei-Ing Wu; methodology, Wun-Jheng
Wu; software, Wun-Jheng Wu; validation, Je-Liang Liou; formal analysis, Wun-Jheng Wu and Pei-Ing
Wu; investigation, Wun-Jheng Wu; resources, Pei-Ing Wu; data curation, Wun-Jheng Wu; writ-
ing—original draft preparation, Pei-Ing Wu; writing—review and editing, Je-Liang Liou; visuali-
zation, Je-Liang Liou; supervision, Pei-Ing Wu; project administration, Pei-Ing Wu; funding acqui-
sition, Pei-Ing Wu. All authors have read and agreed to the published version of the manuscript.
Funding: This research was funded by the Ministry of Science and Technology, Taiwan (MOST) under
Grant No. MOST 106-2410-H-002-204-MY2.
Data Availability Statement: Data is not publicly available, though the data may be made availa-
ble on request form the corresponding author.
Conflicts of Interest: The authors declare no conflict of interest.
References
1. Bomans, K.; Dewaelheyns, V.; Gulinck, H. Pasture for horses: An underestimated land use class in an urbanized and multi-
functional area. Int. J. Sust. Dev. Plan. 2011, 6(2), 195–211.
2. Department of Economic and Social Affairs of the United Nations. The Sustainable Development Goals Report 2018, United
Nations, New York. Available online: https://unstats.un.org/sdgs/report/2018/goal-11/ (accessed on 20 December 2020).
3. Luttik, J. The value of trees, water and open space as reflected by house prices in the Netherlands. Landscape Urban Plan. 2000,
48, 161–167.
4. Melichar, J.; Kaprová, K. Revealing preferences of Prague's homebuyers toward greenery amenities: The empirical evidence of
distance–size effect. Landscape Urban Plan. 2013, 109(1), 56–66.
5. WHO Regional Office for Europe. Urban Green Spaces and Health, Copenhagen: WHO Regional Office for Europe. Available
online:
http://www.euro.who.int/__data/assets/pdf_file/0005/321971/Urban-green-spaces-and-health-review-evidence.pdf?ua=1(acces
sed on 22 November 2020).
6. Foster, S.; Giles-Corti, B.; Knuiman, M. Does fear of crime discourage walkers? A social-ecological exploration of fear as a de-
terrent to walking. Environ. Behav. 2014, 46(6), 698–717.
7. Geoghegan, J. The value of open spaces in residential land use. Land Use Policy. 2002, 19(1), 91–98.
8. Kuminoff, N.V. Using a bundled amenity model to estimate the value of cropland open space and determine an optimal buffer
zone. J. Agr. Resour. Econ. 2009, 43(1), 68–90.
9. Rogus, S.; Dimitri, C. Agriculture in urban and peri-urban areas in the United States: highlights from the census of agriculture.
Renew. Agr. Food Syst. 2015, 30(1), 64–78.
10. Tsai, M-K.; Wu, P.-I.; Liou, J.-L. Spatial hedonic quantile Durbin model for benefit evaluation of diversified open spaces in
urban planning division in Taoyuan City. J. City and Plan. 2019, 46(4), 297–341.
11. Jones, M.; Reed, R.G. Open space amenities and residential land use: An Australian perspective. Land Use Policy. 2018, 75, 1–10.
12. Brown, G.; Glanz, H. Identifying potential NIMBY and YIMBY effects in general land use planning and zoning. Appl. Georg.
2018, 99, 1–11.
13. Pauleit, S.; Ambrose-Oji, B.; Andersson, E.; Anton, B.; Buijs, A.; Haase, D.; Elands, B.; Hansen, R.; Kowarik, I.; Kronenberg, J.;
Mattijssen, T.; Olafsson, A.S.; Rall, E., van der Jagt, A.P.N.; van den Bosch, C.K. Advancing urban green infrastructure in Eu-
rope: Outcomes and reflections from the GREEN SURGE project. Urban for. Urban Gree. 2019, 40, 4–16.
14. Maxwell, N.K. Libraries? –Yes, in My Backyard! J. Access Ser. 2008, 5(3), 391–396.You can also read


