Large-Format Bipolar and Parallel Solid-State Lithium-Metal Cell Stacks: A Thermally Coupled Model-Based Comparative Study - IOPscience
←
→
Page content transcription
If your browser does not render page correctly, please read the page content below
Journal of the Electrochemical
Society

OPEN ACCESS

Large-Format Bipolar and Parallel Solid-State Lithium-Metal Cell Stacks:
A Thermally Coupled Model-Based Comparative Study
To cite this article: Mei-Chin Pang et al 2020 J. Electrochem. Soc. 167 160555

View the article online for updates and enhancements.

                               This content was downloaded from IP address 46.4.80.155 on 30/01/2021 at 22:50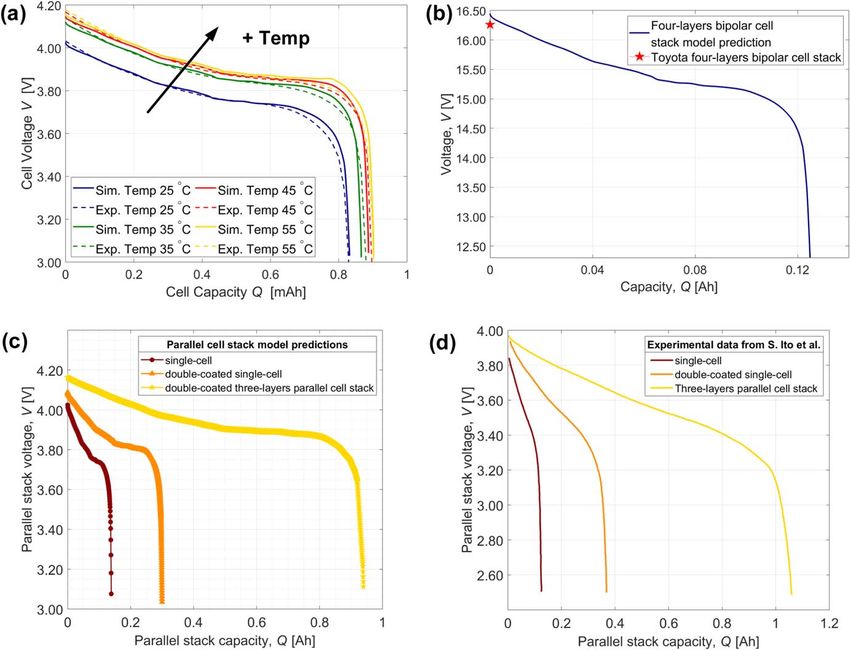
Journal of The Electrochemical Society, 2021 167 160555

                                Large-Format Bipolar and Parallel Solid-State Lithium-Metal Cell
                                Stacks: A Thermally Coupled Model-Based Comparative Study
                                Mei-Chin Pang,1 Youxiu Wei,2,3 Huizhi Wang,1                                Monica Marinescu,1                  Yue Yan,2,3 and
                                Gregory J. Offer1,z
                                1
                                  Department of Mechanical Engineering, Imperial College London, Exhibition Road, South Kensington Campus, London,
                                SW7 2AZ, United Kingdom
                                2
                                  Beijing Institute of Aeronautical Materials (BIAM), P.O. Box 81-83, Beijing 100095, People’s Republic of China
                                3
                                  Beijing Engineering Research Centre of Advanced Structural Transparencies for the Modern Traffic System, P.O. Box 81-
                                83, Beijing 100095, People’s Republic of China

                  Despite the potential of solid electrolytes in replacing liquid electrolytes, solid-state lithium-metal batteries have not been commercialised
                  for large-scale applications due to manufacturing constraints. In this study, we demonstrate that the desired energy and power output for
                  large-format solid-state lithium-metal batteries can be achieved by scaling and stacking unit cells. Two stack configurations, a bipolar and
                  a parallel stack are modelled and compared. With 63 cells stacked in series, we show that a bipolar stack could reach a stack voltage up to
                  265 V. In contrast, a parallel stack with 32 double-coated cells could achieve a nominal capacity of 4 Ah. We also demonstrate that the
                  choice of current collectors is critical in determining the gravimetric power and energy density of both stacks. By coupling the
                  electrochemical stack model thermally, we show that the Joule heating effects are negligible for bipolar stacks but become dominant for
                  parallel stacks. Bipolar stacks are better due to their higher power and energy densities and lower heat generation, but a lower Coulombic
                  stack capacity limits their performance. In contrast, parallel stacks generate more heat and require more advanced thermal management.
                  These thermally-coupled stack models can be used as prototypes to aid the future development of large-format solid-state batteries.
                  © 2021 The Author(s). Published on behalf of The Electrochemical Society by IOP Publishing Limited. This is an open access
                  article distributed under the terms of the Creative Commons Attribution 4.0 License (CC BY, http://creativecommons.org/licenses/
                  by/4.0/), which permits unrestricted reuse of the work in any medium, provided the original work is properly cited. [DOI: 10.1149/
                  1945-7111/abd493]

                  Manuscript submitted August 20, 2020; revised manuscript received November 23, 2020. Published January 14, 2021.

    The research on inorganic Solid Electrolyte (SE) such as sulfide-                        demonstrate in this study that the choice of CC is critical in
and oxide-based electrolytes has been gaining significant momentum                           optimising the stack performance.
due to the non-flammable features of the electrolytes.1–5 Compared to                            While the heat generation in a single-layer cell is insignificant due to
the combustible aprotic organic electrolytes, solid-state Li-metal                          the large surface-to-volume ratio, the impacts of heat generation in a
batteries provide potential solutions to the critical safety issues faced                   stack can be significant and affect the stack performance. Toyota has
by conventional Li-ion batteries such as thermal runaway.6 However,                         confirmed that their prototyped all-solid-state stack can be operated at a
solid-state Li-metal batteries have not been implemented for large-scale                    temperature of 100 °C.9 The effects of such high operating temperature
applications such as powertrain electrification due to scaling and                           on the internal heat generation and electrochemical stack performance
manufacturing limitations.7,8 Capacity of a single-layer cell is insuffi-                    of the bipolar and parallel configurations have not been studied.
cient to meet the power demands. Overcoming the up-scaling and                              Recently, Bock et al.12 proposed an analytical stack model comprising
manufacturing barriers is, therefore, an absolute prerequisite to enable                    of 24 cells to study the temperature distribution at the stack centre and
the large-scale applications of solid-state Li-metal batteries.                             outer boundary. However, the analytical thermal model was not
    One possible method to increase the total power and energy output                       coupled with the electrochemical model. As a result, the values for
of solid-state Li-metal batteries is to scale and stack each unit cell in                   the heat sources used in the thermal model were not calculated from the
series or in parallel. In series stacking each unit cell is connected by the                electrochemical model, and the stack performance also did not account
Bipolar Plates (BP), whereas in a parallel stacking the Current                             for the impacts of heat generations. We address this gap by proposing a
Collectors (CC) and tabs of each unit cell are connected together to                        coupled electrochemical stack model with a two-dimensional thermal
form a stack. Toyota built the prototype of bipolar solid-state cell stack                  model, enabling the comparison of the heat generation and temperature
and showed that it is possible to obtain a maximum voltage of 16.26 V                       gradients for stacks of different configurations.
by stacking four layers of single unit cells.9 Gambe et al.10 have
also developed a bipolar stack based on quasi-solid-state electrolyte                                                    Model Development
and demonstrated a stack voltage experimentally up to 12 V. Ito
et al.11 have constructed a parallel solid-state cell stack by stacking                         Temperature-dependent single-layer cell model.—The one-dimen-
three double-coated unit cells to achieve a capacity of 1 Ah.                               sional single-layer model developed by Offer et al.13 was improved to
    While bipolar and parallel stack configurations have been                                provide a framework to study the effects of different operating
proposed and measured experimentally, no systematic comparison                              temperatures on the heat generations. Figure 1 illustrates the model
between these two configurations is available in terms of their                              domain of a single-layer cell. The temperature dependence is included
advantages and limitations. By identifying the scaling factor from a                        in the following parameters: the Open-Circuit Potential (OCP) of the
system of dimensionless governing equations, we propose a model-                            cell, ionic conductivity in the SE, exchange current densities at the
based approach to study the effects on performance from upscaling                           electrode-electrolyte interfaces and solid diffusion in the Positive
parallel and bipolar stacks. Based on the Ragone analysis, we                               Electrode (PE). Secondly, due to the relatively small surface over-
compare the volumetric as well as the gravimetric energy and power                          potential at the Negative Electrode (NE) and SE interface,13 the
densities of both stack profiles. The impact of CC in a single-layer                         Butler-Volmer expression describing the kinetics at this interface is
cell is negligible due to their high electronic conductivity and                            linearised to14,15
negligible mass. However, as the number of unit cells in the stack
                                                                                                                                     (a a + a c ) F
increases, the mass and volume ratio of the CC can play a significant                                              i = i 0,neg (T )                  hneg            [1]
role in determining the stack’s energy and power density. We                                                                             Rgas T

                                                                                            where i0,neg (T ) is the temperature-dependent exchange current density
  z
      E-mail: gregory.offer@imperial.ac.uk                                                  at the NE interface, αa and αc are the charge-transfer coefficient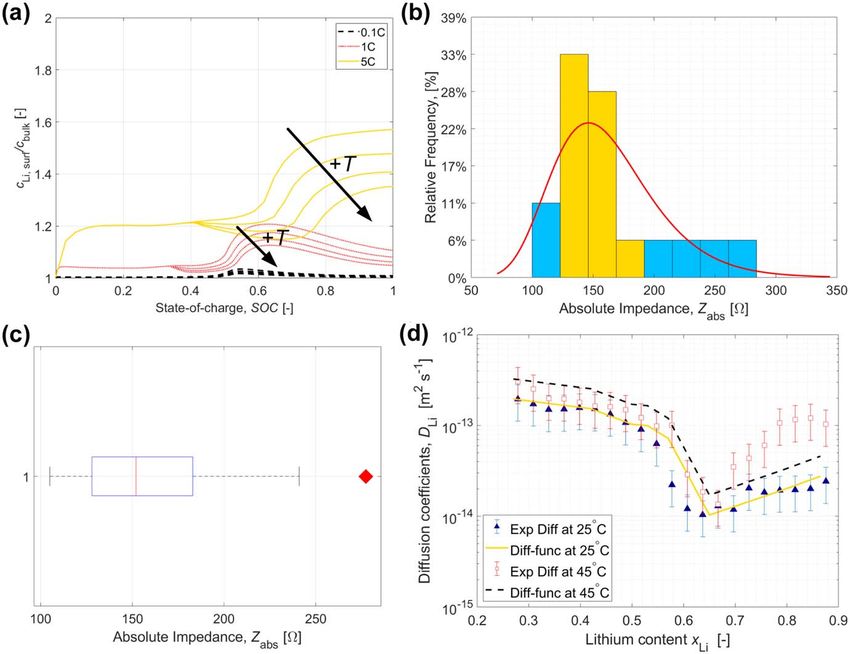
Journal of The Electrochemical Society, 2021 167 160555

(αa = αc = 0.5), F is the Faraday’s constant (F = 96, 485 C mol−1),
Rgas is the universal gas constant (Rgas = 8.314 J K−1 mol−1), T [K] is
the average temperature evaluated from the two-dimensional thermal
model and ηneg is the overpotential at the NE interface.
    The overpotential at the PE side is higher than that at the NE
interface.13 Therefore, the kinetics can be considered as irreversible,
represented here by the Tafel equation14,15

                              ⎛ c Li,surf ⎞     ⎛ -ac Fh pos ⎞
            i = -i 0,pos (T ) ⎜           ⎟ exp ⎜            ⎟,         [ 2]
                              ⎝ c bulk ⎠        ⎝ Rgas T ⎠

where i0,pos is the concentration and temperature-dependent ex-
change current density, given by:

                            ⎛ c LCO,max - c bulk ⎞0.5 ⎛ c bulk ⎞0.5
      i 0,pos = Fk pos (T ) ⎜                    ⎟ ⎜           ⎟        [3]
                            ⎝     c LCO,max      ⎠ ⎝ c LCO,max ⎠

    The exchange current density can be defined as the current density
at equilibrium, under which the rate of the forward reaction is equal to
the rate of the backward reaction.14 Therefore, cbulk represents the
average bulk Li concentration and can be calculated by averaging the
concentration distribution within the PE domain (c bulk = cLi ).
However, as the current density described by the Tafel’s equation is            Figure 1. Illustration of the temperature-dependent single-layer model
irreversible, the inclusion of concentration-dependence to the PE               domain in the z-direction, where z denotes the spatial variation, t represents
kinetics should be further assessed by comparison to additional                 time, T indicates the temperature dependence and cLi represents the
experiments in the future. cLCO,max is the theoretical molar density            concentration of Li+ in the PE. The dashed lines and empty circles indicate
                                                                                the open-circuit states, whereas the red solid lines and filled circles denote
of the LiCoO2PE (cLCO,max = 51599.06 mol m-3).13 kpos is the tem-               the computational states under load. The potential differences due to
perature-dependent rate-constant (see Appendix A), and ηpos is the              interfacial charge-transfer kinetics are given by ΔUneg and ΔUpos. φelec
overpotential at the PE-SE interface. The term (cLi,surf/cbulk) in Eq. 2        denotes the electrolyte potential, whereas φneg and φpos represent the NE
accounts for the contribution of the concentration gradient due to the          and PE electrode potentials, respectively. ULi is the equilibrium potential of
diffusion in the PE to the rate of Li flux between the SE and the PE.            Li-metal.
Figure A·1a in Appendix A compares this ratio for three current
densities (0.1C, 1C and 5C). For low current densities (⩽1C), this term
can be approximated as unity. The flux of Li between the SE and the                  In a bipolar stack, each unit cell is connected in series through the
PE is driven predominantly by the charge-transfer reaction. However,            BP, with the PE material coated to one side of the plate and the NE
as the current densities increase, the rate of Li flux is controlled by          material coated to the opposite side of the plate. An electrical insulator
both charge-transfer and diffusion mechanisms, and the contribution             such as the fluoroelastomer seal is used to separate the adjacent BP from
of the solid concentration gradient cannot be neglected.                        a direct contact and to prevent an internal short-circuit.18,21 In addition,
    A summary of the modified governing equations can be found in                the BP must be free from pinholes to prevent a short between the
Appendix A. The model predictions for the single-layer cell with                electrode materials on both sides.18,22 However, the BP must have high
temperature-dependent parameters were first compared with the                    electronic conductivity to allow the flow of electrical current between
experimentally measured discharge curves at four operating tem-                 adjacent cells and be electrochemically inert at the same time to prevent
peratures. The model was then scaled for a stack by adjusting the               any side reactions with the electrode materials on both sides. In terms of
electrode active area. This scaling approach was derived based on               mechanical properties, the BP must be ultrathin and lightweight to
the experimental work of Ito et al.,11 in which they scaled a                   minimize the stack overall volume and weight. The BP must also have a
pelletised cell to a practical size. The surface area is chosen based           high mechanical strength to maintain the integrity of the cell under
on a commercial Li-ion polymer battery (EiG C020).16 Through the                extreme operating conditions such as overcharge, overdischarge or high
dimensionless governing equations, we show in Appendix A that                   operating temperatures.18 Examples of BP materials include aluminum
scaling the electrode active surface area only affects the current              foils,19,21 modified titanium foils,23 carbon composites,18 copper/
density. The system of governing equations was non-dimensiona-                  aluminum bimetallic substrates24 and SUS stainless steels.10,25,26
lised (detailed in Appendix A) to identify the scaling factor and                   In a parallel stack, each unit cell consists of PE and NE materials
assess the influence of scaling the electrode active area on the model           separated by the SEs with CC at both ends of the single unit cell. For
parameters. If the materials, electrode composition and the manu-               a double-coated cell configuration, the PE material is coated to both
facturing process are the same for the small-scale and large-scale              sides of the positive CC.
cells, Kim et al. demonstrated that the model parameters used for                   There are two streams of current flow in a cell operation, given
small-scale cells could be used for large-scale cells.17 Therefore, the         by the migration of Li-ions (the ionic current) and by the transport of
nominal current of the single-layer scaled cell, Icell,scaled, can be           electrical charges (i.e. the electrical current).20 In the bipolar stack,
determined from                                                                 the electrical current of unit cells flows perpendicular through the
                                                                                BP. In the parallel stack, the ionic current flows perpendicular from
                     Icell,scaled = i cell,ref ´ A ref ,                [4]     the NE to the PE. In contrast, the electrical current of all cells flows
                                                                                perpendicular and in-plane along the CC to the external tabs.
in which icell,ref is the reference current density of the experimental
cell and Aref is the surface area of our reference cell.                           Stack model.— One-dimensional bipolar stack model.—In a one-
                                                                                dimensional bipolar stack model, each single-layer scaled cell is
   Working principles of bipolar and parallel stacks.—A stack                   stacked in series to achieve a bipolar configuration, as shown by
comprises multiple single-layer cells. Generally, there are two types           Fig. 3a. The governing equation to describe the relationship between
of stacks: bipolar and parallel,10,18–20 as shown in Fig. 2.                    the stacked and unit cell voltage is the Kirchhoff’s voltage law.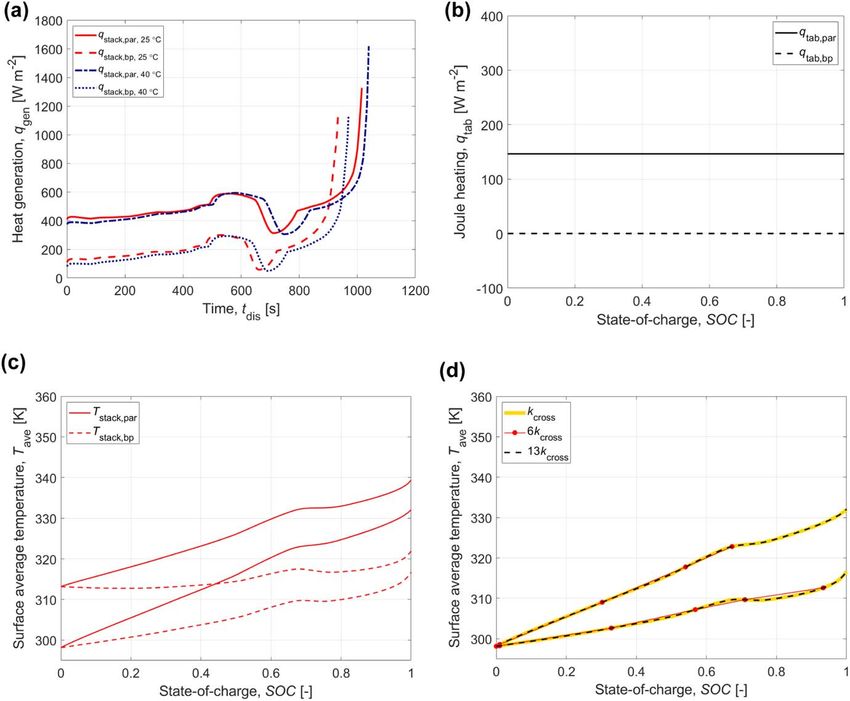
Journal of The Electrochemical Society, 2021 167 160555

Figure 2. Configurations of the bipolar (top) and parallel stack (bottom) inside the pouch. In a bipolar stack, the electrical current flows from one unit cell to the
adjacent unit cell through the BP, whereas in a parallel stack, the electrical current flows in-plane along the CC to the external tabs. The one-dimensional bipolar
stack model is constructed by stacking the SE and PE domains (solid lines). The NE domain (dashed line) is represented by an interfacial point between the NE
and the SE. The one-dimensional parallel stack model consists of the double-coated cells arranged in parallel. The filled circle symbols represent the BP in the
bipolar stack model and CC in the parallel stack model, whereas the empty circles denote the electrode-electrolyte interfaces.

Assuming a negligible cell-to-cell variation in a perfect stack, the
total stacked voltage can be calculated by multiplying the number of
cells with the individual cell voltage. Therefore, the open-circuit
voltage of the bipolar stack, Ustack,BP,OCV can be calculated by

                  Ustack,BP,OCV = NBP (fpos - fneg),                       [5]

where NBP is the number of unit cells in a bipolar stack. Because the
single-layer cells are connected in series and form part of the same circuit
loop, the same current must flow through each unit cell, as given by
                             istack,BP = i cell,                           [6]

where icell is the current density of each unit cell.
   The electrochemical behavior of the stack was considered as a
one-dimensional model in the z-direction (refer to Fig. 2 for the
definition of the coordinates). As shown by Yazdanpour et al.,20 the
in-plane current density i = (ix, iy, 0) corresponds to the transport of
electrons in the active materials and CC, whereas the through-plane
current density, i = (0, 0, iz) denotes the transport of Li-ions. In this            Figure 3. (a) Representative bipolar stack circuit diagram, where the ohmic
work, the ohmic losses due to electronic transport are lumped                        resistances of the bipolar stack include a positive tab resistance (Rpos,tab), a
together and subtracted from the final stack voltage. The stack                       negative tab resistance (Rneg,tab), ohmic resistances due to BP, RBP and ohmic
voltage, VBP under load can be calculated by                                         resistances due to electronic transport across the electrodes (RAM). (b) The
                                                                                     parallel stack circuit diagram includes ohmic resistances from positive and
                                                                                     negative tab resistances (Rpos,tab and Rneg,tab), ohmic resistances due to the
            VBP = NBP (fpos - fneg) - istack,BPR stack,BP ,                [7]       electronic transport in the CC, RCC and electrodes, RAM.

where Rstack,BP is the sum of all ohmic resistances in a bipolar stack:                 As shown by Figs. 2 and 4a, the current flows normal to the stack
                                                                                     surface area in a bipolar stack and is distributed uniformly over
                   R stack,BP = NBP RBP + NBP RAM                                    them. Therefore, the ohmic resistance across the BP, RBP can be
                                + Rtab,pos + Rtab,neg.                     [8]       calculated as follows: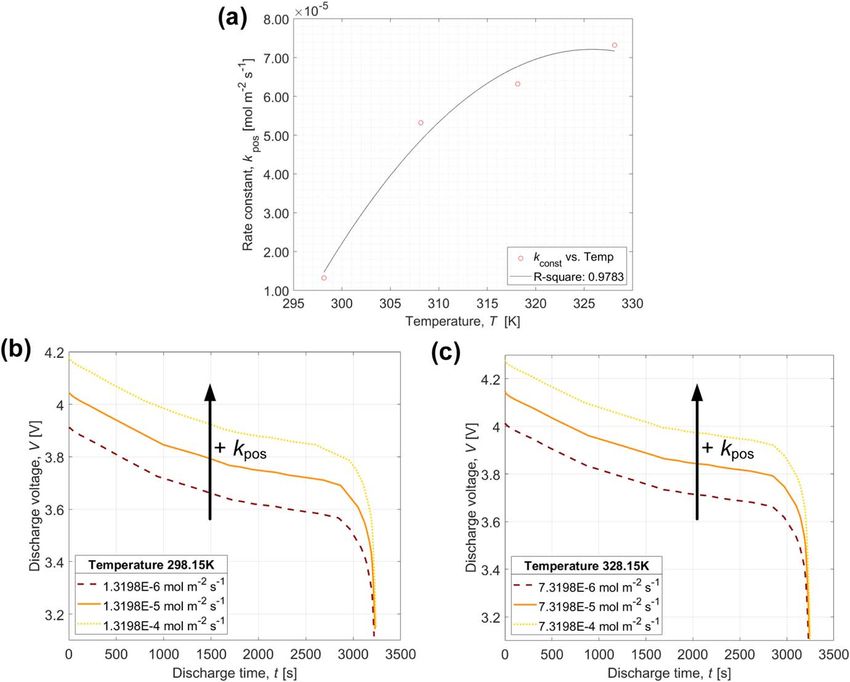
Journal of The Electrochemical Society, 2021 167 160555

                                                                                  first and last unit cells of the bipolar stack have positive and negative
                                                                                  tabs. Because the tab resistance is calculated based on the current
                                                                                  flow in the y-direction, but the voltage loss due to tab ohmic
                                                                                  resistances is subtracted from the one-dimensional stack model in
                                                                                  the z-direction, Eqs. 11 and 12 are approximated 1D in-plane
                                                                                  resistances. However, as shown by the computed 2D effective
                                                                                  resistance compared to the 1D in-plane resistance in Appendix B,
                                                                                  the difference between the 2D effective resistance and the 1D in-
                                                                                  plane resistance can be considered negligible.

                                                                                      One-dimensional parallel stack model.—Figure 3b shows the
                                                                                  representative circuit diagram of the parallel stacking configuration
                                                                                  of the single-layer cells. As the cells are arranged in parallel, all unit
                                                                                  cells have the same voltage:
Figure 4. (a) The electrical current flows perpendicular to the stack surface
area in a bipolar stack. (b) In a parallel stack, the electrical current flows                        Ustack,Par,OCV = (fpos - fneg).                      [13]
perpendicular to the CC and then in-plane along the CC to the external tabs
or vice versa. In both stack configurations, the cross-sectional area, Ai is
defined by the surface normal to the current flow (yellow coloured area),              The current of the parallel stack can be described by the
whereas the length, Li is defined by the dimension along the current flow.          Kirchhoff’s current law. For an ideal stack with a negligible cell-
                                                                                  to-cell variation, the relationship between cell and stack current can
                                                                                  be described as follow:
                                                                                                                         istack,Par
                                      d BP                                                                    i cell =              ,                     [14]
                           RBP    =         ,                             [9]                                             2NPar
                                    sBP ABP
                                                                                  where NPar is the number of unit cells stacked in parallel. The factor
in which dBP is the thickness of the BP, σBP is the electronic                    2 indicates the double-coated configuration in each unit cell and is
conductivity of the BP and ABP is the stack surface area. Because the             used to reproduce the experimental parallel stack measurements
current is flowing only in one direction through the BP in the middle              from Ito et al.11 In real-world applications, a bipolar stack cannot be
of the stack, the calculation of the bipolar stack resistance can be              coated on both sides, whereas a double-coated configuration is often
simplified into a one-dimensional resistance, given by Eq. 9.                      used for a parallel stack to reduce the gravimetric and volumetric
However, at the first and last unit cell of the bipolar stack, the                 contributions from inactive cell components.
current is flowing perpendicular and in-plane to the external tabs or                 Unlike a bipolar stack, each double-coated unit cell in a parallel
vice versa. Due to the negligible impacts of the total resistance from            stack has positive and negative tabs. While the cell voltage under
the first and last CC, we simplify the current flow behavior in these               load is identical, the sum of voltage loss due to positive and negative
two CC into a one-dimensional electronic transport like all the other             tabs must be subtracted using the stack current:
BP.
   In Ref. 13 the ohmic resistance across both non-porous PE and                         Vstack,Par = Vcell - istack,ParRtab,neg - istack,ParRtab,pos ,   [15]
NE was not considered in the single-layer model due to the relatively
small size of the cell and a limited magnitude of applicable current              in which Rtab,neg and Rtab,pos are positive and negative tab resistance
densities. As a result, the voltage loss due to electronic transport in           given by Eqs. 11 and 12. Then, the cell voltage, Vcell can be
both electrodes was found to be negligible. However, as the cell is               calculated as follows:
scaled and stacked to model a large-format solid-state bipolar and
                                                                                                    Vcell = (fpos - fneg) - i cell R cell ,               [16]
parallel stack, the impacts of electronic transport resistance across
both electrodes cannot be neglected. Hence, the ohmic resistance
across the PE and NE, RAM can be considered in the large-format                   where Rcell is the sum of ohmic resistances in a unit cell:
stack models through                                                                            R cell = RAM + R CC,pos,eff + R CC,neg,eff .              [17]

                               d neg               d pos                              Due to the characteristics of a two-dimensional current flow in
                   RAM =                 +                     ,         [10]     the CC of the parallel stack (see Figs. 4b and B·3a in the Appendix),
                            sneg A neg       spos A pos
                                                                                  a separate two-dimensional electrical model is solved to calculate the
in which dneg is the thickness of the NE, σneg is the electronic                  effective resistance of the positive and negative CC (RCC,pos,eff and
conductivity of metallic Li, dpos is the thickness of the PE and σpos is          RCC,neg,eff). In this 2D electrical model, we assume the potential drop
the electronic conductivity of LiCoO2. The subscript AM represents                in the CC to be small such that the current distribution across the CC
the active materials in both electrodes.                                          remains uniform. The CC thickness in the middle of the stack is also
    Based on the direction of current flow into and out of the tabs, the           halved to account for the double-coated configuration. Table B·III in
ohmic resistance of the positive tab (Rtab,pos) and negative tab                  the Appendix summarises the effective resistance computed using
(Rtab,neg) can be calculated as follows:                                          the 2D electrical model compared to the in-plane resistance
                                                                                  calculated based on the resistivity and geometrical characteristics
                                         L tab,y                                  of the CC. The 1D in-plane resistance is found to be comparable to
                     Rtab,pos =                            ,             [11]     the 2D effective resistance, where the current boundary conditions
                                  stab,posAtab,cross
                                                                                  are imposed on both sides of the CC.
                                         L tab,y                                     Resistivity of electrode materials and current collectors.—In
                     Rtab,neg =                            ,             [12]
                                  stab,negAtab,cross                              principle, resistivity is a fundamental intrinsic material property,
                                                                                  measuring the strength of a material in opposing the flow of electric
where Ltab,y is the height of the tabs; σtab,pos and σtab,pos are the             current with a uniform cross-sectional area. For a given material
electronic conductivities of the positive and negative tabs; Atab,cross is        with an electronic conductivity, σi, the resistivity of the material, ρi
the cross-sectional area of the tab. It should be noted that only the             can be represented by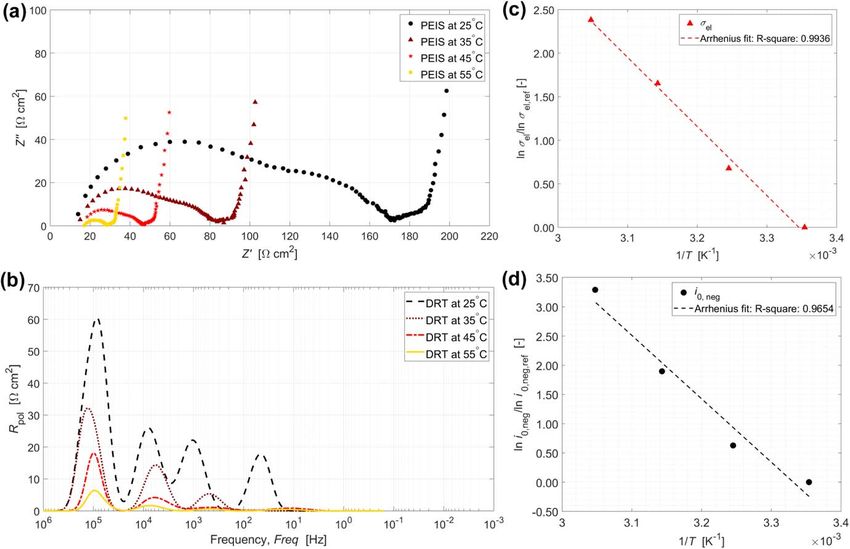
Journal of The Electrochemical Society, 2021 167 160555
conduction without interfacial thermal resistance in each of the
1 coplanar layers, which is only exact if the through-thickness is
ri = . [18] uniform.
si
For a parallel stack with the same layer-to-layer surface area
Alternatively, the resistivity of a material can also be determined across the stack, the effective thermal conductivity is given by20
from
1
Ri Ai k eff,Par = (d CC,posk CC,pos + d CC,negk CC,neg
ri = , [19] d cell,Par
Li
+ 2d pos k pos + 2d neg k neg + 2d elec k elec), [22]
where Ri is the ohmic resistance of the material, Ai is the cross-
sectional area and Li is the length of the material. By rearranging where dcell,Par is the thickness of the cell (dcell,Par =
Eq. 19, the ohmic resistance of different cell components i in the dCC,pos + dCC,neg + 2dpos + 2dneg + 2delec). dCC,pos and kCC,pos are
bipolar and parallel stack model can be estimated. While resistivity the thickness and thermal conductivity of the positive CC; dCC,neg
is a fundamental intrinsic material property, the definition of the and kCC,neg are the thickness and thermal conductivity of the
surface area, Ai and length, Li depend on the direction of the current negative CC; dpos and kpos are the thickness and thermal conductivity
flow, as shown in Fig. 4. of the PE, dneg and kneg are the thickness and thermal conductivity of
Besides the stack geometrical characteristics, the impacts of the NE; delec and kelec are the thickness and thermal conductivity of
current flow on the ohmic resistance of BP and CC are also the SE.
considered through the parameter—electronic conductivity. While To date, only Xu et al.33 have measured the cross-plane thermal
metallic conductors such as aluminum and Li have an isotropic conductivity of the LiPON SE. In conventional liquid-based Li-ion
electronic conductivity, the effects of anisotropy can become batteries, Maleki et al. showed that the in-plane thermal conductivity
dominant for materials such as carbon composite. Depending on can be larger than the cross-plane thermal conductivity by a factor
the matrix and fiber alignments in a carbon composite, the through- between 6–13.34 Therefore, a parametric study was performed to
plane electronic conductivity of carbon composites can be lower analyze the effects of using different SEs thermal conductivities on
than the in-plane electronic conductivity by several orders of the surface temperature of both stacks (see Fig. B·4d in
magnitude.27–29 A parametric study was performed to assess the Appendix B). Due to dominant thermal conductivities from other
effects of different electronic conductivities of the carbon fiber BP cell components, the effects of using different SEs thermal con-
on the gravimetric energy and power densities. ductivities on the stack average surface temperature were found to be
negligible.
Two-dimensional thermal model.— Energy balance.—Chen Similarly, the effective in-plane thermal conductivity of a bipolar
et al.30 have presented a detailed dimensional analysis of the stack can be estimated by
conventional Li-ion thermal stack models by comparing the model
1
accuracy and computational efficiency of the one-dimensional, two- k eff,BP = (d BP k BP + d pos k pos
dimensional and three-dimensional thermal models. The three- d cell,BP
dimensional model is found to be most accurate, but the computa- + d neg k neg + d elec k elec), [23]
tional time is 3000–11000 times longer than the one-dimensional
thermal model. They have shown that an in-plane two-dimensional in which dcell,BP is the thickness of the bipolar unit cell
model can capture the heat transfer behavior of the stack with good (dcell,BP = dpos + delec + dneg + dBP); dBP and kBP are the thickness
accuracy and efficiency. Based on this analysis, we have used a two- and thermal conductivity of the BP.
dimensional thermal model of the bipolar and parallel stacks, in The density, ρeff, and specific heat capacity, Cp,eff, of the stacks
which the heat generation is calculated from the one-dimensional can be estimated as:30
electrochemical model. The heat transfer in the stack can be
å i=cell1 vi ri Cp,i
N
described by the following energy balance:31
reff Cp,eff = , [24]
vcell
¶T ¶ ⎛ ¶T ⎞ ¶ ⎛ ¶T ⎞
reff Cp,eff = ⎜k x ⎟ + ⎜k y ⎟ + Q
t ¶ x ⎝ ¶ x ⎠ ¶ y ⎝ ¶y ⎠ gen,tot
where ρi and Cp,i are the density and specific heat capacity of each
heat generation component layer of the cell. Mei et al.35 had calculated the effective
thermal energy storage in - plane heat conduction
specific heat capacity of the cell by defining the volume average of a
- -
Q
conv
Qrad , mass-based property. If the effective density and specific heat
convective heat dissipation radiative heat dissipation capacity from Eq. 24 need to be calculated separately, a mass
[20] average instead of a volume average should be used, as shown by
å i=cell1 m i Cp,i
N
where ρeff is the effective density of the stack, Cp,eff is the effective
specific heat capacity of the stack at constant pressure, T is the Cp,eff = , [25]
m cell
temperature, kx and ky are the effective thermal conductivities in the
x and y directions respectively. Qgen,tot is the heat generation; Qconv where mi is the mass of each cell component and mcell is the total
represents the heat dissipation by natural surface air convection and mass of the cell.
Qrad denotes the heat dissipation by radiation. The effective in-plane
thermal conductivity (keff = kx = ky) can be calculated as32 Calculation of heat generations.—Generally, the heat generation
in a battery, Qgen,tot can occur irreversibly (Qirrev) and reversibly
å i=cell1 vi k i
N (Qrev):
k eff = , [21]
vcell Qgen,tot = Qirrev + Qrev. [26]
where Ncell is the number of cell components in each unit cell, vi/vcell In an all-solid-state Li-metal stack, the irreversible heat genera-
is the volume fraction and ki is the thermal conductivity of each tion, Qirrev can be attributed to losses due to the ionic transport in the
component. Equation 21 is derived assuming an ideal parallel SE (Qohm), reaction current at the electrolyte-electrode interface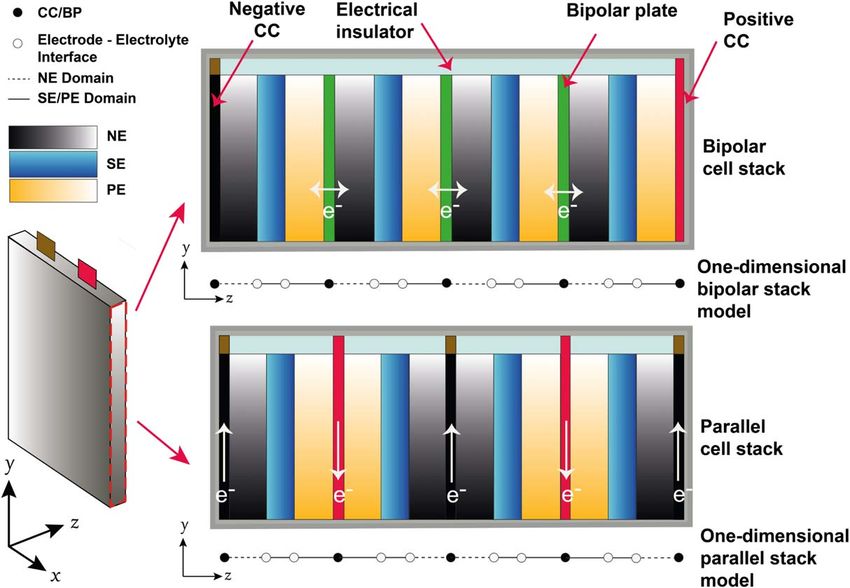
Journal of The Electrochemical Society, 2021 167 160555
(Qneg/pos), solid Li transport in the non-porous bulk PE (Qdiff) and whereas the physical parameters in the electrochemical model
electronic transport in the active materials and CC (QCC): were modified to include the temperature dependence, therefore
coupling the electrochemical model to the thermal model two-ways.
Qirrev,stack,BP Par = Istack,BP Par (hohm + hneg + h pos + hdiff ) We use the notation T in our one-dimensional electrochemical
+ 2
Istack,BP model to represent the surface-averaged temperature evaluated from
Par R ohm,BP Par , [27]
the two-dimensional model:
where ηohm is the ohmic overpotential in the SE; ηneg and ηpos are the 1
charge transfer overpotentials due to interfacial reaction kinetics at T =
A
∬ TdA. [32]
the respective interface; ηdiff is the solid diffusion overpotential. The
expressions to calculate these overpotentials can be found in The system of DAEs were solved in COMSOL Multiphysics ® V5.4.
Appendix A. The total thickness of both stacks is calculated from A summary of the model parameters is given in Table I.
the sum of the stack thickness, the estimated volume change due to
Li metal and the thickness of the pouch (see Table B·II in
Appendix B). The tab thickness is estimated based on literature Experimental Parameterisation
values from Zhao et al.36 and Hales et al.37 A similar parameterisation procedure and the testing rig is used as in
For a bipolar stack, Rohm,BP is the sum of ohmic resistances of the Offer et al.13 The temperature was controlled with the Peltier element
active materials and BP in a bipolar stack (Rohm,BP = RAM + RBP). and measured with the thermocouples type K. The corresponding
On the other hand, Rohm,Par is the sum of ohmic resistances of the voltage and impedance profiles of the STMicroelectronic cell were
active materials and CC in a parallel stack (Rohm,Par = RAM + RCC). recorded with Gamry Interface 1000. Potentiostatic Electrochemical
The irreversible heat dissipation due to Joule heating at both tabs, Impedance Spectroscopy (PEIS) measurements at the open-circuit
Qirrev,tab can be calculated by voltage of each pulse were taken at 25 °C, 35 °C, 45 °C and 55 °C to
extract two of the temperature-dependent model parameters: the ionic
Qirrev,tab,BP Par = Istack,BP
2
Par Rtab,BP Par , [28] conductivity in the SE and the exchange current densities at the NE and
SE interface. The estimation of the temperature-dependent diffusion
in which Rtab,BP/Par is the ohmic resistance of both tabs in the bipolar coefficient in the non-porous PE is first discussed, followed by the
and parallel stack. measurement of the entropic heat coefficient.
The reversible heat generation, Qrev occurs due to structural Figure 5a shows the PEIS measurements at the four surface
change of the PE and can be calculated as follows:38 controlled temperatures. The ionic conductivity and charge transfer at
both interfaces change marginally with SOC within the voltage window
Istack,BP Par T DS of 3.0 V and 4.2 V under isothermal operating conditions.13 However, as
Qrev,stack,BP Par = , [29]
nF the temperatures increase, the electrolyte resistance decreases from
72.56 Ω cm2 to 6.71 Ω cm2. The charge transfer resistances at the NE
where n is the number of electrons and ΔS is the entropy of the and PE also decrease from 18.27 Ω cm2 and 52.42 Ω cm2 to 0.75 Ω cm2
stack, which can be estimated experimentally from the entropic heat and 3 Ω cm2, respectively.
coefficient. The Distribution Function of Relaxation Times (DRT) analysis is
used to distinguish the various contributions to the voltage loss at
Thermal boundary conditions.—The convective heat dissipation different operating temperatures.43 The DRT analysis reveals four
in the two-dimensional thermal model can be defined as32 polarization peaks at 25 °C and three peaks at 35 °C, at 45 °C and at
-1
55 °C. A small shift in the DRT peaks is observed with increasing
⎡1 d pouch ⎤ temperatures. Due to the different PEIS signals observed in this
qconv = ⎢ + ⎥ (Tamb - T ), [30] work compared to the PEIS measured in Refs. 13, 39, 44 a log-
⎣h k pouch ⎦
normal statistical analysis was used to quantify this variability by
in which h is the heat transfer coefficient (h = 5 W m−2 K−1), dpouch measuring the initial cell impedance of 23 cells after the formation
and kpouch are the thickness and thermal conductivity of the pouch. The cycling (three cycles of constant-current charge and discharge) at
initial condition is given by the operating temperature and the ambient ambient temperatures (see Appendix A).
temperature is defined as 20 °C. By multiplying with the stack surface Two sets of parameters were estimated from the PEIS measure-
area, qconv can be converted to Qconv (Qconv = qconv × Aref). Both stacks ments: the ionic conductivity of the SE, σelec and the exchange
were cooled by natural air convection across the top surface of the current density, i0,neg. The temperature-dependence of these para-
stacks. meters can be described by Arrhenius expressions:45
The parallel stack in the works of Ito et al.11 was vacuum-sealed ⎡ Ea,elec ⎛ 1 1 ⎞⎤
inside a laminated aluminum pouch. We consider the same material selec = selec,ref exp ⎢- ⎜ - ⎟ ⎥, [33]
for both bipolar and parallel pouches in this work. Considering the ⎣ Rgas ⎝ T Tref ⎠ ⎦
surface emissivity of the laminated aluminum pouch, the radiative
heat dissipation from the top and bottom of each pouch, Qrad can be ⎡ Ea,i0 ⎛ 1
estimated by30 1 ⎞⎤
i 0,neg = i 0,neg,ref exp ⎢- ⎜ - ⎟ ⎥, [34]
⎣ Rgas ⎝ T Tref ⎠ ⎦
Qrad = Al,topsBoltz (Tamb,top
4
- T 4)
where σelec,ref and i0,neg,ref are the ionic conductivity and exchange
+ Al,downsBoltz (Tamb,down
4
- T 4), [31]
current density measured at the reference temperature, Ea is the
activation energy and Tref is the reference temperature defined as
where ϵAl is the surface emissivity of aluminum (ϵAl,top = ϵAl,down = 298.15 K. Figures 5c and 5d show a good fit.
0.09) and σBoltz is the Stefan-Boltzmann’s constant (σBoltz = 5.67 × The temperature-dependent OCP can be described by
10−8 W m−2 K−4). Because the internal architecture of the stack
is opaque, the radiative heat dissipation inside the stack is ¶U (xLi)
negligible.30 Ucell (T ) = Ucell,ref + (T - Tref ) , [35]
¶T
Electrochemical-thermal coupling.—The heat generation in the where Ucell,ref is the OCP at 25 °C and ∂U(xLi)/∂T is the experimen-
thermal model was calculated from the electrochemical model, tally measured entropic heat coefficient.
Table I. Summary of stack geometrical and thermal parameters.

                                                                                                                                                                Journal of The Electrochemical Society, 2021 167 160555
Parameters                                             Positive electrode               Solid electrolyte   Negative electrode/Current collector   References
                                                           (LiCoO2)                         (LiPON)                         (Li)

Thickness, d                                                  6 μm                             2 μm                         10 μm                    7, 39
Surface area, Aref                                         0.0244 m2                        0.0244 m2                     0.0244 m2                    20
Density, ρ                                               3121 kg m−3                      2680 kg m−3                    534 kg m−3                  32–34
Electronic conductivity, σ                                3100 S m−1                            —                     1.1 × 10⁷ S m−1                40, 41
Thermal conductivity, k                           53.6 W m−1 K−1 (in-plane)              1.4 W m−1 K−1               81.8 W m−1 K−1                32, 33, 42
Specific heat capacity, Cp                               602 J kg−1 K−1                  1400 J kg−1 K−1              3582 J kg−1 K−1                 32–34
Parameters                                  Aluminium bipolar plate/Current collector    Aluminium tab                   Copper tab                References
Thickness, d                                                 10 μm                            10 μm                         10 μm                      7
Surface area, Aref                                         0.0244 m2                       7 × 10⁻⁴ m2                  7 × 10⁻⁴ m2                  17, 20
Tab distance from the edge, dedge                              —                           3 × 10⁻³ m                   3 × 10⁻³ m                     17
Tab thickness, dtab                                            —                             0.2 mm                        0.2 mm                    36, 37
Density, ρ                                               2700 kg m−3                      2700 kg m−3                   8960 kg m−3                    32
Electronic conductivity, σ                             3.78 × 10⁷ S m−1                 3.78 × 10⁷ S m−1             5.96 × 10⁷ S m−1                20, 41
Thermal conductivity, k                                 238 W m−1 K−1                    238 W m−1 K−1                398 W m−1 K−1                  20, 32
Specific heat capacity, Cp                               897 J kg−1 K−1                   897 J kg−1 K−1               385 J kg−1 K−1                   32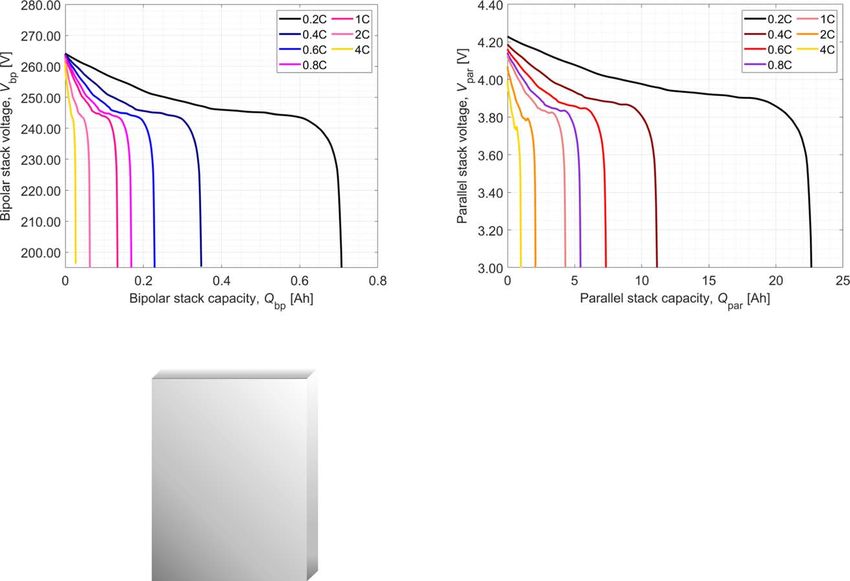
Journal of The Electrochemical Society, 2021 167 160555
Figure 5. Experimentally measured cell impedance at four surface controlled temperatures: (a) An increase in the temperature from 25 °C to 55 °C reduces the
electrolyte resistance by a factor of 10, the charge transfer resistance at the Li∣LiPON interface by a factor of 24 and the charge transfer resistance at
the LiPON∣LiCoO2interface by a factor of 17. (b) Corresponding DRT profiles. (c) The ionic conductivity estimated based on PEIS measurements obey the
Arrhenius relationship (R2 = 0.9936). (d) The temperature-dependent exchange current density at the Li∣LiPON interface can also be described with the
Arrhenius relation (R2 = 0.9654).
Measurement of temperature-dependent diffusion coefficients The entropy, ΔS is proportional to the entropic heat coefficient,
in the positive electrode.—Concentration-dependent diffusion coef- ∂U(xLi)/∂T as follows47:
ficients at 25 °C, 35 °C, 45 °C and 55 °C were obtained from the
GITT data, following the procedures in Ref. 13. Figure 6a shows the ⎡ ¶U (xLi) ⎤
concentration and temperature-dependent diffusion coefficients. For DS = ⎢nF ⎥ , [37]
⎣ ¶T ⎦SOC,p
high SOCs, temperature does not affect the diffusion coefficients
significantly. At low SOCs, the Li concentration in the PE increases,
and an increase in the diffusion coefficient of a factor of 50 can be where n is the number of electrons and F is the Faraday’s constant
observed when the operating temperatures increases from 25 °C to (F = 96, 485 C mol−1). ΔS is determined with the potentiometric
55 °C. The increase in the operating temperature reduces the mass method by measuring the change of OCP with respect to temperature
transport barrier in the PE for low SOCs. The concentration and at a fixed SOC. This method is preferred to the calorimetric method
temperature-dependent diffusion coefficient can be approximated by for thermally thin cell.46 Zhang et al. have proposed a discontinuous
measurement with a shortened voltage relaxation time to approx-
D Li = D Li,25 C (xLi) imate the entropic heat coefficient ( ≈ ∂U(xLi)/∂T). Nevertheless, a
⎡ Ea,diff ⎛ 1 relative error of 2% compared to the full discontinuous measurement
1 ⎞⎤
´ exp ⎢- ⎜ - ⎟ ⎥, [36] method requiring long voltage relaxation was reported with this
⎣ Rgas ⎝ T Tref ⎠ ⎦ method in the temperature range between 20 °C and 30 °C.47 As the
temperature window in this model ranges from 25 °C to 55 °C, the
where Ea,diff is an estimated activation energy (Ea,diff = 20000 J mol−1). full discontinuous measurement of ∂U(xLi)/∂T was used to minimize
The comparison of the approximated function to the experimental this uncertainty.
measurements is given in Appendix A. Thomas et al.46 have developed experimental procedures to
measure the entropic heat coefficient for a temperature range
Measurement of entropy as a function of concentrations.— between 21 °C and 29 °C. These procedures were adapted in this
Entropy is a measure of the Li atoms orderings and phase change in work for a wider temperature range from 25 °C to 55 °C. The cell
the electrodes during charge and discharge.46,47 The insertion of Li was first charged with a constant current of 1 mA to 4.2 V at 25 °C
atoms into the lattice of the PE induces structural change and and then held at the constant voltage of 4.2 V until the current
increases the disorder of atoms on the lattice. The entropy change dropped to 0.1 mA. Then, the cell was rested for 30 min before being
under discharge must be identically opposite (negative in value) discharged with C/10 until 5% of the nominal capacity is removed.
compared to its value under charge.46 A step-like temperature profile of 25 °C, 35 °C, 45 °C and 55 °C was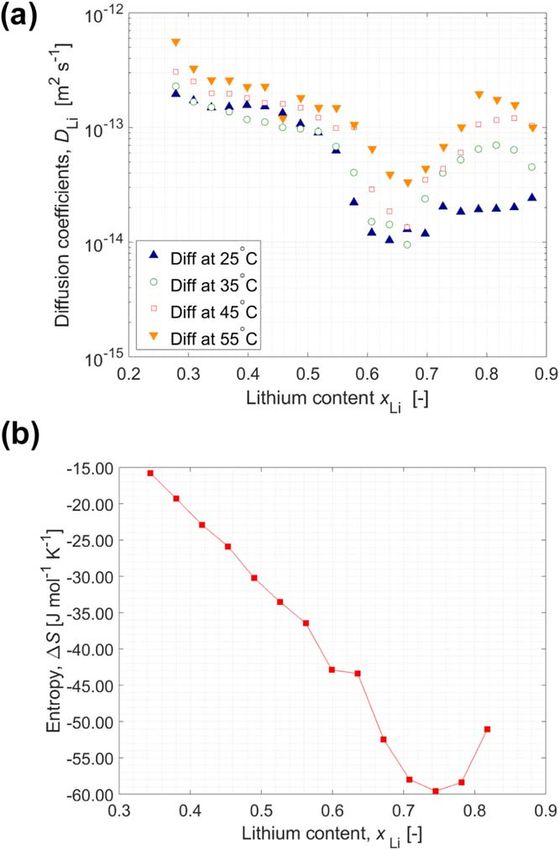
Journal of The Electrochemical Society, 2021 167 160555
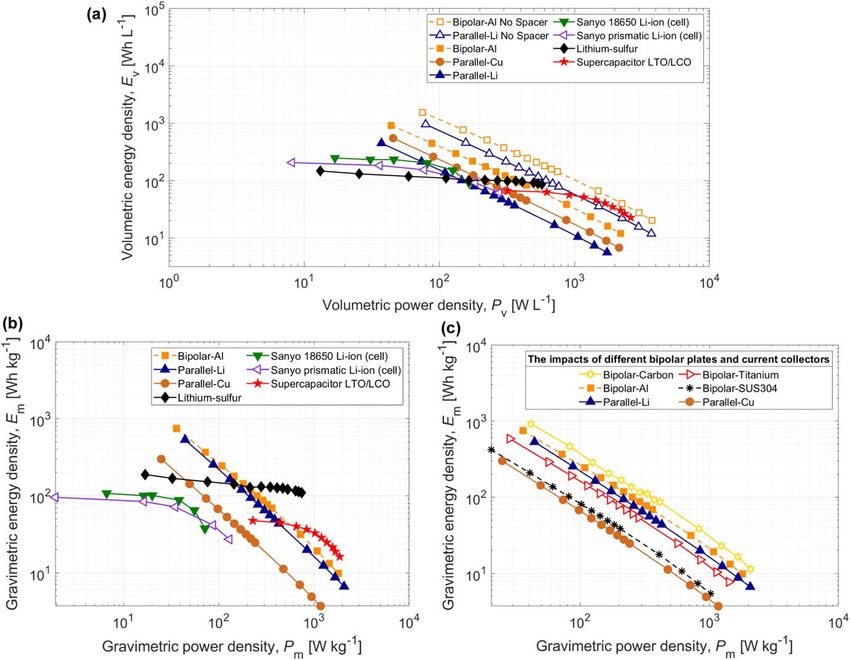
Toyota9 showed that the bipolar stack could output a stack
voltage of 16.26 V (indicated by the red star in Fig. 7b). Four
single-layer scaled cells were stacked in series giving a predicted
maximum output voltage of 16.45 V, close to that achieved by
Toyota on a four-layer all-solid-state stack using LiCoO2as the PE,
sulfide as the SE and graphite as the NE.
Ito et al.11 have developed a parallel stack with the nominal
capacity of approximately 1 Ah by stacking three single-layer
double-coated cells in parallel. The electrochemical cell had a
Li2O-ZrO2 coated LiNi0.8Co0.15Al0.05O2 (NCA) PE, sulfide-based
SE and graphite NE. Figures 7c and 7d compare qualitatively the
model predicted parallel stack profile with their experimental stack
result. The single-cell model in Fig. 7c uses a factor of 1 instead of 2
in Eq. 14 and NPar = 1, whereas the double-coated single-cell model
retains the factor of 2 in Eq. 14. NPar is changed to three for the third
discharge curve to model the three-layers parallel configuration.
Model-Based Stack Design
Bipolar and parallel stack discharge.—EiG C020 is chosen as
the reference in the stack design of this work. The PE of the EiG
C020 cell is 70 μm and the stack excluding the pouch case is
7.074 mm thick.20 In solid-state Li-metal cells, the thickness of a
non-porous PE is limited by the slow diffusion of intercalated Li-
ions, thus indicating a thinner PE would be used.13 Moreover,
instead of graphite, Li is used as the NE. Therefore, the overall
stack thickness assumed for this study is 0.1769 cm. Within the same
stack volume for both bipolar and parallel stacks, the thickness of
each component of the single unit cell was fixed, with values as
given in Table I. Therefore, the stack volume corresponds to 32
double-coated parallel cells or 63 cells in a bipolar configuration.
Figures 8b and 8c show the simulated discharge stack profile for
both bipolar and parallel configurations. As shown by Fig. 8b, the
bipolar stack can achieve a stack voltage up to 265 V with a stack
capacity of 0.7 Ah, whereas the capacity of the parallel stack is
23 Ah, at a C-rate of 0.2 C.
Two common degradation mechanisms associated with the use of
Figure 6. (a) Experimentally measured solid diffusion in the PE at four
Li metal have been observed experimentally: (1) Li creep and (2)
different operating temperatures: The impact of higher operating temperature voids formation at the interface between the NE and the
improves the solid diffusion for low SOCs. (b) Entropy of reaction in the SE.48–51 Due to the low melting point and high homologous
LiCoO2measured between 95% and 25% SOC. temperatures of Li metal between 25 °C and 55 °C, Li exhibits a
strong temperature-dependent creep and volume deformation.48 An
unrestrained Li creep could flow through the pores and grain
applied to the cell, during which the cell was allowed to relax for 3 h
boundaries of the SE to cause an eventual internal short-circuit
before each temperature change. The experimental procedures were
against the PE.49,51 As a result, an external stack pressure is required
repeated to remove an incremental 5% of the cell’s initial capacity
to restrict the internal volume deformation due to Li
until the SOC reached 25%. The overpotential of the cell for SOCs
metal.48–51 Zhang et al.52 have developed an in situ instrument to
smaller than 25% is so dominant such that the OCP of the cell
track the volume change of Li metal electrode during lithiation and
continues to change even after 10 h of relaxation per temperature.
delithiation. They showed that a thickness change up to 23 μm is
Therefore, the entropic heat coefficient was measured for the SOC
observed during cycling, even when the cell was placed under an
window between 95% and 25%. Figure 6b shows the experimental
external pressure of 850 kPa. Li et al.53 proposed the use of
estimated entropy of reaction in the non-porous bulk
polyurethane foam as a spacer (range of thicknessJournal of The Electrochemical Society, 2021 167 160555
Figure 7. (a) Comparison of simulated constant-current discharge profiles of the single-unit cell model to experimental measurements at four different operating
temperatures. (b) Qualitative validation of simulated bipolar stack voltage profile (4 cells) with the maximum experimental stack output voltage from
Toyota.9 Terminal voltage for a 0.1C discharge from the single-cell, double-coated single-cell and 3-cell parallel stack, (c) as predicted by the model and
(d) obtained experimentally from Ito et al.11
uses aluminum as the BP. The calculated stack volume and mass for to the Li volume deformation inside the stack. If Li foil is used as the
different CC and BP materials are summarised in Table II. negative CC, the total thickness change due to Li CC and NEs can
reach up to 2.231 mm. As a result, 53 vol-% of the spacer is required
Volumetric and gravimetric density.—With known mass and to reduce the internal stress and strain, however, because of the
volume of the stacks, the energy and power densities of the stacks density of copper (8.960 g cm−3) compared to Li (0.534 g cm−3), the
can be estimated. Figures 9a and 9b show the simulated Ragone parallel Li stack has higher gravimetric energy and power density
profiles of bipolar and parallel stacks compared to Sanyo 18 650 than the parallel copper stack. If copper foils substitute Li CC, the
Li-ion,54 Sanyo prismatic Li-ion,54 Li-sulfur55 and supercapacitor volume fraction of the spacer can be reduced from 53% to 43%, but
LTO/LCO.56 It should be noted that a typical Ragone profile the mass ratio of the CC increases from 33% to 62%. Figure B·1 in
comparing the power and energy density of different cell chemistries Appendix B illustrates the mass and volume fraction of the parallel
is C-rate dependent. The Ragone plots for bipolar and parallel stacks Li and bipolar aluminum stack.
in this work were simulated with the discharge C-rates from 0.1 C to For an ideal stack without the volume deformation due to Li
5 C. 1C corresponds to 0.15 A for the bipolar stack and 9.6 A for the electrodes and CC, the volumetric power and energy density of
double-coated parallel stack. For a C-rate of 0.1, the volumetric bipolar aluminum stack without a spacer can be 1.71 times higher
energy density can reach up to 447.9 Wh L−1 for the parallel stack than that of the bipolar aluminum stack with a spacer. Similarly, the
using Li as the negative CC (denoted as parallel Li stack) and volumetric power and energy density of parallel Li stack without a
908 Wh L−1 for the bipolar stack using aluminum BP (denoted as a spacer can be higher than the parallel Li stack with a spacer by a
bipolar aluminum stack). For stacks with polyurethane spacers, the factor of 2.13.
bipolar aluminum stack has a higher volumetric energy density than The maximum volumetric energy density of parallel Li stack is
a parallel copper stack and parallel Li stack. As shown in Fig. 8, the 1.81 higher than the maximum of Sanyo 18 650 Li-ion cylindrical
bipolar stack is a relatively high-power cell with a discharge stack cell, 3.05 times higher than the maximum of Li-sulfur reported by
voltage of up to 265 V. As a result, the volumetric energy density of Mikhaylik,55 6.72 times higher than the maximum of LTO/LCO
the bipolar aluminum stack is approximately two times higher than supercapacitor reported by DuPasquier et al.56 Likewise, a factor of
that of the parallel copper stack. The parallel copper stack has higher 3.68, 6.18 and 13.61 can be obtained with the bipolar aluminum
volumetric energy and power density than the parallel Li stack due stack. In a parallel stack using Li as both the NEs and the negativeJournal of The Electrochemical Society, 2021 167 160555
Figure 8. (a) With 63 cells stacked in series, a bipolar stack can achieve up to 265 V with a limited stack capacity of less than 1 Ah. (b) In a parallel stack, a high
capacity of about 23 Ah can be obtained at a C-rate of 0.2 C with a maximum stack voltage of 4.2 V. (c1) The external dimensions of the pouch and tabs. (c2)
Thickness of the pouch includes the stack thickness and the thickness of the polyurethane spacer used to reduce the internal volume deformation due to Li creep.
Table II. Calculated stack mass and volume for different parallel
and bipolar stacks. the stacks were discharged with 1C. The estimated volumetric and
gravimetric power density at 1C for the bipolar aluminum stack are
439.21 W L−1 and 360.64 W kg−1, respectively. Similarly, for the
Parallel stack
parallel Li stack, the corresponding volumetric and gravimetric
Materials Stack mass (g) Stack volume (cm3) power density are 360.8 W L−1 and 428.41 W kg−1. The low energy
density at 1C can be attributed to the limited thickness of the PE in
Lithium foil 86.499 102.708 each unit cell of the stack. For a non-porous PE, the increase in the
Copper foil 153.629 84.208 thickness is limited by the slow diffusion in the electrode.13 As a
Bipolar stack result, the active materials only account for 27% to 33% of the
Carbon fibres 89.047 84.064 parallel and bipolar volume ratio. Also, the volumetric energy
Aluminium foil 102.378 84.064 density was significantly affected by the possible volume deforma-
Titanium foil 130.216 84.064 tion of Li. For an ideal scenario without deformation, the estimated
Stainless steel 181.365 84.064 volumetric energy density for the parallel Li and bipolar aluminum
stack at 1C is 78.17 Wh L−1 and 142.19 Wh L−1 respectively. The
maximum volumetric and gravimetric power density for bipolar
CC, due to the higher specific capacity of Li (3860 mAh g−1) aluminum stack at 5C is 2198 W L−1 and 1805 W kg−1, which is
compared to graphite NE (372 mAh g−1), the maximum gravimetric close to the maximum volumetric and gravimetric power density for
energy density of the parallel Li stack can be 4.95 times higher than LTO/LCO supercapacitor (2608 W L−1, 1860 W kg−1) reported by
Sanyo 18 650 Li-ion cylindrical cell. However, if Li is used as the DuPasquier and co-workers.56 Finally, we note that this is a general
NE and copper is used as the CC, this comparative factor reduces to electrochemical-thermal model that does not consider the impact of
2.79. On the other hand, the maximum gravimetric energy density of any stack failure such as internal short-circuit due to the propagation
the bipolar aluminum stack can be 6.93 times higher than Sanyo of Li filaments.
18 650 Li-ion cylindrical cell.
When the discharge C-rate increases, the energy density de- The effects of current collectors.—The materials of the CC have
creases but the power density increases. Only 83.39 Wh L−1 and a significant impact on the gravimetric power and energy density of
68.48 Wh kg−1 can be achieved with the bipolar aluminum stack and the stack. Four different materials are investigated in this work as
36.78 Wh L−1 and 43.67 Wh kg−1 with the parallel Li stack when potential BP for large-format bipolar solid-state Li-metal stacks,Journal of The Electrochemical Society, 2021 167 160555
Figure 9. (a) Comparison of simulated volumetric Ragone profiles of bipolar and parallel stack with aluminum BP (orange square), copper foils (brown circle)
and lithium foils (blue triangle) and without polyurethane spacer to Sanyo 18 650 lithium-ion (cell),54 Sanyo prismatic lithium-ion (cell),54 lithium-sulfur55 and
supercapacitor LTO/LCO.56 (b) Simulated gravimetric Ragone profiles of bipolar and parallel stacks compared to literature values. (c) Comparison of the
gravimetric energy and power density of bipolar and parallel stacks made up of different types of CC: carbon composite, aluminum foils, lithium foils, titanium
foils, SUS304 stainless steel foils and copper foils.
which include aluminum foil, titanium foil, carbon composite and gravimetric power density of the bipolar titanium and SUS stainless steel
SUS stainless steel. As for large-format parallel solid-state stacks, stack lag by a factor of 1.27 and 1.77 respectively compared to the
copper and Li foils as negative CC are compared in this study. bipolar aluminum stack. Hence, on the basis of gravimetric power and
Liu et al.19 have demonstrated that aluminum foil is stable as a energy density, the carbon composite and aluminum foil are more
BP material for sodium-ion cells. Aluminium foil is shown to exhibit suitable than titanium and stainless steel as the BP materials.
a negligible parasitic current from 0 V to 5 V, while copper foil While metallic conductors such as aluminum and Li have a rather
shows a sharp rise in current density from 3.6 V onwards, due to isotropic electronic conductivity, the through-plane electronic con-
copper oxidation at high potentials. They also demonstrated that ductivity of a carbon composite can be several orders of magnitude
there is no alloying reaction between aluminum foil and the metallic lower than the in-plane electronic conductivity. As shown by Fig. 2,
sodium. In a separate study led by Fraunhofer IKTS, Wolter the electrical current flows from one unit cell to the next unit cell
et al.21 used the aluminum foil as the BP in a Li-based bipolar stack through the BP. Figure B·2 in the Appendix shows the simulated
and showed that a stack voltage up to 9 V can be achieved with four effects of through-plane electronic conductivity of carbon composite
unit cells. LaFollette and Utah18 proposed a composite of long on the gravimetric energy and power densities. Due to a smaller
carbon fibres filled with carbon particles and fluoroelastomer as the magnitude of applied current densities and a larger stack surface area
BP for lead-acid batteries. for the electronic transport in a bipolar stack, the gravimetric energy
Due to the density of the carbon composite (1.82 g cm−3)18 compared and power densities are found to be not sensitive to the variation in
to aluminum foil (2.70 g cm−3),32 a gain factor up to 1.15 and 1.2 in the the through-plane electronic conductivity.
gravimetric power and energy density can be achieved when using a Copper has been used as the negative CC in conventional parallel
conductive carbon composite as the BP material. A modified titanium Li-ion stacks. It is possible to replace the copper foil with Li as the
foil has been proposed by Lang et al.23 as a possible candidate for BP, negative CC when Li is used as the NE in a solid-state stack. In this
though they have investigated the material for a lead-acid battery only. work, we investigate the impact of Li and copper CC on the
The recent patent by Nagaya et al.26 proposed the SUS stainless steel as gravimetric power and energy density of the parallel stack. Here we
the CC for solid-state cells. However, we show in this model that the show that the simulated gravimetric power and energy density of theJournal of The Electrochemical Society, 2021 167 160555
parallel Li stack can be 1.77 times higher than parallel copper stack, gradients and higher temperature rise of the parallel Li stack are
which can be attributed to the higher mass ratio of active materials in caused by Joule heating due to tabs and CC (see Fig. B·4b in
parallel Li stack (53%) compared to parallel copper stack (30%) (see Appendix B).
Fig. B·1 in Appendix B). The parallel stack has a total heat generation of 12.18 kJ whereas
the bipolar stack has a total heat generation of only 4.99 kJ. For the
Stack Temperature Profiles given operating condition, the double-coated parallel stack has a
higher nominal current compared to the single-sided bipolar stack,
Whilst the heat generation in a single-layer cell is insignificant leading to a higher heat generation. As shown by Fig. 2, a parallel
because of the small and thermally thin cell, heat generations from a stack also has external tabs at each unit cell whereas a bipolar stack
multilayer stack can significantly affect the stack performance. has only one positive and one negative tab at the two outermost unit
Figure 10 illustrates the model predicted temperature across the cells. Both stack models neglect the contact resistance between the
surfaces and tabs of the bipolar aluminum and parallel Li stacks tabs and the external connectors, whose value is dependent on the
under the operating conditions of 3C constant-current discharge experimental setup. In reality, the additional contact resistance
from an initial temperature of 298.15 K. In the models, both stacks would aggravate the Joule heating effects.36
were cooled by natural air convection across the top surface of the
stacks (h = 5 W m−2 K−1, air temperature = 20 °C) with additional Advantages and Disadvantages of Bipolar and Parallel Stacks
heat dissipation by radiation from the top and bottom of the stacks.
The temperature gradients are normalised by the average tempera- Although the bipolar stack shows significant advantages over the
ture (Tsurf − Tave) at each time-step for ease in comparing. parallel stack in terms of higher energy densities and lower heat
As shown by Figs. 10a1 and 10b1, the bipolar and parallel stack generations, a bipolar stack has a higher risk of stack failure. The
show a negligible temperature gradient at the beginning of dis- failure of one unit cell such as due to delamination or crack
charge. While the bipolar aluminum stack shows a negligible propagation does not lead to the failure of an entire parallel stack.
temperature gradient throughout discharge, the temperature gradi- On the other hand, failure in one unit cell will certainly cause the
ents around the tabs of the parallel Li stack increase. The predicted failure of the entire bipolar stack. Understanding the failure
temperature distribution is consistent with the experimental IR mechanisms at the microscale will be critical for the successful
imaging result reported by Kim et al., who recorded the highest commercialisation of bipolar solid-state Li-metal batteries for any
temperature gradients near the tabs of a Li-ion polymer medium to large scale application.
battery.17 The parallel stack shows an average temperature rise of Secondly, as the total stack current for a bipolar stack is equal to
33.91 K, whereas the average temperature rise of the bipolar stack is the current of one unit cell, the Couloumbic capacity of the stack
18.51 K. For a large-format parallel Li-ion stack using liquid does not scale with the number of unit cells inside the stack. In this
electrolytes, Yazdanpour et al.20 showed through experimental work, the nominal capacity of 63 cells stacked in series is only
measurements that the temperature increase could achieve up to 0.12 Ah. Therefore, a thick electrode design with an optimised mass
30 K under a high C-rate discharge. The significant temperature transfer is required to improve the stack capacity. Table III
Figure 10. Temperature profile across the surface and tabs of the bipolar and parallel stack at the initial temperature of 298.15 K and 3C constant-current
discharge. The temperature distributions are normalised by the average temperature at each time-step to compare the temperature gradients of two different
stacks: (a1) Two-dimensional temperature profile of the bipolar stack at 100% SOC, where the average surface temperature is 298.2 K, (a2) at 50% SOC, where
the average surface temperature is 305.5 K and (a3) at 0% SOC, where the average surface temperature is 316.6 K. (b1) Surface temperature profile of the
parallel stack at 100% SOC (Tave = 298.2 K), (b2) 50% SOC (Tave = 316.3 K) and (b3) 0%SOC (Tave = 332.1 K).You can also read